“Feedback in energy demand reduction: Examining evidence and exploring opportunities” Edinburgh, July 2016 Page 1
“Feedback in energy demand reduction:
Examining evidence and exploring opportunities”
ECCI, Edinburgh, 4-5 July 2016
FULL PROGRAMME & PAPER ABSTRACTS
o What can energy feedback do to alter energy use in the home or workplace?
o How best can feedback data be disaggregated, portrayed or displayed?
o How can feedback relate to community energy action or gaming approaches?
o What can insights from theory, different disciplines and industry tell us about feedback?
o What is the future of feedback?

“Feedback in energy demand reduction: Examining evidence and exploring opportunities” Edinburgh, July 2016 Page 2

“Feedback in energy demand reduction: Examining evidence and exploring opportunities” Edinburgh, July 2016 Page 3
INTRODUCTION
Energy feedback – the provision of energy-consumption information to energy-users – forms a core component of many initiatives that aspire to shift or reduce energy demand. It features in both domestic and non-domestic settings and takes many forms including utility bills, in-home-displays, phones apps, emails from facilities managers, advice from friends and guidance from consumer and business support centres.
In recent years, the world-wide roll out of smart-metering has led to a surge in feedback-related initiatives with academics, policy-makers and those in industry keen to identify if and how it can promote energy efficiency and reduction. With this in mind, this symposium seeks to bring together all those with an interest in energy-feedback to share the latest empirical evidence in this arena and to use insights gained from this knowledge-sharing exercise to influence and contribute to innovation, future research, and policy and practice in this field.
Over 40 speakers will provide insights from academia, industry and policy and we are pleased to be joined by key note speakers Sarah Darby (University of Oxford), Karen Ehrhardt-Martinez (Navigant) and Tom Hargreaves (University of East Anglia). This booklet includes the symposium programme, a full participant list and extended abstracts for all the presentations made during the two days. We hope that participants at the event, as well as those unable to make it in person, will find the extended abstracts a valuable permanent resource. We hope to also be able to share slides of the presentations made during the event through the TEDDINET website in due course (www.teddinet.org). Many thanks in advance to all those who are speaking and attending the event for sharing your expertise, your experience and your enthusiasm, and for helping to make this a memorable and useful event. We of course also thank the EPSRC for the funding to make this event possible. All the best, Kathryn Buchanan (University of Essex) and Sam Staddon (University of Edinburgh)
“Feedback in energy demand reduction: Examining evidence and exploring opportunities” Edinburgh, July 2016 Page 4
HELP!
If you need any help at all during the symposium, here are the people you can turn to!
Convenors Kathryn Buchanan Sam Staddon
TEDDINET Dan van der Horst Tom Kane
University of Edinburgh Lynda Webb Evan Morgan Elaine Farrow Jonathon Kilgour

“Feedback in energy demand reduction: Examining evidence and exploring opportunities” Edinburgh, July 2016 Page 5
PROGRAMME
Monday 4th July 2016
12.00 – 13.00: Registration & Lunch (Venue: ECCI, Conference Room – see map below)
13.00 – 13.30: Welcome & KEY NOTE 1 Sarah Darby, University of Oxford
13.30 – 14.45: SESSION 1 - ‘Delivering Feedback’
o Vanquishing Energy Vampires: The Failure of Feedback Riccardo Russo & Kathryn Buchanan, University of Essex
o Nat Consumers: Natural Language Feedback Caitlin Bent & Greg Shreeve, Energy Saving Trust
o iBert: Intelligent Support System for Energy Behaviour Change Nataliya Mogles, University of Bath
o Mental Model Interface Design: Putting Users in Control Kirsten Revell & Neville Stanton, University of Southampton
o Investigating Smart Metering in the Home: How Users Comprehend Graphic Representations of Residential Electricity Feedback System Melanie Herrmann, University College London
o Designing Successful Feedback Interfaces for Home Energy Systems: the Aging Population Perspective Bruce Stephen & Mike Danson et al., Heriot Watt University
14.45 – 15.10: Refreshment Break
15.10 – 15.30: KEY NOTE 2 Karen Ehrhardt-Martinez, Navigant
15.30 – 16.30: SESSION 2 – ‘Advanced Feedback: Disaggregation & Visuals’
o Does Disaggregated Electricity Feedback Reduce Electricity Consumption? A Critical Review of the Literature Jack Kelly, Imperial College London
o Utilising Disaggregated Energy Data in Feedback Designs – The IDEAL Project Martin Pullinger & Nigel Goddard et al., University of Edinburgh
o Energy feedback enabled by load disaggregation Lina Stankovic et al., University of Strathclyde
o Visualising Scale-Invariant Comparative Energy Use Gerard Briscoe, Glasgow School of Art
o Lessons on Visual Feedback from the Eviz Project: The Evidence for Using Thermal Images as a Visual Intervention Matthew Fox, University of Plymouth

“Feedback in energy demand reduction: Examining evidence and exploring opportunities” Edinburgh, July 2016 Page 6
16.30 – 17.30: SESSION 3 – ‘Learning Lessons & Limits’
o Exploring Energy Feedback at Community and Household Level through Thermography, Carbon Mapping, Online Platform and Home Energy Visits Rajat Gupta & Laura Barnfield, Oxford Brookes University
o The Effect of Real-Time Context-Aware Feedback on Occupants' Heating Behaviour and Thermal Adaptation Marika Vellei et al., University of Bath
o Quantifying Likely Energy Reduction Opportunities in Family Homes Paula Cosar-Jorda, University of Loughborough
o Between Empowerment and Alienation: How Feedback Technologies Can Harm the Prospects of Successful Energy Transitions Marianne Ryghaug et al., Norwegian University of Science and Technology
o Why Eco-Manager is Not Brilliant? Máté Lőrincz, University of Keele
17.30 – 17.50: KEY NOTE 3 Tom Hargreaves, University of East Anglia
17.50 – 18.00: Close
19.00: Evening meal for all participants & networking opportunities (Venue: South Hall, Pollock Halls)
------------------------------------------------------------------------------------------------------------------------------------
Tuesday 5th July 2016
(Venue: ECCI – see map below)
*** Please note Session 4 consists of two parallel sessions ***
09.00 – 10.20: SESSION 4 A – ‘Beyond Domesticity: Feedback Outside of the Home’ (Conference Room)
o GENIE (Goal-setting and ENergy Information Engagement) in the Workplace Alexa Spence et al., University of Nottingham
o Energy Feedback in the Workplace: Effects of Display Units Caroline Leygue & Alexa Spence, University of Nottingham
o Energy Feedback in Office Workplaces: Approach, Design and Implementation Magdalena Boork , Technical Research Institution of Sweden & C. Katzeff, KTH Royal Institute of Technology
o An Interactive and Diagnostic Energy Use Analysis Interface for Facilities Managers Paul Shabajee et al., University of Bristol
o Household Energy Saving Behaviour and Smart Grid Communication between Utilities and Customers Josephine Munene et al., Clark University, USA
o Challenges of Feedback in Organisations- Can We Foster Partnerships not Projects? Richard Bull, De Montfort University & Kathryn Janda, University of Oxford
“Feedback in energy demand reduction: Examining evidence and exploring opportunities” Edinburgh, July 2016 Page 7
09.00 – 10.20: SESSION 4 B – ‘Linking to Theories & Disciplines’ (The Pod)
o The role of non-numeric feedback in reducing domestic energy consumption: Lessons from Freiburg and Besançon Arian Mahzouni, Royal Institute of Technology, Sweden
o Constructing Policy Feedback On Energy Feedback: When Is Feedback ‘Working’? Rosie Robison & Chris Foulds, Anglia Ruskin University
o Energy feedback: Place, Policy and Mobility Heather Lovell, University of Tasmania, Australia & Gareth Powells, Newcastle University
o Advances in Understanding Energy Consumption Behaviour and the Governance of its Change – Outline of an Integrated Framework Annika Sohre, University of Basel, Switzerland
o Beyond Calorie Counting: What Can Energy Feedback Learn From Weight Loss Programs? Michelle Shipworth, University College London
*** Please note Session 5 consists of two parallel sessions ***
10.30 – 11.15: SESSION 5A – ‘Communities & Collectives’ (Conference Room)
o Householder Engagement with Energy Consumption Feedback: The Role of Community Action and Communications Kevin Burchell et al., University of Westminster [presenting remotely]
o Raising Awareness of Energy Collectively Lara Picollo, Open University
o Social Media and Smart Phones Andy Stephenson et al., National Energy Action
o 7 Families - 7 Solar PV panels, 7 Pre-Payment meters - 1 Estate Nicolette Fox, University of Sussex [not presenting in person]
10.30 – 11.15: SESSION 5B – ‘Gamification of feedback’ (The Pod)
o Reflections on designing an engaging in-home energy dashboard using participatory design and gamification Georgina Wood, University of Birmingham
o Exploring the Challenges and Opportunities of Eco-Feedback Technology for Shifting Electricity Use at Home Nervo Verdezoto, University of Leicester
o Feedback in electricity demand reduction: Examining evidence and exploring opportunities through community-level game mechanics Roberta Castri, University of Applied Sciences and Arts of Southern Switzerland

“Feedback in energy demand reduction: Examining evidence and exploring opportunities” Edinburgh, July 2016 Page 8
11.15 – 11.45: Refreshment Break
11.45 – 13.00: SESSION 6 – ‘Insights from Industry & Policy’
o Energy Efficiency Advice: A Toolkit for Engaging Consumers at Smart Meter Installation Visits Andrew Charlesworth, DECC
o Improving participation in the energy market Dan Walker Nolan, Citizens Advice
o The surge of energy data: What does it mean for EDF Energy employees and householders? Christopher Weeks, EDF/University of Bristol
o Existing commercial business activities: why and how feedback on energy consumption is being delivered to customers Scott Bryant, Delta EE
o Energy-feedback services provided by utilities: Lessons learnt from the Empowering project Stoyan Danov, CIMNE
o Waiting for Data: Market Adaptations to Poor Smart Meter Policies in America Michael Murray, Mission.Data
13.00 – 13.45: Lunch
13.45 – 14.45: SESSION 7 – ‘Finding a Way Forward: Research in the “Real World” ‘
Interactive session hosted by David Shipworth (UCL) with panel discussants Andrew Charlesworth
(DECC), Paolo Bertoldi (European Commission), Daniel White (Behaviouralist), and Simon Anderson
(Green Energy Options)
14.45 – 15.00: Close
“Feedback in energy demand reduction: Examining evidence and exploring opportunities” Edinburgh, July 2016 Page 9
PARTICIPANT LIST
First name Surname Institute/Organisation Email Presentation
Ashely Ahearn National Public Radio, USA [email protected] Simon Anderson Green Energy Options [email protected] Session 7
Nazma Bandali British Gas [email protected]
Alexander Belsham Harris Citizens Advice [email protected] Session 6
Caitlin Bent Energy Saving Trust [email protected] Session 1
Paolo Bertoldi European Commission
Session 7
Sivapriya Bhagavathy Northumbria University [email protected] Magdalena Boork SP Technical Research Institute of Sweden [email protected] Session 4A
Frank Boyle Construction Scotland Innovation Centre [email protected]
Gerard Briscoe Glasgow School of Art [email protected] Session 2
Paul Brown Centrica [email protected] Scott Bryant Delta EE [email protected] Session 6
Kathryn Buchanan University of Essex [email protected] Justin Buck British Gas - Centrica [email protected] Richard Bull DeMontfort University [email protected] Session 4A
Kevin Burchell University of Westminster [email protected] Session 5A
Danielle Butler Salford University [email protected] Roberta Castri SUPSI, Switzerland [email protected] Session 5B
Andrew Charlesworth DECC [email protected] Session 6+7
Paula Cosar-Jorda Loughborough University [email protected] Session 3

“Feedback in energy demand reduction: Examining evidence and exploring opportunities” Edinburgh, July 2016Page 10
Stoyan Danov CIMNE [email protected] Session 6
Mike Danson Heriot Watt university [email protected]
Sarah Darby University of Oxford [email protected] Keynote
Peter Davies Green Running Ltd [email protected]
Karen Ehrhadrt-Martinez Navigant [email protected] Keynote
Elaine Farrow University of Edinburgh [email protected] Michael Fell University College London [email protected] Matthew Fox University of Plymouth [email protected] Session 2
Nicolette Fox University of Sussex [email protected] Session 5A
Kathleen Gaffney Navigant [email protected]
Jesus Garcia
Birmingham City University + Walsall Housing Group [email protected]
Nigel Goddard University of Edinburgh [email protected] Session 2
Rajat Gupta Oxford Brookes University [email protected] Session 3
Tom Hargreaves University of East Anglia [email protected] Keynote
Melanie Herrmann University College London [email protected] Session 1
Tom Kane Loughborough University [email protected]
Jack Kelly Imperial College London [email protected] Session 2
Jonathon Kilgour University of Edinburgh [email protected] Caroline Leygue University of Nottingham [email protected] Session 4A
Richard Lorch Building Research & Information (journal) [email protected] Mate Lorincz University of Keele [email protected] Session 3
Heather Lovell University of Tasmania [email protected] Session 4B
Arian Mahzouni Royal Institute of Technology, Sweden [email protected] Session 4B
Bernard McKeown
Helen Melone Energy Action Scotland [email protected]
Nataliya Mogles University of Bath [email protected] Session 1
Saeed Mohammadi

“Feedback in energy demand reduction: Examining evidence and exploring opportunities” Edinburgh, July 2016Page 11
Johanna Moore University of Edinburgh [email protected]
Evan Morgan University of Edinburgh [email protected] Josephine Munene Clark University [email protected] Session 4A
David Murray University of Strathclyde [email protected] Michael Murray Mission.Data [email protected] Session 6
Gene Palencia Coventry University [email protected] Yi Xuan Peng Discovergy (German) [email protected] Lara Piccolo Open University [email protected] Session 5A
Gareth Powells Newcastle University [email protected]
Louise Reed University of St Andrews [email protected] Kirsten Revell University of Southampton [email protected] Session 1
Rosie Robinson Anglia Ruskin University [email protected] Session 4B
Riccardo Russo Essex University [email protected] Session 1
Marianne Ryghaug Norwegian University of Science and Technology [email protected] Session 3
Oscar Sanchez University College London [email protected] Paul Shabajee University of Bristol [email protected] Session 4A
Harshitha Shetty Centrica [email protected] David Shipworth University College London [email protected] Session 7
Michelle Shipworth University College London [email protected] Session 4B
Karen Smith Centre for Sustainable Energy [email protected]
Annika Sohre University of Basel, Switzerland [email protected] Session 4B
Alexa Spence University of Nottingham [email protected] Session 4A
Sam Staddon University of Edinburgh [email protected]
Lina Stankovic University of Strathclyde [email protected] Session 2
Vladimir Stankovic University of Strathclyde [email protected] Nikolaus Starzacher Discovergy (German) [email protected] Bruce Stephen University of Strathclyde [email protected] Session 1
Andy Stephenson National Energy Action [email protected] Session 5A

“Feedback in energy demand reduction: Examining evidence and exploring opportunities” Edinburgh, July 2016Page 12
Dan van der Horst University of Edinburgh [email protected]
Marika Vellei University of Bath [email protected] Session 3
Nervo Verdezoto University of Leicester [email protected] Session 5B
Lynda Webb University of Edinburgh [email protected] Christopher Weeks EDF/University of Bristol [email protected] Session 6
Dan White Behaviouralist [email protected] Session 7
Colin Whittle University of Sheffield [email protected]
Georgina Wood University of Birmingham [email protected] Session 5B
“Feedback in energy demand reduction: Examining evidence and exploring opportunities” Edinburgh, July 2016Page 13
TRAVEL, ACCOMMODATION & DIRECTIONS
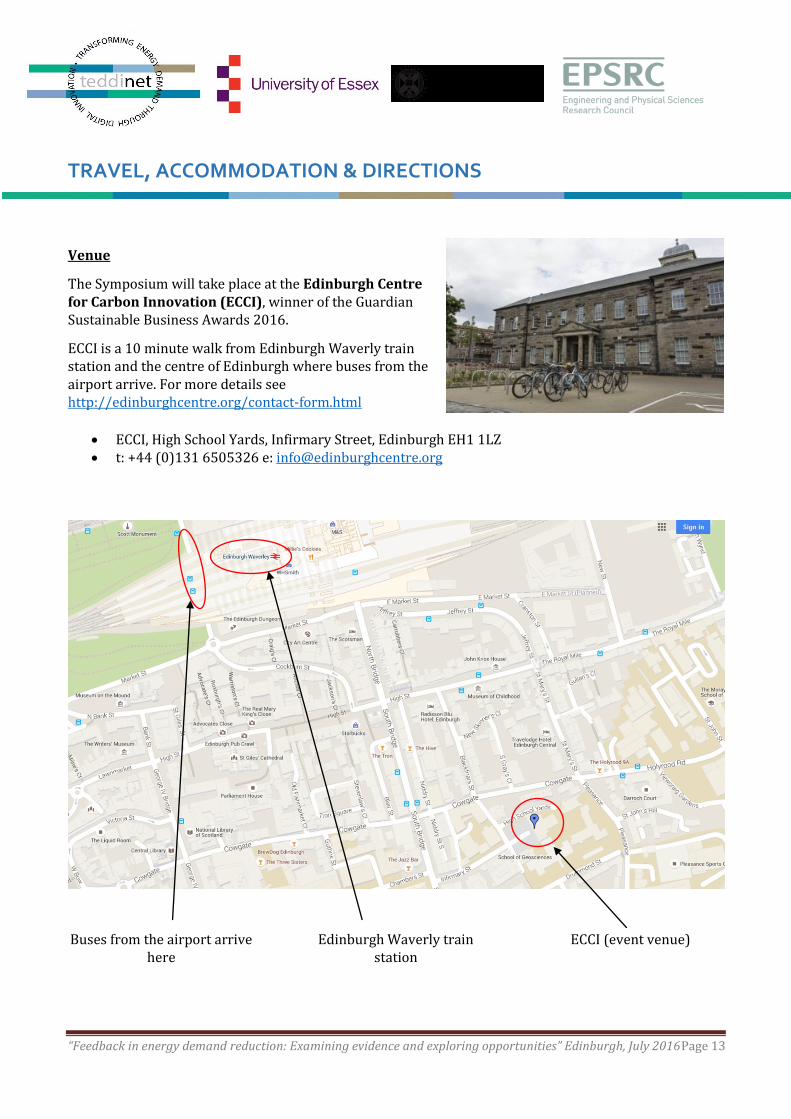
Venue
The Symposium will take place at the Edinburgh Centre for Carbon Innovation (ECCI), winner of the Guardian Sustainable Business Awards 2016.
ECCI is a 10 minute walk from Edinburgh Waverly train station and the centre of Edinburgh where buses from the airport arrive. For more details see http://edinburghcentre.org/contact-form.html
ECCI, High School Yards, Infirmary Street, Edinburgh EH1 1LZ t: +44 (0)131 6505326 e: [email protected]
Buses from the airport arrive here
Edinburgh Waverly train station
ECCI (event venue)
“Feedback in energy demand reduction: Examining evidence and exploring opportunities” Edinburgh, July 2016Page 14
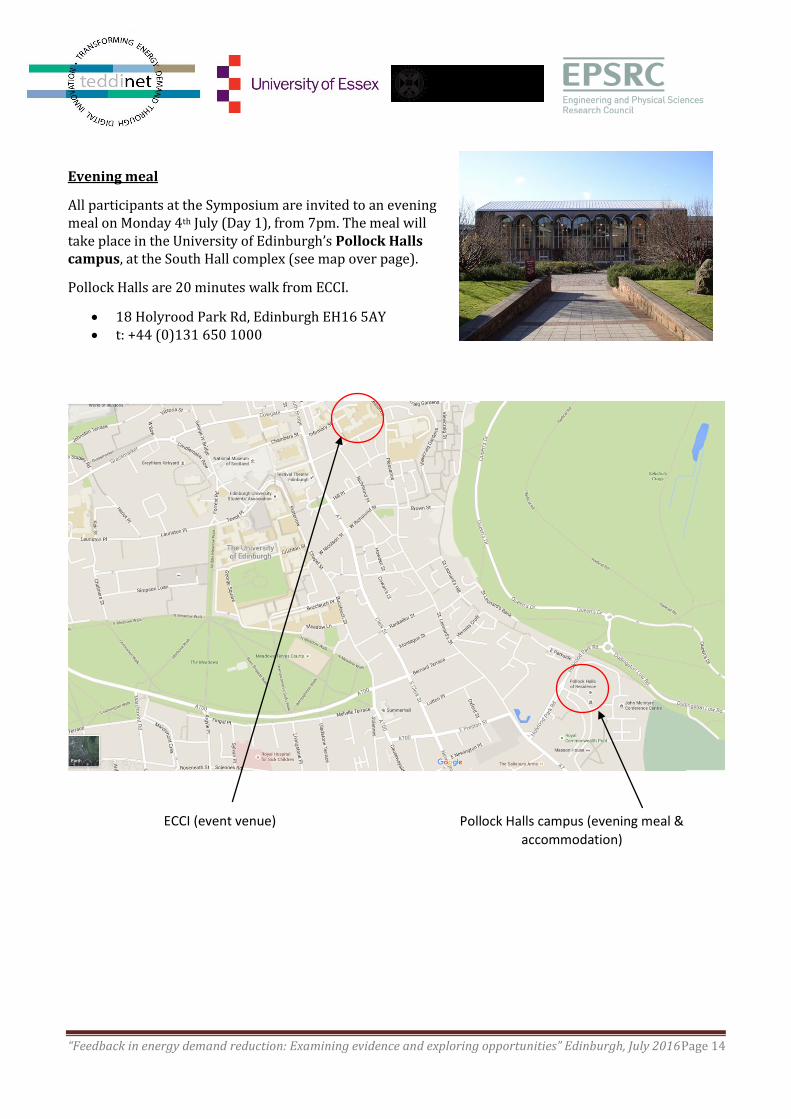
Evening meal
All participants at the Symposium are invited to an evening meal on Monday 4th July (Day 1), from 7pm. The meal will take place in the University of Edinburgh’s Pollock Halls campus, at the South Hall complex (see map over page).
Pollock Halls are 20 minutes walk from ECCI.
18 Holyrood Park Rd, Edinburgh EH16 5AY t: +44 (0)131 650 1000
ECCI (event venue) Pollock Halls campus (evening meal &
accommodation)
“Feedback in energy demand reduction: Examining evidence and exploring opportunities” Edinburgh, July 2016Page 15
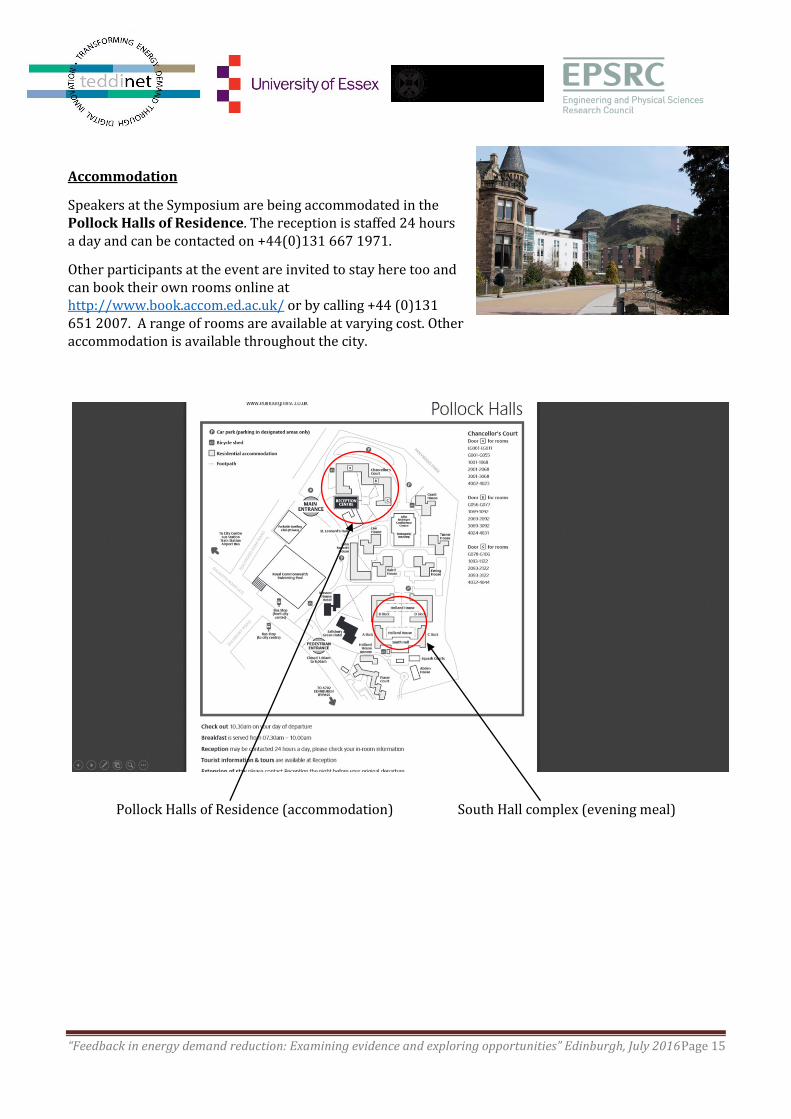
Accommodation
Speakers at the Symposium are being accommodated in the Pollock Halls of Residence. The reception is staffed 24 hours a day and can be contacted on +44(0)131 667 1971.
Other participants at the event are invited to stay here too and can book their own rooms online at http://www.book.accom.ed.ac.uk/ or by calling +44 (0)131 651 2007. A range of rooms are available at varying cost. Other accommodation is available throughout the city.
Pollock Halls of Residence (accommodation) South Hall complex (evening meal)

“Feedback in energy demand reduction: Examining evidence and exploring opportunities” Edinburgh, July 2016 Page 16
“Feedback in energy demand reduction: Examining evidence and exploring opportunities” Edinburgh, July 2016 Page 17
EXTENDED ABSTRACTS Index
SESSION 1 - ‘Delivering Feedback’
p.20 Vanquishing Energy Vampires: The Failure of Feedback Riccardo Russo & Kathryn Buchanan, University of Essex
p.27 Nat Consumers: Natural Language Feedback Caitlin Bent & Greg Shreeve, Energy Saving Trust
p.35 iBert: Intelligent Support System for Energy Behaviour Change Nataliya Mogles, University of Bath
p.42 Mental Model Interface Design: Putting Users in Control Kirsten Revell & Neville Stanton, University of Southampton
p.53 Investigating Smart Metering in the Home: How Users Comprehend Graphic Representations of Residential Electricity Feedback System Melanie Herrmann, University College London
p.60 Designing Successful Feedback Interfaces for Home Energy Systems: the Aging Population Perspective Bruce Stephen & Mike Danson et al., Heriot Watt University
SESSION 2 – ‘Advanced Feedback: Disaggregation & Visuals’
p.65 Does Disaggregated Electricity Feedback Reduce Electricity Consumption? A Critical Review of the Literature Jack Kelly, Imperial College London
p.74 Utilising Disaggregated Energy Data in Feedback Designs – The IDEAL Project Martin Pullinger & Nigel Goddard et al., University of Edinburgh
p.78 Energy feedback enabled by load disaggregation Lina Stankovic et al., University of Strathclyde
p.85 Visualising Scale-Invariant Comparative Energy Use Gerard Briscoe, Glasgow School of Art
p.86 Lessons on Visual Feedback from the Eviz Project: The Evidence for Using Thermal Images as a Visual Intervention Matthew Fox, University of Plymouth
SESSION 3 – ‘Learning Lessons & Limits’
p.96 Exploring Energy Feedback at Community and Household Level through Thermography, Carbon Mapping, Online Platform and Home Energy Visits Rajat Gupta & Laura Barnfield, Oxford Brookes University
p.106 The Effect of Real-Time Context-Aware Feedback on Occupants' Heating Behaviour and Thermal Adaptation Marika Vellei et al., University of Bath
p.115 Quantifying Likely Energy Reduction Opportunities in Family Homes Paula Cosar-Jorda, University of Loughborough
“Feedback in energy demand reduction: Examining evidence and exploring opportunities” Edinburgh, July 2016 Page 18
p.123 Between Empowerment and Alienation: How Feedback Technologies Can Harm the Prospects of Successful Energy Transitions Marianne Ryghaug et al., Norwegian University of Science and Technology
p.126 Why Eco-Manager is Not Brilliant? Máté Lőrincz, University of Keele
SESSION 4 A – ‘Beyond Domesticity: Feedback Outside of the Home’
p.127 GENIE (Goal-setting and ENergy Information Engagement) in the Workplace Alexa Spence et al., University of Nottingham
p.134 Energy Feedback in the Workplace: Effects of Display Units Caroline Leygue & Alexa Spence, University of Nottingham
p.142 Energy Feedback in Office Workplaces: Approach, Design and Implementation Magdalena Boork , Technical Research Institution of Sweden & C. Katzeff, KTH Royal Institute of Technology
p.149 An Interactive and Diagnostic Energy Use Analysis Interface for Facilities Managers Paul Shabajee et al., University of Bristol
p.155 Household Energy Saving Behaviour and Smart Grid Communication between Utilities and Customers Josephine Munene et al., Clark University, USA
p.167 Challenges of Feedback in Organisations- Can We Foster Partnerships not Projects? Richard Bull, De Montfort University & Kathryn Janda, University of Oxford
SESSION 4 B – ‘Linking to Theories & Disciplines’
p.174 The role of non-numeric feedback in reducing domestic energy consumption: Lessons from Freiburg and Besançon Arian Mahzouni, Royal Institute of Technology, Sweden
p.181 Constructing Policy Feedback On Energy Feedback: When Is Feedback ‘Working’? Rosie Robison & Chris Foulds, Anglia Ruskin University
p.186 Energy feedback: Place, Policy and Mobility Heather Lovell, University of Tasmania, Australia & Gareth Powells, Newcastle University
p.197 Advances in Understanding Energy Consumption Behaviour and the Governance of its Change – Outline of an Integrated Framework Annika Sohre, University of Basel, Switzerland
p.209 Beyond Calorie Counting: What Can Energy Feedback Learn From Weight Loss Programs? Michelle Shipworth, University College London
SESSION 5A – ‘Communities & Collectives’
p.214 Householder Engagement with Energy Consumption Feedback: The Role of Community Action and Communications Kevin Burchell et al., University of Westminster [presenting remotely]
p.215 Raising Awareness of Energy Collectively Lara Picollo, Open University
“Feedback in energy demand reduction: Examining evidence and exploring opportunities” Edinburgh, July 2016 Page 19
p.221 Social Media and Smart Phones Andy Stephenson et al., National Energy Action
p.229 7 Families - 7 Solar PV panels, 7 Pre-Payment meters - 1 Estate Nicolette Fox, University of Sussex [not presenting in person]
SESSION 5B – ‘Gamification of feedback’
p.235 Reflections on designing an engaging in-home energy dashboard using participatory design and gamification Georgina Wood, University of Birmingham
p.243 Exploring the Challenges and Opportunities of Eco-Feedback Technology for Shifting Electricity Use at Home Nervo Verdezoto, University of Leicester
p.248 Feedback in electricity demand reduction: Examining evidence and exploring opportunities through community-level game mechanics Roberta Castri, University of Applied Sciences and Arts of Southern Switzerland
SESSION 6 – ‘Insights from Industry & Policy’
p.257 Energy Efficiency Advice: A Toolkit for Engaging Consumers at Smart Meter Installation Visits Andrew Charlesworth, DECC
p.260 Improving participation in the energy market Alexander Belsham Harris, Citizens Advice
p.262 The surge of energy data: What does it mean for EDF Energy employees and householders? Christopher Weeks, EDF/University of Bristol
p.267 Existing commercial business activities: why and how feedback on energy consumption is being delivered to customers Scott Bryant, Delta EE
p.271 Energy-feedback services provided by utilities: Lessons learnt from the Empowering project Stoyan Danov, CIMNE
p.278 Waiting for Data: Market Adaptations to Poor Smart Meter Policies in America Michael Murray, Mission.Data
“Feedback in energy demand reduction: Examining evidence and exploring opportunities” Edinburgh, July 2016 Page 20
SESSION 1: Delivering feedback
Vanquishing Energy Vampires: The Failure of Feedback
Kathryn Buchanan & Riccardo Russo,
Department of Psychology
University of Essex
Wivenhoe Park
Colchester CO4 3SQ
United Kingdom
[email protected]; [email protected]
Abstract
Feedback strategies are frequently employed as a behavioural change strategy. The idea is
that presenting people with information about their past behaviour can change their future
intentions. Hence feedback strategies appear to rest on the assumption that “if only we knew
better we would act differently”. In this paper we assess the validity of this assumption by
examining whether feedback can influence pro-environmental intentions and the processes
that it involves. Specifically, across 6 different studies we provided over 1000 participants
with feedback about the yearly costs of their homes “energy vampires” (appliances such as
televisions and laptops that consume energy even when they are not being actively used).
We presented feedback in several different ways (e.g., financial losses vs. financial savings,
collective costs vs. personal household costs). Yet, regardless of the form in which we pre-
sented feedback it did not have a significant effect on behavioural intentions. However, feed-
back did significantly increase knowledge and awareness. Such findings suggest that while
feedback may lead to increases in awareness and knowledge, these factors alone are not
enough to influence behavioural intentions.
Introduction
“Eco-feedback”, the provision of information to end-consumers about their energy usage,
is a strategy often invoked to encourage consumers to curb their consumption. To optimize its
effectiveness it is important to know not only if eco-feedback can work (the practical applica-
tions) but how it works (the theory behind them). Accordingly, in the present study we used
an online calculator to show people the costs of their home’s energy vampires (appliances
that use energy even when in a standby mode) and examined both (i) the applications of
feedback (i.e., the impact it has on behavioural intentions) and (ii) the theory behind it (i.e.,
whether it increases knowledge and/or awareness and/or motivations).
Applications: Can feedback reduce energy consumption? Identifying an effective strategy
Past meta-analyses have reported that energy savings from eco-feedback range from 5 to
20% (e.g., Abrahamse et al., 2005; Darby, 2006; Fischer, 2008). Such variation can (in part)
be explained by differences in message framing of this feedback. E.g., energy consumption
“Feedback in energy demand reduction: Examining evidence and exploring opportunities” Edinburgh, July 2016 Page 21
can be framed as economic gains (savings) or economic losses (costs). However, given the
tendency for researchers to combine multiple feedback strategies within single interventions
it has not been possible to identify the most effective way of framing feedback. To address
this challenge, we compared the efficacy of different ways of framing feedback. In Study 1
we varied both the personalisation of the feedback (e.g., participants were shown either their
own personal costs or the national average cost) and its granularity (e.g., participants were
shown either disaggregated costs vs. the total costs vs. no costs), as past research has found
that people respond better to feedback when it is tailored to them (Goodhew et al., 2014) and
speculated that feedback may be more effective when it provides disaggregated costs
(Buchanan et al., 2014). In Study 2 we manipulated whether the information was presented
using positive or negative frames (i.e., potential savings vs. losses). On the basis of prospect
theory (Tversky & Kahneman, 1991), we expected that feedback would have a more power-
ful effect on behavioural intentions when the costs involved are framed as losses rather than
as gains or potential savings. In Study 3 we supplemented the yearly costs with socially
comparative information (i.e., we told participants if their vampire costs were
lower/higher/comparable to the national average). Past findings suggest that people may be
more inclined to engage with feedback when social norms are also provided (Harries et al.,
2013). In Study 4 we provided participants with collective costs (e.g., details of the country’s
annual energy vampire costs). We reasoned that the collective monetary (and environmental)
savings may be larger than individuals savings and thus may be more likely to motivate
intentions to change behaviour. In Studies 5 and 6 we attempted to increase the appeal of the
monetary savings using visualization tasks. We reasoned that if people could relate the
outcome of the targetted behaviour (unplugging energy vampires) to the purchase of a desired
product then this might influence their behavioural intentions.
Theory: How does feedback work? Three Typical Assertions
Typically, the explanations provided for why feedback might reduce consumption are
based around the following themes; filling an information/knowledge deficit (e.g., Wilhite &
Ling, 1995/Darby, 2006), promoting economical motivations (e.g., McKerracher & Torriti,
2012) and, transforming energy to increase visibility (e.g., Hargreaves et al., 2010). Whilst
each of these themes have a different emphasis they all based on the inherent characteristics
of energy as something that is abstract, intangible, and invisible - both visually and con-
sciously (Fischer, 2008; Hargreaves et al; 2010).
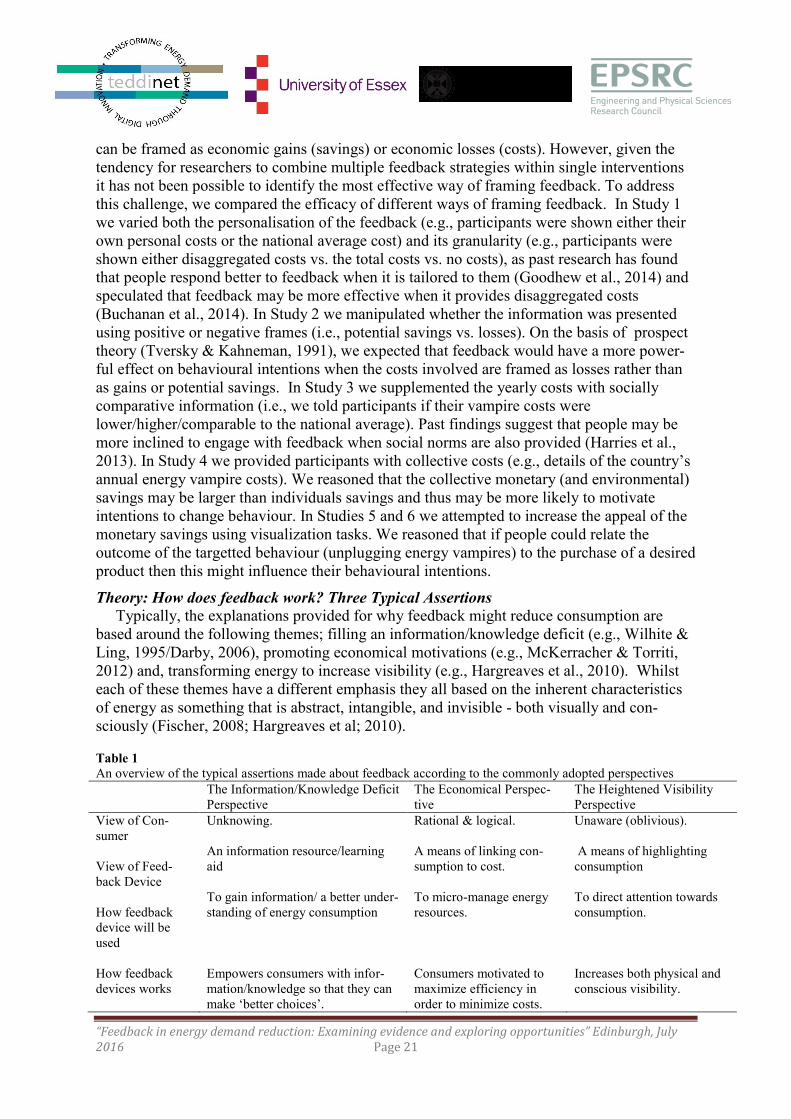
Table 1
An overview of the typical assertions made about feedback according to the commonly adopted perspectives
The Information/Knowledge Deficit
Perspective
The Economical Perspec-
tive
The Heightened Visibility
Perspective
View of Con-
sumer
Unknowing. Rational & logical. Unaware (oblivious).
View of Feed-
back Device
An information resource/learning
aid
A means of linking con-
sumption to cost.
A means of highlighting
consumption
How feedback
device will be
used
To gain information/ a better under-
standing of energy consumption
To micro-manage energy
resources.
To direct attention towards
consumption.
How feedback
devices works
Empowers consumers with infor-
mation/knowledge so that they can
make ‘better choices’.
Consumers motivated to
maximize efficiency in
order to minimize costs.
Increases both physical and
conscious visibility.
“Feedback in energy demand reduction: Examining evidence and exploring opportunities” Edinburgh, July 2016 Page 22
In Table 1 we provide a summary of three main perspectives. While these explanations have
not been tested quantitatively, qualitative data suggests that feedback may highlight the visi-
bility of energy consumption, increase awareness of the costs associated with energy use and
subsequently elicit curtailment behaviours, as well as enhancing knowledge about a home’s
energy profile (Buchanan et al., 2014; Hargreaves et al., 2010). To test these explanations
quantitatively, in the present study we measured knowledge, awareness, and motivations both
before participants received feedback, and again after they received feedback
The Present Research: Testing Applications and Theory
We investigated feedback using an adapted version of an energy vampire calculator,
which provided end users with a personalised estimate of the costs of their energy vampires
(appliances in the home that consume energy even when they are not in active use). Before
interacting with the calculator, participants completed a questionnaire which measured their
motives, knowledge about energy vampire costs and existing habits regarding unplugging
energy vampires. After receiving feedback, participants completed a post-feedback question-
naire which measured their; behavioural intentions to vanquish energy vampires, motives,
knowledge and awareness about energy vampire costs. The type of feedback that participants
received, depended on the condition to which they had been randomly assigned.
Method
In total 1106 American respondents (556 female, aged 18-80, Mean = 33.24, Standard
Deviation; SD = 11.48 via Amazon’s Mechanical Turk) participated in this study.
Details of feedback presentation
We presented participants with their vampire costs using the estimates provided by
NSTAR’s 2013 ‘Vampire Power Calculator’.
In Study 1, participants were shown one of the following: (a) the personalised total cost of
their energy vampires (PT); (b) a PT plus the disaggregated costs per each appliance; (c) PT
and advice regarding how to eliminate energy vampires; (d) an explanation about what an
energy vampire is (but no PT); (e) generic costs of vampires in the US (but no PT).
In Study 2, participants were either shown a smiling emoticon () stating, “'Good news!' You
could save __$ per year by unplugging your appliances when they are not in use!” or a sad
emoticon () stating, “'Bad news!' You are wasting __$ per year by keeping your appliances
plugged in when they are not in use!”
In Study 3, participants were shown their PT along with a statement about whether their ener-
gy vampire costs were lower than/comparable to/higher than the average American home. In
Study 4, participants were shown either their PT or their PT and a short paragraph emphasiz-
ing the collective costs of energy vampires.
In Study 5, participants were shown their PT and asked either to complete a positive visuali-
zation task in which they imagined something they would like to buy with the money saved
from vanquishing energy vampires or a negative visualization task where they imagine some-
thing that they would not like to buy with their savings.
In Study 6, participants were assigned to complete one of four different variations of the posi-
tive visualization task. They either had to imagine what they could purchase with their poten
“Feedback in energy demand reduction: Examining evidence and exploring opportunities” Edinburgh, July 2016 Page 23
tial savings that they (a) needed for themselves, (b) needed for others, or (c)wanted for them-
selves or (d)wanted for others.
Measures
We administered the measures listed below which we developed ourselves due to the
specificity of the constructs. For each measure participants rating the extent to which they
endorsed each item using a 7 point scale ranging from 1 (Strongly Disagree) to 7 (Strongly
Agree).
Pre-feedback questionnaire:
Knowledge: We assessed knowledge of energy vampires using three items, “I know how
much it costs me when I leave appliances in standby mode.”, “If I wanted to reduce my ener-
gy costs I would know which appliances I should avoid leaving in standby mode.”, and “I can
see a clear link between my energy use and my energy bills”.).
Awareness: In Studies 4 – 6 we examined if feedback increased awareness by asked par-
ticipants to indicate their agreement/disagreement with the following two statements, “I am
aware that appliances that have a standby mode cost me money even when they are not in
use” and “I am conscious of the fact that appliances that are plugged in but not in use still
consume energy”.
Motives: Participants used a 7 point scale to indicate to what extent they were (a) envi-
ronmentally motivated (“I would like to reduce my carbon footprint”) and (b) financially mo-
tivated (“I would like to reduce my energy bills”).
Post-feedback questionnaire:
Behavioural intentions to vanquish vampires: We assessed behavioural intentions using 7
items (e.g., “unplug some 'energy vampire' appliances?” and “regularly check that appliances
are unplugged if they are not in use?”). Participants were asked to indicate the likelihood that
they would enact each of the 7 items, using a scale ranging from 1 (“Very Unlikely”) to 7
(“Very Likely”).
Knowledge: As per the pre-feedback questionnaire.
Awareness: As per the pre-feedback questionnaire.
Motives: As per the pre-feedback questionnaire.

“Feedback in energy demand reduction: Examining evidence and exploring opportunities” Edinburgh, July 2016 Page 24
Results
Table 2.
Studies 1 to 6: Means Scores for (i) Behavioural Intention to Vanquish Energy Vampires and
(ii) Changes in Knowledge, Motives, and Awareness Per Condition Knowledge Financial Mo-
tives
Environmental
Motives
Awareness
Study Condition N Beh
Intent
Time
1
Time
2
Time
1
Time
2
Time
1
Time
2
Time
1
Time
2
1 No PT (Control) 63 4.20 4.51 4.48 - - - - - -
Generic total 83 4.35 4.38 4.90** - - - - - -
PT 62 4.23 4.24 5.31** - - - - - -
PT + disaggregated 63 4.46 4.41 5.51** - - - - - -
PT + advice 52 4.27 4.43 5.48** - - - - - -
2 PT + gain frame 47 4.32 4.23 5.21** 6.28 6.26 5.28 5.40* - -
PT + loss frame 49 4.67 4.48 5.64** 6.12 6.14 5.51 5.63 - -
3 PT + < average 51 4.29 4.39 5.43** 6.00 5.86 5.27 5.33 - -
PT + average 42 4.42 4.38 5.35** 6.12 6.14 5.43 5.45 - -
PT + > average 68 4.25 4.32 5.59** 6.16 6.04 5.35 5.47 - -
4 PT 72 4.60 4.28 5.48** 5.67 6.18 5.38 5.67* 5.70 6.00**
PT + collective 56 4.66 4.61 5.64** 5.88 6.07 5.50 5.80* 5.61 6.16**
5 PT + VD 88 4.65 4.49 5.67** 6.22 6.31 5.37 5.43 5.61 6.15**
PT + VU 87 4.30 4.29 5.46** 6.12 6.04 5.36 5.46 5.81 6.13**
6 PT + VYN 56 4.53 4.51 4.48* * 6.32 6.25 5.57 5.63 5.86 6.15**
PT + VON 53 4.45 4.38 4.90** 6.30 6.25 5.43 5.58 5.85 6.22**
PT + VYW 58 4.49 4.24 5.31** 6.29 6.22 5.28 5.48* 5.85 6.15**
PT + VOW 56 4.43 4.41 5.51** 6.14 6.07 5.57 5.71 5.84 6.07**
Note: PT = Personalised total. VD = visualize desired item(s), VU = visualize undesired item(s), VYN = visualize
item(s) you need, VON = visualize item(s) others need, VYW = visualize item(s) you want, VOW= visualize item(s)
others want. Time 1 = pre feedback, Time 2 = post-feedback. * denotes where changes between time 1 and time 2 = p <
.05, ** = p < .01. Standard deviations, standard errors, and confidence intervals are not included in this table due to
space prohibitions. However, a full table with information for each variable measured is available on request.
Can feedback influence behavioural intentions to vanquish energy vampires?
Table 2 shows the means, standard deviations for each of the variables we measured.
The mean behavioural intention scores (ranging from 4.20 to 4.67) were fairly consistent
across the 18 conditions. Planned comparisons between the control condition (in Study 1) and
each of the experimental conditions (in Studies 1 to 6) yielded only one significant result.
Specifically, participants who had visualized spending the monetary savings obtained from
vanquishing energy vampires on a desired item had higher behavioural intentions to vanquish
energy vampires than participants in the control condition (4.65 vs. 4.20, p = .038). However,
this difference became non-significant after applying Bonferroni’s corrections to account for
the multiple tests we had run.
Identifying an effective feedback strategy
Our results did not lead us to identify one feedback strategy that was more effective than
another. This was not only because there were no significant differences between the control
condition and any of the experimental conditions (as per above) but also because there were
no significant effects of condition on behavioural intentions in any of the ANOVA’s that we
“Feedback in energy demand reduction: Examining evidence and exploring opportunities” Edinburgh, July 2016 Page 25
conducted (Study 1: F(4, 318) = .42, Non Significant;NS), Study 2: F(1, 94) = 1.57, NS,
Study 3: F(2,158 ) = .24, NS, Study 4: F(1, 126) = .06, NS, Study 5: F(1, 173) = 3.10 p = .08,
Study 6: F(4,318) = .42, NS).
Testing the theory: Can feedback affect knowledge, awareness, and motivations?
Knowledge: In each of the studies we found that feedback significantly increased knowledge
(Study 1: F(1, 318) = 144.74; Study 2: F(1, 94) = 82.07; Study 3: F(1, 158) = 158.89; Study
4: F(1, 126) = 111.84,; Study 5: F(1, 130) = 154.13; Study 6: F(1, 219) = 273.59, all p’s <
.01). However, there was only a significant interaction between knowledge and condition in
Study 1(F(4, 318) = 12.93, p <.01), such that every condition apart from the control, experi-
enced significant gains in knowledge. In Studies 2-6, the interaction between knowledge and
condition was not significant (Study 2: F(1, 94) = .62; Study 3: F(2, 158) = 1.19; Study 4:
F(1, 126) = .73; Study 5: F(1, 146) = .01; Study 6: F(3, 219) = 2.21, all NS).
Awareness: In each of the studies that we measured awareness we found that it significant-
ly increased post-feedback (Study 4: F(1, 126) = 37.15; Study 5: F(1, 130) = 25.35; Study 6:
F(1, 219) = 40.16. All p’s < .01). There were no significant interactions between changes in
awareness and condition (Study 4: F(1, 126) = 3.16; Study 5: F(1, 130) = 0.45, Study 6: F(3,
219) = .24 all NS).
Motivations: Feedback only significantly increased environmental motivations in 4 out of
13 conditions and only financial motivations in 1 out of 13 conditions.
Discussion
Across 6 different studies we provided over 1000 participants with feedback about the
costs of their energy vampires. Despite, presenting this information in a variety of ways we
failed to find support for the notion that feedback can significantly influence behavioural in-
tentions. In fact, given that behavioural intention scores did not significantly vary between
conditions, we were unable to state that any one of the feedback strategies was more success-
ful than any other. As for the theoretical assumptions often made about feedback, we found
little support for the idea that feedback can significantly alter motivations. Consequently,
there was no strong support for the economic perspective that feedback motivated consumers
to rationally micromanage their consumption to accrue financial benefits. Yet, this is not to
say that feedback did not have any impact, as we found that feedback significantly increased
both awareness and knowledge, thus support was provided for the theoretical assertions made
by both the knowledge deficit and heightened visibility perspectives. However, despite the
fact that feedback significantly increased knowledge and awareness, these benefits alone
were not enough to substantially influence behavioural intentions.
References
Abrahamse, W., Steg, L., Vlek, C., & Rothengatter, T. (2005). A review of intervention
studies aimed at household energy conservation. Journal of Environmental
Psychology, 25(3), 273-291.
Buchanan, K., Russo, R., & Anderson, B. (2014). Feeding back about eco-feedback: How do
consumers use and respond to energy monitors?. Energy Policy, 73, 138-146.

“Feedback in energy demand reduction: Examining evidence and exploring opportunities” Edinburgh, July 2016 Page 26
Darby, S. (2006). The Effectiveness of Feedback on Energy Consumption: A Review for
Defra of the Literature on Metering, Billing and Direct Displays. Environmental Change
Institute, University of Oxford.
Delmas, M. A., Fischlein, M., & Asensio, O. I. (2013). Information strategies and energy
conservation behavior: A meta-analysis of experimental studies from 1975 to
2012. Energy Policy, 61, 729-739.
Fischer, C. (2008). Feedback on household electricity consumption: a tool for saving
energy? Energy Efficiency, 1(1), 79-104.
Hargreaves, T., Nye, M., & Burgess, J. (2010). Making energy visible: A qualitative field
study of how householders interact with feedback from smart energy monitors. Energy
Policy, 38(10), 6111-6119.
Harries, T., Rettie, R., Studley, M., Burchell, K., & Chambers, S. (2013). Is social norms
marketing effective? A case study in domestic electricity consumption. European Journal
of Marketing, 47(9), 1458-1475.
Katzev, R. D., & Johnson, T. R. ( 1987). Promoting energy conservation: An analysis of
behavioral research. Boulder, CO: Westview Press.
McKerracher, C., & Torriti, J. (2012). Energy consumption feedback in perspective:
integrating Australian data to meta-analyses on in-home displays. Energy Efficiency, 1-19.
Tversky, A., & Kahneman, D. (1991). Loss aversion in riskless choice: A reference-
dependent model. The Quarterly Journal of Economics, 1039-1061.
Wilhite, H., & Ling, R. (1995). Measured energy savings from a more informative energy
bill. Energy and buildings, 22(2), 145-155.
---
This extended abstract is adapted from our ECEEE contribution:
http://proceedings.eceee.org/visabstrakt.php?event=5&doc=9-110-15
“Feedback in energy demand reduction: Examining evidence and exploring opportunities” Edinburgh, July 2016 Page 27
Natconsumers – A mechanism for natural language feedback
Caitlin Bent, Energy Saving Trust, [email protected]
More information on the Natconsumers project, including all publications, is available at
www.natconsumers.eu
Abstract
Natconsumers is an EU Horizon 2020 funded project which is developing a framework for
the provision of tailored energy feedback that could be implemented in any part of Europe.
The feedback will utilise ‘natural language’ – tailored advice which is emotionally intelligent,
easy to understand, and delivered in a natural style. To do so, the project has explored the
factors influencing energy use, in order to understand the opportunities and constraints people
face in relation to reducing energy consumption. From this, the Energy Saving Trust has cre-
ated a framework of influencing factors:
wider context factors, which form the backdrop against which energy use occurs;
individual context factors, which constrain an individual’s ability to change their
behaviours; and
knowledge and psychological factors, which influence people’s willingness to change
behaviours.
Using this framework, we are creating segmentation models to allow for effective tailoring of
energy advice. To determine what advice is relevant to a household, the wider and individual
context of that household must be understood. This will be achieved using load profile and
demographic segmentations. To determine how that advice can be delivered in an interesting,
engaging and ‘natural language’ way, a third segmentation will be used in which people are
clustered based upon their knowledge, values and motivations.
Introduction
The expanding roll-out of smart metering across the EU provides the opportunity for tailored,
detailed, household-specific feedback on energy use to be provided to consumers. This, it is
hoped, will give consumers greater awareness and control over their energy use, and will
stimulate reductions in energy consumption. Giving households access to their energy con-
sumption data alone is unlikely to stimulate considerable change however. Rather, this in-
formation will only be effective if it is utilised to produce relevant, interesting advice that
prompts the households to adopt more sustainable energy consumption patterns.
The purpose of the Natconsumers project is to investigate this advice provision, and design a
mechanism for generating tailored, relevant advice to householders regarding their energy
use. Natconsumers is a Horizon 2020 funded project, which aims to create a system of ‘Natu-
ral Language’ energy advice messaging, using emotive content which plays off householder’s
unique characteristics in order to stimulate action. Such communication will be designed to
be friendly, emotionally intelligent, relevant and clear.
“Feedback in energy demand reduction: Examining evidence and exploring opportunities” Edinburgh, July 2016 Page 28
Central to this approach is the tailoring of advice. Advice will be tailored based upon house-
hold’s measured electricity usage, their property’s characteristics, the socio-demographics of
the residents, and the householder’s knowledge, values and motivations. To achieve this tai-
loring, Natconsumers will combine electricity data from smart meters with survey data on
people’s home and their personal characteristics.
To allow advice to be tailored, we must understand what factors are driving energy consump-
tion: what determines people’s current energy consumption patterns, and what determines
their likelihood or ability to change. The first stage of this project therefore investigates the
factors which influence energy use. The second stage translates these factors into natural lan-
guage messaging, using this knowledge to understand both what advice to give people, and
how to frame this.
Stage 1: Identifying factors influencing energy use
Energy consumption is influenced by a multitude of different factors. These factors are not
independent of each other, or of the behaviours they produce. Rather, there are complex in-
teractions between different factors, and cyclical relationships between these factors and be-
haviours. Social norms, for example, are one factor which may influence behaviour, yet so-
cial norms themselves are produced and reinforced by the behaviour in question (Shove,
2009).
Separating out these factors for investigation is therefore difficult. For the purposes of this
project, we have created a framework (developed from Wallenborn’s (2007) groupings)
based upon three broad categories: wider context factors, individual context factors, and
knowledge/psychological factors. These factors are, of course, not independent of each other,
and there is interplay and cross-overs between the categories. However, this provides a basic
framework through which the different factors influencing energy usage can be investigated.
“Feedback in energy demand reduction: Examining evidence and exploring opportunities” Edinburgh, July 2016 Page 29
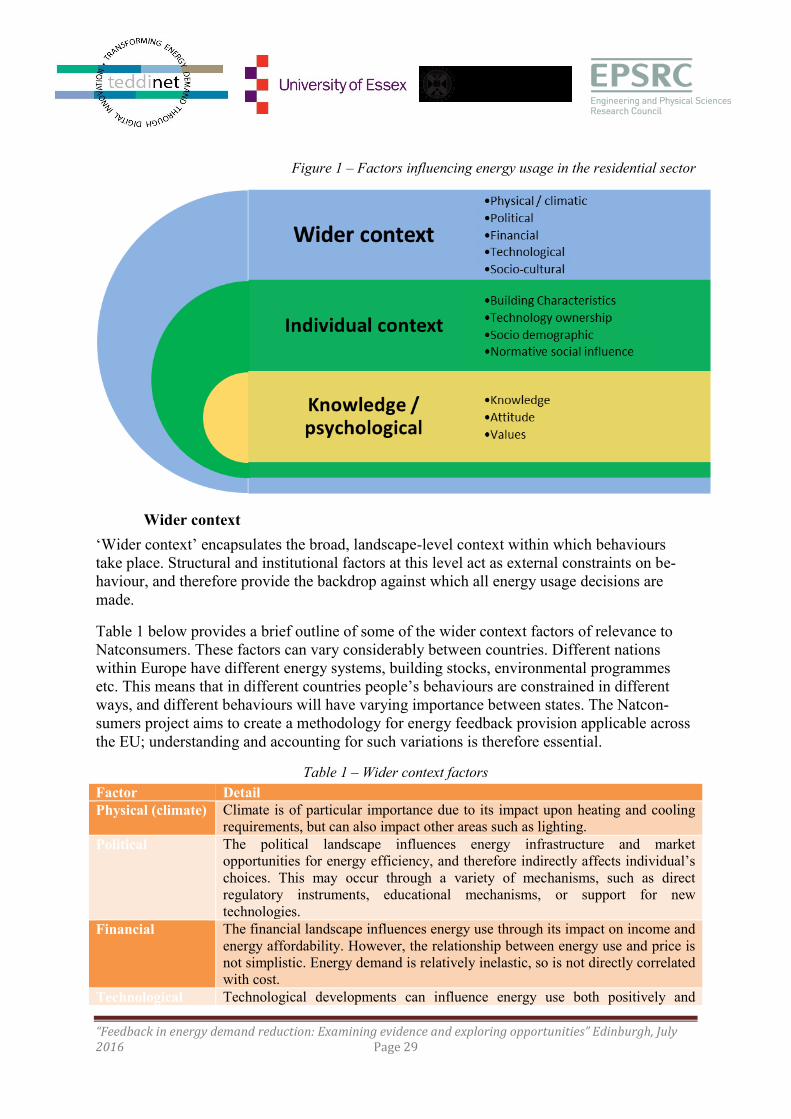
Figure 1 – Factors influencing energy usage in the residential sector
Wider context
‘Wider context’ encapsulates the broad, landscape-level context within which behaviours
take place. Structural and institutional factors at this level act as external constraints on be-
haviour, and therefore provide the backdrop against which all energy usage decisions are
made.
Table 1 below provides a brief outline of some of the wider context factors of relevance to
Natconsumers. These factors can vary considerably between countries. Different nations
within Europe have different energy systems, building stocks, environmental programmes
etc. This means that in different countries people’s behaviours are constrained in different
ways, and different behaviours will have varying importance between states. The Natcon-
sumers project aims to create a methodology for energy feedback provision applicable across
the EU; understanding and accounting for such variations is therefore essential.
Table 1 – Wider context factors
Factor Detail
Physical (climate) Climate is of particular importance due to its impact upon heating and cooling
requirements, but can also impact other areas such as lighting.
Political The political landscape influences energy infrastructure and market
opportunities for energy efficiency, and therefore indirectly affects individual’s
choices. This may occur through a variety of mechanisms, such as direct
regulatory instruments, educational mechanisms, or support for new
technologies.
Financial The financial landscape influences energy use through its impact on income and
energy affordability. However, the relationship between energy use and price is
not simplistic. Energy demand is relatively inelastic, so is not directly correlated
with cost.
Technological Technological developments can influence energy use both positively and
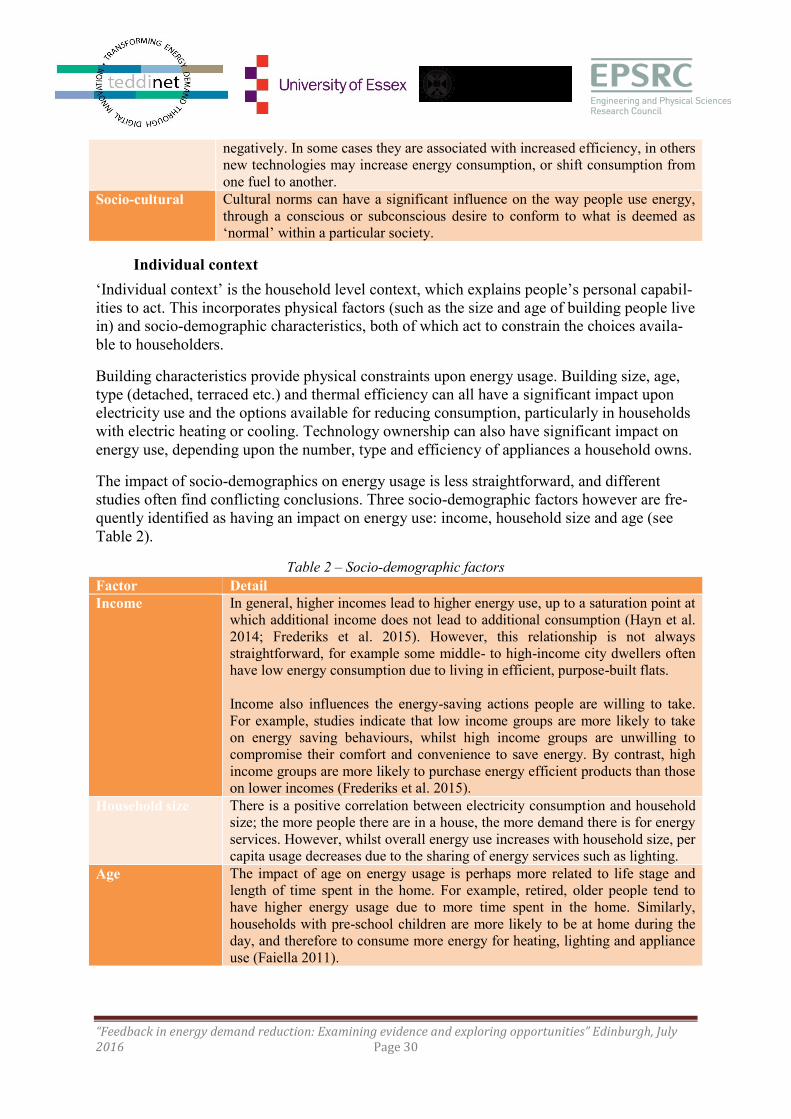
“Feedback in energy demand reduction: Examining evidence and exploring opportunities” Edinburgh, July 2016 Page 30
negatively. In some cases they are associated with increased efficiency, in others
new technologies may increase energy consumption, or shift consumption from
one fuel to another.
Socio-cultural Cultural norms can have a significant influence on the way people use energy,
through a conscious or subconscious desire to conform to what is deemed as
‘normal’ within a particular society.
Individual context
‘Individual context’ is the household level context, which explains people’s personal capabil-
ities to act. This incorporates physical factors (such as the size and age of building people live
in) and socio-demographic characteristics, both of which act to constrain the choices availa-
ble to householders.
Building characteristics provide physical constraints upon energy usage. Building size, age,
type (detached, terraced etc.) and thermal efficiency can all have a significant impact upon
electricity use and the options available for reducing consumption, particularly in households
with electric heating or cooling. Technology ownership can also have significant impact on
energy use, depending upon the number, type and efficiency of appliances a household owns.
The impact of socio-demographics on energy usage is less straightforward, and different
studies often find conflicting conclusions. Three socio-demographic factors however are fre-
quently identified as having an impact on energy use: income, household size and age (see
Table 2).
Table 2 – Socio-demographic factors
Factor Detail
Income In general, higher incomes lead to higher energy use, up to a saturation point at
which additional income does not lead to additional consumption (Hayn et al.
2014; Frederiks et al. 2015). However, this relationship is not always
straightforward, for example some middle- to high-income city dwellers often
have low energy consumption due to living in efficient, purpose-built flats.
Income also influences the energy-saving actions people are willing to take.
For example, studies indicate that low income groups are more likely to take
on energy saving behaviours, whilst high income groups are unwilling to
compromise their comfort and convenience to save energy. By contrast, high
income groups are more likely to purchase energy efficient products than those
on lower incomes (Frederiks et al. 2015).
Household size There is a positive correlation between electricity consumption and household
size; the more people there are in a house, the more demand there is for energy
services. However, whilst overall energy use increases with household size, per
capita usage decreases due to the sharing of energy services such as lighting.
Age The impact of age on energy usage is perhaps more related to life stage and
length of time spent in the home. For example, retired, older people tend to
have higher energy usage due to more time spent in the home. Similarly,
households with pre-school children are more likely to be at home during the
day, and therefore to consume more energy for heating, lighting and appliance
use (Faiella 2011).
“Feedback in energy demand reduction: Examining evidence and exploring opportunities” Edinburgh, July 2016 Page 31
Knowledge/psychological factors
The role of psychological factors in influencing energy usage is highly contested. A number
of studies find them to be of limited importance, identifying an ‘attitude-behaviour gap’ or
‘value-action gap’. However, it can also be argued that these ‘gaps’ occur where individual
and wider contextual factors limit people from following through with actions consistent with
their attitudes or intentions; i.e. there are intervening variables between attitudes and behav-
iours (Steg et al. 2015; Mirosa et al. 2011).
Psychological factors should not be dismissed therefore; they can play an important role me-
diating between context and behaviour. Context can act to constrain and shape opportunities
for changing energy use, but people’s willingness, motivation and intention will be important
in determining whether this change occurs. Energy saving advice must therefore be tailored
to be in-line with these motivations.
Motivation is dependent upon people’s knowledge and understanding of the action or behav-
iour, the way in which they cognitively evaluate the behaviour, and whether they behaviour is
regarded as in-line with their underlying values and beliefs. To a large extent, knowledge is a
pre-requisite for action; for people to intentionally change behaviour, they must be aware of
the actions which can be taken and the beneficial consequences of this (Dahlbom et al. 2009).
Whilst knowledge is a pre-requisite however, it is not, on its own, sufficient for action. In-
deed, many studies have found limited relationship between knowledge and behaviours. In
particular, the impact of knowledge on habitual behaviours, which do not require cognitive
assessment, is likely to be very limited.
Attitudes are often, intuitively, assumed to have an important influence on behaviours. An
attitude is, in its simplest form, the way we perceive and comprehend an object, idea or be-
haviour, and our emotional evaluation of it (Bergman 1998). However, a number of studies
have found that in reality there is little correlation between people’s attitudes and actions (e.g.
Ramos et al. 2015). For habitual behaviours in particular, which occur automatically without
cognitive evaluation, attitudes have little importance.
Perhaps more important than attitudes are values. Values are relatively stable beliefs which
form the guiding principles for people, groups, or social entities (Parkhill et al. 2013). They
transcend specific actions or situations; rather, they are general modes of conduct that guide
our perception and evaluation (Bergman 1998). They are a deeper, more stable concept than
attitudes; whilst attitudes and preferences may change with different contexts, values are en-
trenched and difficult to change (Bergman, 1998; Parkhill et al. 2013; Mirosa et al. 2011).
Both Abrahamse and Steg (2011) and Corraliza and Martin (2000) found that values were a
much better predictor of current behavioural practices than attitudes.
Understanding the underlying value systems which steer behaviours is important to the effec-
tive framing of Natconsumer’s messaging. People will not act in opposition to their underly-
ing values. Messaging should not try to change people’s values, but should be framed in a
way which aligns the advised behaviour change with these pre-existing values (Mirosa et al.
2011). Measuring such values and motivations however is difficult. In this project, we have
utilized Schwartz’s (2003) Portrait Values Questionnaire, a set of questions used within the
European Social Survey. Whilst this does not provide the depth of understanding which could
be gained from qualitative studies, it does allow collection of a large amount of data from

“Feedback in energy demand reduction: Examining evidence and exploring opportunities” Edinburgh, July 2016 Page 32
across Europe, which is necessary to produce a framework for advice provision relevant
across different EU countries.
Stage 2: Developing and tailoring the advice
Within the Natconsumers project, this understanding of factors influencing energy use will be
utilized to create tailored energy saving advice. In order to create relevant, interesting, tai-
lored messages, two key elements must be addressed:
What the message is: based on our understanding of the consumer, what type of be-
havioural change is it appropriate to advise?
How the message is communicated: how should the message be framed in order to
make it resonate with the consumer?
What the message is will depend upon both the wider context and individual context outlined
in Stage 1. These factors determine what energy saving options are available to a household-
er, and therefore what advice is relevant. How the message is communicated will depend on
psychological factors – what motivates the householder, and how the message can be framed
to align with their interests and values.
To answer these questions, Natconsumers is creating three segmentation models: a segmenta-
tion of electricity load profiles, a demographic segmentation, and a segmentation model
based on psychological factors. These segmentations are currently in development.
Load profile segmentation
The load profile segmentation will provide information on the pattern of household electricity
consumption over time. From this, we will be able to see common characteristics of con-
sumption patterns between different countries, thereby providing the context for energy-
related advice across different areas of Europe.
Demographic segmentation
A second segmentation model will be produced based on individual context factors. This in-
volves information on building type and characteristics, technology ownership, and socio-
demographic factors. This will further allow us to ensure advice is tailored towards what is
relevant for particular households, and will allow for comparison between households of a
similar type.
Psychological segmentation
The third segmentation model will be used to tackle the second element of advice provision:
how the message should be communicated. Based on a survey of 4,000 people conducted
across four countries (1,000 people in each of Italy, Hungary, Denmark and the UK), we will
segment people based upon their values and motivations. Using these segments, messages
will be varied and re-framed for different groups. For example, for a segment with primarily
hedonistic values, advice will be focused around personal benefits, in particular increases in
comfort or convenience which can be gained through slight changes in behaviour. By con-
trast, for segments where benevolence or universalist values are strong, messaging may be
“Feedback in energy demand reduction: Examining evidence and exploring opportunities” Edinburgh, July 2016 Page 33
more focused on the environmental benefits of reducing energy use, or the cumulative bene-
fits to society.
Conclusions and next steps
The Natconsumers project is aiming to develop a methodology for the generation of tailored,
natural language messaging on energy consumption, for use across Europe. To do so, we
have first investigated the variety of factors which influence energy usage and people’s abil-
ity and willingness to reduce consumption. This has identified three broad categories: wider
context factors, individual context factors, and knowledge/psychological factors.
Understanding these factors, and how they influence individual householders, is necessary
both to define what advice is relevant to a household and how that advice should be commu-
nicated. As such, we are creating three segmentation models: load profile segmentation, de-
mographic segmentation, and psychological segmentation. The load profile and demographic
segmentations will be utilized to identify advice which will be relevant to a household. The
psychological segmentation will determine in what terms that message should be framed to
make it resonate with the householder in a ‘natural language’ way.
The next stage of the project, once these three segmentations are developed, will be to inves-
tigate how to deliver messages. This requires an understanding of message style – should the
messages be funny, serious, confrontational, etc.? How should message styles vary by indi-
vidual, or change over time? Our early focus group studies into this subject indicate that the
sender of the message is important; an appropriate message from a consumer organization is
very different to an appropriate message from a utility company. Our focus groups also sug-
gest that message style should vary and develop over time. As trust and knowledge build up,
messaging can become more complex and more provocative. As the project develops,
Natconsumers will further explore these themes, in order to develop a feedback mechanism
which is tailored, relevant and effective.
References
Abrahamse, W and Steg, L (2011) ‘Factors related to household energy use and intention to
reduce it: The role of psychological and socio-demographic variables’. Human Ecology Re-
view, 18(1), 30-40
Bergman, M (1998) ‘A theoretical note on the difference between attitudes, opinions and val-
ues’. Swiss Political Science Review, 4(2), 81-93
Corraliza, J and Martin, R (2000) ‘Estilos de vida, actitudes y comportamientos ambientales’.
Medio Ambiente y Comportamiento Humano, 1(1), 31-56
Dahlbom, B, Greeg, H, Egmond, C, and Jonkers, R (2009) ‘Changing energy behaviour:
Guidelines for behavioural change programmes’, IDAE (ed.) report for Intelligent Energy
Europe BEHAVE programme
Faiella, I (2011) ‘The demand for energy of Italian households’ Banca d’Italia Temi di Dis-
cussione (Working Paper) No. 822
“Feedback in energy demand reduction: Examining evidence and exploring opportunities” Edinburgh, July 2016 Page 34
Frederiks, E, Stenner, K, and Hobman, E (2015) ‘The socio-demographic and psychological
predictors of reseidential energy consumption: A comprehensive review’. Energies, 8(1),
573-609
Hayn, M, Bertsch, V, Fichtner, W (2014) ‘Electricity load profiles in Europe: The importance
of household segmentation’. Energy Research & Social Science, 3, 30-45
Mirosa, M, Lawson, R and Gnoth, D (2011) ‘Linking personal values to energy-efficient be-
haviours in the home’. Environment and Behaviours, 45(4), 455-475
Parkhill, K, Demski, C, Butler, C, Spence, A, and Pidgeon, N (2013) ‘Transforming the UK
energy system: Public values, attitudes and acceptability – Synthesis report’. UKERC: Lon-
don.
Ramos, A, Labandeira, X and Löschel, A (2015) ‘Pro-environmental households and energy
efficiency in Spain’, Economics for Energy.
Schwartz, S (2003) ‘A proposal for measuring value orientations across nations’, Chapter 7 in
the Questionnaire Development Package of the European Social Survey.
Shove, E (2009) ‘Beyond the ABC: climate change policy and theories of social change’. En-
vironment and Planning A, 42(6), pp. 1273-1285
Steg, L, Perlaviciute, G and van der Werff, E (2015) ‘Understanding the human dimensions
of a sustainable energy transition’. Frontiers in Psychology, 6, article 805
Wallenborn, G (2007) ‘How to attribute power to consumers? When epistemology and poli-
tics converge’, in Zaccai, E (ed.) Sustainable consumption, ecology and fair trade (pp. 57-
69). Routledge.
“Feedback in energy demand reduction: Examining evidence and exploring opportunities” Edinburgh, July 2016 Page 35
iBert: Intelligent Support System for Energy Behaviour Change
Nataliya Mogles1, Ian Walker, JeeHang Lee, Alfonso P. Ramallo-González,
Sukumar Natarajan, Julian Padget, Elizabeth Gabe-Thomas, Tom Lovett, Gang Ren,
David Coley
University of Bath
Abstract
This work contributes to the debate on the effectiveness of In-Home Displays (IHDs) that convey dy-
namic information on energy consumption. It compared a conventional IHD and more intelligent en-
ergy feedback communicated via a mobile application. We hypothesised that energy feedback framed
according to personal values and providing tailored action prompts would have a positive effect on
energy-related behaviour. The counterbalanced experimental study, carried out in real homes, tested 4
types of energy feedback displays: a standard commercially available IHD, or the same display with
added energy information translated into personal values, tailored action prompts, or both of these
together. The results of the study demonstrate that a standard IHD led to significant reductions in in-
ternal home temperatures during a heating season but that, surprisingly, adding tailored action
prompts reduced this benefit.
Introduction
Human behaviour related to energy consumption is a very complex phenomenon as it is em-
bedded into a broad socio-cultural context and infrastructure and for this reason changing this
behaviour is very challenging. One of the foci of research on and aspirations for the reduction
of domestic energy consumption lies in inducing occupants behaviour change with the help
providing real-time energy feedback with technological solutions: smart meters or ambient
displays (Darby, 2001) that are capable of providing continuous daily feedback on household
energy consumption. Opinions regarding the effectiveness of such solutions - smart meters
and In-Home-Displays (IHDs) - are not unanimous. It can be explained by two main factors:
1) research on the effectiveness of digital energy feedback yields contradictory and divergent
results; 2) it is difficult to synthesise and to interpret these results due to the fact that the ma-
jority of energy feedback interventions ‘are not systemically designed, documented, imple-
mented, and evaluated’ (Karatasou et al, 2014).
Some research findings suggest that continuous energy feedback might be an effective driver
for energy behaviour change (Abrahamse et al, 2005). Energy feedback provided to users
with the help of smart meters could save between 5-15% of energy costs (Barbu, 2013). Re-
cent research on energy feedback with the help of advanced IHDs demonstrates that they can
help to save up to 20% of energy costs (Darby, 2010), (Pierce et al, 2010). Though these sav-
ings seem to be quite moderate, they indicate that computerised energy feedback that offers
different feedback options might be an effective means to achieve energy conservation goals
(Fischer, 2008).
1 Presenter and corresponding author: [email protected]
“Feedback in energy demand reduction: Examining evidence and exploring opportunities” Edinburgh, July 2016 Page 36
On the other hand, it is stated that proposed current technological solutions suffer from mul-
tiple drawbacks (Buchanan et al, 2014), (Fitzpatrick et al, 2009), (Hargreaves et al, 2010)
due to their modest effect and inability to motivate and to engage users. The general prob-
lems with the large-scale smart meters and energy monitoring displays deployment are sum-
marised as follows: disinterested users, failure to address users’ personal motivations and
needs embedded in daily routines and social practices, information comprehension issues
caused by abstract numerical information in kWh and financial costs, inattention to users’
personal characteristics (Buchanan et al, 2014). These statements give a clear indication that
users need something more than a plain energy feedback in kWh or costs to engage them.
The findings from the environmental psychology literature postulate that environmental be-
haviour is highly correlated with four internal values: altruistic, biospheric, egoistic and he-
donic (Steg et al, 2012). Internal values are ‘desirable goals, varying in importance, that
serve as guiding principles in people’s lives' (Schwartz, 1992). Values are considered to be
relatively stable over time. Values are conceptually different from the goals and attitudes:
they reflect which goals people find most important in life in general, while goals reflect
what motivates people in a given situation, which not only depends on their values but also
on situational cues (Steg et al, 2014).
After having considered all arguments described above, we have taken two perspectives on
the improvement of user engagement and motivation while providing an energy feedback via
IHDs:
1) Incorporation of internal values;
2) Generation of tailored messages with action prompts based on building characteristics
and users behaviour
We incorporated this approach into an intelligent energy feedback system called iBert which
was deployed in 43 homes in Exeter during from January 2016 until March 2016.
Method
Using environmental, gas and electricity sensors data, we built an energy behaviour change
system called iBert. iBert is an Android application which applies intelligent algorithms to
the sensors data and generates a tailored energy feedback to users.
iBert was deployed in 43 homes in Exeter at the end of December 2015 in order to evaluate
its effect on energy behaviour change. We tested the effectiveness of four types of feedback
in a counterbalanced within-subject study with four experimental conditions (see Table 1): 1)
typical numeric feedback in kWhs; 2) numeric information converted into personal values; 3)
numeric feedback with tailored messages and action prompts; 4) numeric information con-
verted into personal values and tailored messages translated into personal values plus action
prompts.
“Feedback in energy demand reduction: Examining evidence and exploring opportunities” Edinburgh, July 2016 Page 37
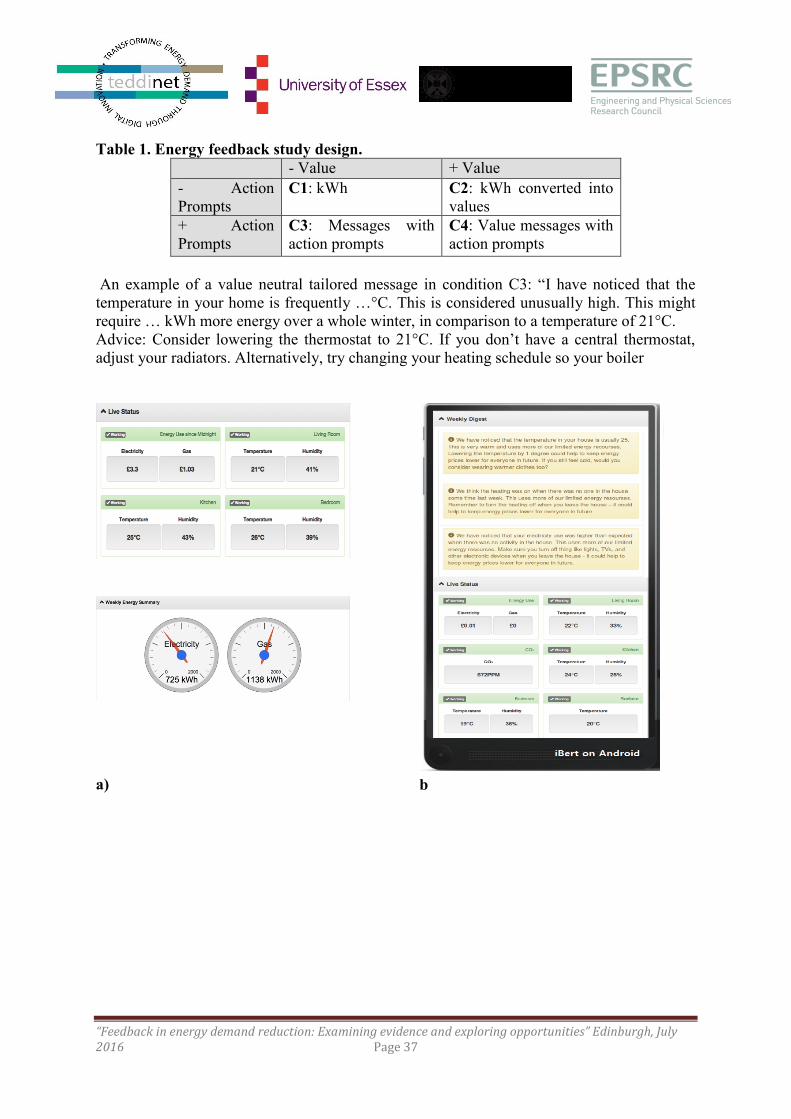
Table 1. Energy feedback study design.
- Value + Value
- Action
Prompts
C1: kWh C2: kWh converted into
values
+ Action
Prompts
C3: Messages with
action prompts
C4: Value messages with
action prompts
An example of a value neutral tailored message in condition C3: “I have noticed that the
temperature in your home is frequently …°C. This is considered unusually high. This might
require … kWh more energy over a whole winter, in comparison to a temperature of 21°C.
Advice: Consider lowering the thermostat to 21°C. If you don’t have a central thermostat,
adjust your radiators. Alternatively, try changing your heating schedule so your boiler
a)
b
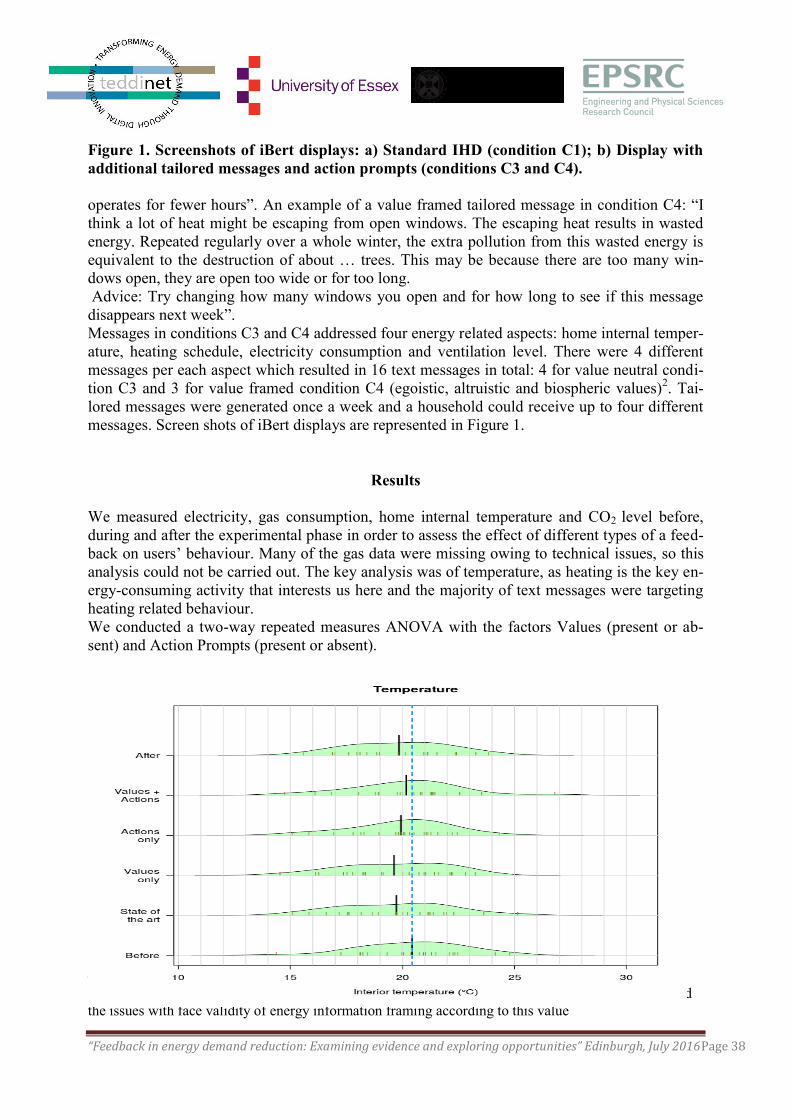
“Feedback in energy demand reduction: Examining evidence and exploring opportunities” Edinburgh, July 2016Page 38
Figure 1. Screenshots of iBert displays: a) Standard IHD (condition C1); b) Display with
additional tailored messages and action prompts (conditions C3 and C4).
operates for fewer hours”. An example of a value framed tailored message in condition C4: “I
think a lot of heat might be escaping from open windows. The escaping heat results in wasted
energy. Repeated regularly over a whole winter, the extra pollution from this wasted energy is
equivalent to the destruction of about … trees. This may be because there are too many win-
dows open, they are open too wide or for too long.
Advice: Try changing how many windows you open and for how long to see if this message
disappears next week”.
Messages in conditions C3 and C4 addressed four energy related aspects: home internal temper-
ature, heating schedule, electricity consumption and ventilation level. There were 4 different
messages per each aspect which resulted in 16 text messages in total: 4 for value neutral condi-
tion C3 and 3 for value framed condition C4 (egoistic, altruistic and biospheric values)2. Tai-
lored messages were generated once a week and a household could receive up to four different
messages. Screen shots of iBert displays are represented in Figure 1.
Results
We measured electricity, gas consumption, home internal temperature and CO2 level before,
during and after the experimental phase in order to assess the effect of different types of a feed-
back on users’ behaviour. Many of the gas data were missing owing to technical issues, so this
analysis could not be carried out. The key analysis was of temperature, as heating is the key en-
ergy-consuming activity that interests us here and the majority of text messages were targeting
heating related behaviour. We conducted a two-way repeated measures ANOVA with the factors Values (present or ab-
sent) and Action Prompts (present or absent).
2 Hedonic value framing was excluded from the study for the reason that our pilot studies demonstrated
the issues with face validity of energy information framing according to this value
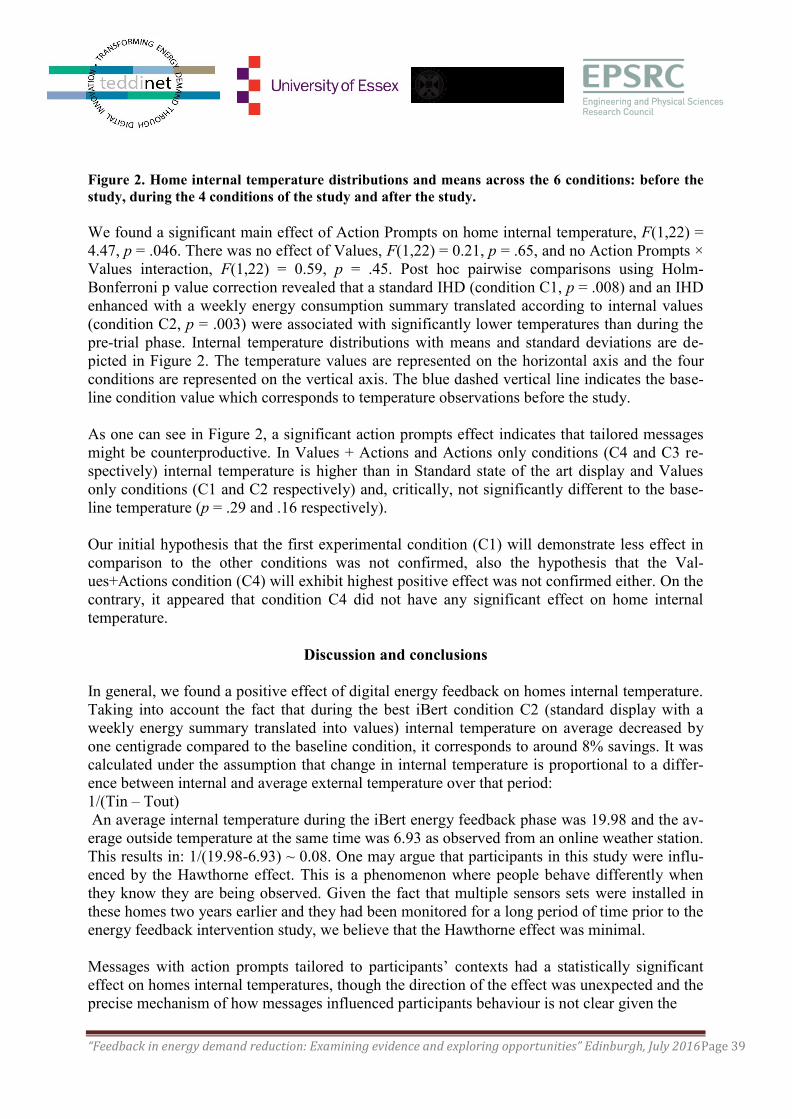
“Feedback in energy demand reduction: Examining evidence and exploring opportunities” Edinburgh, July 2016Page 39
Figure 2. Home internal temperature distributions and means across the 6 conditions: before the
study, during the 4 conditions of the study and after the study.
We found a significant main effect of Action Prompts on home internal temperature, F(1,22) =
4.47, p = .046. There was no effect of Values, F(1,22) = 0.21, p = .65, and no Action Prompts ×
Values interaction, F(1,22) = 0.59, p = .45. Post hoc pairwise comparisons using Holm-
Bonferroni p value correction revealed that a standard IHD (condition C1, p = .008) and an IHD
enhanced with a weekly energy consumption summary translated according to internal values
(condition C2, p = .003) were associated with significantly lower temperatures than during the
pre-trial phase. Internal temperature distributions with means and standard deviations are de-
picted in Figure 2. The temperature values are represented on the horizontal axis and the four
conditions are represented on the vertical axis. The blue dashed vertical line indicates the base-
line condition value which corresponds to temperature observations before the study.
As one can see in Figure 2, a significant action prompts effect indicates that tailored messages
might be counterproductive. In Values + Actions and Actions only conditions (C4 and C3 re-
spectively) internal temperature is higher than in Standard state of the art display and Values
only conditions (C1 and C2 respectively) and, critically, not significantly different to the base-
line temperature (p = .29 and .16 respectively).
Our initial hypothesis that the first experimental condition (C1) will demonstrate less effect in
comparison to the other conditions was not confirmed, also the hypothesis that the Val-
ues+Actions condition (C4) will exhibit highest positive effect was not confirmed either. On the
contrary, it appeared that condition C4 did not have any significant effect on home internal
temperature.
Discussion and conclusions
In general, we found a positive effect of digital energy feedback on homes internal temperature.
Taking into account the fact that during the best iBert condition C2 (standard display with a
weekly energy summary translated into values) internal temperature on average decreased by
one centigrade compared to the baseline condition, it corresponds to around 8% savings. It was
calculated under the assumption that change in internal temperature is proportional to a differ-
ence between internal and average external temperature over that period:
1/(Tin – Tout)
An average internal temperature during the iBert energy feedback phase was 19.98 and the av-
erage outside temperature at the same time was 6.93 as observed from an online weather station.
This results in: 1/(19.98-6.93) ~ 0.08. One may argue that participants in this study were influ-
enced by the Hawthorne effect. This is a phenomenon where people behave differently when
they know they are being observed. Given the fact that multiple sensors sets were installed in
these homes two years earlier and they had been monitored for a long period of time prior to the
energy feedback intervention study, we believe that the Hawthorne effect was minimal.
Messages with action prompts tailored to participants’ contexts had a statistically significant
effect on homes internal temperatures, though the direction of the effect was unexpected and the
precise mechanism of how messages influenced participants behaviour is not clear given the
“Feedback in energy demand reduction: Examining evidence and exploring opportunities” Edinburgh, July 2016Page 40
absence of gas consumption data for many homes. It would be most accurate to say, from these
data, that the specific action prompts inhibited the temperature-reduction behaviours exhibited
by participants given a standard IHD. For future work, gas consumption should be measured as
a direct indicator of energy usage behaviour rather than home internal temperature which is an
indirect and thus a less reliable measure of energy related behaviour. It was found in this study
that tailored messages with action prompts resulted in increased internal temperature during the
digital feedback period which can be explained either by limiting the choice of participants' en-
ergy savings actions repertoire while providing only one type of action suggestion, or partially
by the effect of action prompts directed at thermal energy conservation measures such as clos-
ing windows.
The absence of effect of value framing can be explained by the fact that messages were not tai-
lored to participant’s values and/or were not appropriately framed according to values. Values
operationalization is very subjective and messages could address other values than we intended
them to do. Another possible explanation might be that people were already motivated to par-
ticipate in this study, and increasing motivation with values did not add to more motivation.
Our findings suggest that the effect of tailored action prompts and value framing in this form as
it was done during this study can be counterproductive as a standard IHD had an even better
effect. This brings us to a conclusion that either value framing and action prompts should be
done in a much more sophisticated way in order to truly engage and influence users or it is not
necessary at all given the amount of efforts required to develop these aspects in a better way.
Moreover, energy related behaviour is too complex to address it in a simplistic manner. IHDs
have definitely a potential to induce some behaviour change, but in order to achieve a greater
effect a more holistic and integrated approach at a socio-political level is needed. Relying only
on IHDs is an attempt to solve a social problem with a technological approach (Brynjarsdottir et
al, 2012), which is not sufficient.
In future we plan to perform a more detailed analysis of the effect of specific messages and an
additional analysis of user experience. We also plan to analyse the effect of a digital feedback
on psychological variables: energy literacy and environmental motivations.
Acknowledgements
This work was done under the auspices of the ENLITEN project, EPSRC grant number
EP/K002724/1.
References
Abrahamse, W., Steg, L., Vlek, C., & Rothengatter, T. (2005). A review of intervention studies
aimed at household energy conservation. Journal of environmental psychology 25, 273--291.
Barbu, A.-D., G. N. & Morton, G. (2013). Achieving energy efficiency through behaviour
change: what does it take?. EEA Technical Report
Brynjarsdottir, H., Håkansson, M., Pierce, J., Baumer, E., DiSalvo, C., & Sengers, P. (2012).
Sustainably unpersuaded: how persuasion narrows our vision of sustainability. In Proceedings
of the SIGCHI Conference on Human Factors in Computing Systems (pp. 947-956). ACM.
“Feedback in energy demand reduction: Examining evidence and exploring opportunities” Edinburgh, July 2016Page 41
Buchanan, K., Russo, R., & Anderson, B. (2014). Feeding back about eco-feedback: How do
consumers use and respond to energy monitors? Energy Policy 73, 138--146.
Darby, S. (2001). Making it obvious: designing feedback into energy consumption. Energy effi-
ciency in household appliances and lighting. Springer Berlin Heidelberg, 2001. 685-696.
Darby, S. (2010). Smart metering: what potential for householder engagement?. Building Re-
search \& Information 38, 442--457.
Fischer, C. (2008). Feedback on household electricity consumption: a tool for saving energy?.
Energy efficiency 1, 79--104.
Fitzpatrick, G. & Smith, G. (2009). Technology-enabled feedback on domestic energy con-
sumption: Articulating a set of design concerns. Pervasive Computing, IEEE 8, 37--44.
Hargreaves, T., Nye, M., & Burgess, J. (2010) Making energy visible: A qualitative field study
of how householders interact with feedback from smart energy monitors. Energy Policy 38,
6111--6119.
Pierce, J., Fan, C., Lomas, D., Marcu, G., & Paulos, E. (2010). Some consideration on the (in)
effectiveness of residential energy feedback systems, 244--247.
Karatasou, S., Laskari, M., & Santamouris, M. (2014). Models of behavior change and residen-
tial energy use: a review of research directions and findings for behavior-based energy efficien-
cy. Advances in Building Energy Research, 8(2), 137-147.
Schwartz, S. H. (1992). Universals in the content and structure of values: Theoretical advances
and empirical tests in 20 countries. Advances in experimental social psychology, 25, 1-65.
Steg, L., Bolderdijk, J. W., Keizer, K., & Perlaviciute, G. (2014). An integrated framework for
encouraging pro-environmental behaviour: The role of values, situational factors and
goals. Journal of Environmental Psychology, 38, 104-115.
Steg, L., Perlaviciute, G., Van der Werff, E., & Lurvink, J. (2012). The significance of hedonic
values for environmentally relevant attitudes, preferences, and actions. Environment and behav-
ior, 0013916512454730.
“Feedback in energy demand reduction: Examining evidence and exploring opportunities” Edinburgh, July 2016Page 42
Mental Model Interface Design – Putting Users in Control
Kirsten M.A. Revell & Neville A Stanton, Human Factors Engineering, Engineering Centre of
Excellence, University of Southampton *Presented by [email protected]
Abstract
A study was undertaken to test the hypothesis that interface design can influence the achieve-
ment of home heating goals, by encouraging appropriate behaviour through the evocation of
appropriate user mental models (UMMs). 20 pairs of participants matched by age, gender and
home heating experience were tasked with completing set home heating goals using an acceler-
ated home heating simulator. The impact of specific design features presented in a novel inter-
face design were compared to that of a more traditional interface. Evidence that design features
contributed to differences in UMMs, intentional behaviour, and goal achievement was ob-
served. A mental model approach to design is proposed as a means of putting users ‘in control’
of their heating system and enabling them to better fulfil their home heating goals.
Introduction
It is easy to save energy in the home - just don’t turn the heating on (Sauer, 2009). The real
challenge is using energy effectively and efficiently, not just saving it. Using energy effectively
to meet realistic heating goals is no mean feat (Revell & Stanton, 2014). Doing so in a way that
minimises waste is rife with difficulties when using devices that were not designed with this
emphasis (Sauer, 2009; Revell & Stanton, 2016).
Occupant behaviour is a key variable affecting the amount of energy used in homes (Lutzenhis-
er & Bender, 2008; Emery & Kippenham, 2006; Guerra -Santin & Itard, 2010; Dalla Rosa &
Christensen, 2011; Raaij & Verhallen, 1983). Kempton (1986) discovered variations in the way
occupants behaved with their home heating thermostat could be explained by differences in
their ‘mental model’ of its function. There are many definitions of mental models and different
perspectives from which to consider them (Revell & Stanton, 2012, Wilson & Rutherford 1989,
Richardson & Ball 2009). This paper adopts a combination of the definitions by Norman (1983)
and Keiras & Bovair (1984) and refers to a mental model held by a user (UMM) of a specific
device, that contains information about the operation and function of that device, and has been
accessed and described by an analyst.
Kempton (1986) found that different types of UMMs held by occupants encouraged different
behaviour strategies for saving energy overnight and estimated that considerable energy savings
could result if specific UMMs of thermostat function were promoted to domestic users. Misun-
derstandings about how to operating home heating controls remains a present day problem
(Brown & Cole, 2009; Revell & Stanton, 2014; 2015; 2016, Shipworth et al., 2010). Kempton’s
findings were expanded by Revell & Stanton (2014; 2015) to consider functional UMMs of all
home heating controls present in the home, as well as their interactions at a system level. They
found incomplete or inappropriate UMMs at a device and system level explained differences in
behaviour strategies that either wasted energy or jeopardised comfort goals. This means many
users are not, ultimately, in control of their home heating system.
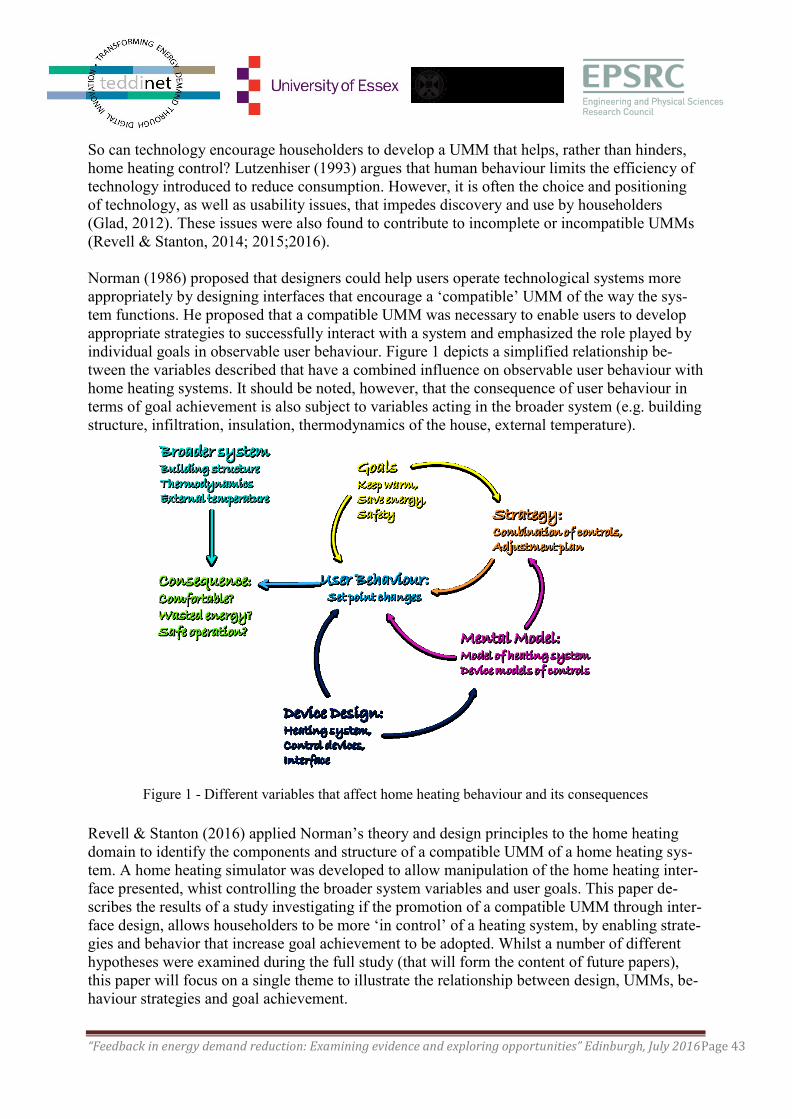
“Feedback in energy demand reduction: Examining evidence and exploring opportunities” Edinburgh, July 2016Page 43
So can technology encourage householders to develop a UMM that helps, rather than hinders,
home heating control? Lutzenhiser (1993) argues that human behaviour limits the efficiency of
technology introduced to reduce consumption. However, it is often the choice and positioning
of technology, as well as usability issues, that impedes discovery and use by householders
(Glad, 2012). These issues were also found to contribute to incomplete or incompatible UMMs
(Revell & Stanton, 2014; 2015;2016).
Norman (1986) proposed that designers could help users operate technological systems more
appropriately by designing interfaces that encourage a ‘compatible’ UMM of the way the sys-
tem functions. He proposed that a compatible UMM was necessary to enable users to develop
appropriate strategies to successfully interact with a system and emphasized the role played by
individual goals in observable user behaviour. Figure 1 depicts a simplified relationship be-
tween the variables described that have a combined influence on observable user behaviour with
home heating systems. It should be noted, however, that the consequence of user behaviour in
terms of goal achievement is also subject to variables acting in the broader system (e.g. building
structure, infiltration, insulation, thermodynamics of the house, external temperature).
Figure 1 - Different variables that affect home heating behaviour and its consequences
Revell & Stanton (2016) applied Norman’s theory and design principles to the home heating
domain to identify the components and structure of a compatible UMM of a home heating sys-
tem. A home heating simulator was developed to allow manipulation of the home heating inter-
face presented, whist controlling the broader system variables and user goals. This paper de-
scribes the results of a study investigating if the promotion of a compatible UMM through inter-
face design, allows householders to be more ‘in control’ of a heating system, by enabling strate-
gies and behavior that increase goal achievement to be adopted. Whilst a number of different
hypotheses were examined during the full study (that will form the content of future papers),
this paper will focus on a single theme to illustrate the relationship between design, UMMs, be-
haviour strategies and goal achievement.
“Feedback in energy demand reduction: Examining evidence and exploring opportunities” Edinburgh, July 2016Page 44
Method
The hypotheses and results described in this paper are tailored to the design features, mental
model elements, behaviour strategies and goal attainment that are linked to boiler activation.
The design
feature emphasised in the experimental condition explicitly promotes understanding of the
‘conditional rule’. This refers to the prerequisite for boiler activation, of the thermostat device
to be ‘calling for heat’ at the same time as a programmed ‘on’ period, or boost activation.
Whilst statistical tests reported will relate to mental model elements and functions with broader
scope than boiler activation, evidence of the ‘conditional rule’ in UMMs will be drilled into to
illustrate links between interface design and UMMs. Behaviour strategies pertinent to aware-
ness of the ‘conditional rule’ in the context of this specific simulation environment will be ex-
amined to illustrate the link between UMM contents and behaviour. Goal attainment linked to
those identified behaviour strategies will be considered to illustrate the cascading effect of de-
sign changes, (via UMMs and behaviour) on home heating goals.
Experimental Design
A between-subjects design was adopted. The version of the interface presented to participants
(either ‘Realistic’ or ‘Design’) represents the independent variable. The number of: a) appropri-
ate functional UMMs of key controls (Programmer, Boost, Thermostat and Thermostatic Radia-
tor Valve (TRV)); and b) the 18 key UMM system elements (including the ‘conditional rule’)
represent the dependent variables to test Hypothesis 1,‘The Device Design Influences UMMs of
those Devices’. Hypothesis 2 states that ‘UMMs of Devices influence the Pattern of Device
Use’. The number of set point adjustments that resulted in a change of state of boiler activation,
was used as the dependent variable. Finally, Hypothesis 3 states that ‘Strategies of Device Use
Influence the Amount of Goal Achievement’. Duration of goal achievement was examined for
the dependent variable for hypothesis 3.
Participants
40 participants took part in this experiment, 20 per condition. 10 males and 10 females were in
each condition from ages ranging between 23 and 70 years (Mean=38). Pairs in each condition
were matched by gender, age category, and the number of years’ experience with central heat-
ing (+/-2 years). Experience with gas central heating (with radiators) ranged from 4 to 40 years,
with a median of 12 years. Participants were all native English speakers and were recruited
from staff, students, and residents local to the University of Southampton. Participants were re-
cruited through posters on University notice boards and websites.
Apparatus & Procedure
Individual participants were presented with a version of the home heating simulation, matched
to their experimental condition. The simulation was displayed on a Samsung LE40M67BD 40”
TV monitor attached to a DELL Latitude E6400 laptop. This was connected to the internet
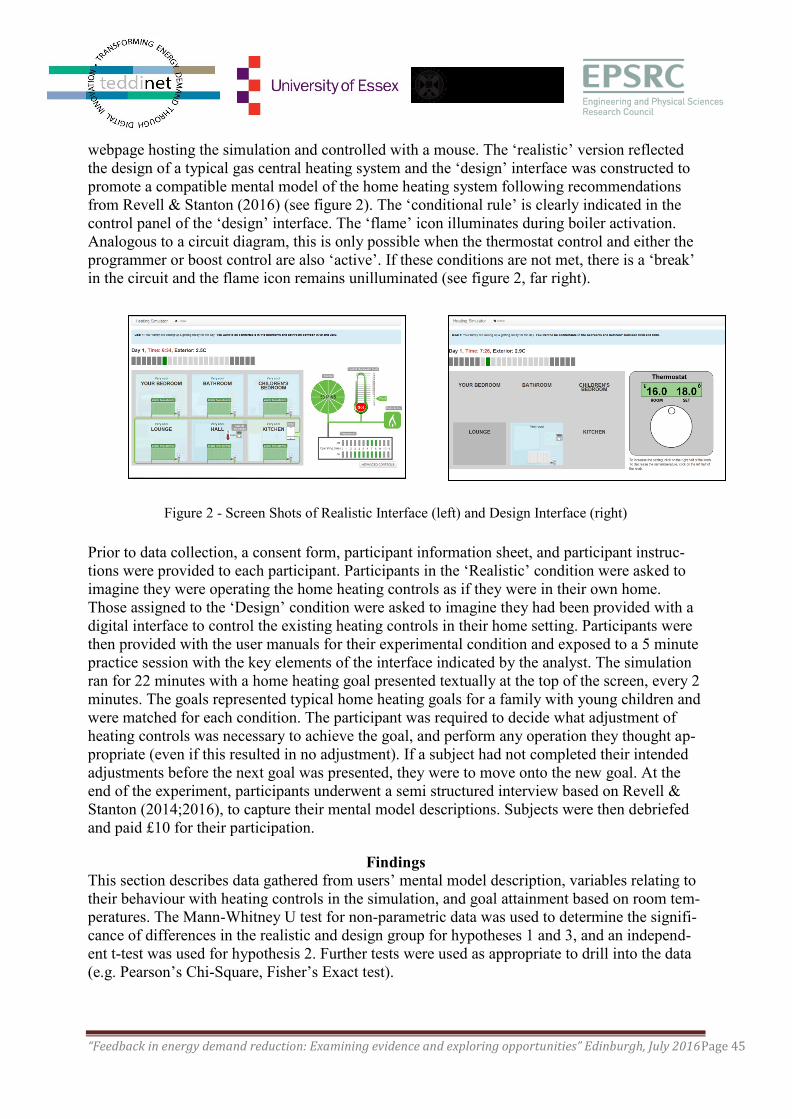
“Feedback in energy demand reduction: Examining evidence and exploring opportunities” Edinburgh, July 2016Page 45
webpage hosting the simulation and controlled with a mouse. The ‘realistic’ version reflected
the design of a typical gas central heating system and the ‘design’ interface was constructed to
promote a compatible mental model of the home heating system following recommendations
from Revell & Stanton (2016) (see figure 2). The ‘conditional rule’ is clearly indicated in the
control panel of the ‘design’ interface. The ‘flame’ icon illuminates during boiler activation.
Analogous to a circuit diagram, this is only possible when the thermostat control and either the
programmer or boost control are also ‘active’. If these conditions are not met, there is a ‘break’
in the circuit and the flame icon remains unilluminated (see figure 2, far right).
Figure 2 - Screen Shots of Realistic Interface (left) and Design Interface (right)
Prior to data collection, a consent form, participant information sheet, and participant instruc-
tions were provided to each participant. Participants in the ‘Realistic’ condition were asked to
imagine they were operating the home heating controls as if they were in their own home.
Those assigned to the ‘Design’ condition were asked to imagine they had been provided with a
digital interface to control the existing heating controls in their home setting. Participants were
then provided with the user manuals for their experimental condition and exposed to a 5 minute
practice session with the key elements of the interface indicated by the analyst. The simulation
ran for 22 minutes with a home heating goal presented textually at the top of the screen, every 2
minutes. The goals represented typical home heating goals for a family with young children and
were matched for each condition. The participant was required to decide what adjustment of
heating controls was necessary to achieve the goal, and perform any operation they thought ap-
propriate (even if this resulted in no adjustment). If a subject had not completed their intended
adjustments before the next goal was presented, they were to move onto the new goal. At the
end of the experiment, participants underwent a semi structured interview based on Revell &
Stanton (2014;2016), to capture their mental model descriptions. Subjects were then debriefed
and paid £10 for their participation.
Findings
This section describes data gathered from users’ mental model description, variables relating to
their behaviour with heating controls in the simulation, and goal attainment based on room tem-
peratures. The Mann-Whitney U test for non-parametric data was used to determine the signifi-
cance of differences in the realistic and design group for hypotheses 1 and 3, and an independ-
ent t-test was used for hypothesis 2. Further tests were used as appropriate to drill into the data
(e.g. Pearson’s Chi-Square, Fisher’s Exact test).
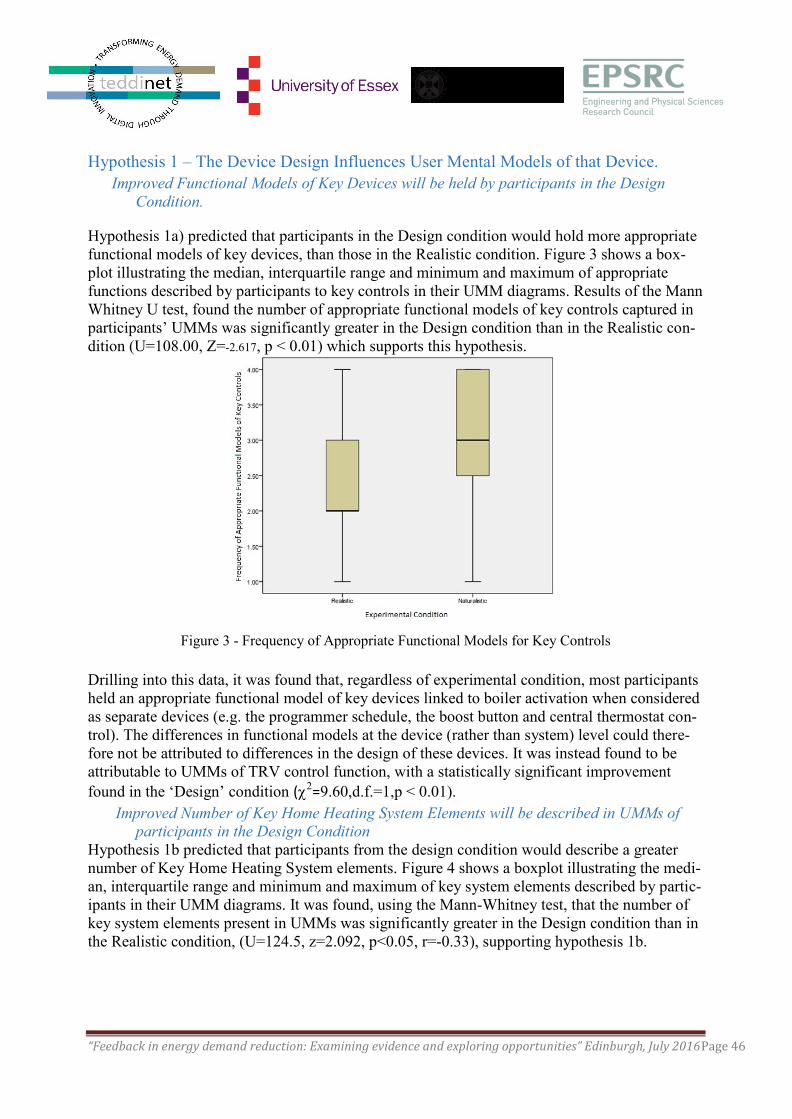
“Feedback in energy demand reduction: Examining evidence and exploring opportunities” Edinburgh, July 2016Page 46
Hypothesis 1 – The Device Design Influences User Mental Models of that Device.
Improved Functional Models of Key Devices will be held by participants in the Design
Condition.
Hypothesis 1a) predicted that participants in the Design condition would hold more appropriate
functional models of key devices, than those in the Realistic condition. Figure 3 shows a box-
plot illustrating the median, interquartile range and minimum and maximum of appropriate
functions described by participants to key controls in their UMM diagrams. Results of the Mann
Whitney U test, found the number of appropriate functional models of key controls captured in
participants’ UMMs was significantly greater in the Design condition than in the Realistic con-
dition (U=108.00, Z=-2.617, p < 0.01) which supports this hypothesis.
Figure 3 - Frequency of Appropriate Functional Models for Key Controls
Drilling into this data, it was found that, regardless of experimental condition, most participants
held an appropriate functional model of key devices linked to boiler activation when considered
as separate devices (e.g. the programmer schedule, the boost button and central thermostat con-
trol). The differences in functional models at the device (rather than system) level could there-
fore not be attributed to differences in the design of these devices. It was instead found to be
attributable to UMMs of TRV control function, with a statistically significant improvement
found in the ‘Design’ condition (=9.60,d.f.=1,p < 0.01).
Improved Number of Key Home Heating System Elements will be described in UMMs of
participants in the Design Condition
Hypothesis 1b predicted that participants from the design condition would describe a greater
number of Key Home Heating System elements. Figure 4 shows a boxplot illustrating the medi-
an, interquartile range and minimum and maximum of key system elements described by partic-
ipants in their UMM diagrams. It was found, using the Mann-Whitney test, that the number of
key system elements present in UMMs was significantly greater in the Design condition than in
the Realistic condition, (U=124.5, z=2.092, p<0.05, r=-0.33), supporting hypothesis 1b.
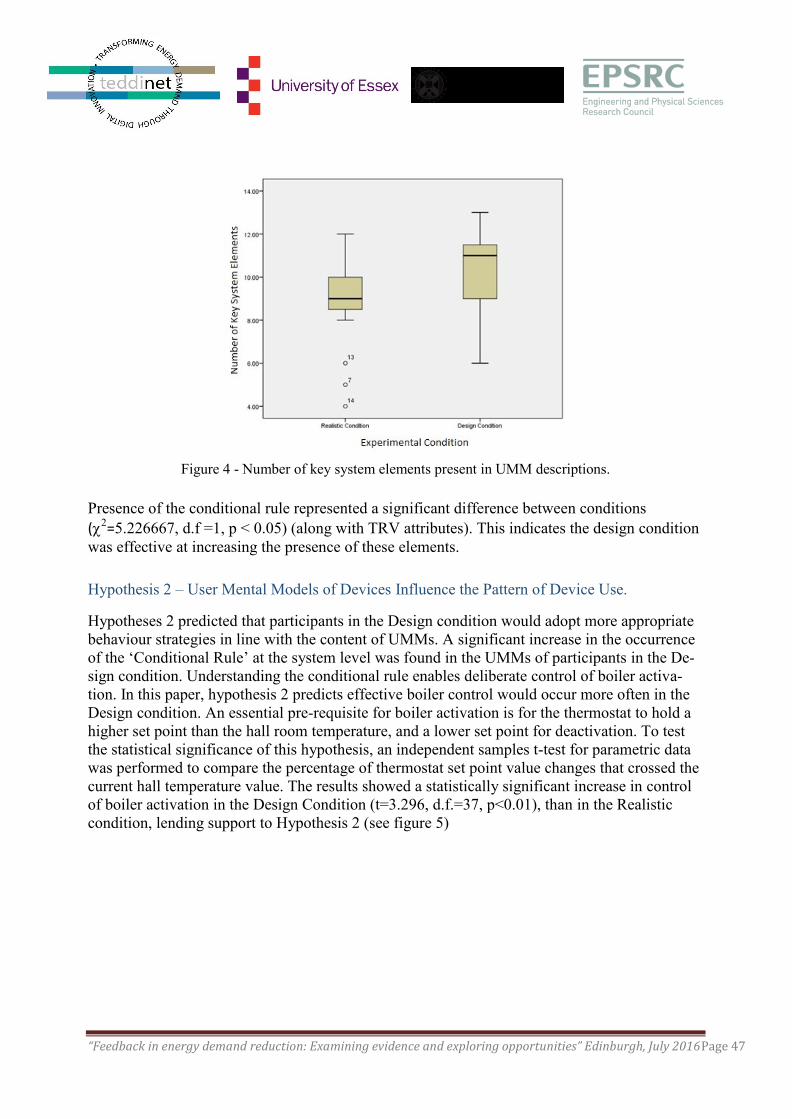
“Feedback in energy demand reduction: Examining evidence and exploring opportunities” Edinburgh, July 2016Page 47
Figure 4 - Number of key system elements present in UMM descriptions.
Presence of the conditional rule represented a significant difference between conditions (=5.226667, d.f =1, p < 0.05) (along with TRV attributes). This indicates the design condition
was effective at increasing the presence of these elements.
Hypothesis 2 – User Mental Models of Devices Influence the Pattern of Device Use.
Hypotheses 2 predicted that participants in the Design condition would adopt more appropriate
behaviour strategies in line with the content of UMMs. A significant increase in the occurrence
of the ‘Conditional Rule’ at the system level was found in the UMMs of participants in the De-
sign condition. Understanding the conditional rule enables deliberate control of boiler activa-
tion. In this paper, hypothesis 2 predicts effective boiler control would occur more often in the
Design condition. An essential pre-requisite for boiler activation is for the thermostat to hold a
higher set point than the hall room temperature, and a lower set point for deactivation. To test
the statistical significance of this hypothesis, an independent samples t-test for parametric data
was performed to compare the percentage of thermostat set point value changes that crossed the
current hall temperature value. The results showed a statistically significant increase in control
of boiler activation in the Design Condition (t=3.296, d.f.=37, p<0.01), than in the Realistic
condition, lending support to Hypothesis 2 (see figure 5)
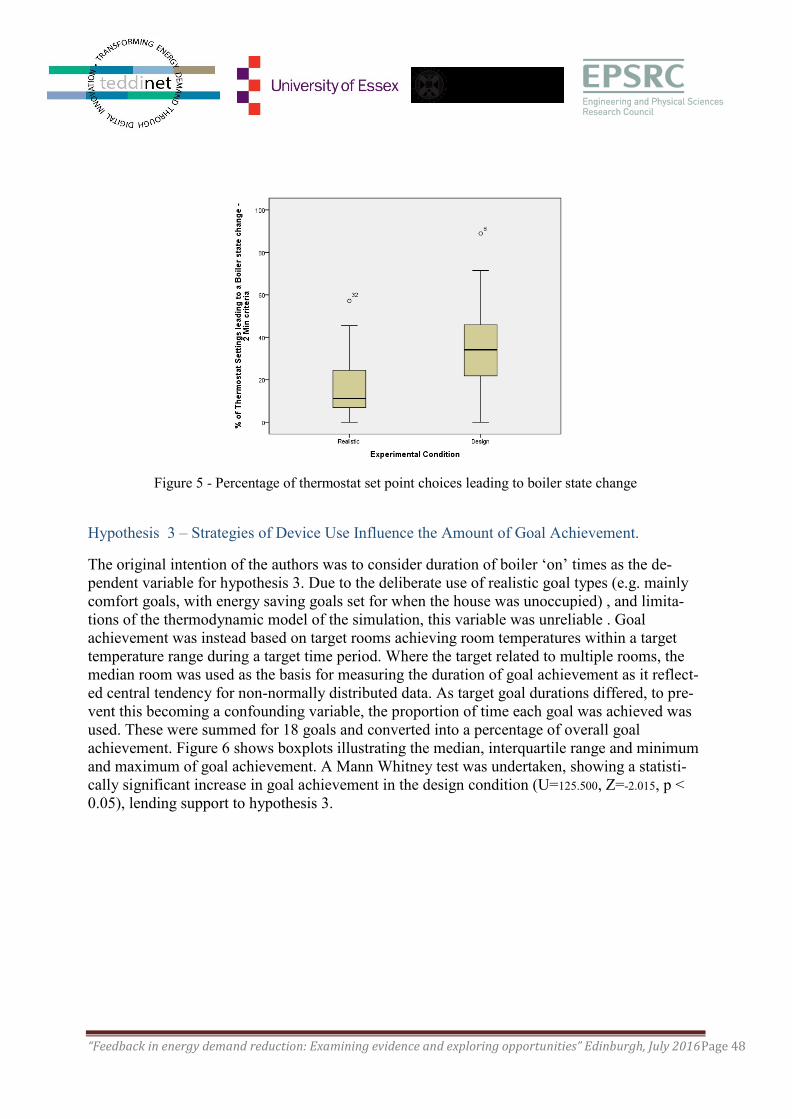
“Feedback in energy demand reduction: Examining evidence and exploring opportunities” Edinburgh, July 2016Page 48
Figure 5 - Percentage of thermostat set point choices leading to boiler state change
Hypothesis 3 – Strategies of Device Use Influence the Amount of Goal Achievement.
The original intention of the authors was to consider duration of boiler ‘on’ times as the de-
pendent variable for hypothesis 3. Due to the deliberate use of realistic goal types (e.g. mainly
comfort goals, with energy saving goals set for when the house was unoccupied) , and limita-
tions of the thermodynamic model of the simulation, this variable was unreliable . Goal
achievement was instead based on target rooms achieving room temperatures within a target
temperature range during a target time period. Where the target related to multiple rooms, the
median room was used as the basis for measuring the duration of goal achievement as it reflect-
ed central tendency for non-normally distributed data. As target goal durations differed, to pre-
vent this becoming a confounding variable, the proportion of time each goal was achieved was
used. These were summed for 18 goals and converted into a percentage of overall goal
achievement. Figure 6 shows boxplots illustrating the median, interquartile range and minimum
and maximum of goal achievement. A Mann Whitney test was undertaken, showing a statisti-
cally significant increase in goal achievement in the design condition (U=125.500, Z=-2.015, p <
0.05), lending support to hypothesis 3.
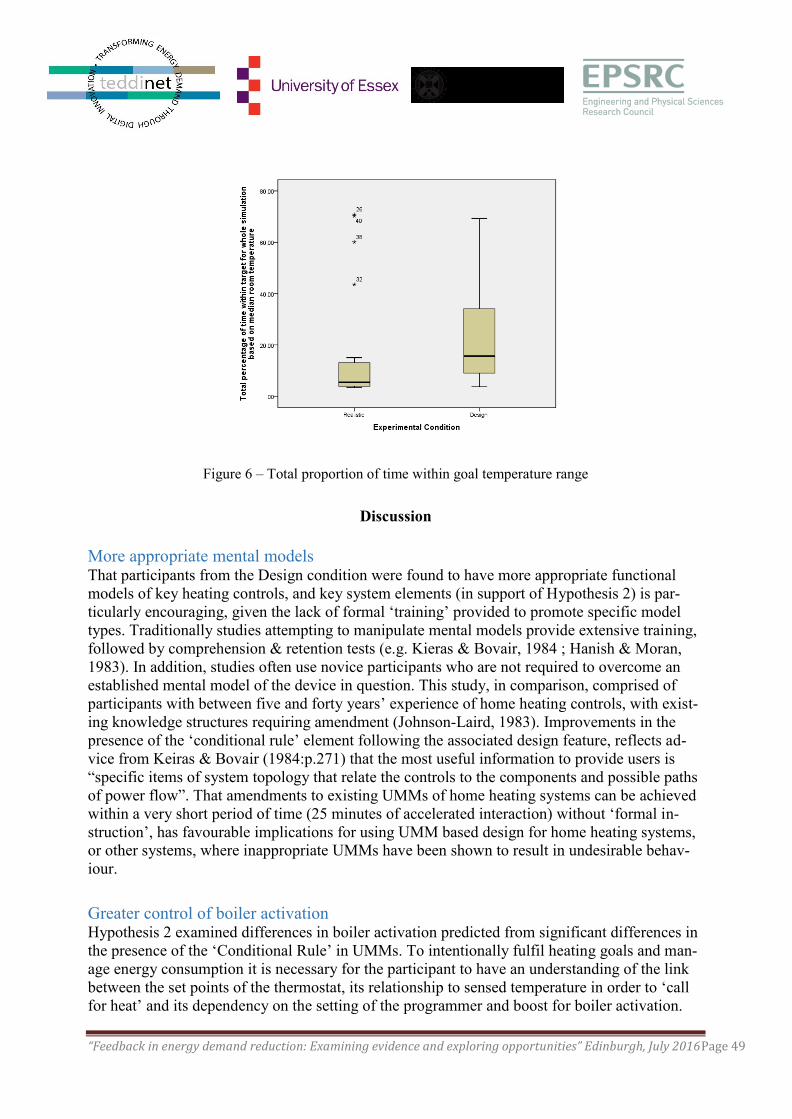
“Feedback in energy demand reduction: Examining evidence and exploring opportunities” Edinburgh, July 2016Page 49
Figure 6 – Total proportion of time within goal temperature range
Discussion
More appropriate mental models That participants from the Design condition were found to have more appropriate functional
models of key heating controls, and key system elements (in support of Hypothesis 2) is par-
ticularly encouraging, given the lack of formal ‘training’ provided to promote specific model
types. Traditionally studies attempting to manipulate mental models provide extensive training,
followed by comprehension & retention tests (e.g. Kieras & Bovair, 1984 ; Hanish & Moran,
1983). In addition, studies often use novice participants who are not required to overcome an
established mental model of the device in question. This study, in comparison, comprised of
participants with between five and forty years’ experience of home heating controls, with exist-
ing knowledge structures requiring amendment (Johnson-Laird, 1983). Improvements in the
presence of the ‘conditional rule’ element following the associated design feature, reflects ad-
vice from Keiras & Bovair (1984:p.271) that the most useful information to provide users is
“specific items of system topology that relate the controls to the components and possible paths
of power flow”. That amendments to existing UMMs of home heating systems can be achieved
within a very short period of time (25 minutes of accelerated interaction) without ‘formal in-
struction’, has favourable implications for using UMM based design for home heating systems,
or other systems, where inappropriate UMMs have been shown to result in undesirable behav-
iour.
Greater control of boiler activation Hypothesis 2 examined differences in boiler activation predicted from significant differences in
the presence of the ‘Conditional Rule’ in UMMs. To intentionally fulfil heating goals and man-
age energy consumption it is necessary for the participant to have an understanding of the link
between the set points of the thermostat, its relationship to sensed temperature in order to ‘call
for heat’ and its dependency on the setting of the programmer and boost for boiler activation.
“Feedback in energy demand reduction: Examining evidence and exploring opportunities” Edinburgh, July 2016Page 50
Whilst a static thermostat set point is encouraged in manuals and by expert advice (Revell &
Stanton, 2016), this was not observed in either condition in this study, as all participants made
adjustments to the thermostat set point throughout the simulation. However, the appropriate set
point choice for a household requires an appreciation of the thermodynamics of the house struc-
ture. Crossman & Cooke (1974) emphasize that operator control of dynamic systems requires
sufficient time for experiment and observation, which was not provided to participants in this
experiment. In addition, the (unintended) non-typical thermodynamic model for the simulation
resulted in particularly high temperatures in the hall where the central thermostat was located.
This meant that far higher set point values would be necessary to activate the boiler, than partic-
ipants would be used to selecting at home. Expectations for a static thermostat pattern was un-
reasonable in these circumstances. Results from a t-test supported Hypothesis 2 that participants
in the Design condition operated a greater level of intentional control over the boiler. This result
supports the findings of Keiras & Bovair (1984) who found that participants with an appropriate
UMM of the system engaged in very few ‘nonsense’ actions, favouring behaviours that were
consistent with the device model. As the majority of participants in the Realistic condition had
an appropriate functional UMM for the thermostat device in isolation, their observed behaviour
lends support to Revell & Stanton (2014)’s position that UMMs of home heating must be con-
sidered at the system level if effective behaviour is sought.
Increased goal achievement Participants in the Design condition were also significantly more successful at achieving the
goals provided, supporting Hypothesis 3. To be as realistic as possible, comfort goals made up a
large part of goals and energy conservation was only the focus when the house was to be unoc-
cupied. The proportion of goal achievement was relatively low in both conditions compared to
the results of Sauer et al. (2009), who found between 73% and 94%. They tasked participants
with choosing set points in advance, to achieve a specific daily profile, allowing greater oppor-
tunity for planning and amendment. In contrast this study presented a succession of changing
goals that incorporated not only typical planned changes in comfort goals, but a more realistic
‘ad-hoc’ adjustment of goals throughout the day under time pressure. Greater generalisability of
the results to everyday behaviour is therefore possible by providing more realistic goals in the
simulation. The measure for goal achievement was based on temperature values for rooms ra-
ther than energy consumption or deployment of appropriate action sequences with controls.
This meant that appropriate choices in behaviour (e.g. programmer settings) was not taken into
consideration unless there was an impact on room temperature values within the target time pe-
riod. Further analysis that matches behaviour strategies to specific goals will be the focus of fur-
ther work. In addition, an improved thermodynamic model for the home heating simulation,
and greater ability to reflect typical behaviour strategies (e.g. opening doors to distribute heat),
is required to seek evidence that this approach generalizes to energy saving goals.
Conclusions
Differences in the design of an interface have been shown to change the content of mental mod-
el descriptions. In this simulation, design features from a novel interface improved the number
of key system elements, and the appropriateness of the function of key heating controls, present
in UMM descriptions. The increased presence of key system elements, such as the ‘conditional
rule’ in participants’ UMMs exposed to the Design condition, explained their more effective
‘control’ of boiler activation, which contributed to their greater goal achievement. From this, it
“Feedback in energy demand reduction: Examining evidence and exploring opportunities” Edinburgh, July 2016Page 51
is concluded that a mental models approach to design can give householders greater control of
their heating system to deliberately, rather than incidentally, realise their home heating goals.
References
Brown, Z. & Cole, R. J. 2009. Influence of occupants' knowledge on comfort expectations and
behaviour. Building Research and Information, 37 (3), 227-245.
Crossman, E. R. F. W. & Cooke, J. E., 1974. Manual Control of Slow-Response Systems. In:
Edwards, E. & Lees, F. (eds.) The Human Operator in Process Control. London: Taylor
& Francis,51-66.
Dalla Rosa, A. & Christensen, J. E. 2011. Low-energy district heating in energy-efficient
building areas. Energy, 36 (12), 6890-6899.
Emery, A. F. & Kippenhan, C. J. 2006. A long term study of residential home heating
consumption an the effect of occupant behavior on homes in the Pacific Northwest
constructed according to improved thermal standards. Energy, 31 (5), 677-693.
Glad, W. 2012. Housing renovation and energy systems: the need for social learning. Building
Research and Information, 40 (3), 274-289.
Guerra-Santin, O. & Itarda, L. 2010. Occupants' behaviour: determinants and effects on
residential heating consumption. Building Research & Information, 38 (3), 318-338.
Kempton, W. 1986. Two Theories of Home Heat Control. Cognitive Science, 10, 75-90.
Kieras, D. E. & Bovair, S. 1984. The Role of a Mental Model in Learning to Operate a Device.
Cognitive Science, 8 (3), 255-273.
Lutzenhiser, L. 1993. Social and Behavioral Aspects of Energy Use. Annual Review of Energy
and the Environment, 18, 247-289.
Lutzenhiser, L. & Bender, S. 2008. The average American unmasked: Social structure and
difference in household energy use and carbon emissions. ACEEE Summer Study on
Energy Efficiency in Buildings.
Norman, D. A., 1983. Some Observations on Mental Models. In: Gentner, D. & Stevens, A. L.
(eds.) Mental Models. Hillsdale, New Jersey: Lawrence Erlbaum Associates,7-14.
Raaij, W. F. V. & Verhallen, T. M. M. 1983. Patterns of Residential Energy Behavior. Journal
of Economic Psychology, 4, 85-106.
Revell, K. M. A. & Stanton, N. A. 2014. Case studies of mental models in home heat control:
Searching for feedback, valve, timer and switch theories. Applied Ergonomics, 45 (3),
363-378.
Revell, K.M. and Stanton, N.A., 2015. When energy saving advice leads to more, rather than
less, consumption. International Journal of Sustainable Energy, pp.1-19.
Revell, K. M. A. & Stanton, N. A. 2012. Models of models: filtering and bias rings in depiction
of knowledge structures and their implications for design. Ergonomics, 55 (9), 1073-
1092.
Revell, K.M. and Stanton, N.A., 2016. Mind the gap–Deriving a compatible user mental model
of the home heating system to encourage sustainable behaviour. Applied Ergonomics
Revell, K. and Stanton, N.A., 2016. The Quick Association Check (QuACk): a resource-
light,‘bias robust’method for exploring the relationship between mental models and be-
haviour patterns with home heating systems. Theoretical Issues in Ergonomics Science,
pp.1-34.
Richardson, M. & Ball, L. J. 2009. Internal Representations, External Representations and
Ergonomics: Toward a Theoretical Integration. Theoretical Issues in Ergonomics
Science, 10 (4), 335-376.

“Feedback in energy demand reduction: Examining evidence and exploring opportunities” Edinburgh, July 2016Page 52
Sauer, J., Wastell, D. G. & Schmeink, C. 2009. Designing for the home: a comparative study of
support aids for central heating systems. Applied Ergonomics, 40. (2), 165-74.
Shipworth, M., Firth, S. K., Gentry, M. I., Wright, A. J., Shipworth, D. T. & Lomas, K. J. 2009.
Central heating thermostat settings and timing: building demographics. Building
Research and Information, 38 (1), 50-69.
Wilson, J.R. and Rutherford, A., 1989. Mental models: Theory and application in human
factors. Human Factors: The Journal of the Human Factors and Ergonomics Society,
31(6), pp.617-634.
“Feedback in energy demand reduction: Examining evidence and exploring opportunities” Edinburgh, July 2016Page 53
Investigating smart metering in the home: how users comprehend graphic
representations of residential electricity feedback systems
Melanie R. Herrmann1*, Duncan P. Brumby
1 and Tadj Oreszczyn
2
1: Interaction Centre, Department of Computer Science, Faculty of Engineering
University College London, 66-72 Gower Street, London WC1E 6BT
e-mail: [email protected], web: https://www.ucl.ac.uk/uclic/people/m-
herrmann
2: The Bartlett School of Environment, Energy and Resources, Energy Institute, Faculty of the
Built Environment, University College London, 14 Upper Woburn Place, London, WC1H
0NN
Abstract
The UK government has committed to rolling out smart meters with in-home displays (IHDs) to
all homes and small businesses by 2020. In addition to smart meters and IHDs provided by utili-
ty companies, there are various residential energy feedback systems (REFS) on the market that
come with mobile apps or websites that give feedback on energy usage information. It is hoped
that these technologies will help people better monitor their consumption and so learn how to
better manage their usage, save money, and reduce emissions. In my PhD research, I am inter-
ested in understanding how people read and interpret the data that is being fed back to them. In
particular, I am trying to find out how they relate the feedback to routines in their household,
i.e. is if they are able to map the given data to everyday actions. Our methodology comprises
both qualitative fieldwork as well as quantitative lab experiments to understand how people un-
derstand residential electricity feedback. We present the results of our field study in which nine
households were interviewed two weeks after installing a commercial electricity-monitoring
device. A critical issue to emerge from these interviews is that people could not make sense of
the data visualization. To further investigate this issue, we describe the results of a lab-based
experiment that was designed to investigate how people learn from different visualizations.
Introduction
Prior research generally suggests that eco-feedback can help people to reduce their energy con-
sumption [1,2,3,4]. However, governmental reports and meta-reviews find that eco-feedback
often doesn’t live up to its intended impact on energy saving [5,6]. Recent studies have also
found that the average user’s energy literacy is low [7,8,9,10], i.e. they have a poor ‘understand-
ing of energy concepts necessary to make informed decisions on energy use’ [8].
The Smart Metering Equipment Technical Specifications (SMETS) state that the ‘IHD shall be
designed to enable the information displayed on it to be easily accessed and presented in a form
that is clear and easy to understand [11]. However, concerns have been raised about how clear
and easy to understand energy data is [12]. While most visualisations tend to represent energy
data using either a line or bar graph, people may not be trained or might find it difficult to read
graphs [13]. Interpreting energy displays takes a lot of cognitive work and few studies have in-
vestigated people’s ability to extract information from such representations [14].
A critical issue here is that conventional energy bills often summarize energy usage over an ex-
tended period of time (usually one or three months). It has been suggested that this kind of
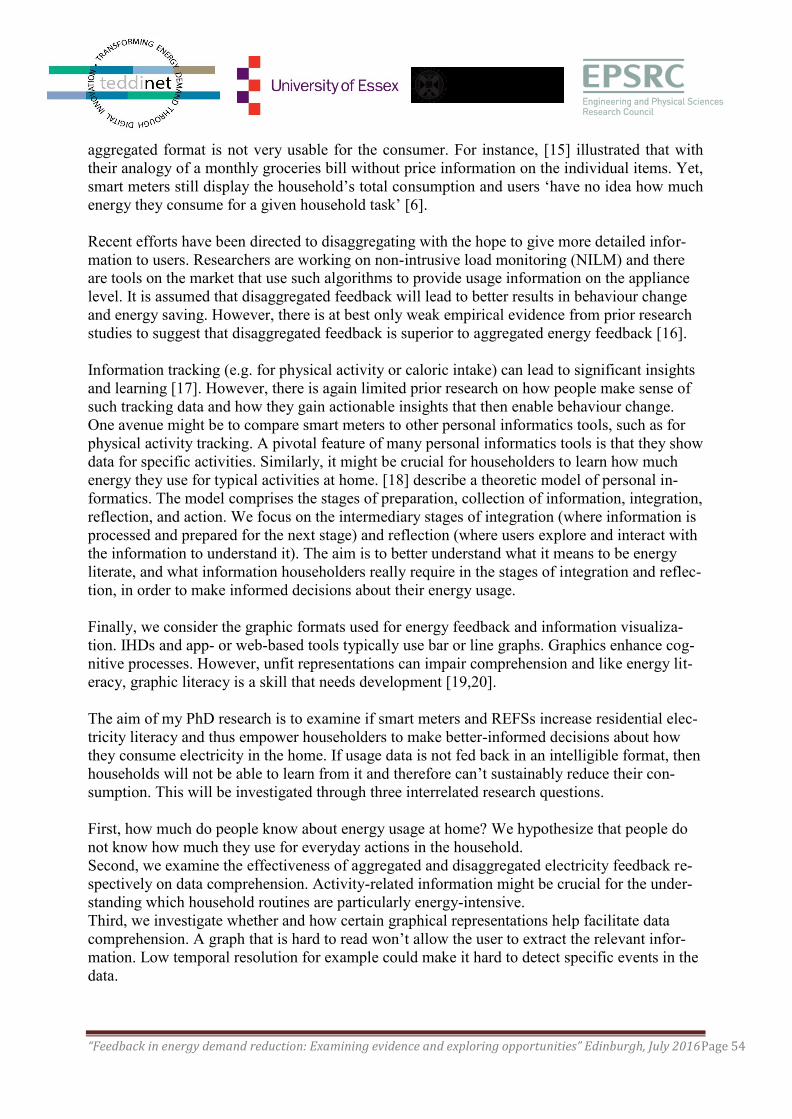
“Feedback in energy demand reduction: Examining evidence and exploring opportunities” Edinburgh, July 2016Page 54
aggregated format is not very usable for the consumer. For instance, [15] illustrated that with
their analogy of a monthly groceries bill without price information on the individual items. Yet,
smart meters still display the household’s total consumption and users ‘have no idea how much
energy they consume for a given household task’ [6].
Recent efforts have been directed to disaggregating with the hope to give more detailed infor-
mation to users. Researchers are working on non-intrusive load monitoring (NILM) and there
are tools on the market that use such algorithms to provide usage information on the appliance
level. It is assumed that disaggregated feedback will lead to better results in behaviour change
and energy saving. However, there is at best only weak empirical evidence from prior research
studies to suggest that disaggregated feedback is superior to aggregated energy feedback [16].
Information tracking (e.g. for physical activity or caloric intake) can lead to significant insights
and learning [17]. However, there is again limited prior research on how people make sense of
such tracking data and how they gain actionable insights that then enable behaviour change.
One avenue might be to compare smart meters to other personal informatics tools, such as for
physical activity tracking. A pivotal feature of many personal informatics tools is that they show
data for specific activities. Similarly, it might be crucial for householders to learn how much
energy they use for typical activities at home. [18] describe a theoretic model of personal in-
formatics. The model comprises the stages of preparation, collection of information, integration,
reflection, and action. We focus on the intermediary stages of integration (where information is
processed and prepared for the next stage) and reflection (where users explore and interact with
the information to understand it). The aim is to better understand what it means to be energy
literate, and what information householders really require in the stages of integration and reflec-
tion, in order to make informed decisions about their energy usage.
Finally, we consider the graphic formats used for energy feedback and information visualiza-
tion. IHDs and app- or web-based tools typically use bar or line graphs. Graphics enhance cog-
nitive processes. However, unfit representations can impair comprehension and like energy lit-
eracy, graphic literacy is a skill that needs development [19,20].
The aim of my PhD research is to examine if smart meters and REFSs increase residential elec-
tricity literacy and thus empower householders to make better-informed decisions about how
they consume electricity in the home. If usage data is not fed back in an intelligible format, then
households will not be able to learn from it and therefore can’t sustainably reduce their con-
sumption. This will be investigated through three interrelated research questions.
First, how much do people know about energy usage at home? We hypothesize that people do
not know how much they use for everyday actions in the household.
Second, we examine the effectiveness of aggregated and disaggregated electricity feedback re-
spectively on data comprehension. Activity-related information might be crucial for the under-
standing which household routines are particularly energy-intensive.
Third, we investigate whether and how certain graphical representations help facilitate data
comprehension. A graph that is hard to read won’t allow the user to extract the relevant infor-
mation. Low temporal resolution for example could make it hard to detect specific events in the
data.
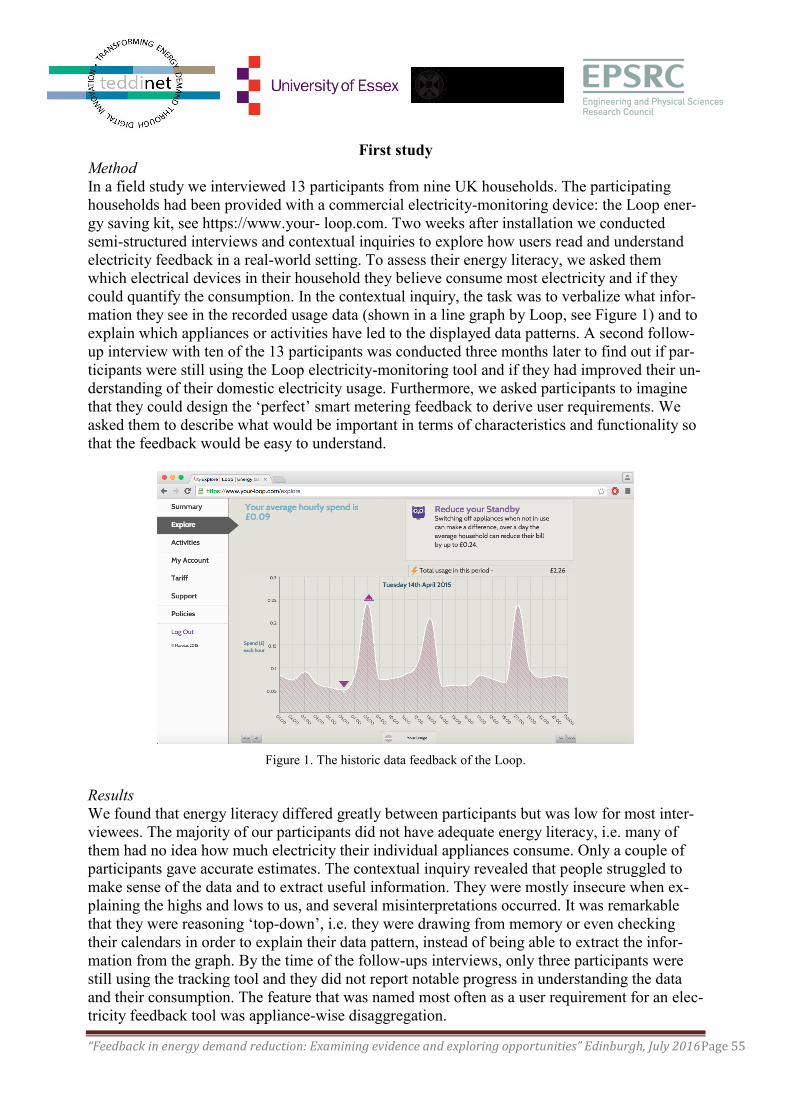
“Feedback in energy demand reduction: Examining evidence and exploring opportunities” Edinburgh, July 2016Page 55
First study
Method
In a field study we interviewed 13 participants from nine UK households. The participating
households had been provided with a commercial electricity-monitoring device: the Loop ener-
gy saving kit, see https://www.your- loop.com. Two weeks after installation we conducted
semi-structured interviews and contextual inquiries to explore how users read and understand
electricity feedback in a real-world setting. To assess their energy literacy, we asked them
which electrical devices in their household they believe consume most electricity and if they
could quantify the consumption. In the contextual inquiry, the task was to verbalize what infor-
mation they see in the recorded usage data (shown in a line graph by Loop, see Figure 1) and to
explain which appliances or activities have led to the displayed data patterns. A second follow-
up interview with ten of the 13 participants was conducted three months later to find out if par-
ticipants were still using the Loop electricity-monitoring tool and if they had improved their un-
derstanding of their domestic electricity usage. Furthermore, we asked participants to imagine
that they could design the ‘perfect’ smart metering feedback to derive user requirements. We
asked them to describe what would be important in terms of characteristics and functionality so
that the feedback would be easy to understand.
Figure 1. The historic data feedback of the Loop.
Results
We found that energy literacy differed greatly between participants but was low for most inter-
viewees. The majority of our participants did not have adequate energy literacy, i.e. many of
them had no idea how much electricity their individual appliances consume. Only a couple of
participants gave accurate estimates. The contextual inquiry revealed that people struggled to
make sense of the data and to extract useful information. They were mostly insecure when ex-
plaining the highs and lows to us, and several misinterpretations occurred. It was remarkable
that they were reasoning ‘top-down’, i.e. they were drawing from memory or even checking
their calendars in order to explain their data pattern, instead of being able to extract the infor-
mation from the graph. By the time of the follow-ups interviews, only three participants were
still using the tracking tool and they did not report notable progress in understanding the data
and their consumption. The feature that was named most often as a user requirement for an elec-
tricity feedback tool was appliance-wise disaggregation.
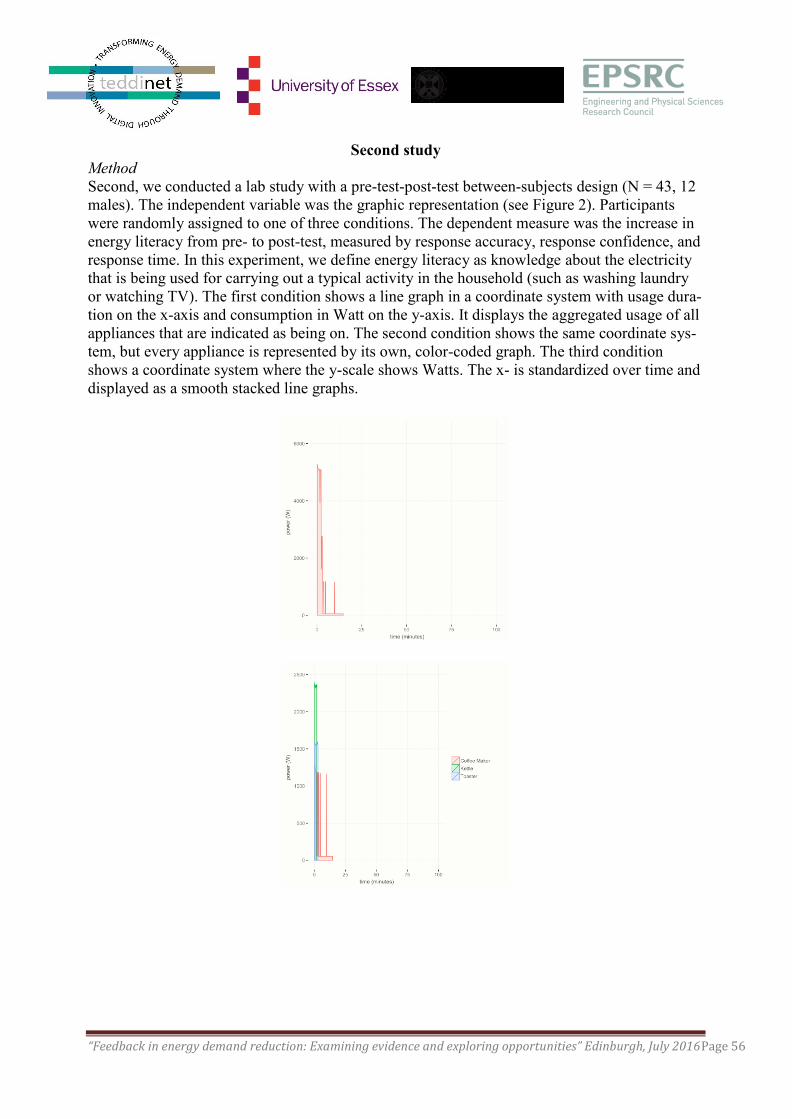
“Feedback in energy demand reduction: Examining evidence and exploring opportunities” Edinburgh, July 2016Page 56
Second study
Method
Second, we conducted a lab study with a pre-test-post-test between-subjects design (N = 43, 12
males). The independent variable was the graphic representation (see Figure 2). Participants
were randomly assigned to one of three conditions. The dependent measure was the increase in
energy literacy from pre- to post-test, measured by response accuracy, response confidence, and
response time. In this experiment, we define energy literacy as knowledge about the electricity
that is being used for carrying out a typical activity in the household (such as washing laundry
or watching TV). The first condition shows a line graph in a coordinate system with usage dura-
tion on the x-axis and consumption in Watt on the y-axis. It displays the aggregated usage of all
appliances that are indicated as being on. The second condition shows the same coordinate sys-
tem, but every appliance is represented by its own, color-coded graph. The third condition
shows a coordinate system where the y-scale shows Watts. The x- is standardized over time and
displayed as a smooth stacked line graphs.
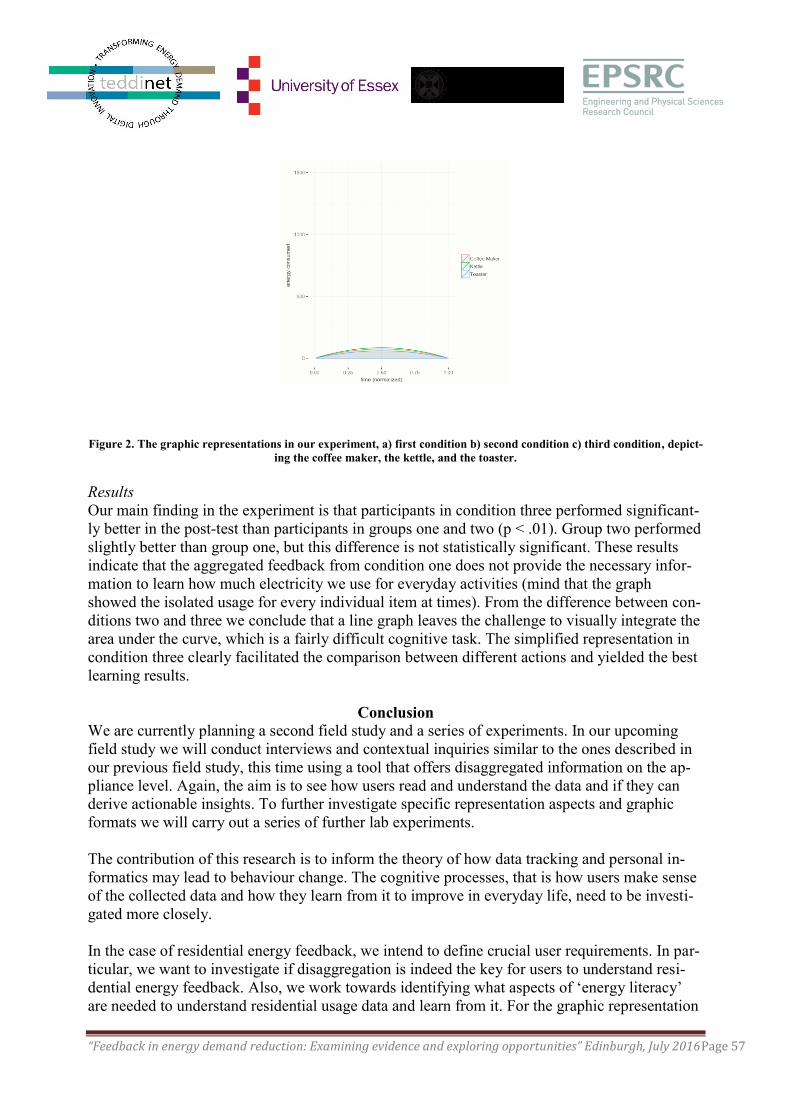
“Feedback in energy demand reduction: Examining evidence and exploring opportunities” Edinburgh, July 2016Page 57
Figure 2. The graphic representations in our experiment, a) first condition b) second condition c) third condition, depict-
ing the coffee maker, the kettle, and the toaster.
Results
Our main finding in the experiment is that participants in condition three performed significant-
ly better in the post-test than participants in groups one and two (p < .01). Group two performed
slightly better than group one, but this difference is not statistically significant. These results
indicate that the aggregated feedback from condition one does not provide the necessary infor-
mation to learn how much electricity we use for everyday activities (mind that the graph
showed the isolated usage for every individual item at times). From the difference between con-
ditions two and three we conclude that a line graph leaves the challenge to visually integrate the
area under the curve, which is a fairly difficult cognitive task. The simplified representation in
condition three clearly facilitated the comparison between different actions and yielded the best
learning results.
Conclusion
We are currently planning a second field study and a series of experiments. In our upcoming
field study we will conduct interviews and contextual inquiries similar to the ones described in
our previous field study, this time using a tool that offers disaggregated information on the ap-
pliance level. Again, the aim is to see how users read and understand the data and if they can
derive actionable insights. To further investigate specific representation aspects and graphic
formats we will carry out a series of further lab experiments.
The contribution of this research is to inform the theory of how data tracking and personal in-
formatics may lead to behaviour change. The cognitive processes, that is how users make sense
of the collected data and how they learn from it to improve in everyday life, need to be investi-
gated more closely.
In the case of residential energy feedback, we intend to define crucial user requirements. In par-
ticular, we want to investigate if disaggregation is indeed the key for users to understand resi-
dential energy feedback. Also, we work towards identifying what aspects of ‘energy literacy’
are needed to understand residential usage data and learn from it. For the graphic representation
“Feedback in energy demand reduction: Examining evidence and exploring opportunities” Edinburgh, July 2016Page 58
of the data we aim at providing design recommendations for electricity feedback. Line, bar, or
other graphs might be more or less suited to convey the relevant information.
Finally, we hope to enrich the research in ubiquitous computing and human-computer interac-
tion by grounding our research in theory and by combining both qualitative as well as quantita-
tive methods.
References
[1] Darby, S. (2006). The effectiveness of feedback on energy consumption. A Review for
DEFRA of the Literature on Metering, Billing and direct Displays,486, 2006.
[2] Ehrhardt-Martinez, K., & John, A. (2010, November). People-centered initiatives for in-
creasing energy savings. American Council for an Energy-Efficient Economy..
[3] Fischer, C. (2008). Feedback on household electricity consumption: a tool for saving en-
ergy?. Energy efficiency, 1(1), 79-104.
[4] Froehlich, J. E. (2011). Sensing and feedback of everyday activities to promote environ-
mental behaviors. University of Washington.
[5] Delmas, M. A., Fischlein, M., & Asensio, O. I. (2013). Information strategies
and energy conservation behavior: A meta-analysis of experimental studies from 1975 to
2012. Energy Policy, 61, 729-739.
[6] Vanhulst, P., & Lalanne, D. (2015). Collaborative Visualizations of Self-impacted Data.
In Personal Visualization: Exploring Data in Everyday Life.
[7] Bager, S. L. (2014). Information Feedback, Behaviour and ‘Smart Meters’: Using be-
havioural economics to improve our knowledge about the potential effectiveness of
Smart Meters to use electricity efficiently. IIIEE Master thesis.
[8] Brewer, R. S. (2013). Fostering Sustained Energy Behavior Change and Increasing En-
ergy Literacy in a Student Housing Energy Challenge.ProQuest LLC.
[9] Chisik, Y. (2011, September). An image of electricity: towards an understanding of how
people perceive electricity. In IFIP Conference on Human-Computer Interaction (pp.
100-117). Springer Berlin Heidelberg.
[10] DeWaters, J. E., & Powers, S. E. (2011). Energy literacy of secondary students
in New York State (USA): A measure of knowledge, affect, and behavior. Energy Poli-
cy, 39(3), 1699-1710.
[11] Department of Energy and Climate Change (DECC, 2012). Smart Metering Equipment
Technical Specifications.
[12] Roberts, S., & Baker, W. (2003). Improving consumer feedback on energy consumption
A report to Ofgem.
[13] Galesic, M., & Garcia-Retamero, R. (2011). Graph literacy: a cross-cultural comparison.
Medical Decision Making : An International Journal of the Society for Medical Decision
Making, 31(3), 444–457. doi:10.1177/0272989X10373805
[14] Boy, J., Rensink, R. A., Bertini, E., & Fekete, J. D. (2014). A principled way of
assessing visualization literacy. Visualization and Computer Graphics, IEEE
Transactions on, 20(12), 1963-1972.
[15] Kempton, W., & Layne, L. L. (1994). The consumer's energy analysis environ-
ment. Energy Policy, 22(10), 857-866.
[16] Kelly, J. (2016). Is disaggregated electricity feedback more effective than aggregate
feedback at reducing energy consumption? In preparation.
[17] Cox, A. L., Bird, J., & Fleck, R. (2013). Digital Epiphanies: how self-knowledge can

“Feedback in energy demand reduction: Examining evidence and exploring opportunities” Edinburgh, July 2016Page 59
change habits and our attitudes towards them.
[18] Li, I., Dey, A., & Forlizzi, J. (2010, April). A stage-based model of personal informatics
systems. In Proceedings of the SIGCHI Conference on Human Factors in Computing
Systems (pp. 557-566). ACM.
[19] Galesic, M., & Garcia-Retamero, R. (2011). Graph literacy a cross-cultural compari-
son. Medical Decision Making, 31(3), 444-457.
[20] Tufte, E. R., & Graves-Morris, P. R. (1983). The visual display of quantitative infor-
mation (Vol. 2, No. 9). Cheshire, CT: Graphics press.
“Feedback in energy demand reduction: Examining evidence and exploring opportunities” Edinburgh, July 2016Page 60
The Aging Population Perspective on Designing Successful Feedback Inter-
faces for Home Energy Systems: Beyond In-Home Displays3
Bruce Stephen ([email protected])
4, Mike Danson
5, Stuart Galloway
1 (PI), Greta
Barnicoat2, Andrea Taylor
6, Craig Lynn
7, Craig Whittet
8, Guy Walker
9, Catherine Docherty
10,
Edward Owens6
Abstract
With many developed countries looking to a future with an aging population, ambitions for fu-
ture power systems that incorporate participation in flexible demand schemes at the residential
level will hinge increasingly on willingness of older age groups to engage. Advancements in
metering technology, often hailed as the solution to maintaining demand response participation,
require a level of consumer technology in the home that could place additional burden on a gen-
eration already alienated by electronics devised for younger consumers. Blanket approaches to
energy usage feedback will not be optimally effective given that different people have different
objectives to managing energy and different approaches to managing routine. The APAtSCHE
project saw local housing association homes equipped with ambient sensing and high resolution
metering to understand energy use routines coupled with structured interviews to understand the
mental models that underlay these routines and sought to understand the aesthetics, interaction
and ergonomics of domestic energy usage and control systems that would optimally engage
older age groups. Through co-creative workshops and focus group participation, novel energy
feedback interfaces at the extremes of end users’ expectations were prototyped with users to
understand their expectations and experiences: an interactive TV based information display and
a free-standing, electro-mechanical device.
Introduction
An aging population carries with it many caveats that present additional difficulties for engi-
neering power systems of the future. Flexible demand to support the integration of intermittent
renewable generation relies very much on the engagement of the end user. For large industrial
customers connected to the medium and higher voltage network this is not new, but at the low
voltage level, it requires an aggregation of residential users who are less predictable in terms of
their energy usage. Routines and levels of acceptable comfort become progressively less flexi-
ble as people age and home automation, often hailed as the solution to maintaining demand re-
sponse participation (Erol-Kantarci & Mouftah, 2011), requires a level of consumer technology
in the home that places an additional burden on a generation already potentially alienated by
electronics devised for younger consumers. For example, touch screen interfaces are not neces-
sarily suitable for users with visual impairment and reduced dexterity. Fuel Poverty is defined
3 Presentation by Bruce Stephen and Mike Danson
4 Advanced Electrical Systems Group, University of Strathclyde
5 School of Management and Languages, Heriot-Watt University
6 Glasgow School of Art
7 FilamentPD, Glasgow
8 Product Design Studio, Glasgow School of Art
9 School of the Built Environment, Heriot Watt University
10 Journey Associates, Glasgow
“Feedback in energy demand reduction: Examining evidence and exploring opportunities” Edinburgh, July 2016Page 61
as the situation where more than 10% of a domestic budget is spent on fuel. Clearly, suggesting
a reduction in heating to those whose wellbeing is critically dependent on maintaining a warm
and dry dwelling will be neither practically nor socially acceptable. This is as much a social
challenge as a design and engineering one: technology is not readily adopted by all regardless of
its popularity and interfacing with the end user is particularly difficult. This makes this research
on attitudes and behaviour essential for integrating demand and supply solutions into future en-
ergy plans.
Fuel Poverty
Fuel poverty varies across social/household (age, vulnerable families, single person households,
household income) and dwelling (rurality, type of dwelling, age of dwelling, tenure, energy ef-
ficiency) characteristics (DECC, 2015). Within Scotland, pensioner households are most at risk
with over half (56% in 2011) in fuel poverty, compared with only 20% of pensioner households
in England (Hills, 2012). They are also particularly vulnerable to extreme fuel poverty, due to
types of residential property, lack of funds to invest in means to reduce their energy use, culture,
attitudes and behaviour (SHCS, 2012). Little is known on this and how willing and able the el-
derly in Scotland would be to change their ways, accepting an automated energy supply, chang-
ing when and how they use their energy. The APAtSCHE project (Aging Population Attitudes
to Sensor Controlled Home Energy) aimed to address this by examining the cross disciplinary
facets of the problem: domestic energy budgets, the needs of distribution network operators
(DNOs) in the presence of high penetrations of renewables, contextual sensing and human fac-
tors.
Aesthetic and Ergonomic Considerations
While the development of demand response technology in the form of home automation is not
novel, the needs of vulnerable end-users and direct evaluation of technology in their hands is
largely unexplored. APAtSCHE saw local authority housing equipped with ambient sensing and
high resolution metering to first build quantitative models of contextualized energy use and
then, with the deployment of automation and assistive technology, track the changes in model
parameters as a proxy for behavioural change. Product aesthetics and interactions also have a
role in the success of uptake, given that a display or interface may disrupt the domestic envi-
ronment it is placed within or be forgotten completely, where the resident becomes blind to its
presence, for example. Ergonomics are open to consideration too as existing interfaces are not
necessarily suitable for users with visual impairment, hearing loss and/or reduced dexterity
(Barnicoat & Danson, 2015).
End-user Engagement
A total of 81 participants aged over 50 years took part in the preliminary review of energy sav-
ing technology (48 female, 33 male). A total of 15 social housing tenants aged over 50 years (10
female, 5 male) and five members of social housing staff took part in the subsequent design
conceptualisation and development of improved energy saving products (Whittet et al., 2016).
Participants were recruited from residential areas of South Western Scotland and via stakehold-
er organisations such as the housing associations who were part of the APAtSCHE project.
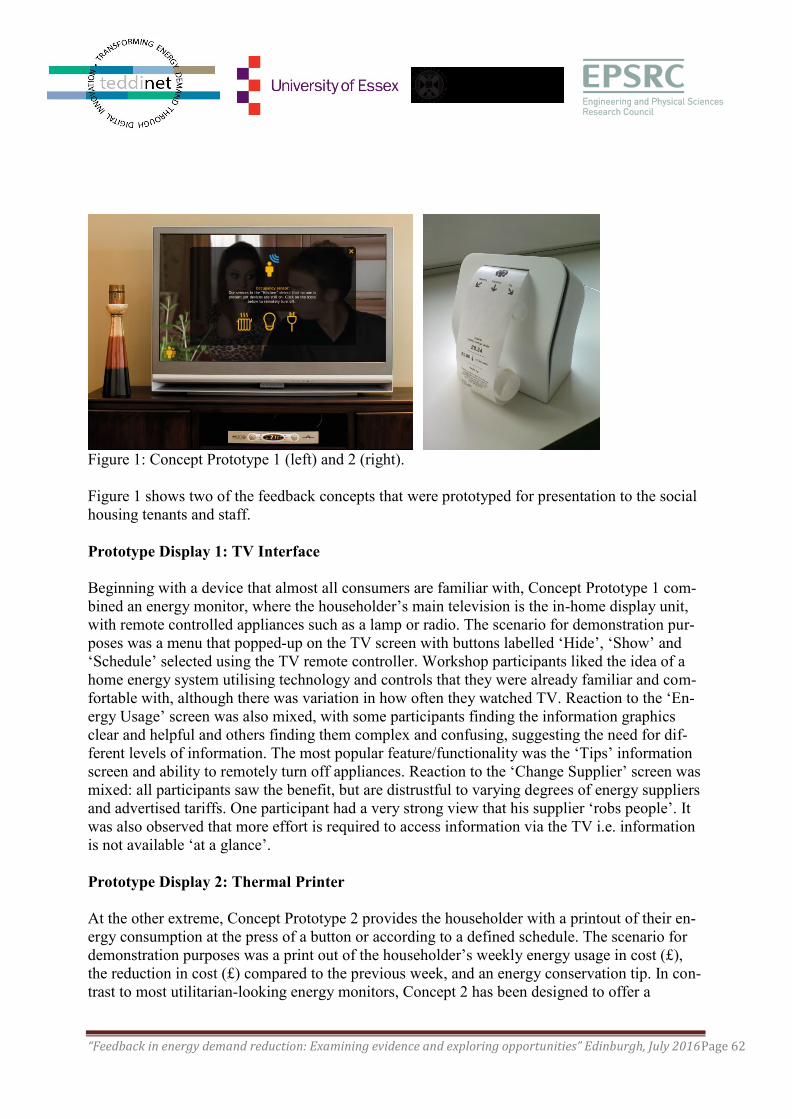
“Feedback in energy demand reduction: Examining evidence and exploring opportunities” Edinburgh, July 2016Page 62
Figure 1: Concept Prototype 1 (left) and 2 (right).
Figure 1 shows two of the feedback concepts that were prototyped for presentation to the social
housing tenants and staff.
Prototype Display 1: TV Interface
Beginning with a device that almost all consumers are familiar with, Concept Prototype 1 com-
bined an energy monitor, where the householder’s main television is the in-home display unit,
with remote controlled appliances such as a lamp or radio. The scenario for demonstration pur-
poses was a menu that popped-up on the TV screen with buttons labelled ‘Hide’, ‘Show’ and
‘Schedule’ selected using the TV remote controller. Workshop participants liked the idea of a
home energy system utilising technology and controls that they were already familiar and com-
fortable with, although there was variation in how often they watched TV. Reaction to the ‘En-
ergy Usage’ screen was also mixed, with some participants finding the information graphics
clear and helpful and others finding them complex and confusing, suggesting the need for dif-
ferent levels of information. The most popular feature/functionality was the ‘Tips’ information
screen and ability to remotely turn off appliances. Reaction to the ‘Change Supplier’ screen was
mixed: all participants saw the benefit, but are distrustful to varying degrees of energy suppliers
and advertised tariffs. One participant had a very strong view that his supplier ‘robs people’. It
was also observed that more effort is required to access information via the TV i.e. information
is not available ‘at a glance’.
Prototype Display 2: Thermal Printer
At the other extreme, Concept Prototype 2 provides the householder with a printout of their en-
ergy consumption at the press of a button or according to a defined schedule. The scenario for
demonstration purposes was a print out of the householder’s weekly energy usage in cost (£),
the reduction in cost (£) compared to the previous week, and an energy conservation tip. In con-
trast to most utilitarian-looking energy monitors, Concept 2 has been designed to offer a
“Feedback in energy demand reduction: Examining evidence and exploring opportunities” Edinburgh, July 2016Page 63
physical interaction with the aim of promoting energy conservation behaviour, through encour-
aging and evoking a sustainable positive emotional response.
Workshop participants liked the interactions, aesthetics and perceived simplicity of Concept 2,
the data that were printed (people were mostly interested in cost) and the tangibility of the print
out. The value of paper was observed during the preliminary research and it was apparent that
paper was used frequently for notes, prompts and reminders. Therefore, the physical element of
this concept and the added value of paper provided the team with a product feature worthy of
further exploration. The general view was that a lot of older people do not understand high-tech
devices. One participant commented ‘People think we’re just not trying [with technology], but
it’s not that’. One participant, whose partner has dementia, speculated that the simpler design
might be more appropriate for people with mild cognitive impairment, based on lived experi-
ence of her partner not understanding their home energy monitor because it is too complex. It
was suggested that the simpler design might be more accessible to children who, as family
members, are also responsible for their consumption behaviour, and that the print outs could be
filed with other energy and gas utilities documents.
Key Findings
Different users have different needs and these have to be taken into account. For example, there
is a need to consider risk issues where a house has to be warm for health reasons. In this case
information prompting change, without being in context for the resident, could have a detri-
mental effect. Familiarity with the TV interface and remote control is a positive element and is
imagined by the group that that this would be less daunting than an entirely new device; howev-
er, worries existed around the learning and introduction of the service, its maintenance plan and
costs, the potential security breaches. The printer was favoured for its novelty of the interaction
with paper but participants questioned the longevity of its engagement – “It may end up in the
drawer with all the other devices after a few weeks”. Despite this, it was suggested by the group
that a persistent reminder of energy use was a positive element as it could be posted on a pin-
board or fridge for the benefit of other occupants.
Conclusions
Moving forward, data and analyses will be used to inform the design of smart technologies in
the home, suitable and acceptable to older vulnerable people. Ultimately, APAtSCHE sought to
identify user centric technical solutions in power systems to address the issue of fuel poverty
through a more thorough understanding of this 'at risk' growing elderly group, by considering
how and where using technology, energy behaviour changes can be made, which lead to im-
proved technical, economic and social outcomes for all.
References Barnicoat, G. & Danson M. (2015). The ageing population and smart metering: A field study of
householders’ attitudes and behaviours towards energy use in Scotland. Energy Research & So-
cial Science 9, 107-115.
DECC (2015). Annual Report on Fuel Poverty Statistics. Available at:
https://www.gov.uk/government/uploads/system/uploads/attachment_data/file/468011/Fuel_Po
verty_Report_2015.pdf
“Feedback in energy demand reduction: Examining evidence and exploring opportunities” Edinburgh, July 2016Page 64
Erol-Kantarci, M. and Mouftah, H.T. (2011). Wireless sensor networks for cost-efficient resi-
dential energy management in the smart grid. IEEE Transactions on Smart Grid, 2, 314-325.
Hills, J. (2012). Getting the measure of fuel poverty: final report of the Fuel Poverty Review.
CASEreport, 72. Centre for Analysis of Social Exclusion, London School of Economics and
Political Science, London, UK.
SHCS (2012). Fuel Poverty Evidence Review, Defining, Measuring and Analysing Fuel Poverty
in Scotland. Scottish Government. Available at: www.gov.scot/resource/0039/00398798.pdf
Whittet, C., Taylor, A., Walker, G., Galloway, S., Stephen, B., Docherty, C., Lynn, C., Owens,
E. and Danson, M. (2016). Developing Concepts That Promote Energy Saving Technology for
Ageing Populations. Paper presented at the meeting of Ce&Pde, Aalborg University, Denmark.
“Feedback in energy demand reduction: Examining evidence and exploring opportunities” Edinburgh, July 2016Page 65
SESSION 2: Advanced Feedback: Disaggregation & Visuals Does Disaggregated Electricity Feedback Reduce Domestic Electricity Con-
sumption? A Critical Review of the Literature
Jack Kelly and William Knottenbelt
Department of Computing, Imperial College London, UK.
Jack presented at the symposium. [email protected]
Abstract
We examine twelve studies on the efficacy of disaggregated energy feedback. The average elec-
tricity reduction across these studies is 4.5%. However, 4.5% may be a positively-biased esti-
mate of the savings achievable across the entire population because all twelve studies are likely
to be prone to ‘opt-in’ bias hence none test the effect of disaggregated feedback on the general
population. Disaggregation may not be required to achieve these savings: The four studies
which directly compared aggregate feedback against disaggregated feedback found that aggre-
gate feedback is at least as effective as disaggregated feedback, possibly because web applica-
tions are viewed less often than in-home-displays (in the short-term, at least) and because some
users do not trust fine-grained disaggregation (although this may be an issue with the specific
user interface studied). Disaggregated electricity feedback may help a motivated sub-group of
the population (‘energy enthusiasts’) to save more energy but fine-grained disaggregation may
not be necessary to achieve these energy savings. Disaggregation has many uses beyond those
discussed in this paper but, on the specific question of promoting energy reduction in the gen-
eral population, there is no robust evidence that current forms of disaggregated energy feedback
are more effective than aggregate energy feedback. The effectiveness of disaggregated feedback
may increase if the general population become more energy-conscious; or if innovative new ap-
proaches out-perform existing feedback. This paper is a shortened version of Kelly & Knot-
tenbelt (2016).
Introduction
Electricity disaggregation estimates the energy consumption of individual appliances (or load
types or behaviours) using data from a single meter. One use-case is to estimate an itemised
electricity bill from a single smart meter measuring the whole building’s electricity demand.
Research into electricity disaggregation algorithms began over thirty years ago (Hart, 1984,
1992). Today, there is a lot of excitement about energy disaggregation. Since 2010 there has
been a dramatic increase in the number of papers published on energy disaggregation algo-
rithms and since 2013 there have been over 100 papers published each year (Parson, 2015).
Disaggregation is big business: In November 2015 disaggregation provider Bidgely raised
$16.6 million USD (Richardson, 2015). There are now at least 30 companies who offer dis-
aggregation products and services (Parson, 2012–2016; Kelly, 2016).
The longer version of this paper (Kelly & Knottenbelt, 2016) discusses four main questions: 1)
Can disaggregated energy data help an already-motivated sub-group of the general population
“Feedback in energy demand reduction: Examining evidence and exploring opportunities” Edinburgh, July 2016Page 66
to save energy? 2) How much energy would the general population save if given disaggregated
data? 3) Is fine-grained disaggregation required? 4) For the general population, does disaggre-
gated energy feedback enable greater savings than aggregate data? Due to space limitations,
this abbreviated paper only discusses questions 1 and 4.
An introduction to systematic reviews
This paper is, to the best of our knowledge, the first systematic review on the effectiveness of
domestic, disaggregated electricity feedback.
Systematic reviews are common in fields such as medicine and the social sciences. Systematic
reviews aim to find results which are robust across multiple studies as well as opportunities for
future research. The process starts with a search, using predefined criteria, for existing papers.
Results and possible biases are extracted from each paper, collated and combined. See Garg,
Hackam, & Tonelli (2008) for a discussion of systematic reviews.
There is a distinction between narrative reviews and systematic reviews. Most review articles
are narrative reviews. These are written by domain experts and contain a discussion of existing
papers. Narrative reviews are often very valuable. But they are rarely explicit about how papers
were selected and rarely attempt a quantitative synthesis of the results.
Systematic reviews aim to cover all papers which match defined criteria relevant to a specific
research question. Systematic reviews are explicit about how papers were selected and present a
quantitative summary of each paper and a quantitative synthesis of the results. Systematic re-
views may contain a ‘meta-analysis’ where results from each study are combined into a single
statistical analysis which provides greater statistical power than any individual study can deliv-
er.
Systematic reviews are not perfect, of course. Bias can still creep in via the selection process;
and different statistical analyses may present different results.
Methodology
Broadly, this paper discusses whether deployment of disaggregation across the entire population
is likely to reduce energy consumption. We assume that disaggregated data for a population-
wide deployment would be delivered via websites, smart-phone applications or paper bills.
We found twelve groups of studies on the question of whether disaggregated energy data helps
users to reduce their energy demand. These studies are summarised in Table 1.
We aimed to do an exhaustive search of the literature although it is not possible to rule out the
possibility that we missed studies. We used three search engines: Google Scholar, the ACM
Digital Library and IEEE Xplore. The search terms we used were ‘disaggregated [ener-
gy|electricity] feedback’ and ‘N[I|A|IA]LM feedback’. These searches produced a huge number
of results, many of which were not relevant to our research question. We manually selected pa-
pers which test the effectiveness of disaggregated electricity feedback. We accepted experi-
ments conducted either in a laboratory environment or in a field test. We also searched the bib-
liography sections of papers to find more papers. For example, a review article by Ehrhardt-
Martinez, Donnelly, & Laitner (2010) contained references to five relevant studies on disaggre-
gated energy feedback.
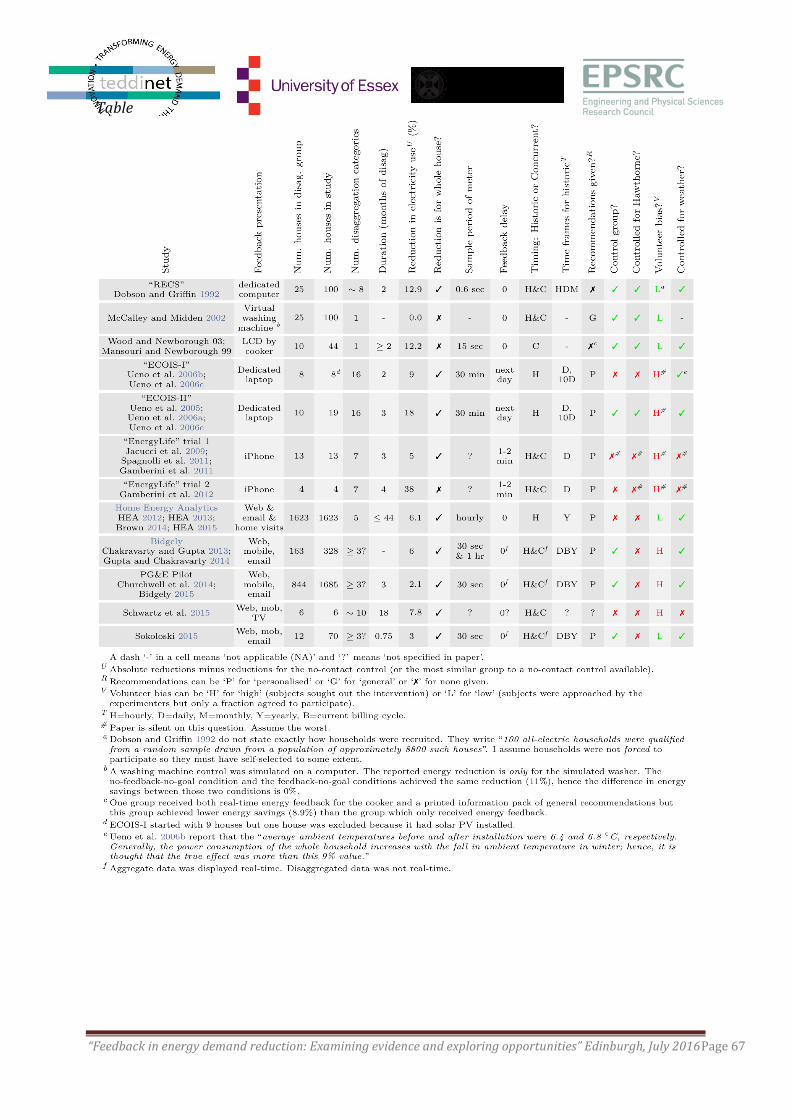
“Feedback in energy demand reduction: Examining evidence and exploring opportunities” Edinburgh, July 2016Page 67
Table
2: Studies on the effectiveness of disaggregated energy feedback
“Feedback in energy demand reduction: Examining evidence and exploring opportunities” Edinburgh, July 2016Page 68
Can disaggregated electricity feedback enable to save energy?
The mean reduction in electricity consumption across the twelve studies (weighted by the num-
ber of participants in each study) is 4.5%. However, as we will discuss below, this figure is like-
ly to be positively-biased and has a substantial (although unquantifiable) amount of uncertainty
associated with it.
Aggregating the results by taking the mean of the energy savings across the twelve studies is a
crude approach. It would have been preferable to do a full meta-analysis where biases are iden-
tified and compensated for (Garg et al., 2008). But the studies on disaggregated feedback appear
to us to be too varied and, perhaps most fundamentally, six of the twelve studies only provided
a point estimate of the effect size. At the very least, a meta-analysis requires that each study
provides a point estimate and a measure of the spread of the results.
There are several sources of positive bias present in the papers. All twelve studies are prone to
‘opt-in’ bias, where subjects self-selected to some extent and so are likely to be more interested
in energy than the general population.
Eight studies did not control for the Hawthorne effect. This strange effect is where participants
reduce their energy consumption simply because they know they are in an energy study. For
example, Schwartz, Fischhoff, Krishnamurti, & Sowell (2013) conducted a controlled study on
6,350 participants, split equally between control and treatment groups. Subjects in the treatment
group received a weekly postcard saying: ‘You have been selected to be part of a one-month
study of how much electricity you use in your home… No action is needed on your part. We will
send you a weekly reminder postcard about the study…’ Participants who received these post-
cards reduced their consumption by 2.7%. Hence studies on disaggregated energy feedback
which do not control for the Hawthorne effect are likely to over-estimate energy savings at-
tributable to the disaggregated energy feedback.
Six studies used feedback displays which were probably more attention-grabbing than the feed-
back mediums that would be used in a population-wide roll-out of disaggregated energy feed-
back. Some studies gave home-visits to some participants to enable additional reductions (e.g.
T. Schwartz et al., 2015; Brown, 2014; HEA, 2015). All but two studies were too short to ob-
serve whether energy reductions persist long-term. And, finally, eight studies used sub-metered
data, hence avoiding any mistrust of disaggregated estimates (Churchwell, Sullivan, Thompson,
& Oh, 2014).
Despite these sources of bias, there is evidence that energy disaggregation can enable energy
savings for ‘energy enthusiasts’.
Does aggregate or disaggregated feedback enable greater savings for the whole
population?
Four studies directly compared aggregate feedback against disaggregated feedback. Three of
these studies found aggregate feedback to be more effective than disaggregated feedback
(Krishnamurti, Davis, Wong-Parodi, Wang, & Canfield, 2013; Churchwell et al., 2014; Soko-
loski, 2015). The fourth study found disaggregated feedback and aggregate feedback to be
“Feedback in energy demand reduction: Examining evidence and exploring opportunities” Edinburgh, July 2016Page 69
equally effective (McCalley, & Midden, 2002). Are there any explanations for this counter-
intuitive result? Two of the four studies (McCalley, & Midden, 2002; Krishnamurti et al., 2013)
were synthetic computer simulations and so may not generalise.
The other two studies were well controlled field studies (Churchwell et al., 2014; Sokoloski,
2015). In both field studies, aggregate feedback was displayed on an always-on IHD whilst dis-
aggregated data was displayed on Bidgely’s website (which has since been redesigned (Bidgely,
2015)). Participants in the disaggregation groups did not have an IHD. Sokoloski (2015) found
that, on average, participants in the IHD condition viewed the IHD eight times per day whilst
participants in the disaggregation condition viewed the website only once per day. Churchwell
et al. (2014) found a similar pattern and also reported that some participants did not trust the
fine-grained disaggregated data. Perhaps aggregate data is not intrinsically more effective than
disaggregated data; instead, perhaps IHDs are more effective than websites or mobile apps.
Perhaps dedicated displays for disaggregated data may help enhance efficacy, although this
adds costs. Or, as Sokoloski (2015) suggests, efficacy may be increased by combining disaggre-
gated feedback presented on a website with aggregate feedback presented on an IHD.
Furthermore, a meta-analysis of the efficacy of aggregate energy feedback suggests it alone
achieves 3% energy savings (Davis et al., 2013). This analysis adjusted for several (but not all)
biases.
Suggestions for future research
There are several gaps in the existing literature. Below is a list of potential experiments (more
ideas are listed in Kelly (2016)).
No existing field studies compared aggregate feedback against disaggregated feedback on the
same type of display. The studies which did compare aggregate feedback against disaggregated
feedback used an IHD for aggregate feedback and a website for disaggregated feedback and
found that the aggregate feedback was more effective at reducing energy demand. But we can-
not rule out that this result is simply because users viewed the IHD more frequently than they
viewed the website. Hence it would be valuable to run an experiment where both the ‘aggre-
gate’ and ‘disaggregated’ groups received feedback on the same device (e.g. an IHD with a dot-
matrix display to display disaggregated feedback).
A related study would explore the effectiveness of aggregate feedback presented on an IHD
combined with access to disaggregated data on a website; compared to just the IHD. The IHD
might pique users’ interest and motivate them to explore their disaggregated energy usage on a
website or smart phone.
Another study would compare fine-grained disaggregated feedback against coarse-grained dis-
aggregated feedback.
Below is a list of suggestions for how to make future papers on feedback as useful as possible:
If possible, conduct a randomised controlled trial. Publish as much information as possible.
How were subjects recruited? Were subjects selected from the general population? Did any
subjects withdraw during the study period? Was there a control group? Did the study control for
the Hawthorne effect and weather? What sources of bias may influence the result? How exactly
“Feedback in energy demand reduction: Examining evidence and exploring opportunities” Edinburgh, July 2016Page 70
was feedback presented; and how rapidly did the information update? How often did partici-
pants view the display? Was disaggregated data available from the very beginning of the exper-
iment or did the disaggregation platform take time to adapt to each home? Publish the results of
all the valid statistical analyses performed; not just the ‘best’ result. Crucially, please publish
some measure of the spread of the result (e.g. the standard deviation). Ideally, publish online,
full, anonymised results so researchers can collate your results into a meta-analysis.
Conclusions
Disaggregation has many use-cases beyond feedback. This paper specifically considers a single
use-case of disaggregation: Reducing energy consumption via feedback. Averaged across the
population, there is evidence that disaggregated feedback may help to reduce electricity con-
sumption by ~0.7-4.5%. But disaggregation might not be necessary to achieve this saving be-
cause aggregate feedback may be equally effective. Amongst ‘energy enthusiasts’, disaggregat-
ed feedback might save more energy but fine-grained disaggregation may not be necessary.
We must emphasise that all we can do is report the current state of the research. We cannot rule
out the possibility that disaggregated feedback is, in fact, more effective than aggregate feed-
back. Neither can we rule out that fine-grained feedback is more effective than coarse-grained.
All we can say is that current evidence contradicts the first hypothesis and that there is no evi-
dence available to address the second hypothesis.
Importantly, note that the existing evidence-base is heterogeneous and has many gaps. Perhaps
a large, well controlled, long-duration, randomised, international study will find that disaggre-
gated feedback is more effective than aggregate.
Perhaps users will become more interested in disaggregated data if energy prices increase or if
concern about climate change deepens. Or perhaps users in fuel poverty will be more likely to
act on disaggregated feedback in order to save money. Or perhaps users will trust disaggrega-
tion estimates more if accuracy improves or if designers find ways to communicate uncertain
disaggregation estimates. Or perhaps real-time feedback or better recommendations will im-
prove performance. Or perhaps disaggregating by behaviour rather than by appliance will make
disaggregated feedback more effective.
References
Bidgely. (2015, April 14). PG&E pilot yields 7.7% energy savings. Retrieved from
http://www.bidgely.com/blog/pge-pilot-yields-7-7-energy-savings/
Brown, R. (2014). Bringing it all together: Design and evaluation innovations in the Alameda
county residential behavior pilot. In Behavior, energy, and climate change conference. Re-
trieved from
https://onedrive.live.com/view.aspx?cid=428E7D625E39DE0E&resid=428E7D625E39DE0E%
21249&app=PowerPoint
Chakravarty, P., & Gupta, A. (2013). Impact of energy disaggregation on consumer behavior. In
Behavior, energy and climate change conference. Sacramento CA: UC Berkeley. Retrieved
from http://escholarship.org/uc/item/62d3456p
“Feedback in energy demand reduction: Examining evidence and exploring opportunities” Edinburgh, July 2016Page 71
Churchwell, C., Sullivan, M., Thompson, D., & Oh, J. (2014). HAN phase 3 impact and process
evaluation report. Nexant. Retrieved from http://www.myaztech.ca/wp-content/uploads/PGE-
HAN_Impacts_and_Savings_Report_FINAL.pdf
Davis, A. L., Krishnamurti, T., Fischhoff, B., & Bruin, W. B. de. (2013). Setting a standard for
electricity pilot studies. Energy Policy, 62, 401–409. http://doi.org/10.1016/j.enpol.2013.07.093
Dobson, J. K., & Griffin, J. D. A. (1992). Conservation effect of immediate electricity cost
feedback on residential consumption behavior. In Summer study on energy efficiency in build-
ings (Vol. 10, pp. 33–35). Washington, D.C.: American Council for an Energy-Efficient Econ-
omy (ACEEE). Retrieved from
http://aceee.org/files/proceedings/1992/data/papers/SS92_Panel10_Paper06.pdf
Ehrhardt-Martinez, K., Donnelly, K. A., & Laitner, J. A. (2010). Advanced metering initiatives
and residential feedback programs: A meta-review for household electricity-saving opportuni-
ties (No. E105). Washington, D.C.: American Council for an Energy-Efficient Economy
(ACEEE). Retrieved from http://aceee.org/research-report/e105
Gamberini, L., Corradi, N., Zamboni, L., Perotti, M., Cadenazzi, C., Mandressi, S., … Aman, P.
(2011). Saving is fun: Designing a persuasive game for power conservation. In 8th international
conference on advances in computer entertainment technology (pp. 16:1–16:7). New York, NY,
USA: ACM. http://doi.org/10.1145/2071423.2071443
Gamberini, L., Spagnolli, A., Corradi, N., Jacucci, G., Tusa, G., Mikkola, T., … Hoggan, E.
(2012). Tailoring feedback to users’ actions in a persuasive game for household electricity con-
servation. In M. Bang & E. L. Ragnemalm (Eds.), 7th international conference on persuasive
technology: Design for health and safety (pp. 100–111). Berlin, Heidelberg: Springer Berlin
Heidelberg. http://doi.org/10.1007/978-3-642-31037-9_9
Garg, A. X., Hackam, D., & Tonelli, M. (2008). Systematic review and meta-analysis: When
one study is just not enough. Clinical Journal of the American Society of Nephrology, 3(1),
253–260. http://doi.org/10.2215/cjn.01430307
Gupta, A., & Chakravarty, P. (2014). White paper: Impact of energy disaggregation on con-
sumer behavior. Bidgely. Retrieved from http://www.bidgely.com/wp-
content/uploads/2016/04/White_Paper_Savings__Engagement_v2_Case_Study.pdf
Hart, G. W. (1984). Nonintrusive appliance load data acquisition method. MIT Energy Labora-
tory.
Hart, G. W. (1992). Nonintrusive appliance load monitoring. Proceedings of the IEEE, 80(12),
1870–1891. http://doi.org/10.1109/5.192069
HEA. (2012). Home energy disaggregation utilizing smart meter data. Home Energy Analytics
(HEA). Retrieved from
https://onedrive.live.com/view.aspx?cid=428E7D625E39DE0E&resid=428E7D625E39DE0E%
21253&app=WordPdf
HEA. (2013). Mountain view reduces GHG emissions - energy upgrade mountain view (EUMV)
phase 1 summary. HEA & Energy Upgrade California in Mountain View. Retrieved from
“Feedback in energy demand reduction: Examining evidence and exploring opportunities” Edinburgh, July 2016Page 72
https://onedrive.live.com/view.aspx?cid=428E7D625E39DE0E&resid=428E7D625E39DE0E%
21258&app=WordPdf
HEA. (2015). Energy upgrade mountain view - EUMV final report. City of Mountain View &
Acterra & HEA. Retrieved from
https://onedrive.live.com/view.aspx?cid=428E7D625E39DE0E&resid=428e7d625e39de0e%21
265&app=WordPdf
Jacucci, G., Spagnolli, A., Gamberini, L., Chalambalakis, A., Björkskog, C., Bertoncini, M., …
Monti, P. (2009). Designing effective feedback of electricity consumption for mobile user inter-
faces. PsychNology Journal, 7(3), 265–289. Retrieved from
http://psychnology.org/File/PNJ7(3)/PSYCHNOLOGY_JOURNAL_7_3_JACUCCI.pdf
Kelly, J. (2016). Electricity disaggregation for smart meter data (PhD thesis). Imperial College
London. In preparation.
Kelly, J., & Knottenbelt, W. (2016). Does disaggregated electricity feedback reduce domestic
electricity consumption? A systematic review of the literature. In 3rd International NILM work-
shop. Vancouver, Canada. Retrieved from http://arxiv.org/abs/1605.00962
Krishnamurti, T., Davis, A. L., Wong-Parodi, G., Wang, J., & Canfield, C. (2013). Creating an
in-home display: Experimental evidence and guidelines for design. Applied Energy, 108, 448–
458. http://doi.org/10.1016/j.apenergy.2013.03.048
Mansouri, I., & Newborough, M. (1999). Dynamics of energy use in UK households: End-use
monitoring of electric cookers. In Summer study on energy efficiency in buildings. American
Council for an Energy-Efficient Economy (ACEEE). Retrieved from
http://www.eceee.org/library/conference_proceedings/eceee_Summer_Studies/1999/Panel_3/p3
_8/paper
McCalley, L. T., & Midden, C. J. (2002). Energy conservation through product-integrated feed-
back: The roles of goal-setting and social orientation. Journal of Economic Psychology, 23(5),
589–603. http://doi.org/10.1016/s0167-4870(02)00119-8
Murtagh, N., Gatersleben, B., & Uzzell, D. (2014). 20:60:20 - differences in energy behaviour
and conservation between and within households with electricity monitors. PLoS ONE, 9(3).
http://doi.org/10.1371/journal.pone.0092019
Parson, O. (2012–2016). NIALM in industry. Retrieved from
http://blog.oliverparson.co.uk/2012/05/nialm-in-industry.html
Parson, O. (2015, March 25). Overview of the NILM field. Retrieved from
http://blog.oliverparson.co.uk/2015/03/overview-of-nilm-field.html
Richardson, J. (2015, November 13). Energy management startup Bidgely raises $16.6 million
in B round. Retrieved from http://cleantechnica.com/2015/11/13/energy-management-startup-
bidgely-raises-16-6-million-b-round/
Schmidt, L. (2012). Online smart meter analysis achieves sustained energy reductions: Results
from five communities. In Summer study on energy efficiency in buildings. American Council
“Feedback in energy demand reduction: Examining evidence and exploring opportunities” Edinburgh, July 2016Page 73
for an Energy-Efficient Economy (ACEEE). Retrieved from http://smartgridcc.org/wp-
content/uploads/2012/08/HEA-Final-Paper-ACEEE.pdf
Schwartz, D., Fischhoff, B., Krishnamurti, T., & Sowell, F. (2013). The Hawthorne effect and
energy awareness. Proceedings of the National Academy of Sciences, 110(38).
http://doi.org/10.1073/pnas.1301687110
Schwartz, T., Stevens, G., Jakobi, T., Denef, S., Ramirez, L., Wulf, V., & Randall, D. (2015).
What people do with consumption feedback: A long-term living lab study of a home energy
management system. Interacting with Computers, 27(6), 551–576.
http://doi.org/10.1093/iwc/iwu009
Sokoloski, R. (2015, July 2). Disaggregated electricity consumption: Using appliance-specific
feedback to promote energy conservation (M.A.). California State University San Marcos. Re-
trieved from http://hdl.handle.net/10211.3/141932/
Spagnolli, A., Corradi, N., Gamberini, L., Hoggan, E., Jacucci, G., Katzeff, C., … Jönsson, L.
(2011). Eco-feedback on the go: Motivating energy awareness. Computer, 44(5), 38–45.
http://doi.org/10.1109/MC.2011.125
Ueno, T., Inada, R., Saeki, O., & Tsuji, K. (2005). Effectiveness of displaying energy consump-
tion data in residential houses – analysis on how the residents respond. In Summer study. energy
savings: What works & who delivers? (pp. 1289–1299). Mandelieu La Napoule, France: Euro-
pean Council for an Energy-Efficient Economy (ECEEE). Retrieved from
http://www.eceee.org/library/conference_proceedings/eceee_Summer_Studies/2005c/Panel_6/6
100ueno
Ueno, T., Inada, R., Saeki, O., & Tsuji, K. (2006). Effectiveness of an energy-consumption in-
formation system for residential buildings. Applied Energy, 83(8), 868–883.
http://doi.org/10.1016/j.apenergy.2005.09.004
Ueno, T., Sano, F., Saeki, O., & Tsuji, K. (2006). Effectiveness of an energy-consumption in-
formation system on energy savings in residential houses based on monitored data. Applied En-
ergy, 83(2), 166–183. http://doi.org/10.1016/j.apenergy.2005.02.002
Ueno, T., Tsuji, K., & Nakano, Y. (2006). Effectiveness of displaying energy consumption data
in residential buildings: To know is to change. In Summer study on energy efficiency in build-
ings. Pacific Grove, California: American Council for an Energy-Efficient Economy (ACEEE).
Retrieved from
http://www.eceee.org/library/conference_proceedings/ACEEE_buildings/2006/Panel_7/p7_22/
paper
Vassileva, I., Odlare, M., Wallin, F., & Dahlquist, E. (2012). The impact of consumers’ feed-
back preferences on domestic electricity consumption. Applied Energy, 93, 575–582.
http://doi.org/10.1016/j.apenergy.2011.12.067
Wood, G., & Newborough, M. (2003). Dynamic energy-consumption indicators for domestic
appliances: Environment, behaviour and design. Energy and Buildings, 35(8), 821–841.
http://doi.org/10.1016/S0378-7788(02)00241-4
“Feedback in energy demand reduction: Examining evidence and exploring opportunities” Edinburgh, July 2016Page 74
Utilising disaggregated energy data in feedback designs – the IDEAL project
Nigel Goddard, Martin Pullinger, Lynda Webb, Elaine Farrow, Edmund Farrow, Jonathan
Kilgour, Evan Morgan and Johanna Moore, University of Edinburgh
Introduction
Conventional energy feedback displays still typically rely on ‘information deficit’ models of
energy behaviours, in which users are provided with more detailed or engaging information
about their current and historic energy use and associated (financial and carbon) impacts. The
underlying assumption is that providing this information will enable users to make more
informed, ‘rational’ decisions about energy-using behaviours, with the added assumption that
they will then choose to use less energy. This approach to energy feedback is still the standard
design as specified, for example, in the minimum feature set for in-home displays in the UK
Smart Metering Programme (Pullinger, Lovell, & Webb, 2014). However, there is an increasing
interest in processing this energy data in ways that may make it more interesting, engaging and
useful for the user. Such designs are being developed and evaluated in academic research and
are increasingly appearing in commercial feedback systems.
One new strand of research has taken energy feedback out of the conventional in-home display
to incorporate it into a variety of alternative physical artefacts, ranging from artificial trees
whose branches light according to energy use (Piccolo, Baranauskas, & Azevedo, 2016) to
similarly enhanced clocks and polar bears (Verdezoto, 2016), aiming to render energy use more
visible in everyday life as a way to encourage behaviour change (Hargreaves, Nye, & Burgess,
2013).
A second strand focuses on the potential to process energy and other sensor data to produce
additional feedback for the end user, whilst still using an in-home display as the main interface.
This might involve providing more detailed information displays, such as by disaggregating
energy data to present energy use by appliance, or to link energy use to the practices being
performed in the home (Goddard, Moore, et al., 2012). In addition, it might involve processing
the data further, to provide actionable advice about how best to alter the energy-using practices
of households. These approaches aim to automate some of the complex data processing steps
that are otherwise left to the end user, i.e. the steps required to transform aggregated data on
energy use into a form that makes it clearer to the user what changes in practices they could
make to reduce their energy use.
The IDEAL approach to feedback
Our approach to designing the feedback system considers three criteria:
1. Practice theory. We start from the premise that feedback should be considered a form of
story-telling or conversation, in which the natural conceptual units for the user are the
practices they engage in – doing the laundry; heating/cooling/ventilating for comfort and
health; preparing meals for sustenance and sociability; and so on. Feedback systems
will be more effective if the communications they engage in are better aligned with the
language and conceptualisations of practices natural to the users.
“Feedback in energy demand reduction: Examining evidence and exploring opportunities” Edinburgh, July 2016Page 75
2. Engagement through enablement. A feedback system will be more effective if the
information it provides answers directly questions the user has. We select participants
who are already motivated to learn about and/or reduce their energy use. An analogy
might be an obesity-study which focussed not just on people who are obese, but the
subset who are motivated to join a study that aims to help them reduce weight. We are
not designing a feedback system to motivate energy demand reduction, but to be of
assistance to users who already are so motivated: an enabler.
3. Co-design of the feedback system. The feedback system is a computational artifact for
the home, and as such its design should draw upon best practice in software engineering
and user experience design. Our approach is informed by the tenets of extreme
programming, human-computer interaction, and living labs.
Practice-based Feedback
We operationalise practices in the feedback system by organising them into four categories:
Laundry
Cooking
Personal washing
Thermal comfort
Obviously people engage in many practices (e.g., leisure, entertaining, travel) beyond the ones
in these four areas, but these are the ones we identified as (a) being significant in their use of
energy and opportunity for participants to modulate that use, and (b) amenable to our
intervention given the sources of data and communication channels available to us.
Within each of these areas, there can be multiple sub-practices which may stand alone or be
linked. As an example, “doing the laundry” will involve all of “putting an item in the laundry
basket”, “washing clothes” and “drying clothes”, and possibly “removing creases”, each of
which may be manifest in different non-exclusive ways (e.g., “tumble drying”, “spinning”,
“hanging on the drying rack” and “hanging on the washing line”). Our aim is to create and
study a feedback system that is aligned, in both form and content of interactions, with practices
as we discover them to arise in our study households.
Engagement through Enablement
Engagement of participants is a key factor in the effectiveness of advice-giving systems
[citation]. We feel that “feedback” is not a good descriptor for the kind of system we are
aiming at. The system should engage the participants in an ongoing dialogue that is always
under the control of the participants but can be both participant and system driven – more of a
consultant or advisor. To structure this dialog, and as a form of engagement, we plan to run
“themes” in the four areas listed above (laundry, etc). Theme activities will include:
announcement and survey of current form of practices
“Feedback in energy demand reduction: Examining evidence and exploring opportunities” Edinburgh, July 2016Page 76
rating of energy/efficiency tips such as “High-speed spinning makes drying cheaper and
faster”
a practice disruption “game” such as “Can you try wearing some items for once or twice
more before washing?”
in a subset of households, a focus group to explore practices and co-design the user
interface (see below).
personalised information about current practice as observed by the system, with
suggestions for making the practice more efficent in energy and cost terms (and often in
time as well).
Enabling participants to change practices to make them more efficient can require some detailed
knowledge of current practices – for example it is of little use to advise a participant that
washing clothes on a low-temperature cycle is faster and cheaper than a high-temperature cycle,
if the participant/household is already washing on low-temperature cycles. We identify key
aspects of practices that can in principle be inferred from the data available to our system, and
use various computational methods to automatically generate advice and responses to
participants. One of the great research questions is what are the best inference methods in these
kind of tasks, where we have multiple streams of time-series data from diverse sensors, as well
as more intermittent but focussed information from participant interaction with the system.
Co-design of interfaces
Several strands of research and practice are converging on the principle that effective
computational systems that are embedded in human activities can be best designed,
implemented and evaluated with a representative sample of the people who are likely to engage
with the system. Extreme programming is a software-engineering process for ensuring that a
computational system matches the problem it is trying to solve, through rapid cycles (e.g.,
monthly) of needs elicitation, design, implementation, rollout and evaluation. Human-computer
interaction studies emphasize the need for good understanding through controlled studies of
what kind of information presentation and engagement strategies work will in practice
(Winterboer, Tietze, Wolters & Moore, 2011). Living labs take these ideas further and engage
the users in the actual design process as well as the evaluation, and can be run in cycles.
We use these approaches in creating our feedback system. One cohort of households (40-50)
will be involved in focus groups to explore current practices, and in design sessions to explore
possible user interface issues including what questions are of interest (e.g., “I want to
understand how much low-temperature washing might save me in a year”, how the answers
should be formed (e.g., “icons and graphics” and delivered (e.g, “on the tablet but with a text
message alert”), and what sort of dialogue might follow. The designs will be trialled in these
households, which have sufficient sensors installed that we will not need sophisticated analytics
to infer what is going on. They will then be rolled out (after necessary modifications) to the
“treatment” cohort
“Feedback in energy demand reduction: Examining evidence and exploring opportunities” Edinburgh, July 2016Page 77
Summary
We have designed a process for creating an automated system to engage with users in dialogue
about their activities that use energy and how these could be changed to meet users goals. It
builds on insights from the literature on practices, engagement and user-interface design. The
underlying infrastructure (sensor system, communication channels, database, tablet app) are in
place and we have done preliminary work on the analytics and feedback/dialogue components.
We are about to start recruiting households to the study, in three cohorts: co-designers,
experimental condition, and controls.
References
Goddard, N. H., Moore, J. D., Sutton, C. A., Webb, J., & Lovell, H. (2012). Machine learning
and multimedia content generation for energy demand reduction. In Sustainable Internet and
ICT for Sustainability (SustainIT), 2012 (pp. 1–5).
Hargreaves, T., Nye, M., & Burgess, J. (2013). Keeping energy visible? Exploring how
householders interact with feedback from smart energy monitors in the longer term. Energy
Policy, 52, 126–134.
Piccolo, L. S., Baranauskas, C., & Azevedo, R. (2016). A socially inspired energy feedback
technology: challenges in a developing scenario. AI & Society, 1–17.
Pullinger, M., Lovell, H., & Webb, J. (2014). Influencing household energy practices: a critical
review of UK smart metering standards and commercial feedback devices. Technology Analysis
& Strategic Management, 26(10), 1144–1162.
Verdezoto, N. (2016). Designing Feedback Technology that Fits into People’s Everyday Life:
Challenges & Opportunities. Poster presentation ComSE, 15-19 February 2016, Florianópolis,
Brazil.
Winterboer, A. K., Tietze, M. I., Wolters, M. K. & Moore, J. D. (2011) The user model-based
summarize and refine approach improves information presentation in spoken dialog systems.
Computer Speech and Language. 25:2, p. 175-191 17.
“Feedback in energy demand reduction: Examining evidence and exploring opportunities” Edinburgh, July 2016Page 78
Energy feedback enabled by load disaggregation
Lina Stankovic, Vladimir Stankovic, David Murray, Jing Liao
Department of Electronic & Electrical Engineering, University of Strathclyde, Glasgow G1
1WX
Presented by Lina Stankovic, [email protected]
Abstract
Motivated by recent advances in load disaggregation, we discuss innovative tools for under-
standing household appliance energy consumption and patterns of appliance use for energy
feedback generation, developed as part of the EPSRC REFIT project. We show how analytical
tools applied on disaggregated data can lead to a variety of energy feedback ranging from appli-
ance usage patterns analysis, appliance upgrade/retrofit advice, opportunities for load shifting
and assessing tariff suitability, and understanding household routines through time use and en-
ergy consumption studies of daily activities in the home, such as cooking or laundering. Our
analysis is based on the publicly-available REFIT electrical measurements dataset that was
populated by a 2-year longitudinal study in UK houses and is supplemented by qualitative data.
Namely, we collected electricity data, aggregate data and individual appliance consumption,
with an 8-second sampling rate for active power, similar to that provided by a Consumer Access
Device that reads measurements from a smart meter directly. This implies that our feedback
generation approaches could potentially be used in conjunction with smart meters that will be
present in all UK homes by 2020. Furthermore, we summarise the findings collected during exit
interviews from the test households about the usefulness of smart metering and energy feed-
back.
1. Introduction
Smart meter roll-outs have been implemented or planned across the world to better manage res-
idential energy demand, conserve energy, improve billing accuracy, and help users understand
the energy implications of their appliance usage habits. Bundled with In-Home Display devices,
smart meters will provide real-time aggregate energy consumption information and access to
historical aggregate consumption.
In this paper we explore enhanced energy feedback methods, beyond live and historical aggre-
gate consumption, that are only possible from appliance-level consumption data. Non-Intrusive
appliance Load Monitoring (NILM) is an attractive load disaggregation option, since it does not
require any physical, appliance-level sensors to be installed and can potentially estimate energy
consumption of each appliance in a home using only smart meter data. Indeed, up to 20% ener-
gy consumption reduction is expected via appliance-feedback and specific appliance upgrade
programs (Armel, Gupta, Shrimali, & Albert, 2013).
The extended abstract is organised as follows: firstly, we briefly describe NILM techniques, re-
cently developed specifically by the authors to operate with high accuracy on smart-meter type
data; secondly, we demonstrate how to use the disaggregated data obtained from NILM to pro-
vide enhanced feedback to customers, such as individual appliance consumption, energy con-
sumption broken down to activity level (e.g., cooking, laundering), appliance mining and up-
grade/retrofit advice, and suitability for different variable tariffs; thirdly, we present a summary
“Feedback in energy demand reduction: Examining evidence and exploring opportunities” Edinburgh, July 2016Page 79
of findings from 20 households on their thoughts about the previously discussed feedback
methods.
The paper is based on a field study conducted as part of the EPSRC REFIT project, where 20
homes in the Loughborough area were monitored for about 2 years.
2. Load disaggregation: background and summary of approaches
Though founded over 30 years ago (see Hart, 1992), NILM has generated renewed interest re-
cently, due energy conservation programmes and large-scale smart meter deployments world-
wide. Recent challenges for NILM are high accuracy disaggregation from smart-meter type low
sampling rate electrical measurements, and robustness to noise manifested from a the very large
number of household appliances in a home, many with similar electrical signatures. Most popu-
lar ‘low-rate’ NILM approaches are based on Hidden Markov Models (HMMs) which usually
require expert knowledge to initiate appliance state models and a very large ‘noiseless’ training
set to build//refine the models.
In order to overcome the disadvantages of HMM-based approaches, we have developed a range
of NILM methods that are of low complexity without compromising on accuracy, that work
with active power measurements at low sampling rates (in the order of seconds or minutes) - see
(Liao, Elafoudi, Stankovic, & Stankovic, 2014), (Elafoudi, Stankovic, & Stankovic, 2014), (Al-
trabalsi, Stankovic, Liao, & Stankovic, 2016), and (Zhao, Stankovic, & Stankovic, 2016).
Our two supervised NILM approaches are based on adaptive thresholding for event detection
with a Decision Tree (Liao et al., 2014) and combined K-means and Support Vector Machine
for event classification (Altrabalsi et al., 2016). However, both approaches require a training
period, albeit small compared to HMM-based approaches, when each appliance is operating
with minimum noise from other appliances. Since, for such training, either plug-level sensors or
time-diaries are needed, these approaches might not be suitable for widespread deployment.
In (Liao et al., 2014) and (Elafoudi et al., 2014), we proposed an unsupervised method based on
Dynamic Time Warping, which does not require a labelled dataset for training and has competi-
tive performance to supervised approaches. However, the method of (Elafoudi et al., 2014)
compares each newly extracted electrical signature with a database of signatures which is popu-
lated on-the-fly; this may result in high complexity if there are many appliances contributing to
the aggregate load.
Finally, in (Zhao et al., 2016), we developed a ‘training-less’ approach based on
Graph Signal Processing (GSP) that does not require any training and can start disaggregating
measurements immediately. Due to the inherent properties of the underlying GSP design, this
approach can capture signal patterns that occur rarely (as opposed to machine learning based
methods), is robust to noisy data and outliers and has low computational complexity.
All above approaches have been tested on a range of datasets and demonstrated competitive ac-
curacy with respect to state-of-the-art approaches.
“Feedback in energy demand reduction: Examining evidence and exploring opportunities” Edinburgh, July 2016Page 80
3. Going beyond load disaggregation: Enhanced feedback on consumption habits
While NILM can identify when an appliance is used and how much electricity it consumes, this
is hardly sufficient for motivating energy conservation. We conducted two types of detailed
analysis based on disaggregated appliance-level data:
a) Appliance usage monitoring, i.e., analysis of appliance usage patterns, including seasonal
effects, suitability for load shifting and suitability of variable tariffs;
b) Domestic activity recognition, i.e., analysing energy consumption through the lens of ac-
tivities, potentially more meaningful to consumers as it is tied to their lived experience.
3.1 Appliance usage monitoring
By characterising appliance use in a household, it is possible to quantify energy savings through
efficient appliance use and predict appliance-specific demand from load measurements. Specifi-
cally, we carried out: (i) time-of-use analysis to understand patterns of use of appliances and
comparison of appliance usage and consumption patterns among households (Murray, Liao,
Stankovic, & Stankovic, 2015b); (ii) analysis to quantify energy savings if appliances were used
more efficiently and predict appliance-load demand (Murray, Liao, Stankovic, & Stankovic,
2016); (iii) analysis of suitability of variable tariffs stemming from households-specific con-
sumption (Murray et al., 2015a).
The time-of-kettle-use analysis for 14 REFIT households in (Murray et al., 2015b) confirms that
kettle usage patterns are regular at peak times (morning, evening around dinner) and mainly
sporadic otherwise during the day. Additionally, we show quantitatively, in-line with previous
other studies, that a significant percentage of households overfill their kettle. Additionally,
households that appear not to overfill, based on household occupancy, waste energy on reheat-
ing or re-boiling soon after a boil. We demonstrate in (Murray et al., 2016) that due to well-
defined patterns of use, it is possible to accurately predict kettle usage at a large scale using on-
ly disaggregated smart meter readings. An additional application of our proposed tools is the
prediction of quantifiable energy savings if water filling patterns change through, for example,
more efficient behaviour by filling to ideal levels.
Following the approaches discussed above, we provided one household with energy feedback
(see (Murray et al., 2016, Appendix A) for more details and visual feedback examples) about
changes in energy consumption incurred by replacing their standard kettle with an ‘eco’ vacuum
kettle. A survey was completed prior to feedback to assess the residents’ thoughts. The survey
revealed a number of traits about the household: they were committed to being eco-friendly and
were positive about buying other products aimed at reducing energy, they believed that they had
changed their habits significantly as they actively incorporated the vacuum kettle into their rou-
tine. The feedback was well received and a monthly breakdown of appliance usage deemed
beneficial towards their energy saving goals. Our findings showed close to 50% energy savings
caused by the switch to the vacuum kettle, a reduction in the number of re-heats and a continued
economical usage style even when the vacuum kettle was replaced due a fault.
Energy feedback that incorporates time-of-use of appliances, is useful in determining suitability
of different variable energy tariffs, such as the Economy 7 tariff, for those open to the flexibility
of shifting white goods schedules. For example, while one energy-conscious household on the
Economy 7 tariff used their washing machine mostly overnight (off-peak usage), it could have
benefitted more by shifting the rest of its usage at off-peak times - see Figure 4 in (Murray et
“Feedback in energy demand reduction: Examining evidence and exploring opportunities” Edinburgh, July 2016Page 81
al., 2015a) for details and an example of visual feedback. While assessing tariff suitability, we
found that only 40% of the households who were on the Economy 7 off-peak tariff were bene-
fitting from this. The other 60% were paying more than if they were on a standard tariff.
3.2 Activity-based feedback
Recent studies of energy-related feedback have found that electricity consumption data, aggre-
gated or disaggregated down to appliance level, is not often meaningful to households as it is
not tied to their lived experience (Hargreaves, Nye, & Burgess, 2013), (Wilson, Hargreaves, &
Hauxwell-Baldwin, 2015a). Activities such as cooking, washing, listening to music or playing
computer games are more consistent with households' own experiences of life at home. Activi-
ties are a simple descriptive term for these common ways in which households spend their time
(Wilson et al., 2015b). Thus, in (Wilson et al., 2015b) and (Stankovic et al., 2015), through
analysis of qualitative and quantitative disaggregated appliance-level data, we relate electricity
consumption to domestic activities.
We first disaggregate a household’s total electricity load down to appliance level, generating the
start time, duration, and total electricity consumption for each appliance use. We then make in-
ferences about activities occurring in the home by combining these disaggregated data with an
ontology that formally specifies the relationships between electricity-using appliances and ac-
tivities. Our method was tested on six households, making reliable inferences on four to nine
activities over the course of a month. Results presented in (Stankovic et al., 2015) show that the
time profile of domestic activities has routine characteristics but these tend to vary widely be-
tween households with different socio-demographic characteristics, with unique weekday and
weekend time profiles and also reveals certain households to be large energy users across a
range of activities - see (Stankovic et al., 2015, p. 9-11) for visual feedback examples.
Activity-centric feedback using smart meter disaggregated data has important implications for
providing meaningful energy feedback to households, comparing the energy efficiency of
households' daily activities, and exploring the potential to shift the timing of activities for de-
mand management.
4. Participants’ feedback
After the REFIT study period, when the smart meters and home automation devices were taken
out of the 20 REFIT homes, householders were asked to fill a questionnaire to gauge their expe-
rience and perceptions about the usefulness of smart meters, types of feedback, smart home au-
tomation and what motivated them towards energy conservation. We summarise some of the
responses below. Note that 80-85% of households responded that their energy bill and being
eco-friendly were the primary factors that motivated them towards energy conservation.
In-home display: While 60% of households rarely looked at the real-time in-home display
(IHD), which presented in real time total electricity usage in their home, as well as that of nine
selected appliances, 89% were open to having a smart meter installed in their home. Those who
looked at the IHD daily, responded a heightened awareness of how much electricity their appli-
ances were consuming and changed the way they used their appliances or carried out their daily
activities.
“Feedback in energy demand reduction: Examining evidence and exploring opportunities” Edinburgh, July 2016Page 82
Temporal granularity of feedback: All households said they would like to see how their con-
sumption compared with that of the previous month or year, and 65% stated that their monthly
consumption was useful feedback, whereas only 25% stated that daily or weekly consumption
feedback would be useful. 50% said it was useful to see how they compared with other similar
households, whilst only 10% responded that they would like to breakdown appliance-specific
energy use to the highest consuming appliances in their home.
Breaking the bill down to appliance level: 70% of households said that consumption broken
down to appliance use would be useful.
Load shifting and variable tariffs: 65% of households said they would consider adjusting the
timing of their activities to benefit from a better tariff. The activities or appliances they said
they were willing to shift include dishwashing, laundering including washing machine and tum-
ble dryer, hobbies, charging devices, bread-maker, computing, and charging their car.
5. Conclusion
This paper discusses how load disaggregation from smart meter data can be instrumental in de-
signing enhanced energy feedback, beyond that possible from an IHD only. Besides presenting
an appliance-itemised electricity bill, load disaggregation together with additional data analytics
can support different appliance usage analysis feedback, including wasteful usage habits, suita-
bility of different tariffs, and activity-centric energy usage for common domestic activities such
as cooking or laundering. The feedback generated from load disaggregated data and analytical
methods can be found in (Murray et al., 2015a), (Murray et al., 2015b), (Murray et al., 2016),
(Wilson et al., 2015b), (Stankovic et al., 2015), (Zhao et al., 2016).
The initial feedback from a relatively small study of 20 REFIT households showed the potential
of these types of energy feedback. However, the views were mixed and more detailed studies
and visualization methods need to be investigated to evaluate the value of the proposed feed-
back mechanisms.
6. References
Altrabalsi, H., Stankovic, V., Liao, J., & Stankovic, L. (2016). Low-complexity energy dis-
aggregation using appliance load monitoring. AIMS Energy, 4, 884-905.
doi:10.3934/energy.2016.1.1.
Armel, K. C., Gupta, A., Shrimali, G., & Albert, G. (2013). Is disaggregation the holy grail of
energy efficiency? The case of electricity. Energy Policy, 52, 213–234.
doi:10.1016/j.enpol.2012.08.062.
Elafoudi, G., Stankovic, L., & Stankovic, V. (2014). Power disaggregation of domestic smart
meter readings using Dynamic Time Warping. Proc. ISCCSP-2014 IEEE International Sympo-
sium on Communications, Control, and Signal Processing, 36-39. doi:
10.1109/ISCCSP.2014.6877810.
Hargreaves, T., Nye, M., & Burgess, J. (2013). Keeping energy visible? How householders in-
teract with feedback from smart energy monitors in the longer term. Energy Policy, 52, 126–
134. doi: 10.1016/j.enpol.2012.03.027.
Hart, G.W. (1992). Nonintrusive appliance load monitoring. Proc. IEEE, 80, 1870-1891.
doi:10.1109/5.192069.
“Feedback in energy demand reduction: Examining evidence and exploring opportunities” Edinburgh, July 2016Page 83
Hauxwell-Baldwin, R., Hargreaves, T., & Wilson, C. (2016). REFIT smart home interviews.
[Dataset]. ReShare Data Repository, UK Data Service. https://discover.ukdataservice.ac.uk.
Liao, J., Elafoudi, G., Stankovic, L., & Stankovic, V. (2014). Non-intrusive appliance load
monitoring using low-resolution smart meter data. Proc. IEEE SmartGridComm-2014, 535-540.
doi: https://dx.doi.org/10. 2790/012477.
Murray, D., Liao, J., Stankovic, L., Stankovic, V., Hauxwell-Baldwin, R., Wilson, C., Coleman,
M., Kane, T., & Firth, S. (2015). A data management platform for personalised real-time energy
feedback. Proc. EEDAL-2015 8th Int. Conf. Energy Efficiency in Domestic Appliances and
Lighting, 1293-1307. doi: https://dx.doi.org/ 10.2790/012477.
Murray, D., Liao, J., Stankovic, L., & Stankovic, V. (2015). How to make efficient use of ket-
tles: Understanding usage patterns. Proc. EEDAL-2015 8th Int. Conf. Energy Efficiency in Do-
mestic Appliances and Lighting. 743-755. doi: https://dx.doi.org/10. 2790/012477.
Murray, D.M., Liao, J., Stankovic, L., & Stankovic, V. (2016). Understanding usage patterns of
electric kettle and energy saving potential. Elsevier Applied Energy, 171, 213-242. doi:
10.1016/j.apenergy.2016.03.038.
Stankovic, L., Stankovic, V., Liao, J., Wilson, C., Hauxwell-Baldwin, R., & Coleman, M.
(2015). Understanding domestic appliance use through their linkages to common activities.
Proc. EEDAL-2015 8th Int. Conf. Energy Efficiency in Domestic Appliances and Lighting.
University of Strathclyde (2016). REFIT: Electrical load measurements dataset 2013–2015.
[Dataset]. doi: http://dx.doi.org/10.15129/31da3ece-f902-4e95- a093-e0a9536983c4.
Wilson, C., Hargreaves, T., & Hauxwell-Baldwin, R. (2015). Smart homes and their users: A
systematic analysis and key challenges. Pers. Ubiquitous Computing, 19, 463-476.
doi:10.1007/s00779-014-0813-0.
Wilson, C., Stankovic, L., Stankovic, V., Liao, J., Coleman, M., Hauxwell-Baldwin, R., Kane,
T., Firth, S., & Hassan, T. (2015). Identifying the time profile of everyday activities in the home
using smart meter data. ECEEE Summer Study Proceedings: First fuel now. Lindström, T. L.
(ed.), 933-946 5-046-15.
Zhao, B., Stankovic, L., & Stankovic, V. (2016). On a training-less solution for non-intrusive
appliance load monitoring using graph signal processing. IEEE Access, 4, 1784-1799.
doi:10.1109/ACCESS.2016.25574/460.
Acknowledgement
This work was carried out as part of the REFIT project (“Personalised Retrofit Decision Sup-
port Tools for UK Homes using Smart Home Technology”). The REFIT project ran from 2012-
2015 as a consortium of three universities - Loughborough, Strathclyde and East Anglia - and
ten industry stakeholders. The REFIT project was funded by the Engineering and Physical Sci-
ences Research Council (EPSRC) through linked grants under the Transforming Energy De-
mand in Buildings through Digital Innovation (BuildTEDDI) funding programme. This study
was conducted under Grant Reference EP/K002368/1 (Strathclyde). Other linked grants to con-
sortium members includes EP/K002457/1 (Loughborough) and EP/K002430/1 (East Anglia).
Further details on the REFIT project and related publications can be found at:

“Feedback in energy demand reduction: Examining evidence and exploring opportunities” Edinburgh, July 2016Page 84
http://www.refitsmarthomes.org. The REFIT Electrical Load Measurements dataset can be ac-
cessed at http://dx.doi.org/10.15129/31da3ece-f902-4e95- a093-e0a9536983c4. The qualitative
data, collected by University of East Anglia team, with the same house numbering is available
at: https://discover.ukdataservice.ac.uk.
“Feedback in energy demand reduction: Examining evidence and exploring opportunities” Edinburgh, July 2016Page 85
Visualising Scale-Invariant Comparative Energy Use
Gerard Briscoe, Glasgow School of Art
Abstract
While most energy monitoring efforts include some form of visualisation to provide feedback,
they are often limited by either overly numeric representations or subjective interpretations of
efficiency. Much of the challenge comes from understanding sustainability, or monitoring, only
in terms of efficiency. So, we consider a framework for visualising energy monitoring, beyond
understanding sustainability and monitoring in terms of efficiency alone. Especially given that
increased energy efficiency often promotes increased, rather than reduced, energy use (Jevon’s
Paradox). This allows us to propose a design to visualise scale-invariant comparative energy
use. Including, how to manage integrating high granularity energy monitoring (e.g. a kettle) and
low granularity energy monitoring (e.g. a building). We consider privacy issues of high granu-
larity energy monitoring from the outset, rather than as an addendum. Including, approaches to
manage privacy while still sharing some information. For example, sharing average daily ener-
gy use, rather per minute energy monitoring. Also, how to include energy provisioning infor-
mation, so as to identify the proportion of energy being used from renewable sources. Critically,
we identify approaches for normalisation that would be paramount for ‘comparing’ energy use.
Including ‘filters’ for parameters such as floor space, number of desks, foot fall, building age,
etc. Also, a facility for users to normalise over other parameters they deem appropriate, by inte-
grating data sources to which they may have access. This is all visualised through a ‘zoomable
user interface’, to enable interaction at all levels of granularity, ranging from comparing indi-
vidual devices to comparing continents. We then explore the potential for our visualisation to be
used in crowd-sourcing recognition of significant comparative observations. Also, the potential
to provide a digital space for co-design to address them. We conclude by considering the poten-
tial of our approach for community-driven emergent sustainability.
“Feedback in energy demand reduction: Examining evidence and exploring opportunities” Edinburgh, July 2016Page 86
Lessons on visual feedback from the eViz Project: The evidence for using
thermal images as a visual intervention.
Matthew Fox, Julie Goodhew, Christine Boomsma, Steve Goodhew, Sabine Pahl. Plymouth
University. Presentation by Matthew Fox ([email protected])
Abstract
Thermal images can play an important role in feeding back the consequence or outcome from
energy use behaviour and through providing a platform to motivate energy efficient home
improvements. This article describes four studies conducted through the eViz project, which
used a variety of qualitative and quantitative methods, to investigate the impact that thermal
images can have on householder retrofit behaviour. Results from thermal image investigations
were benchmarked against carbon footprint audit and control cases, and ranged from simple
generic letters on energy efficiency to more tailored in-depth thermal image reporting. Findings
have suggested that thermal images do provide motivation for householders to undertake energy
efficient improvements on their house. The extent to which thermal images promote a
behavioural effect is likely to depend on the personal nature of the images’ subject, and the
degree to which the viewer can elaborate on the images. Moving onto the next steps, this article
reports on an on-going project to scale up this work to a citywide context in Canada.
1.1 Introduction
Energy-feedback has generally focussed on providing energy users with information about their
energy use. This can be in the form of numbers, graphs and via apps or in- homedisplays, for
example. Often this usage relates to appliance use and research in this area focuses on
evaluating the impact of representing current energy use and analysing how to represent energy
usage data (Fischer, 2008; Hargreaves, 2010). This type of feedback tends to dominate the
literature and yet there are other ways to feed information about energy use back to
householders. Indeed there have been calls to develop and test innovative feedback devices,
especially those that have user engagement in mind (Buchanan, Russo & Anderson, 2015).
Space heating is an important issue also for energy demand reduction. In the UK, heating a
home can make up 66% of overall energy use (DECC, 2013).
The eViz Project (Energy Visualisation for Carbon Reduction) evaluated the use of thermal
images in a series of studies as a behavioural intervention aimed at reducing the energy used to
heat a building. Feedback is regarded as a consequence strategy, communicating the
consequence or outcome that is contingent on a desired energy related behaviour. Using visual
images such as thermal images can provide such feedback in that the technology acts as a
medium to communicate firstly the areas of heat loss and secondly, by inference, the
consequence of energy efficiency actions targeting that specific heat loss. Indeed, they can
provide situation and behaviour specific information to a building user, prompt new goals and
motives for energy efficiency (Goodhew, Pahl, Auburn & Goodhew, 2015).
We discuss the evidence for the use of thermal images as such an intervention, drawing on an

“Feedback in energy demand reduction: Examining evidence and exploring opportunities” Edinburgh, July 2016Page 87
overview of the results of four studies using mixed qualitative and quantitative methods with
householders in the field, ranging from in-depth, tailored approaches to simple letter
communications showing thermal images of typical houses.
We present a collection of typical thermal images taken in and around domestic homes and
discuss what they can communicate to building users, in terms of building defects. Next we
summarise the evidence, which suggests that viewing such images can promote the take up of
energy efficiency actions. We discuss the conditions that maximise or minimise such a
behavioural effect across the four studies. Finally we report on a current collaboration with
Canadian partners aiming to scale up thermal imaging approaches. In conclusion, thermal
imaging is a powerful method to communicate heat and energy loss to householders that can
lead to better understanding of heat loss and motivate retrofit actions.
1.2 The Affordances of thermal images, feedback on building defects, and heat loss.
Thermal imaging provides visual evidence of building defects (conduction, ventilation,
draughts, missing insulation). A thermal camera is used to measure the thermal radiation
emitted from a feature, which is then converted into a visual image, where differences in colour
patterns signify differences in apparent surface temperature. Using this technology, areas of
unexpected heat loss in building features and potential building defects can be inferred. Figures
1,2, and 3 present example thermal images of typical building defects.
Many have seen the images as a potential behavioural intervention to encourage the uptake of
energy efficiency measures amongst householders (Burchell, Rettie & Roberts, 2014, with
Smart Communities and many UK Community group projects including The CHEESE Project
in Bristol, Transition Bath, South West Oxfordshire). The underlying premise is that seeing
(normally invisible) unexpected heat loss from a building will motivate the viewer to take
action to stop that loss.
Fig 1: An example of conduction heat loss and thermal bridging

“Feedback in energy demand reduction: Examining evidence and exploring opportunities” Edinburgh, July 2016Page 88
Fig 2: Example of ventilation heat loss from the interior of the home
Fig 3: An example of missing insulation
1.3 The behavioural background
The behavioural context is that asking people to take voluntary actions to increase energy
efficiency measures in their homes can be problematic due to the nature of heat/energy use.
There is potential for individuals to be disconnected from the energy they use to heat their
home. They may not be aware of the degree of heat, which is leaving the building (heat egress),
through poorly insulated walls, lofts, fireplaces, curtain less windows, or how hard their heating
system is working to achieve their desired comfort level. Thermal images can show the
normally invisible heat as visible; thereby presenting visual evidence of unexpected areas of
heat loss (Fox et al., 2015; Pearson, 2011). If the householder knows the building they might be
able to connect their energy efficiency actions/inactions and behaviours to the heat loss. In this
sense, thermal images can provide a visual medium (Midden, Kaiser & McCalley, 2007)
through which heat loss issues are easily communicated and the consequence of energy
efficiency actions can be imagined. It is a feature of visualisations that they can communicate
messages quickly, powerfully and support the conceptualisation of complex messages
(Sheppard, 2001; 2005; Nicholson-Cole, 2005).
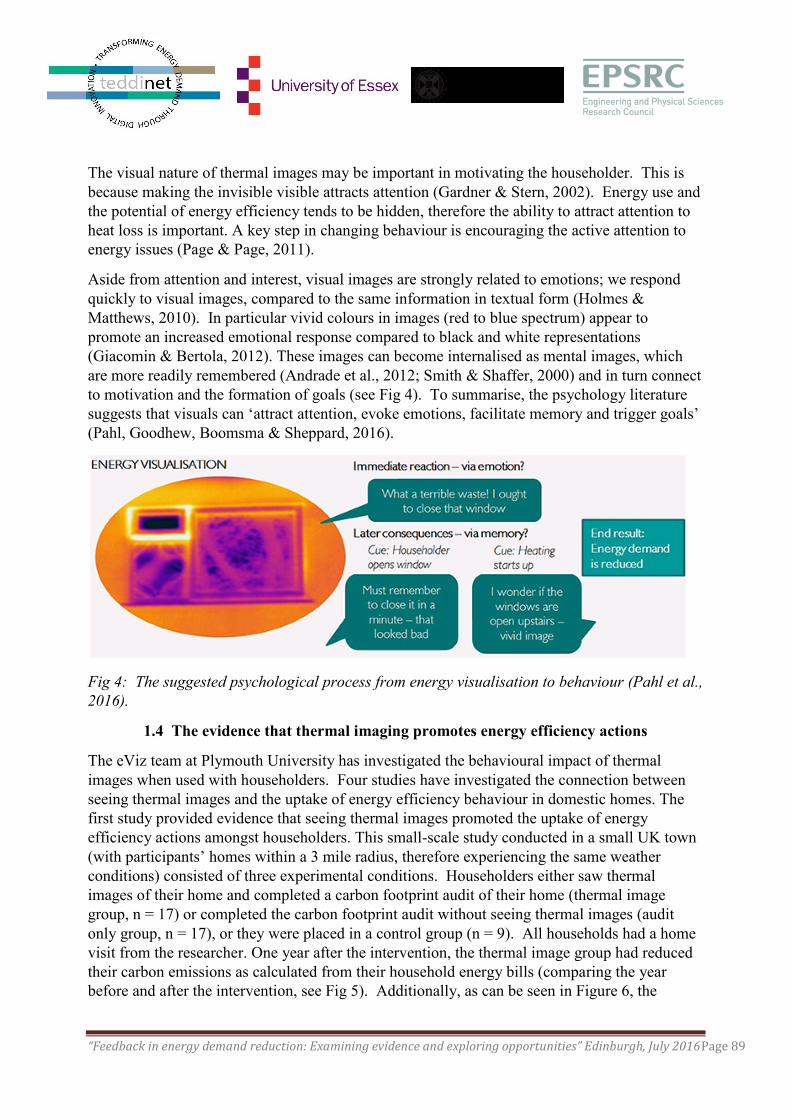
“Feedback in energy demand reduction: Examining evidence and exploring opportunities” Edinburgh, July 2016Page 89
The visual nature of thermal images may be important in motivating the householder. This is
because making the invisible visible attracts attention (Gardner & Stern, 2002). Energy use and
the potential of energy efficiency tends to be hidden, therefore the ability to attract attention to
heat loss is important. A key step in changing behaviour is encouraging the active attention to
energy issues (Page & Page, 2011).
Aside from attention and interest, visual images are strongly related to emotions; we respond
quickly to visual images, compared to the same information in textual form (Holmes &
Matthews, 2010). In particular vivid colours in images (red to blue spectrum) appear to
promote an increased emotional response compared to black and white representations
(Giacomin & Bertola, 2012). These images can become internalised as mental images, which
are more readily remembered (Andrade et al., 2012; Smith & Shaffer, 2000) and in turn connect
to motivation and the formation of goals (see Fig 4). To summarise, the psychology literature
suggests that visuals can ‘attract attention, evoke emotions, facilitate memory and trigger goals’
(Pahl, Goodhew, Boomsma & Sheppard, 2016).
Fig 4: The suggested psychological process from energy visualisation to behaviour (Pahl et al.,
2016).
1.4 The evidence that thermal imaging promotes energy efficiency actions
The eViz team at Plymouth University has investigated the behavioural impact of thermal
images when used with householders. Four studies have investigated the connection between
seeing thermal images and the uptake of energy efficiency behaviour in domestic homes. The
first study provided evidence that seeing thermal images promoted the uptake of energy
efficiency actions amongst householders. This small-scale study conducted in a small UK town
(with participants’ homes within a 3 mile radius, therefore experiencing the same weather
conditions) consisted of three experimental conditions. Householders either saw thermal
images of their home and completed a carbon footprint audit of their home (thermal image
group, n = 17) or completed the carbon footprint audit without seeing thermal images (audit
only group, n = 17), or they were placed in a control group (n = 9). All households had a home
visit from the researcher. One year after the intervention, the thermal image group had reduced
their carbon emissions as calculated from their household energy bills (comparing the year
before and after the intervention, see Fig 5). Additionally, as can be seen in Figure 6, the
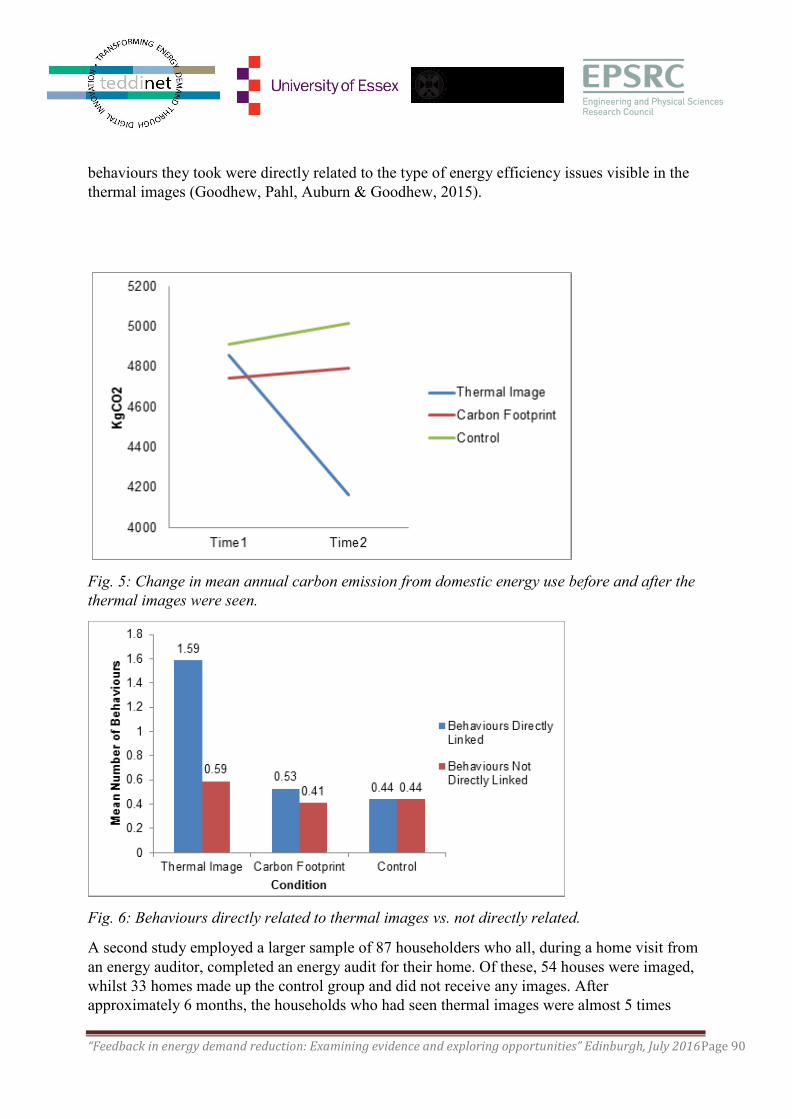
“Feedback in energy demand reduction: Examining evidence and exploring opportunities” Edinburgh, July 2016Page 90
behaviours they took were directly related to the type of energy efficiency issues visible in the
thermal images (Goodhew, Pahl, Auburn & Goodhew, 2015).
Fig. 5: Change in mean annual carbon emission from domestic energy use before and after the
thermal images were seen.
Fig. 6: Behaviours directly related to thermal images vs. not directly related.
A second study employed a larger sample of 87 householders who all, during a home visit from
an energy auditor, completed an energy audit for their home. Of these, 54 houses were imaged,
whilst 33 homes made up the control group and did not receive any images. After
approximately 6 months, the households who had seen thermal images were almost 5 times

“Feedback in energy demand reduction: Examining evidence and exploring opportunities” Edinburgh, July 2016Page 91
more likely to have installed draught proofing than the households who had not seen thermal
images (Goodhew, Pahl, Auburn & Goodhew, 2015). These two studies provide evidence that
seeing feedback in the form of thermal images of one’s own home can promote the take up of
simple energy efficiency measures.
Fig. 7: Example of thermal image taken during Study 2, showing dark (cold) areas where there
is cold air ingress around the surround of the doorway which leads outside (Goodhew, et al.,
2015).
The two studies reported above used thermal images personalised to the householder (i.e. of
their own home). A third study (Boomsma, Goodhew, Goodhew & Pahl, 2016) sought to
explore this aspect and focussed on the importance of personalising the thermal images. The
question was whether a less personalised thermal imaging approach could also trigger goals to
conserve energy in the home. A homeowner may not easily connect their own behaviour with
information in a generic thermal image (an image of another person’s home), and generic
images are likely to be perceived less relevant to the householder. This study consisted of three
conditions. One group of householders received an e-mail report containing the images taken
during a visit from a thermographer. A second group received the same type of report but
containing thermal images of ‘typical homes in your area’ whereas a third condition received a
report with text only information (i.e. no images). Householders (N = 233) reported that they
recalled thermal images better than text information, but the personalised group reported the
images as more intrusive (the images ‘popped into their heads’ more often. Personalised
thermal image reports were elaborated by the householders more than the generic images.
Householders said they looked at the personalised images more often (Fig. 8) and shared them
with others more than did the comparison groups. Furthermore the householders who saw the
personalised thermal images reported a stronger belief that they would benefit from energy
efficiency measures and were more likely to report that they had changed their plans for their
homes.
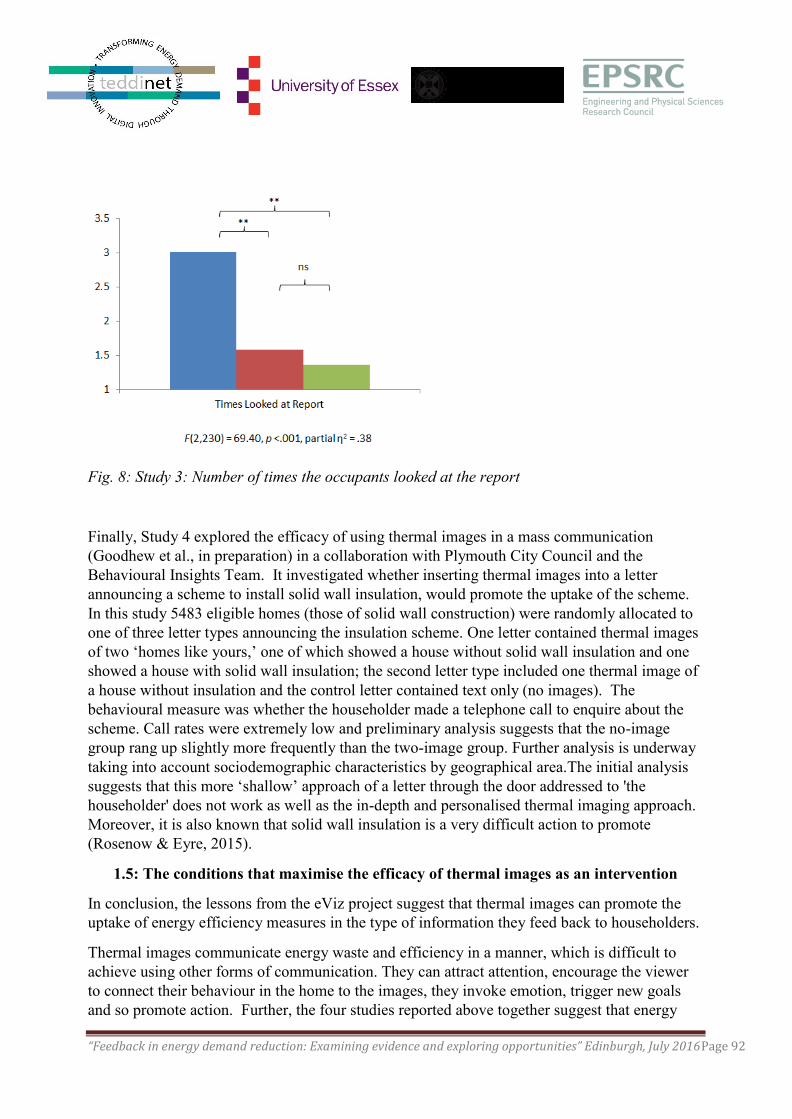
“Feedback in energy demand reduction: Examining evidence and exploring opportunities” Edinburgh, July 2016Page 92
Fig. 8: Study 3: Number of times the occupants looked at the report
Finally, Study 4 explored the efficacy of using thermal images in a mass communication
(Goodhew et al., in preparation) in a collaboration with Plymouth City Council and the
Behavioural Insights Team. It investigated whether inserting thermal images into a letter
announcing a scheme to install solid wall insulation, would promote the uptake of the scheme.
In this study 5483 eligible homes (those of solid wall construction) were randomly allocated to
one of three letter types announcing the insulation scheme. One letter contained thermal images
of two ‘homes like yours,’ one of which showed a house without solid wall insulation and one
showed a house with solid wall insulation; the second letter type included one thermal image of
a house without insulation and the control letter contained text only (no images). The
behavioural measure was whether the householder made a telephone call to enquire about the
scheme. Call rates were extremely low and preliminary analysis suggests that the no-image
group rang up slightly more frequently than the two-image group. Further analysis is underway
taking into account sociodemographic characteristics by geographical area.The initial analysis
suggests that this more ‘shallow’ approach of a letter through the door addressed to 'the
householder' does not work as well as the in-depth and personalised thermal imaging approach.
Moreover, it is also known that solid wall insulation is a very difficult action to promote
(Rosenow & Eyre, 2015).
1.5: The conditions that maximise the efficacy of thermal images as an intervention
In conclusion, the lessons from the eViz project suggest that thermal images can promote the
uptake of energy efficiency measures in the type of information they feed back to householders.
Thermal images communicate energy waste and efficiency in a manner, which is difficult to
achieve using other forms of communication. They can attract attention, encourage the viewer
to connect their behaviour in the home to the images, they invoke emotion, trigger new goals
and so promote action. Further, the four studies reported above together suggest that energy
“Feedback in energy demand reduction: Examining evidence and exploring opportunities” Edinburgh, July 2016Page 93
efficiency actions are promoted where there is increased elaboration by the householder.
Thermal imaging feedback in the form of a letter (unannounced) containing images of other
homes did not promote a behavioural effect. Yet, non-personal images were recalled better than
textual information in a report on energy efficiency. This suggests that images attract attention
anyhow; however, personalised images were recalled more and were more intrusive; they
‘popped into people’s heads’. Additionally, the personalised images were looked at more often
and shared more. Ultimately, energy efficiency actions were promoted when images were
personal to the householder. The behavioural effect is likely to be stronger the more
personalised the images are to the householder viewing them and the greater the opportunity
that the householder can elaborate and act on them.
1.6: Future work and scaling up thermal imaging as a feedback intervention
Recent work by Plymouth University in this field has scaled up the use of thermal imaging for
visual intervention. This has been undertaken in collaboration with the University of British
Columbia, where mass/large scale thermal imaging (drive-by thermography) is proposed as an
intervention to motivate carbon reduction within entire neighbourhoods (several thousand
homes) in a large Canadian city.
It is common in large-scale thermal imaging projects (e.g. drive-by and aerial thermography) for
those who commission them to run out of time, money and enthusiasm before undertaking
community engagement. The impact of such thermal imaging projects therefore often fails to
deliver any meaningful or measureable energy reduction improvement at an individual
homeowner level.
This work, which is due to be undertaken in winter 2016/17 will seek to bridge the gap between
undertaking large scale thermal imaging projects and understanding the level of engagement,
where thermal images are used to motivate homeowners to undertake energy upgrades.
1.7: Conclusion
This paper has presented an additional way of presenting energy information to householders,
focussing on an area of energy use, space heating. It uses visuals to communicate heat loss so
that the householder can infer the efficacy of taking action to mitigate that loss and thus save
energy (and improve thermal comfort). We call for the debate around the efficacy of feedback,
to include innovative and different ways of communicating energy use.
References
Andrade, J., May, J., and Kavanagh, D. (2012). Sensory imagery in craving: from cognitive
psychology to new treatments for addiction. J. Exp. Psychopathol. 3, 127–145. doi:
10.5127/jep.024611
Boomsma, C, et al. (2016) "Improving the visibility of energy use in home heating in England:
Thermal images and the role of visual tailoring." Energy Research & Social Science 14: 111-
121
Buchanan, K., Russo, R., Andreson, B. (2015) The question of energy reduction: The
problem(s) with feedback. Energy Policy. 77: 89–96 doi:10.1016/j.enpol.2014.12.008
“Feedback in energy demand reduction: Examining evidence and exploring opportunities” Edinburgh, July 2016Page 94
Burchell, K., Rettie, R., Roberts, T., (2014). Working together to save energy? Report of the
smart communities project. Available at:
http://business.kingston.ac.uk/sites/all/themes/kingston_business/charmproject/smartcommuniti
es.pdf (Accessed: 16/06/2016).
DECC (2013a). Energy consumption in the UK (2013). Retrieved from:
https://www.gov.uk/government/uploads/system/uploads/attachment_data/file/65954/chapter_3
_domestic_factsheet.pdf
Fischer, C., (2008) Feedback on household electricity consumption: a tool for saving energy?
EnergyEffic. 1(1),79–104.
Fox, M., Coley, D., Goodhew, S. & Wilde, P. D. (2014) 'Thermography methodologies for
detecting energy related building defects'. Renewable and Sustainable Energy Reviews, 40 pp
296 – 310
Gardner, G.T., & Stern, P.C. (2002) Environmental Problems and Human Behaviour, Boston:
Pearson.
Giacomin, J. & Bertola, D., Human emotional response to energy visualisations (2012)
International Journal of Industrial Ergonomics, 42, 542- 552.
Goodhew, J., Goodhew, S., Auburn, T., De Wilde, P., Pahl, S. (2009) " A Preliminary
Investigation of the Potential for Thermographic Images to Influence Householders
Understanding of Home Energy Consumption" In: Dainty (Ed) Procs 25th Annual ARCOM
Conference, 7 -9 September 2009, Nottingham, UK, ARCOM, 971-79.
Goodhew, J., Pahl, S., Auburn, T., Goodhew, S. (2015) Making Heat Visible; Promoting energy
conservation behaviors through thermal imaging. Environment and Behavior (Published online
9th Sept 2014) DOI: 10.1177/0013916514546218.
Holmes, E. A., and Mathews, A. (2010). Mental imagery in emotion and emotional disorders.
Clin. Psychol. Rev. 30, 349–362. doi: 10.1016/j.cpr.2010.01.001
Hargreaves, T., Nye, M., J. Burgess, J. Making energy visible: a qualitative field study of how
householders interact with feedback from smart energy monitors. Energy Policy, 38 (10)
(2010), pp. 6111–6119
Midden, C.J.H., Kaiser, F.G., McCalley, L.T. (2007). Technology’s four roles in understanding
individuals’ conservation of natural resources. Journal of Social Issues, 63 (1), 155-174.
Page M., Page N. (2011). Green behaviour change: HOT topics. In Bartlett D., editor. (Ed.),
Going green: The psychology of sustainability in the workplace. London, UK: British
Psychological Society; Vol. chapter 8, p. 65-75
Pahl, S., Goodhew, J., Boomsma, C., Sheppard, S. (2016) The Role of Energy Visualization in
Addressing Energy Use: Insights from the eViz Project. Frontiers in Psychology. 7.
DOI:10.3389/fpsyg.2016.00092
Pearson, C. (2002) Thermal Imaging of Building Fabric. BSRIA, Technical Note TN 9/2002. A
best practice guide for continuous insulation

“Feedback in energy demand reduction: Examining evidence and exploring opportunities” Edinburgh, July 2016Page 95
Sheppard, S. R. J. (2001). Guidance for crystal ball gazers: Developing a code of ethics for
landscape visualization. Landscape Urban Plan. 54, 183–199. doi: 10.1016/S0169-
2046(01)00135-9.
Sheppard S. R. J. (2005). Landscape visualisation and climate change: The potential for
influencing perceptions and behaviour. Environmental Science and Policy, 8, 637-654.
Smith, S. M., and Shaffer, D. R. (2000). Vividness can undermine or enhance message
processing: the moderating role of vividness congruency. Pers. Soc. Psychol. Bull. 26, 769–779.
doi: 10.1177/0146167200269003
“Feedback in energy demand reduction: Examining evidence and exploring opportunities” Edinburgh, July 2016Page 96
SESSION 3: Learning Lessons & Limits
Exploring energy feedback at community and household level through ther-
mography, carbon mapping, online platform and home energy visits
Professor Rajat Gupta* and Laura Barnfield
Low Carbon Building Group, Oxford Brookes University, [email protected]
* Presenting
Abstract
Alongside improved energy efficient technologies, reductions in demand through behaviour
change are seen as key to reducing the household sector’s energy consumption. Feedback to
households seeks to raise awareness and motivate behaviour change. This paper outlines the
findings of a research study that used a variety of energy feedback approaches in order to stimu-
late behaviour change in communities and households that were involved in low carbon com-
munity activities. The approaches included carbon mapping workshops, thermal imaging, a
web-based platform providing households with near-real-time energy and environmental data
and personalised home energy reports combined with researcher visits.
Overall the majority of the feedback approaches used were able to some extent, to engage, raise
awareness and motivate households into action. Furthermore, the findings drive home the point
that it is difficult to prompt durable carbon reductions through technology alone; knowledge and
practical know-how need to be transferred along with technology. Where feedback is con-
cerned, some degree of personal contact was usually needed to make the most of what the feed-
back technology was able to provide in the way of information.
Introduction
The UK’s household sector accounts for 29% of the UK’s total energy consumption (DECC,
2014). As such the need for energy efficiency and conservation in this sector is critical in order
to mitigate climate change, reduce national carbon emissions and enhance energy security
(UKERC, 2009). Whilst improvements in the energy efficiency of household technologies
(from washing machines to fabric measures such as wall insulation) are seen as key to reducing
the household sector’s energy consumption, studies have indicated that even with more efficient
technologies installed, households do not necessarily consume less (Gupta & Chandiwala,
2010). The reasons for this are varied and complex, with cultural and social norms, habitual be-
haviours, and the attitudes and values of the occupants all being seen to influence the occu-
pant’s decisions to use energy (Gupta et al, 2014).
The invisibility of energy is seen as a reason why households, even if they do profess positive
environmental attitudes do not always behave in ways that conserve energy use (Burgess &
Nye, 2008; Hargreaves et al, 2010). As such, several studies (Steg, 2008; McKerracher & Torri-
ti, 2012; Buchanan et al, 2014) indicate the provision of information and feedback on domestic
energy consumption is critical to making energy visible, and subsequently prompting changes in
energy behaviours and practices. Feedback can be provided to households in a number of ways,
including via groups or directly to individuals (Abrahamse et al, 2007). Whilst feedback to in-
dividuals e.g. via home energy audits can provide tailored information on where further energy
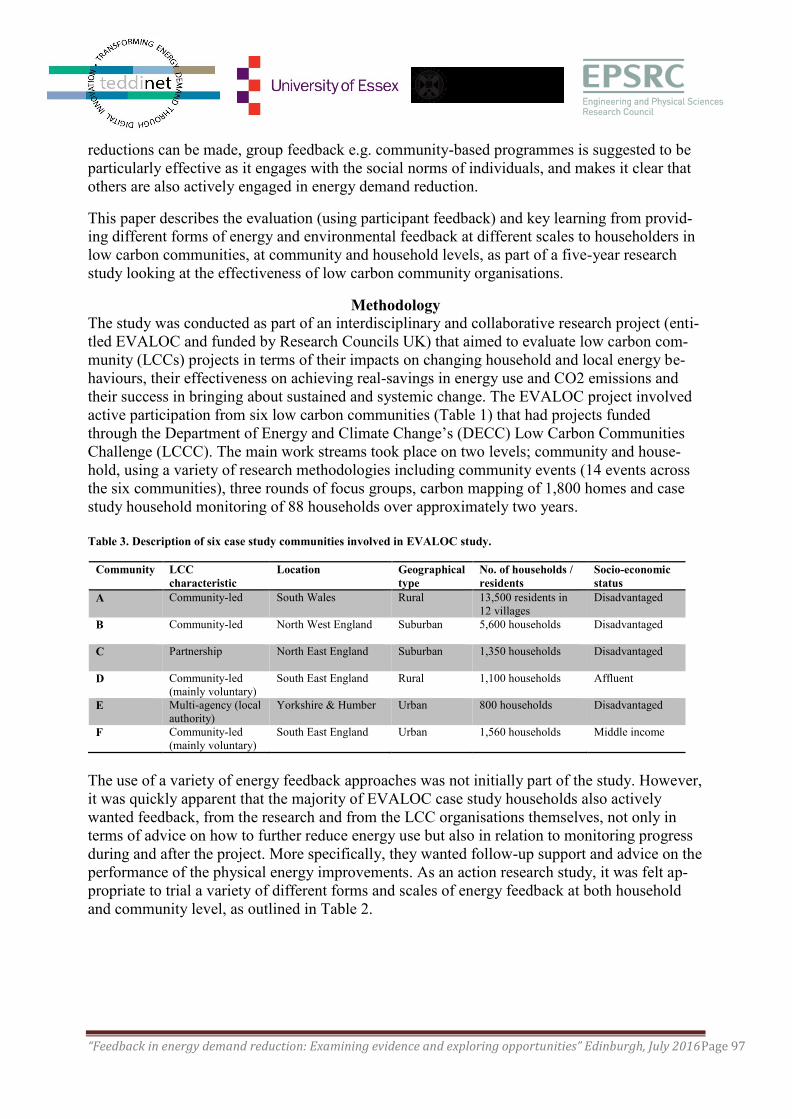
“Feedback in energy demand reduction: Examining evidence and exploring opportunities” Edinburgh, July 2016Page 97
reductions can be made, group feedback e.g. community-based programmes is suggested to be
particularly effective as it engages with the social norms of individuals, and makes it clear that
others are also actively engaged in energy demand reduction.
This paper describes the evaluation (using participant feedback) and key learning from provid-
ing different forms of energy and environmental feedback at different scales to householders in
low carbon communities, at community and household levels, as part of a five-year research
study looking at the effectiveness of low carbon community organisations.
Methodology
The study was conducted as part of an interdisciplinary and collaborative research project (enti-
tled EVALOC and funded by Research Councils UK) that aimed to evaluate low carbon com-
munity (LCCs) projects in terms of their impacts on changing household and local energy be-
haviours, their effectiveness on achieving real-savings in energy use and CO2 emissions and
their success in bringing about sustained and systemic change. The EVALOC project involved
active participation from six low carbon communities (Table 1) that had projects funded
through the Department of Energy and Climate Change’s (DECC) Low Carbon Communities
Challenge (LCCC). The main work streams took place on two levels; community and house-
hold, using a variety of research methodologies including community events (14 events across
the six communities), three rounds of focus groups, carbon mapping of 1,800 homes and case
study household monitoring of 88 households over approximately two years.
Table 3. Description of six case study communities involved in EVALOC study.
Community LCC
characteristic
Location Geographical
type
No. of households /
residents
Socio-economic
status
A Community-led South Wales Rural 13,500 residents in
12 villages
Disadvantaged
B
Community-led North West England Suburban 5,600 households Disadvantaged
C
Partnership North East England Suburban 1,350 households Disadvantaged
D Community-led
(mainly voluntary)
South East England Rural 1,100 households Affluent
E Multi-agency (local
authority)
Yorkshire & Humber Urban 800 households Disadvantaged
F Community-led
(mainly voluntary)
South East England Urban 1,560 households Middle income
The use of a variety of energy feedback approaches was not initially part of the study. However,
it was quickly apparent that the majority of EVALOC case study households also actively
wanted feedback, from the research and from the LCC organisations themselves, not only in
terms of advice on how to further reduce energy use but also in relation to monitoring progress
during and after the project. More specifically, they wanted follow-up support and advice on the
performance of the physical energy improvements. As an action research study, it was felt ap-
propriate to trial a variety of different forms and scales of energy feedback at both household
and community level, as outlined in Table 2.
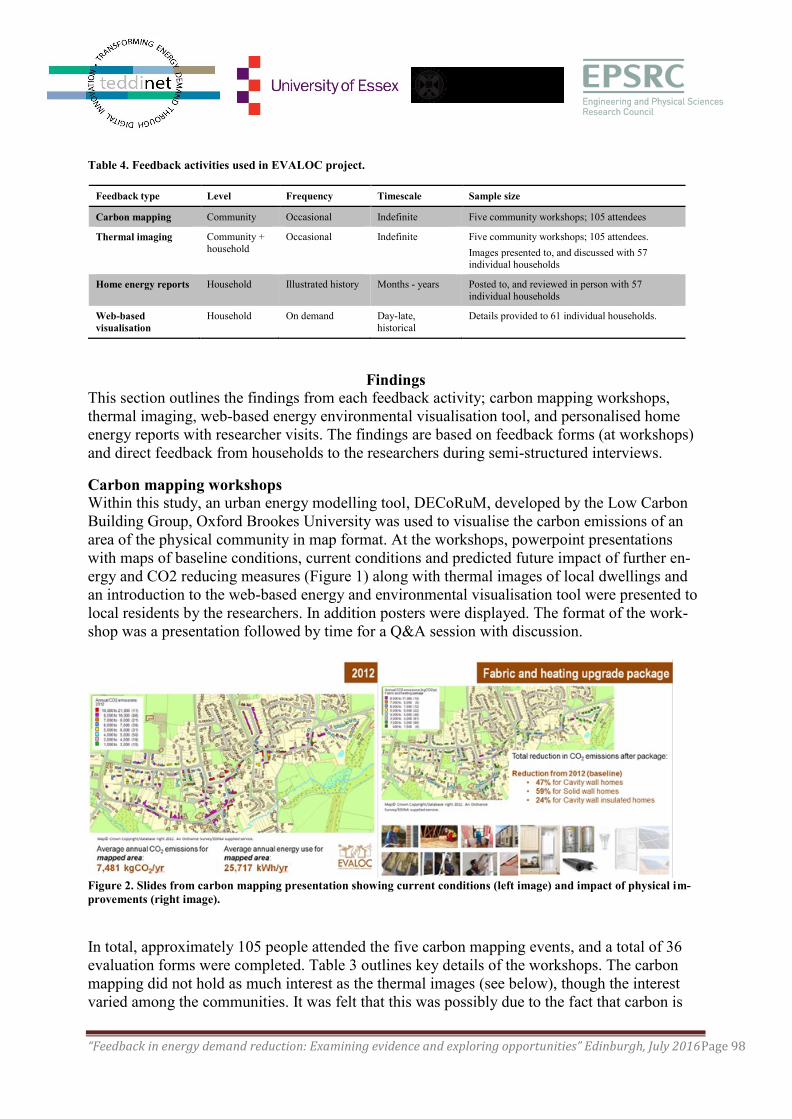
“Feedback in energy demand reduction: Examining evidence and exploring opportunities” Edinburgh, July 2016Page 98
Table 4. Feedback activities used in EVALOC project.
Feedback type Level Frequency Timescale Sample size
Carbon mapping Community Occasional Indefinite Five community workshops; 105 attendees
Thermal imaging Community +
household
Occasional Indefinite Five community workshops; 105 attendees.
Images presented to, and discussed with 57
individual households
Home energy reports Household Illustrated history Months - years Posted to, and reviewed in person with 57
individual households
Web-based
visualisation
Household On demand Day-late,
historical
Details provided to 61 individual households.
Findings
This section outlines the findings from each feedback activity; carbon mapping workshops,
thermal imaging, web-based energy environmental visualisation tool, and personalised home
energy reports with researcher visits. The findings are based on feedback forms (at workshops)
and direct feedback from households to the researchers during semi-structured interviews.
Carbon mapping workshops
Within this study, an urban energy modelling tool, DECoRuM, developed by the Low Carbon
Building Group, Oxford Brookes University was used to visualise the carbon emissions of an
area of the physical community in map format. At the workshops, powerpoint presentations
with maps of baseline conditions, current conditions and predicted future impact of further en-
ergy and CO2 reducing measures (Figure 1) along with thermal images of local dwellings and
an introduction to the web-based energy and environmental visualisation tool were presented to
local residents by the researchers. In addition posters were displayed. The format of the work-
shop was a presentation followed by time for a Q&A session with discussion.
Figure 2. Slides from carbon mapping presentation showing current conditions (left image) and impact of physical im-
provements (right image).
In total, approximately 105 people attended the five carbon mapping events, and a total of 36
evaluation forms were completed. Table 3 outlines key details of the workshops. The carbon
mapping did not hold as much interest as the thermal images (see below), though the interest
varied among the communities. It was felt that this was possibly due to the fact that carbon is

“Feedback in energy demand reduction: Examining evidence and exploring opportunities” Edinburgh, July 2016Page 99
not a familiar concept to most people, and using costs or even kWh would perhaps have en-
gaged people more. Furthermore, the need for technical detail varied within different case stud-
ies, and highlights the need to ensure the presented information is edited and formatted to suit
different requirements and contextual needs. In general, the presentations were found to be in-
formative but possibly too technical. The majority of respondents stated that they found the dis-
cussion more useful, and left the workshop feeling motived to undertake either physical changes
to their homes and/or change habitual behaviours such as turning heating down.
If the carbon map is to be developed as an engagement tool in communities with few resources
to draw on, the EVALOC experience suggests a need to combine carbon mapping with the
identification of what physical interventions would meet ‘golden- rule’-type requirements, and
pointers to how householders might be able to meet the upfront costs.
A light touch web-based version of DECoRuM would be useful for communities and house-
holders to self-conduct with minimum data, rapid energy assessment of their house, street or
neighbourhood, and predict the potential of energy, CO2 and cost savings from appropriate en-
ergy saving measures.
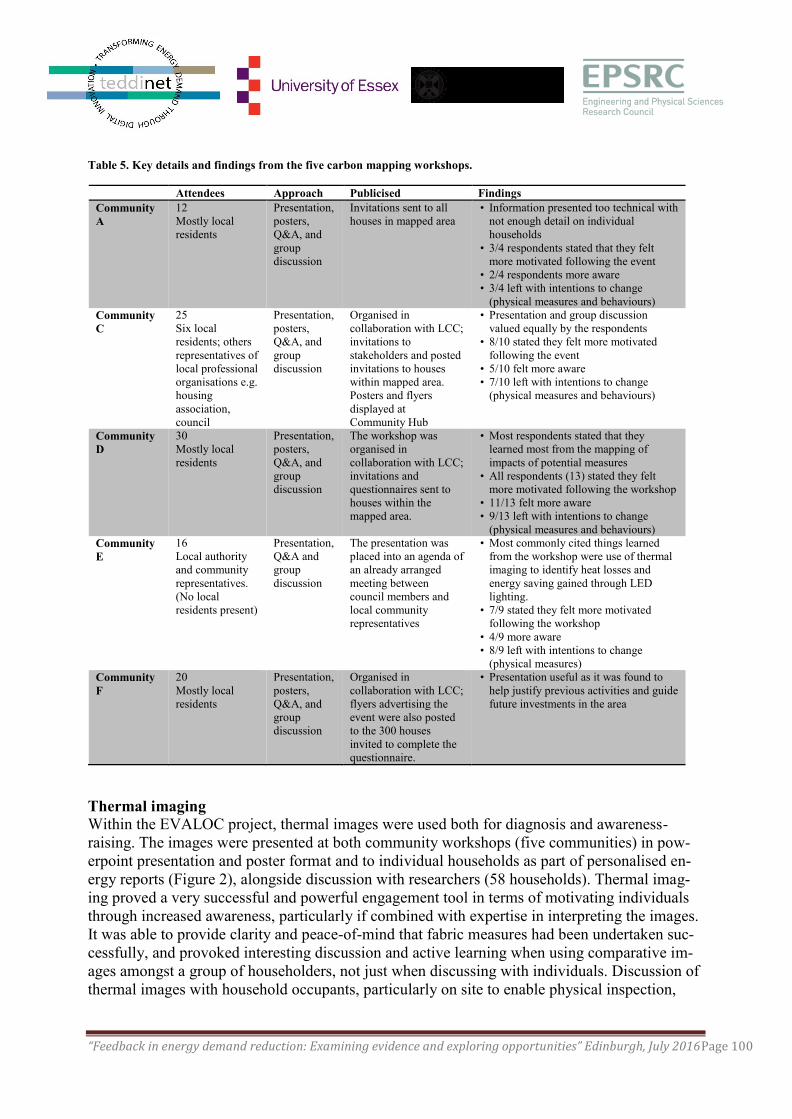
“Feedback in energy demand reduction: Examining evidence and exploring opportunities” Edinburgh, July 2016Page 100
Table 5. Key details and findings from the five carbon mapping workshops.
Attendees Approach Publicised Findings
Community
A
12
Mostly local
residents
Presentation,
posters,
Q&A, and
group
discussion
Invitations sent to all
houses in mapped area
• Information presented too technical with
not enough detail on individual
households
• 3/4 respondents stated that they felt
more motivated following the event
• 2/4 respondents more aware
• 3/4 left with intentions to change
(physical measures and behaviours)
Community
C
25
Six local
residents; others
representatives of
local professional
organisations e.g.
housing
association,
council
Presentation,
posters,
Q&A, and
group
discussion
Organised in
collaboration with LCC;
invitations to
stakeholders and posted
invitations to houses
within mapped area.
Posters and flyers
displayed at
Community Hub
• Presentation and group discussion
valued equally by the respondents
• 8/10 stated they felt more motivated
following the event
• 5/10 felt more aware
• 7/10 left with intentions to change
(physical measures and behaviours)
Community
D
30
Mostly local
residents
Presentation,
posters,
Q&A, and
group
discussion
The workshop was
organised in
collaboration with LCC;
invitations and
questionnaires sent to
houses within the
mapped area.
• Most respondents stated that they
learned most from the mapping of
impacts of potential measures
• All respondents (13) stated they felt
more motivated following the workshop
• 11/13 felt more aware
• 9/13 left with intentions to change
(physical measures and behaviours)
Community
E
16
Local authority
and community
representatives.
(No local
residents present)
Presentation,
Q&A and
group
discussion
The presentation was
placed into an agenda of
an already arranged
meeting between
council members and
local community
representatives
• Most commonly cited things learned
from the workshop were use of thermal
imaging to identify heat losses and
energy saving gained through LED
lighting.
• 7/9 stated they felt more motivated
following the workshop
• 4/9 more aware
• 8/9 left with intentions to change
(physical measures)
Community
F
20
Mostly local
residents
Presentation,
posters,
Q&A, and
group
discussion
Organised in
collaboration with LCC;
flyers advertising the
event were also posted
to the 300 houses
invited to complete the
questionnaire.
• Presentation useful as it was found to
help justify previous activities and guide
future investments in the area
Thermal imaging
Within the EVALOC project, thermal images were used both for diagnosis and awareness-
raising. The images were presented at both community workshops (five communities) in pow-
erpoint presentation and poster format and to individual households as part of personalised en-
ergy reports (Figure 2), alongside discussion with researchers (58 households). Thermal imag-
ing proved a very successful and powerful engagement tool in terms of motivating individuals
through increased awareness, particularly if combined with expertise in interpreting the images.
It was able to provide clarity and peace-of-mind that fabric measures had been undertaken suc-
cessfully, and provoked interesting discussion and active learning when using comparative im-
ages amongst a group of householders, not just when discussing with individuals. Discussion of
thermal images with household occupants, particularly on site to enable physical inspection,

“Feedback in energy demand reduction: Examining evidence and exploring opportunities” Edinburgh, July 2016Page 101
was able to provide the researchers with invaluable insight into any apparent anomalies within
the thermal images. Several of the case study households reported on actions following the pro-
vision of the thermal images; “By the way, the unidentified cold spot on the corner of the front
bedroom window was the result of dampness caused by crumbling pointing between the stones.
Thanks to you I can have it restored – I would never have known about it otherwise.” And, “I
took the pictures into the local housing trust because the flat below, it had a big light spot under
the window…”
Figure 3. Example of a thermal image used during discussion of a home energy report.
Web-based energy and environmental visualisation tool
As part of the study, energy and environmental monitoring data for 61 households was uploaded
onto a web-based visualisation platform (Figure 3), hosted by EnergyDeck
(www.energydeck.com). The aim was to provide the householders with real-time (or near-real-
time) energy and environmental data. The platform provided comparative benchmarks and al-
lowed the user to search for specific dates and times. It also allowed users to select different
variables (i.e. gas data and living room temperature) and display these on one graph together.
Invitations were sent to 50 of the households by email and postal invitations along with a guid-
ance brochure were sent to all 61.
Only 22 of the 61 signed up, with approximately 5 requiring significant help from the research-
ers. The project findings highlight the fact that a web-based feedback approach is not suitable
for all individuals and that feedback methods should be carefully thought through in terms of
accessibility and readability. The level of interaction appeared to be due to the type of individu-
al and their familiarity and use of computers and the internet, rather than which community they
belonged to. For example, very high and very low interactions were both observed in
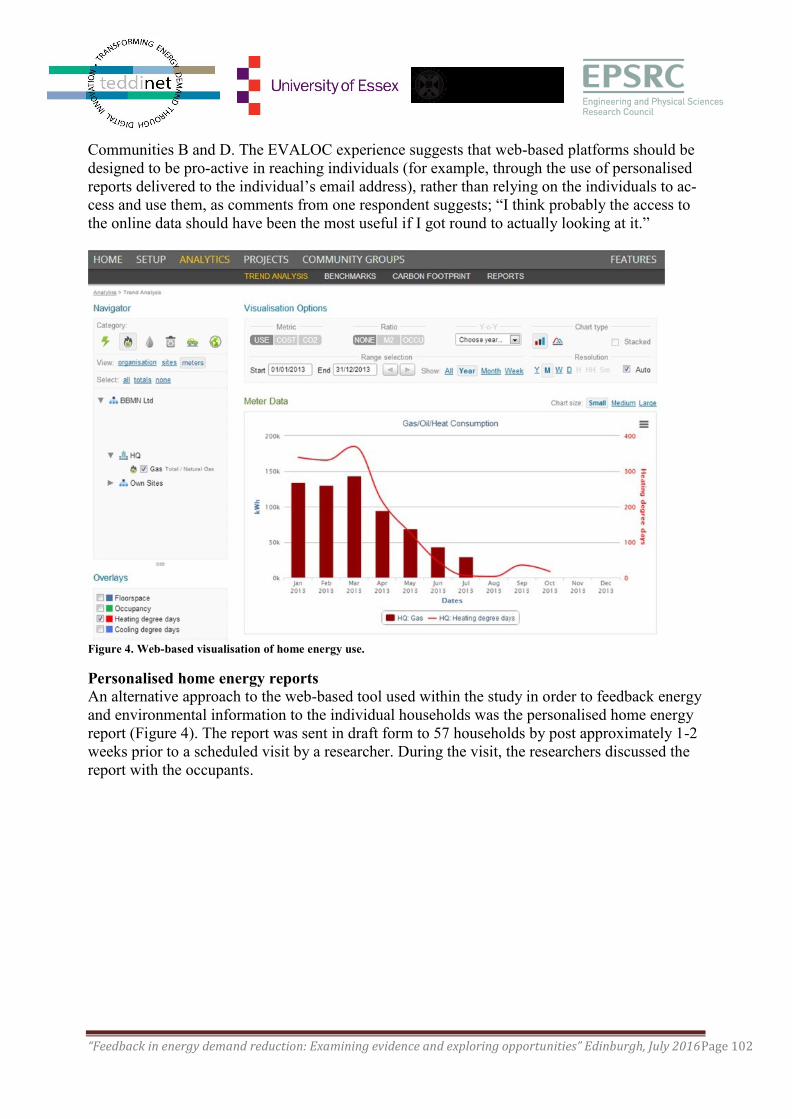
“Feedback in energy demand reduction: Examining evidence and exploring opportunities” Edinburgh, July 2016Page 102
Communities B and D. The EVALOC experience suggests that web-based platforms should be
designed to be pro-active in reaching individuals (for example, through the use of personalised
reports delivered to the individual’s email address), rather than relying on the individuals to ac-
cess and use them, as comments from one respondent suggests; “I think probably the access to
the online data should have been the most useful if I got round to actually looking at it.”
Figure 4. Web-based visualisation of home energy use.
Personalised home energy reports
An alternative approach to the web-based tool used within the study in order to feedback energy
and environmental information to the individual households was the personalised home energy
report (Figure 4). The report was sent in draft form to 57 households by post approximately 1-2
weeks prior to a scheduled visit by a researcher. During the visit, the researchers discussed the
report with the occupants.
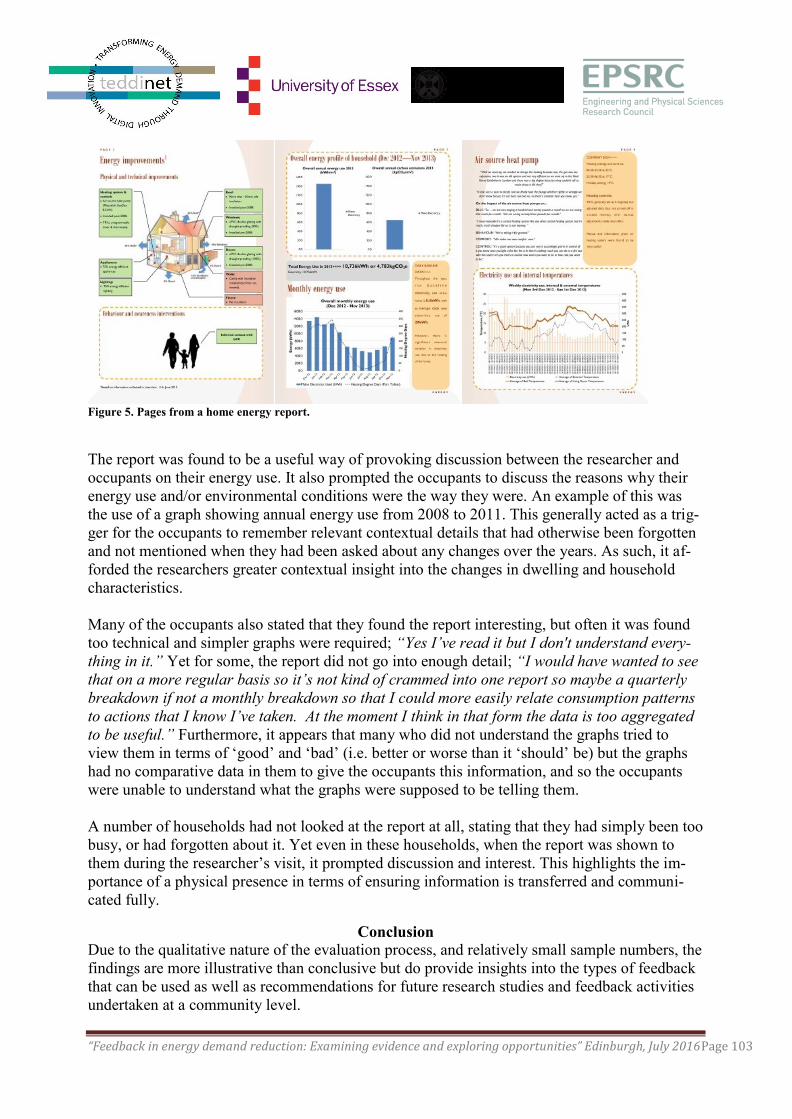
“Feedback in energy demand reduction: Examining evidence and exploring opportunities” Edinburgh, July 2016Page 103
Figure 5. Pages from a home energy report.
The report was found to be a useful way of provoking discussion between the researcher and
occupants on their energy use. It also prompted the occupants to discuss the reasons why their
energy use and/or environmental conditions were the way they were. An example of this was
the use of a graph showing annual energy use from 2008 to 2011. This generally acted as a trig-
ger for the occupants to remember relevant contextual details that had otherwise been forgotten
and not mentioned when they had been asked about any changes over the years. As such, it af-
forded the researchers greater contextual insight into the changes in dwelling and household
characteristics.
Many of the occupants also stated that they found the report interesting, but often it was found
too technical and simpler graphs were required; “Yes I’ve read it but I don't understand every-
thing in it.” Yet for some, the report did not go into enough detail; “I would have wanted to see
that on a more regular basis so it’s not kind of crammed into one report so maybe a quarterly
breakdown if not a monthly breakdown so that I could more easily relate consumption patterns
to actions that I know I’ve taken. At the moment I think in that form the data is too aggregated
to be useful.” Furthermore, it appears that many who did not understand the graphs tried to
view them in terms of ‘good’ and ‘bad’ (i.e. better or worse than it ‘should’ be) but the graphs
had no comparative data in them to give the occupants this information, and so the occupants
were unable to understand what the graphs were supposed to be telling them.
A number of households had not looked at the report at all, stating that they had simply been too
busy, or had forgotten about it. Yet even in these households, when the report was shown to
them during the researcher’s visit, it prompted discussion and interest. This highlights the im-
portance of a physical presence in terms of ensuring information is transferred and communi-
cated fully.
Conclusion
Due to the qualitative nature of the evaluation process, and relatively small sample numbers, the
findings are more illustrative than conclusive but do provide insights into the types of feedback
that can be used as well as recommendations for future research studies and feedback activities
undertaken at a community level.
“Feedback in energy demand reduction: Examining evidence and exploring opportunities” Edinburgh, July 2016Page 104
Overall the majority of the feedback approaches used were able to some extent, to engage, raise
awareness and motivate households into action. Carbon mapping was relatively successful, but
was felt to be aimed more at community groups and organisations rather than individual house-
holders and as such did not engage the local residents as much as thermal imaging. Different
feedback techniques appealed to different households, and this did not necessarily depend on
the community in which they lived. However, even in households with high levels of engage-
ment both with energy use and the research study, often the posted or emailed home energy re-
ports were forgotten or ‘put in a drawer for later’. Yet, when combined with a researcher’s visit,
they created the opportunity for discussion and ‘sense making’ conversation, using the feedback
as a prompt which appeared to increase engagement through contextualising the feedback for
the occupants, and also created an awareness of energy on a very personal level for the house-
hold.
A further outcome was to drive home the point that it is difficult to prompt durable carbon re-
ductions through technology alone: knowledge and practical know-how need to be transferred
along with technology. Where feedback is concerned, some degree of personal contact was usu-
ally needed to make the most of what the feedback technology was able to provide in the way of
information. The usefulness of different modes of feedback at several levels, to contextualise as
well as engage householders has been an important lesson from the EVALOC feedback pro-
gramme.
References
Abrahamse, W., Steg,L.,Vlek,C., & Rothengatter,T., (2007).The effect of tailored information,
goal setting, and tailored feedback on household energy use, energy-related behaviors, and be-
havioural antecedents. Journal of Environmental Psychology, 27, 265–276.
Buchanan, K., Russo, R. & Anderson, B. (2014). Feeding back about eco-feedback: how do
consumers use and respond to energy monitors? Energy Policy, 73, 138-146.
Burgess, J., & Nye, M. (2008). Re-materialising energy use through transparent monitoring
systems. Energy Policy, 36, 4454-4459.
Department of Energy and Climate Change (DECC). (2014). Energy Consumption in the UK
(14D/212). London: Department of Energy and Climate Change.
Gupta, R., Barnfield, L. & Hipwood, T. (2014). Impacts of community-led energy retrofitting of
owner-occupied dwellings. Building Research & Information, 42, 446-461.
Gupta, R., & Chandiwala, S. (2010). Understanding occupants: Feedback techniques for large-
scale low-carbon domestic refurbishments. Building Research & Information, 38(5),
530–548.
Hargreaves, T., Nye, M., & Burgess, J. (2010). Making energy visible: A qualitative
field study of how householders interact with feedback from smart energy monitors.
Energy Policy, 38, 6111-6119.
McKerracher, C., & Torriti,J. (2012). Energy consumption feedback in perspective: integrating
Australian data to meta-analyses on in-home displays. Energy Efficiency, 1–19.

“Feedback in energy demand reduction: Examining evidence and exploring opportunities” Edinburgh, July 2016Page 105
Steg, L. (2008). Promoting household energy conservation. Energy Policy, 36,
4449-4453.
UK Energy Research Centre (UKERC). (2009). Making the transition to a secure and low-
carbon energy system: synthesis report. London: UK Energy Research Centre.
“Feedback in energy demand reduction: Examining evidence and exploring opportunities” Edinburgh, July 2016Page 106
The effect of real-time context-aware feedback on occupants' heating
behaviour and thermal adaptation*
Marika Velleia, Sukumar Natarajan
b, Benjamin Biri
c, Julian Padget
c, Ian Walker
d
* Published in Energy and Buildings: doi:10.1016/j.enbuild.2016.03.045 a Presenting author. Department of Architecture and Civil Engineering, University of Bath, Bath, UK. Email:
[email protected] b Department of Architecture and Civil Engineering, University of Bath, Bath, UK
c Department of Computer Science, University of Bath, Bath, UK
d Department of Psychology, University of Bath, Bath, UK
Abstract
Studies have shown that building energy demand in identical dwellings could vary by a factor
of three. Differences in occupant behaviour – i.e. purchase, operation and maintenance – have
been implicated as a strong source of these differences. The literature suggests that feedback on
energy use to building occupants – particularly real-time feedback – can be used to prompt
lower operation-related energy behaviours. This is particularly true for thermal demand which,
in cold countries, accounts for four times as much energy use as non-thermal demand. However,
there is little evidence to support this claim. We report results from a winter field study that
used in-depth energy, environmental and motion sensing to generate real-time context-aware
feedback through a smartphone application. Subjective data and clothing levels were
concurrently collected through questionnaires. Our results suggest that real-time feedback could
lower radiator and room temperatures without significantly affecting occupant thermal comfort.
The results also show that real time feedback could contribute to an increase in occupant
perceived environmental control (a key variable in the theory of adaptive thermal comfort)
while prompting lower heating energy behaviours.
Introduction
The domestic sector accounts for approximately 24% of the world’s energy consumption . In
cold climates, 32% of this consumption, on average, is due to space and water heating .
However, in highly industrialized countries, heating energy use represents a far higher
proportion of the domestic energy demand, e.g. 57% in the UK (DECC, 2014).
Building space heating energy consumption depends on several physical factors (i.e.
geographical factors, building characteristics, efficiency of the space heating system used).
Non-physical factors such as economic and social factors also have a strong role to play but,
since they are more difficult to quantify, little is known about the magnitude of their effects
which are often neglected when estimates of building performances are made. The energy
behaviour of building users represents the expression of these non-physical factors which act as
underlying drivers and antecedents of occupant actions. Recent research has highlighted the
potential impact on heating energy use arising from differences in occupant behaviour (Juodis et
al., 2009; Andersen, 2012; Gram-Hanssen, 2010; Urban B, 2013).
In the emerging domain of domestic energy literacy research, several studies have examined the
impact of increasing literacy on electricity-related behaviours (Kavousian et al., 2013; Delmas
and Kaiser, 2014; Emeakaroha et al., 2014; Peschiera et al., 2010). However, few studies have
“Feedback in energy demand reduction: Examining evidence and exploring opportunities” Edinburgh, July 2016Page 107
investigated its effect on the arguably more important topic of heating energy consumption
(Huebner et al., 2013). Further, whilst some studies have begun to focus on the impact of
information dissemination on occupants’ heating energy use (Schweiker and Shukuya, 2011;
Bae, 2007; MCMAKIN et al., 2002), to our knowledge, no studies have investigated the effect
of real-time context-aware feedback on occupant heating behaviour, specifically thermal
adaptation and comfort. Understanding the links between feedback, behaviour and subjective
comfort is important if we are to effectively influence energy-saving behaviour since perceived
reductions in comfort are a major impediment to end-users accepting feedback and advice
(Buchanan et al., 2015). This paper sets out to address this important gap by investigating the
effect of real-time and context-aware feedback on occupants’ adaptive actions, thermal comfort
and perceived environmental control in the context of their heating energy use.
Methods
2.1 Participants
The experiment monitored 15 volunteer subjects occupying near-identical single-occupancy
rooms on the university of Bath campus. The participants signed a consent form at the
beginning of the study in which they were assured that their data were treated confidentially.
They were all first year undergraduates (8 males and 7 females) of various nationalities, but all
were European. At the time of the experiment, all the students had lived in their rooms for about
6 months.
2.2 Experimental procedure
The field study had an overall duration of six weeks, divided into two phases of three weeks
each. The first phase (control phase) consisted of monitoring the student rooms, with no
feedback. In the second phase (experimental phase), students were provided with feedback via
their smartphones, with a specially developed in-house application (Figure 7). The experiment
started on the 16 February 2015 and ended on the 29 March 2015.
2.3 Monitored rooms
The 15 monitored rooms are part of three neighbouring residential blocks, on the University of
Bath campus. The three buildings are naturally ventilated and are identical in terms of exposure
and buildings characteristics. In each of the three buildings the source of heating is a natural gas
boiler. The heating schedule was regulated by the estate manager but remained the same during
the 6 weeks for the 3 buildings. Each room has a floor area of about 8m2 and contains a
waterborne radiator with a thermostatic valve. Students were therefore allowed to adjust their
valve and also to set the valve to zero.
2.4 Physical measurements
Each room was equipped with environmental and motion sensors reporting every minute to a
university-hosted database, allowing in-depth real-time monitoring of the rooms. The sensors
consisted of an air dry bulb temperature sensor, a relative humidity sensor, a CO2 sensor, a
temperature sensor fitted on the radiator and a PIR infrared motion sensor to detect room
activity (Figure 6).

“Feedback in energy demand reduction: Examining evidence and exploring opportunities” Edinburgh, July 2016Page 108
2.5 Psychological measurements
Students were asked to fill two thermal comfort questionnaires per day after being in their room
for at least 30 minutes. This enabled the collection of 624 valid questionnaires. Each participant
provided between 14 and 66 questionnaires, for an average of 42 questionnaires per student.
At the end of the first and second experimental phases, students were asked to fill an additional
questionnaire designed to measure overall satisfaction with the room and perceived
environmental control. The aim was to detect changes to these responses as a result of the
feedback.
Figure 6 View of the residential blocks (left) and of a typical student room (right) showing the
positioning of the sensors.
2.6 The application
The smartphone application developed for this study is shown in Figure 7. The application uses
real-time data and a set of heuristic rules to produce the following energy savings tips:
If Friday:
The weekend is coming! Remember to turn off the radiator (by adjusting the valve to zero) if
you don’t plan to be in your room.
If between 8PM and 10PM:
Do you feel cold when you go to sleep? Rather than turning up the radiator have you tried
wearing a heavy pyjama or using extra blankets? Drawing your curtains can also help to keep
the heat in!
If CO2 < 600 ppm:
Oops! You might have opened both your window and door, which means that if the radiator is
on, you are heating the outside air! If you opened these because your room was feeling stuffy,
then remember to close them back quickly to save energy.
If CO2 > 1800 ppm:
Your room is getting stuffy! Open your window for a while and get some fresh air! Remember
to close it back though as otherwise you are just heating the outside air!
If room temperature > 21 °C:
Your room temperature is more than 21°C at the moment. Most people find this quite warm.
Turning down your radiator would help save energy. If you still feel cold, have you tried
wearing warmer clothes instead?

“Feedback in energy demand reduction: Examining evidence and exploring opportunities” Edinburgh, July 2016Page 109
2.7 Monetary rewards
In a domestic setting, the reduction of energy consumption directly impacts fuel bills and can be
a powerful motivating factor for undertaking energy saving measures. However, in a university
setting, students do not normally pay for their actual consumption directly since fuel bills are
often bundled into the accommodation cost. To simulate as closely as possible the domestic
setting in our study, students were rewarded for their energy saving with an amount of money
proportional to the energy saved.
An artificial gas tariff (of 0.2 £/kWh instead of the 0.03 £/kWh typically paid by domestic
consumers) was used for the monetary rewards to make the cost-feedback more salient due to
the short duration of the feedback phase. This tariff is the same as the one used for calculating
the daily energy costs shown in the application (Figure 7).
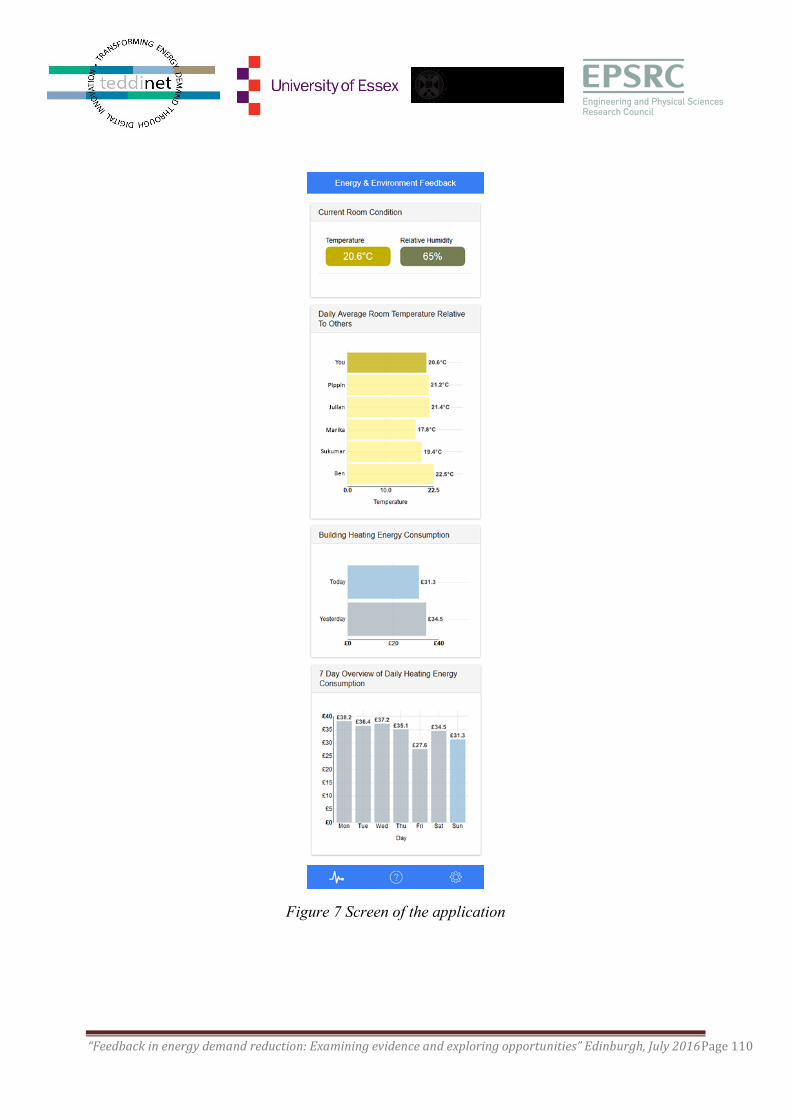
“Feedback in energy demand reduction: Examining evidence and exploring opportunities” Edinburgh, July 2016Page 110
Figure 7 Screen of the application
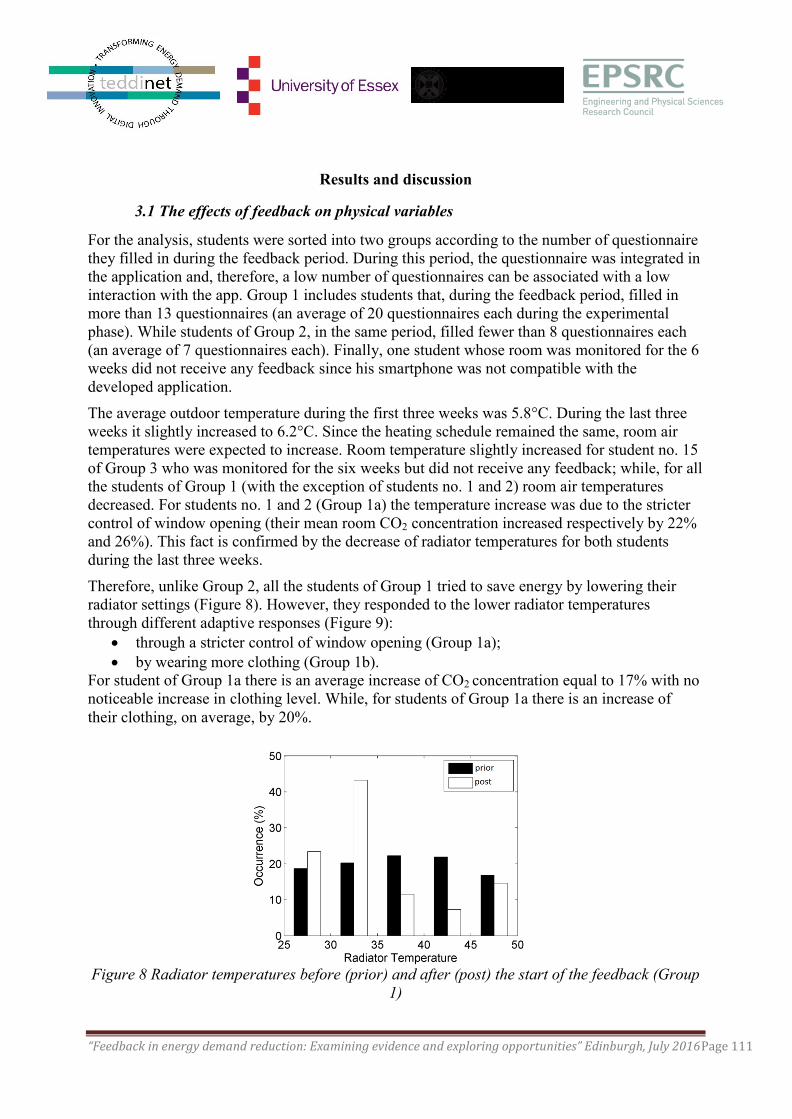
“Feedback in energy demand reduction: Examining evidence and exploring opportunities” Edinburgh, July 2016Page 111
Results and discussion
3.1 The effects of feedback on physical variables
For the analysis, students were sorted into two groups according to the number of questionnaire
they filled in during the feedback period. During this period, the questionnaire was integrated in
the application and, therefore, a low number of questionnaires can be associated with a low
interaction with the app. Group 1 includes students that, during the feedback period, filled in
more than 13 questionnaires (an average of 20 questionnaires each during the experimental
phase). While students of Group 2, in the same period, filled fewer than 8 questionnaires each
(an average of 7 questionnaires each). Finally, one student whose room was monitored for the 6
weeks did not receive any feedback since his smartphone was not compatible with the
developed application.
The average outdoor temperature during the first three weeks was 5.8°C. During the last three
weeks it slightly increased to 6.2°C. Since the heating schedule remained the same, room air
temperatures were expected to increase. Room temperature slightly increased for student no. 15
of Group 3 who was monitored for the six weeks but did not receive any feedback; while, for all
the students of Group 1 (with the exception of students no. 1 and 2) room air temperatures
decreased. For students no. 1 and 2 (Group 1a) the temperature increase was due to the stricter
control of window opening (their mean room CO2 concentration increased respectively by 22%
and 26%). This fact is confirmed by the decrease of radiator temperatures for both students
during the last three weeks.
Therefore, unlike Group 2, all the students of Group 1 tried to save energy by lowering their
radiator settings (Figure 8). However, they responded to the lower radiator temperatures
through different adaptive responses (Figure 9):
through a stricter control of window opening (Group 1a);
by wearing more clothing (Group 1b).
For student of Group 1a there is an average increase of CO2 concentration equal to 17% with no
noticeable increase in clothing level. While, for students of Group 1a there is an increase of
their clothing, on average, by 20%.
Figure 8 Radiator temperatures before (prior) and after (post) the start of the feedback (Group
1)
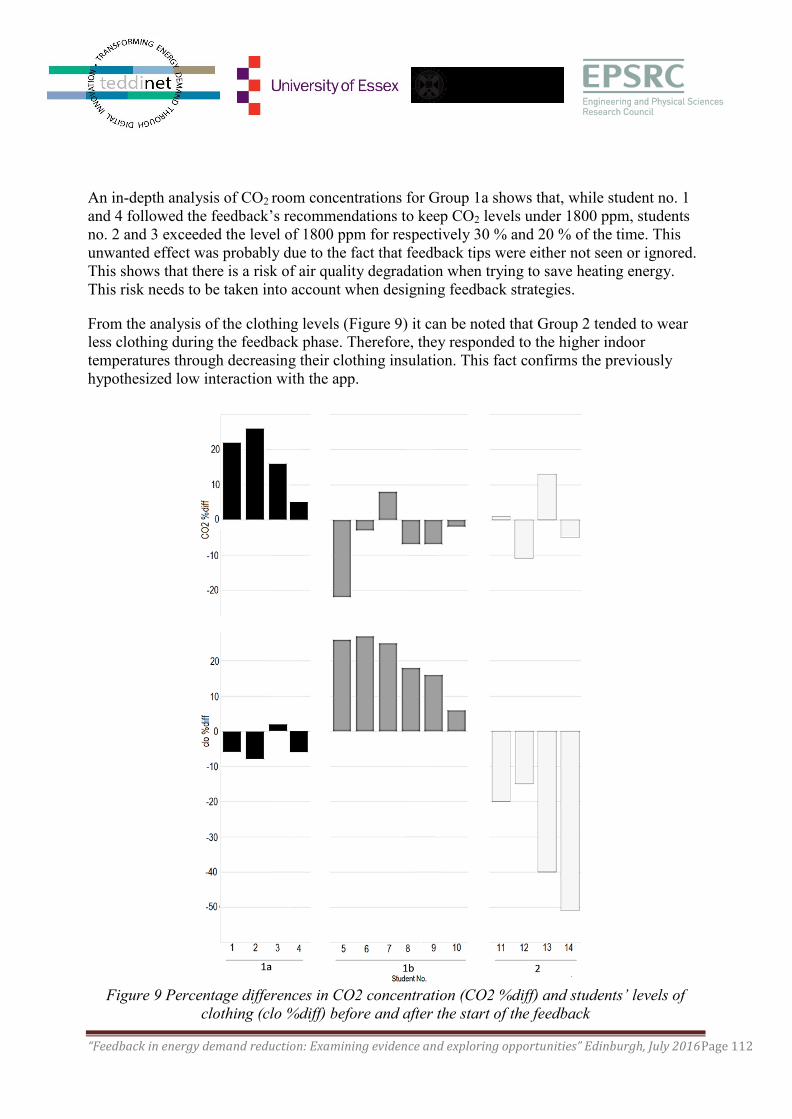
“Feedback in energy demand reduction: Examining evidence and exploring opportunities” Edinburgh, July 2016Page 112
An in-depth analysis of CO2 room concentrations for Group 1a shows that, while student no. 1
and 4 followed the feedback’s recommendations to keep CO2 levels under 1800 ppm, students
no. 2 and 3 exceeded the level of 1800 ppm for respectively 30 % and 20 % of the time. This
unwanted effect was probably due to the fact that feedback tips were either not seen or ignored.
This shows that there is a risk of air quality degradation when trying to save heating energy.
This risk needs to be taken into account when designing feedback strategies.
From the analysis of the clothing levels (Figure 9) it can be noted that Group 2 tended to wear
less clothing during the feedback phase. Therefore, they responded to the higher indoor
temperatures through decreasing their clothing insulation. This fact confirms the previously
hypothesized low interaction with the app.
Figure 9 Percentage differences in CO2 concentration (CO2 %diff) and students’ levels of
clothing (clo %diff) before and after the start of the feedback
“Feedback in energy demand reduction: Examining evidence and exploring opportunities” Edinburgh, July 2016Page 113
3.2 The effects of feedback on psychological variables
Two other important facts can be observed for students of Group 1: (i) overall perceived
environmental control increases and (ii) thermal and air quality satisfaction levels increase. The
Wilcoxon signed rank test is used in order to analyse differences between the samples before
and after the start of the feedback. A non-parametric test is chosen due to the limited sample
size and due to the fact that the sampling distribution is non-normal. The selected significance
level is p = 0.05. For Group 1, perceived control levels for temperature and air quality are
significantly higher (respectively, W=8, p=0.046 and W=0, p=0.005) after the start of the
feedback (Median=3) than before (Median =2.5). Thermal satisfaction levels are significantly
higher after the start of feedback (Median=4) than before (Median=3), W=0, p=0.0049.
Satisfaction levels for air quality are also significantly higher after the feedback (Median =3.5)
than before (Median =3), W=7, p=0.036.
Conclusions
This study aimed to detect and quantify changes in occupants’ adaptive responses, neutral
temperatures and perceived environmental control as results of the feedback intervention. From
the analysis of the monitored data, it emerges that feedback has the potential to prompt “good”
adaptive behaviours such as wearing more clothes and better controlling the use of windows for
ventilation, but it also reveals that a risk of high indoor CO2 levels exists and that, therefore, this
problem needs to be carefully addressed when designing feedback strategies. This study also
confirms the importance of perceived control in defining thermal comfort and shows that the
degree of occupant’s control over the environment depends not only on the characteristics of the
building and of its systems (building contextual factors) but also on occupant’s awareness of
them. Subjects felt they had greater control over their thermal environment and, consequently,
this greater control was able to mitigate their thermal expectations and offset possible
discomforts due to the lower temperatures. Given a sufficient motivation for interacting with the
application, real time feedback can effectively and positively contribute to guiding occupants’
adaptive actions towards energy-aware behaviours without negatively affecting their
satisfaction. The results of this study therefore demonstrate that saving energy does not always
mean sacrificing occupant comfort.
Acknowledgments
This study was jointly supported by the EPSRC funded ENLITEN project (EP/K002724/1) and
a University of Bath Research Scholarship.
References
IEA Online Data Services [Online]. Available from: http://data.iea.org/ieastore/statslisting.asp [Accessed].
Andersen, R.K., 2012. The influence of occupants’ behaviour on energy consumption investigated in 290 identical dwellings and in 35 apartments. . 10th International conference on healthy buildings. Brisbane, Australia.
Bae, N., Chun, C., Park, M., Changes of residents’ behavior as a result of education and information providing about indoor environments. In: RoomVent 2007.
“Feedback in energy demand reduction: Examining evidence and exploring opportunities” Edinburgh, July 2016Page 114
Buchanan, K., Russo, R. & Anderson, B., 2015. The question of energy reduction: The problem(s) with feedback. Energy Policy, 77(0), pp. 89-96.
DECC, 2014. Energy consumption in the UK – Chapter 3: Domestic energy consumption in the UK between 1970 and 2013.
Delmas, M. & Kaiser, W., 2014. Behavioral responses to real-time individual energy usage information: A large scale experiment.
Emeakaroha, A., Ang, C.S., Yan, Y. & Hopthrow, T., 2014. Integrating persuasive technology with energy delegates for energy conservation and carbon emission reduction in a university campus. Energy, 76(0), pp. 357-374.
Gram-Hanssen, K., 2010. Residential heat comfort practices: understanding users. Building Research & Information, 38(2), pp. 175-186.
Huebner, G.M., Cooper, J. & Jones, K., 2013. Domestic energy consumption—What role do comfort, habit, and knowledge about the heating system play? Energy and Buildings, 66(0), pp. 626-636.
Juodis, E., Jaraminiene, E. & Dudkiewicz, E., 2009. Inherent variability of heat consumption in residential buildings. Energy and Buildings, 41(11), pp. 1188-1194.
Kavousian, A., Rajagopal, R. & Fischer, M., 2013. Determinants of residential electricity consumption: Using smart meter data to examine the effect of climate, building characteristics, appliance stock, and occupants' behavior. Energy, 55(0), pp. 184-194.
MCMAKIN, A.H., MALONE, E.L. & LUNDGREN, R.E., 2002. Motivating residents to conserve energy without financial incentives. Environment and Behavior, 34(6), pp. 848-864.
Peschiera, G., Taylor, J.E. & Siegel, J.A., 2010. Response–relapse patterns of building occupant electricity consumption following exposure to personal, contextualized and occupant peer network utilization data. Energy and Buildings, 42(8), pp. 1329-1336.
Schweiker, M. & Shukuya, M., 2011. Investigation on the effectiveness of various methods of information dissemination aiming at a change of occupant behaviour related to thermal comfort and exergy consumption. Energy Policy, 39(1), pp. 395-407.
Urban B, G.C., 2013. A case for thermostat user models. . 13th Conference of international building performance simulation association. Chambery, France.
“Feedback in energy demand reduction: Examining evidence and exploring opportunities” Edinburgh, July 2016Page 115
Quantifying likely energy reduction opportunities in family homes
Paula Cosar-Jorda, Richard A. Buswell and Val A. Mitchell; Building Energy Research
Group, Loughborough University, UK; Design School, Loughborough University, UK.
Abstract
Energy demand reduction towards domestic 2050 targets is part of the UK challenge to
achieving intended CO2 emissions. Although energy use in the home depends on a high num-
ber of variables such as occupant behaviour, appliance ownership, space heating setting, hot
water usage, number of people in the home, household characteristics and other parameters
linked to householder choice, there is still much to understand about the potential reduction
from specific ‘one off’ measures that have either an associated capital investment and /or a
lifestyle implication. This study presents a systematic approach to modelling potential reduc-
tions from specific energy reduction measures for a set of seven family homes, feeding back
this information to householders, and then evaluating the likely reduction potential based on
their comments. The approach achieves this through a mix of whole house monitoring and
semi-structured interviews. Insights are gained into the householders’ willingness to apply
measures and their views on the potential use of smart home technology and ICT as enablers
of change in the house. Results suggest that each case study has a unique priority list of reduc-
tion opportunities that can be applied to achieve 2050 targets; results are optimistic and sug-
gest that householders do have a realistic opportunity to meet anticipated UK targets if a num-
ber of conditions are met.
Methodology
This work quantifies the impact of reduction measures on energy demand in specific homes
together with a qualitative assessment of the extent to which householders are prepared to un-
dertake the proposed reduction measures. This is achieved by utilising monitoring data and
simple steady-state numerical modelling techniques to model the impact of individual and
combinations of reduction measures.
In order to investigate the impact of family lifestyles and preferences on the likely uptake of
reduction measures, the approach developed makes use of monitoring data from specific
homes to target the analysis on evaluating each family’s specific building, systems and prefer-
ences. The tailored reduction analysis is conducted using data evenly distributed throughout a
12 month period from the sample of 7 homes, which was translated into a set of visual aids,
and used in combination with semi-structured interviews to present the opportunities to house-
holders, who established issues and barriers around implementing each measure.
The interview results were used to adjust the parameters of each household’s model allowing
the current whole house energy consumption to be compared with the `potential maximum'
reduction and that which is `more likely' to occur in practice. These results are then used as
prompts to reflect on the implications for the current assumptions embedded in energy plan-
ning scenarios.
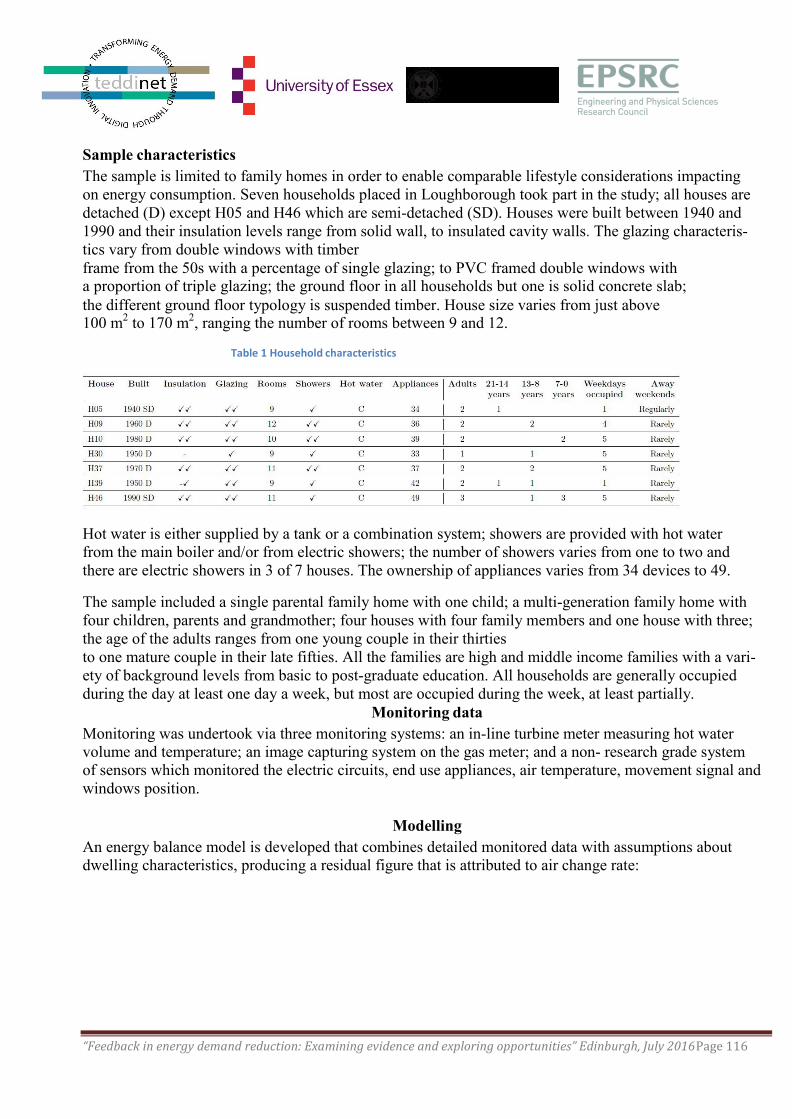
“Feedback in energy demand reduction: Examining evidence and exploring opportunities” Edinburgh, July 2016Page 116
Sample characteristics
The sample is limited to family homes in order to enable comparable lifestyle considerations impacting
on energy consumption. Seven households placed in Loughborough took part in the study; all houses are
detached (D) except H05 and H46 which are semi-detached (SD). Houses were built between 1940 and
1990 and their insulation levels range from solid wall, to insulated cavity walls. The glazing characteris-
tics vary from double windows with timber
frame from the 50s with a percentage of single glazing; to PVC framed double windows with a proportion of triple glazing; the ground floor in all households but one is solid concrete slab;
the different ground floor typology is suspended timber. House size varies from just above
100 m2
to 170 m2, ranging the number of rooms between 9 and 12.
Table 1 Household characteristics
Hot water is either supplied by a tank or a combination system; showers are provided with hot water
from the main boiler and/or from electric showers; the number of showers varies from one to two and
there are electric showers in 3 of 7 houses. The ownership of appliances varies from 34 devices to 49.
The sample included a single parental family home with one child; a multi-generation family home with
four children, parents and grandmother; four houses with four family members and one house with three;
the age of the adults ranges from one young couple in their thirties
to one mature couple in their late fifties. All the families are high and middle income families with a vari-
ety of background levels from basic to post-graduate education. All households are generally occupied
during the day at least one day a week, but most are occupied during the week, at least partially. Monitoring data
Monitoring was undertook via three monitoring systems: an in-line turbine meter measuring hot water
volume and temperature; an image capturing system on the gas meter; and a non- research grade system
of sensors which monitored the electric circuits, end use appliances, air temperature, movement signal and
windows position.
Modelling
An energy balance model is developed that combines detailed monitored data with assumptions about
dwelling characteristics, producing a residual figure that is attributed to air change rate:
“Feedback in energy demand reduction: Examining evidence and exploring opportunities” Edinburgh, July 2016Page 117
Equation 1 Energy Balance
Where Qv, Qsh, Qwuse, Qe, Qp and Qf are the daily sum of heat for ventilation, gas combustion for space
heating and hot water production, electricity consumption, gains from people, hot water production and
loss through the fabric. Monitored data is used in the calculations together with assumptions on not
measured parameters such as wall conductivity or the glazing factor of windows.
The model is inverted predicting the impact of reduction measures through the application of a set of re-
duction models.
Energy reduction analysis
The energy model was applied to estimate how much energy can be reduced from current consumption,
ranking for each case study, which are the most urgent measures to be implemented and developing an
action framework: REB, `The Reduction Effort Balance’, which differentiates between the potential of
home retrofit and replacement investment and that that could be achieved from occupant behaviour
change. A selection of measures was modelled from those impacting on space heating and electric con-
sumption; these are:
Lifestyle, these do not necessarily cost anything, but require the user to accept a lower level of service or
comfort than they are used to:
• One fridge-freezer
• No standby loads
• No tumble drying
• Heating when home
• In use heating
• No heating over 15
• Heating to 17
• Ventilation
Replacement, items that require small to moderate investment, but are not particularly disruptive to
carry out, such as replacing an old appliance:
• New cooking appliances
• New fridge-freezer
• New laundry appliances
• New media
• Insulated doors
• Replace bulbs
And, retrofit, major undertakings that usually affect the building fabric or heat production that are a
significant cost and undertaking:
• Loft insulation
• Wall insulation
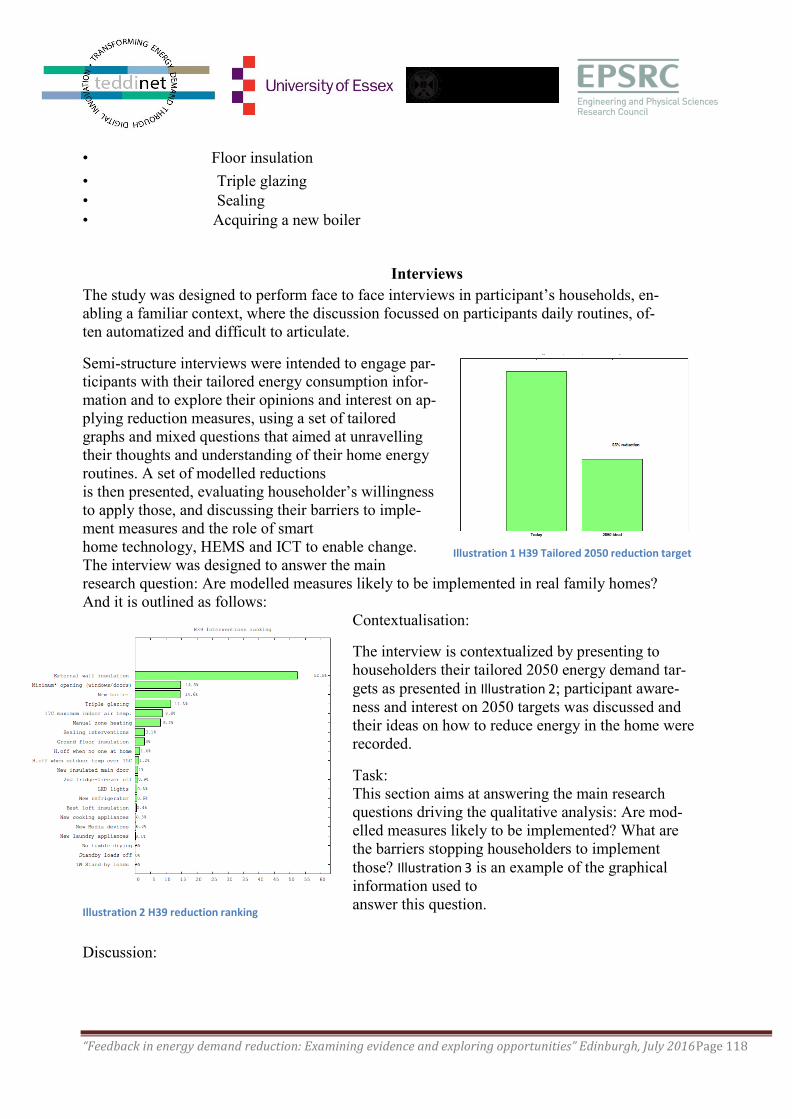
“Feedback in energy demand reduction: Examining evidence and exploring opportunities” Edinburgh, July 2016Page 118
• Floor insulation
• Triple glazing
• Sealing
• Acquiring a new boiler
Interviews
The study was designed to perform face to face interviews in participant’s households, en-
abling a familiar context, where the discussion focussed on participants daily routines, of-
ten automatized and difficult to articulate.
Semi-structure interviews were intended to engage par-
ticipants with their tailored energy consumption infor-
mation and to explore their opinions and interest on ap-
plying reduction measures, using a set of tailored
graphs and mixed questions that aimed at unravelling
their thoughts and understanding of their home energy
routines. A set of modelled reductions
is then presented, evaluating householder’s willingness
to apply those, and discussing their barriers to imple-
ment measures and the role of smart
home technology, HEMS and ICT to enable change.
The interview was designed to answer the main
Illustration 1 H39 Tailored 2050 reduction target
research question: Are modelled measures likely to be implemented in real family homes?
And it is outlined as follows: Illustration 2 H39 reduction ranking
Discussion:
Contextualisation:
The interview is contextualized by presenting to
householders their tailored 2050 energy demand tar-
gets as presented in Illustration 2; participant aware-
ness and interest on 2050 targets was discussed and
their ideas on how to reduce energy in the home were
recorded.
Task:
This section aims at answering the main research
questions driving the qualitative analysis: Are mod-
elled measures likely to be implemented? What are
the barriers stopping householders to implement
those? Illustration 3 is an example of the graphical
information used to
answer this question.
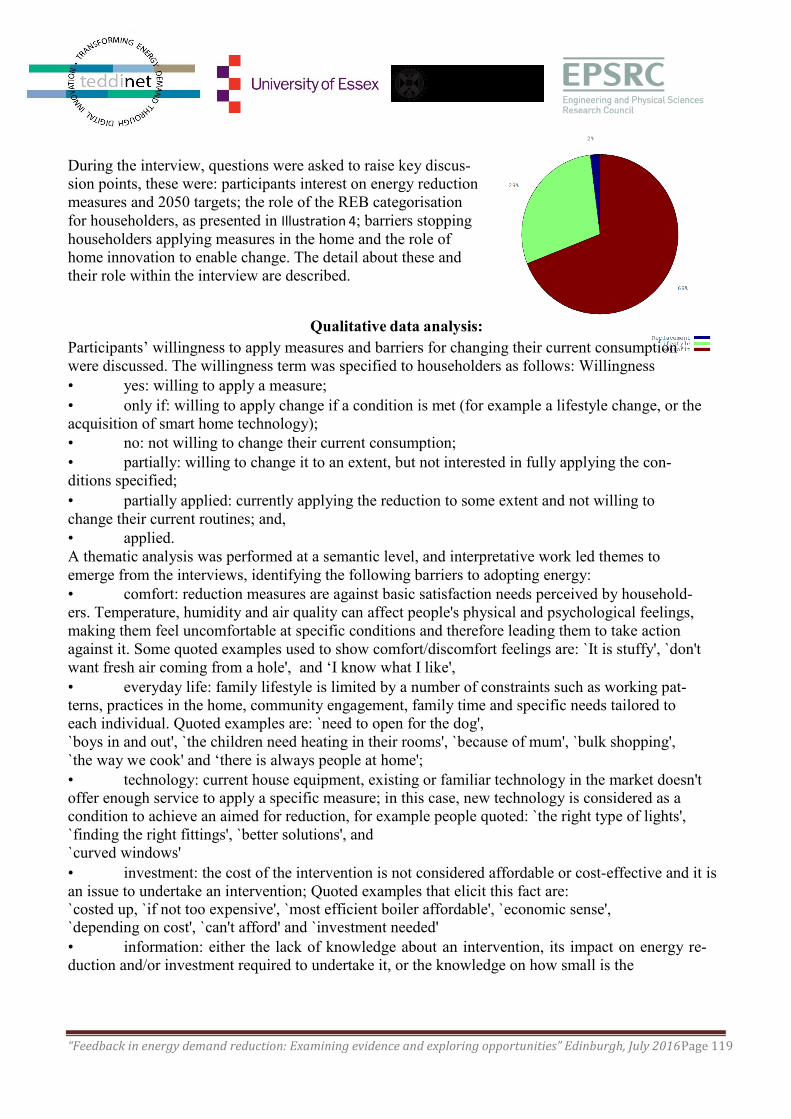
“Feedback in energy demand reduction: Examining evidence and exploring opportunities” Edinburgh, July 2016Page 119
During the interview, questions were asked to raise key discus-
sion points, these were: participants interest on energy reduction
measures and 2050 targets; the role of the REB categorisation
for householders, as presented in Illustration 4; barriers stopping
householders applying measures in the home and the role of
home innovation to enable change. The detail about these and
their role within the interview are described.
Qualitative data analysis:
Participants’ willingness to apply measures and barriers for changing their current consumption
were discussed. The willingness term was specified to householders as follows: Willingness
• yes: willing to apply a measure;
• only if: willing to apply change if a condition is met (for example a lifestyle change, or the
acquisition of smart home technology);
• no: not willing to change their current consumption;
• partially: willing to change it to an extent, but not interested in fully applying the con-
ditions specified;
• partially applied: currently applying the reduction to some extent and not willing to
change their current routines; and,
• applied.
A thematic analysis was performed at a semantic level, and interpretative work led themes to
emerge from the interviews, identifying the following barriers to adopting energy:
• comfort: reduction measures are against basic satisfaction needs perceived by household-
ers. Temperature, humidity and air quality can affect people's physical and psychological feelings,
making them feel uncomfortable at specific conditions and therefore leading them to take action
against it. Some quoted examples used to show comfort/discomfort feelings are: `It is stuffy', `don't
want fresh air coming from a hole', and ‘I know what I like',
• everyday life: family lifestyle is limited by a number of constraints such as working pat-
terns, practices in the home, community engagement, family time and specific needs tailored to
each individual. Quoted examples are: `need to open for the dog',
`boys in and out', `the children need heating in their rooms', `because of mum', `bulk shopping',
`the way we cook' and ‘there is always people at home';
• technology: current house equipment, existing or familiar technology in the market doesn't
offer enough service to apply a specific measure; in this case, new technology is considered as a
condition to achieve an aimed for reduction, for example people quoted: `the right type of lights',
`finding the right fittings', `better solutions', and
`curved windows'
• investment: the cost of the intervention is not considered affordable or cost-effective and it is
an issue to undertake an intervention; Quoted examples that elicit this fact are: `costed up, `if not too expensive', `most efficient boiler affordable', `economic sense', `depending on cost', `can't afford' and `investment needed'
• information: either the lack of knowledge about an intervention, its impact on energy re-
duction and/or investment required to undertake it, or the knowledge on how small is the

“Feedback in energy demand reduction: Examining evidence and exploring opportunities” Edinburgh, July 2016Page 120
impact of a specific measure, can impact on people's motivation for change:
`absolutely no idea', `always difficult to know', `need to know if it is worth doing', `what is the cost
involved?', and `how much fresh air?';
• organisation: fitting in the diary the time for a retrofit, research about the best invest-
ment to reduce energy in the home and make an informed decision, or organising every day
activities to be energy efficient can be non-viable for householders: `need to be more organ-
ised', `just haven't got round it', `as part of something else', `don't think of it', `we don't always
remember' and `when we refurbish the kitchen'
• lifespan: replacing a device or applying a retrofit intervention needs from an
investment of money that householders are interested only if goods need replac-
ing/updating. People's quotes about the lifespan of appliances are: `when they break',
`dies', `when they blow', `pack up', `when replacing' and `end of their life';
• functionality: acquiring and using equipment for a specific purpose makes it
infeasible to change it or stop using it, for example, householders quoted the following:
`the gadget that we want', `health environment, no asthma or hay fever' and
`avoid the damp and bad smell';
• aesthetics: the aesthetics of a retrofit or replacement is an important fac-
tor that impacts on householders decision: `looks right' and `looks cheap' ; and,
• disruption: the process involved in retrofit measures is usually disrupting,
and often perceived as a barrier for householders as the following quotes suggest:
`everything that needs to happen', `quick and easy win', `maintenance', `big job' and `practicalities'. Table 2 Barriers to apply reduction measures
Quantification of insights:
Participants’ willingness to apply measures is considered by modelling only `negotiable
“Feedback in energy demand reduction: Examining evidence and exploring opportunities” Edinburgh, July 2016Page 121
measures’, those measures that participants would apply in the future, either with or
without a condition. The time frame considered to build the model assumptions is 2050,
as the update of goods will have taken place in 30 years. The objective is to understand
the impact of reductions which might not happen because of not negotiable family barri-
ers, and quantify which is the `best case' reduction that can be achieved in each specific
home. For those measures that are partially applicable, participant’s conditions are ap-
plied to the model to recalculate the energy impact.
Results
Tailored reductions were applied considering participants willingness to implementing reduction
measures; these suggest that while ensuring householders minimum comfort expectations and other
personal considerations, the reduction required to achieve 2050 UK domestic targets can take place.
Nevertheless, it should be noted that a number of conditions will have to be met for the reduction to
be implemented. Conditions are linked to cost, family lifestyle, the spread of smart home technology
and the end of life for existing goods as it can be seen in Table 2.
The difference between the first model’s achievable reduction and that from taking into account
personal willingness and limitations, varies from 21\% in H05 to 2\% in H39, showing the range of
limitations and participant willingness for change that can be found in even this small sample of
family homes. The qualitative insights suggest that the barriers from those not negotiable measures
are: comfort, everyday life, functionality and information. The lowest acceptable level of comfort
and convenience varies; for example, H05 and H37 are less concerned about colder temperatures in
the home, whereas current ventilation routines are not negotiable. Everyday life limitations are
specific to each household, as most everyday life barriers are given by working schedules, the age
of family members, and the use of rooms in the home; also, functionality is a barrier when chang-
ing a device, building element or system, as in some cases, the function and the output from a new
device is different, keeping the old one or buying a similar one with a similar energy rate to main-
tain the current service. This is the case for retaining media devices, gas fired hobs, or for not con-
sidering a ventilation system. Lack of information was a barrier to undertake specific reduction
measures in cases where there was no clear output and the cost of the process was unknown.
Limitations that need to be overcome to choose smart home technology are: cost, investment, organi-
sation, functionality, lifespan, aesthetics and disruption. The impact of acquiring smart home and
ICT technology was in most cases enough to reach 2050 targets, except in H30 and H39, solid wall
households, which would need application of further measures to reach sufficient reductions. The
reduction analysis suggests that smart home, HEMS and ICT could provide similar reductions to
those likely to be achieved through expensive and disruptive retrofit measures and most importantly,
it will impact energy consumption far more effectively than the replacement of appliances. The dif-
ference between investing in smart home technology and in retrofit measures is that participants do
not need to change their lifestyle to achieve reduction through retrofit but they need to do if they will
to reduce energy consumption through smart home technology. This fact needs to be taken into ac-
count when considering smart home technology as an enabler of energy reduction, as in itself it can-
not guarantee it.
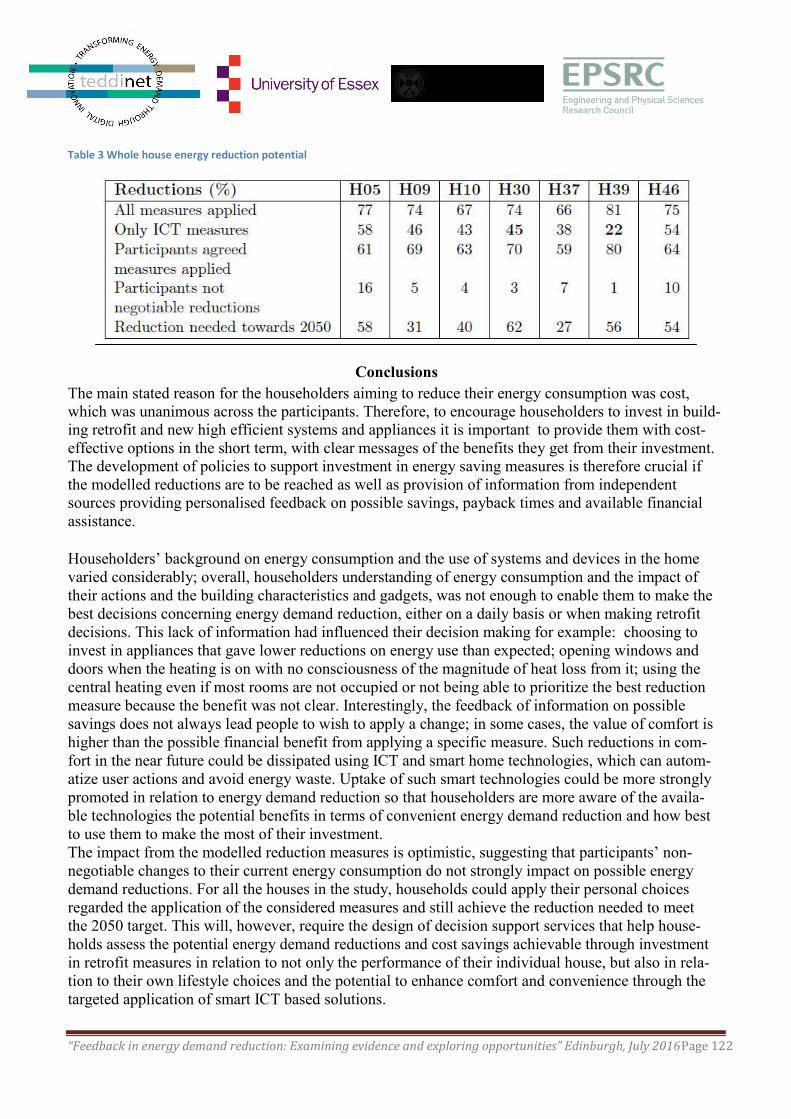
“Feedback in energy demand reduction: Examining evidence and exploring opportunities” Edinburgh, July 2016Page 122
Table 3 Whole house energy reduction potential
Conclusions
The main stated reason for the householders aiming to reduce their energy consumption was cost,
which was unanimous across the participants. Therefore, to encourage householders to invest in build-
ing retrofit and new high efficient systems and appliances it is important to provide them with cost-
effective options in the short term, with clear messages of the benefits they get from their investment.
The development of policies to support investment in energy saving measures is therefore crucial if
the modelled reductions are to be reached as well as provision of information from independent
sources providing personalised feedback on possible savings, payback times and available financial
assistance.
Householders’ background on energy consumption and the use of systems and devices in the home
varied considerably; overall, householders understanding of energy consumption and the impact of
their actions and the building characteristics and gadgets, was not enough to enable them to make the
best decisions concerning energy demand reduction, either on a daily basis or when making retrofit
decisions. This lack of information had influenced their decision making for example: choosing to
invest in appliances that gave lower reductions on energy use than expected; opening windows and
doors when the heating is on with no consciousness of the magnitude of heat loss from it; using the
central heating even if most rooms are not occupied or not being able to prioritize the best reduction
measure because the benefit was not clear. Interestingly, the feedback of information on possible
savings does not always lead people to wish to apply a change; in some cases, the value of comfort is
higher than the possible financial benefit from applying a specific measure. Such reductions in com-
fort in the near future could be dissipated using ICT and smart home technologies, which can autom-
atize user actions and avoid energy waste. Uptake of such smart technologies could be more strongly
promoted in relation to energy demand reduction so that householders are more aware of the availa-
ble technologies the potential benefits in terms of convenient energy demand reduction and how best
to use them to make the most of their investment.
The impact from the modelled reduction measures is optimistic, suggesting that participants’ non-
negotiable changes to their current energy consumption do not strongly impact on possible energy
demand reductions. For all the houses in the study, households could apply their personal choices
regarded the application of the considered measures and still achieve the reduction needed to meet
the 2050 target. This will, however, require the design of decision support services that help house-
holds assess the potential energy demand reductions and cost savings achievable through investment
in retrofit measures in relation to not only the performance of their individual house, but also in rela-
tion to their own lifestyle choices and the potential to enhance comfort and convenience through the
targeted application of smart ICT based solutions.
“Feedback in energy demand reduction: Examining evidence and exploring opportunities” Edinburgh, July 2016Page 123
Between empowerment and alienation. How feedback technologies can harm the
prospects of successful energy transitions*
Susanne Jørgensen, Tomas Moe Skjølsvold, Marianne Ryghaug**,
Department of Interdisciplinary Studies of Culture, Norwegian University of Science and Technology,
N- 7491, Trondheim, Norway.11
Abstract
In this paper we explore the interaction between new “smart” energy feedback technologies and
households. Based on in-depth qualitative video interviews with participants in two smart grid
demonstration projects, the paper analyses how smart technology become integrated in the day-to-day
activities of these households – how they interpreted and understood the technology, and in which
way the technology became interwoven in processes of social learning. We have identified four kinds
of relational re-arrangements that the feedback caters for: knowledge re-arrangements, material re-
arrangements, social re-arrangements and routine re-arrangements. The re-arrangements illustrate how
technological affordances opens for certain kinds of empowerment and action, while sealing off
options for others, and through this we point to several design challenges.
Introduction
In this paper we focus on the role of one particular actor group, namely ordinary households. We
study households that have been equipped with feedback technologies, with the goal of empowering
and enabling more active energy consumption choices in this group. In this paper we explore how
ordinary householders make sense of, and begin to live with new feedback technologies in an
experimental demonstration setting.
Our analysis is based on nine in-depth qualitative video interviews with participants in two Norwegian
smart grid demonstration projects. The households participated in Demo Steinkjer, and Demo Hvaler.
At the time of the interviews, both these demonstration projects combined smart electricity meters
with different solutions providing feedback to the users about their own consumption.
Domesticating smart energy technology: four relational re-arrangements
What roles were the feedback technologies ascribed as they entered the households? Our data
indicates that they were given significance through four processes or re-arrangement, where the
affordances of the technologies catered for new types of dynamics in the household. On the one hand,
this is suggestive of the change potential associated with feedback technologies, but on the other hand
the identified re-arrangements points towards substantial design challenges if the goal is to engage the
household collective in more active energy system participation.
In the following analysis we discuss these four re-arrangements. While they appear below in a
sequence, it should be highlighted that the four re-arrangements should not be read as a linear path
11
A full version of this paper will be published in the journal of Energy Research and Social Science.
** Presenter and corresponding author: [email protected]
“Feedback in energy demand reduction: Examining evidence and exploring opportunities” Edinburgh, July 2016Page 124
that must necessarily be followed, but rather as four potential dynamic states that the technologies
allow for. In our data some of these re-arrangements are related, in the sense that the learning
produced in one re-arrangement opens for new rearrangements, while closing off others.
Knowledge re-arrangements
As the technology came into the households, all respondents in our data reported an initial interest in
trying it out. This interest was mainly individually driven by the men of the households, who began
interacting with the feedback technology and tinkering with their electricity consumption. In this way,
they described how they became increasingly familiarized with the way their building, household
appliances and actions influenced their electricity consumption. Thus, the feedback technology served
as an experimental device of knowledge re-arrangement, which allowed this particular group of users
to understand how much electricity was consumed through various appliances and various practices.
Hence, the feedback technology was considered a very useful information device, but it was only in
combination with the creative user that it became practically applicable. Through this re-arrangement,
electricity consumption changed from being invisible, intangible and mute, to become concrete, and in
turn manageable.
Other examples from our data, however, indicates that the outcomes of such experimental procedures
on behalf of the users should not be taken for granted, as sometimes the users were sensitized to the
low electricity prices, leading them to conclude that changes were pointless.
Thus, the technology itself did not determine the outcomes for these three experimenters. Rather, the
technology re-arranged elements of a pre-existing reality, where aspects such as the users’ beliefs
about electricity prices, technology interest, and creative activities fed into the interpretation of the
feedback as useful or not.
Material re-arrangements
Our data indicates that feedback technology might also lead to changing the physical infrastructure of
the building through refurbishments, or replacing old household appliances. The feedback technology
was interpreted as an information device that provided information about what they saw as
problematic aspects of their consumption. Once the household infrastructure had been altered, and
new settings implemented they did not interfere with the comfort or the day-to-day routines of others
who lived together with him. They were examples of what others have dubbed “set-and-forget”-
dynamics. This allows for the reduction of the overall electricity consumption of households by a few
percent, but we are still far away from the actively engaged households operating as prosumers or
providers of flexibility so often envisioned in the dominant discourse.
Social re-arrangements
So far, we have seen how the feedback technologies have catered for more or less individual projects
on behalf of the men in the studied households. The results have been a set of knowledge re-
arrangements and material re-arrangements, where outcomes have been differentiated. For instance,
knowledge re-arrangements might not only lead to empowerment and energy action, but the rather the
realization of how futile such action would be. Another outcome for some of the individuals by the
knowledge-reconfiguration was the realization that much of the electricity consumption was out of the
individuals’ control, and beyond the scope of what could be achieved through one-off material re-
“Feedback in energy demand reduction: Examining evidence and exploring opportunities” Edinburgh, July 2016Page 125
arrangements. Thus, some of our respondents discussed the emergence of a need to re-configure some
of the social relations in the household, often through new forms of internal control. The practical side
of this consisted of attempting to establish new rules for how, when and why electricity could be used,
collectively. This often led to conflicts in the household. A recurring theme in discussions on new
rules was that while the men tended to focus on the kilowatt hours, the kroner (money) and the data
generated, the remainder of the household inhabitants were more concerned about how they could
make their everyday lives work under such a new regime.
Routine re-arrangements
A fourth kind of re-arrangement catered for by the feedback technology was the establishment of new
modes of routinized interaction or co-existence with the feedback technologies. The character of these
new routines differs across households, but tends to be characterized by some sort of “backgrounding”
of the feedback technology and the information it provides. Some of the most eager users described
this re-arrangement as de-intensification of the interaction with the feedback, because it was perceived
as not providing new and relevant information over time.
“Feedback in energy demand reduction: Examining evidence and exploring opportunities” Edinburgh, July 2016Page 126
Why Eco-Manager is Not Brilliant?
Mate Lorincz, University of Keele
Abstract
A frequent strategy to make energy ‘visible’ or ‘material’ is through electricity-display meters (Har-
greaves et al. 2010). On the one hand, it is argued that ‘visible’ and ‘immediate’ energy monitoring
help ‘individuals’ to reflect upon and change their level of energy consumption. On the other hand,
recent literature suggests that individuals are more likely to ignore these energy monitoring devices -
due to disinterest, lack of time or confusion as to what devices are actually displaying and materializ-
ing (Buchanan et al. 2014). One way to address this conundrum is to investigate how the Eco-
Manager becomes integrated (or not) into newly established students households ‘everyday practices’.
My research investigates the effect of the electricity-display meters in newly established student
households and on their evolving everyday practices that consume electricity. Drawing on the insights
of our preliminary analysis, I take this argument further by arguing that conceptualizing electricity as
a resource for the performance of ‘everyday practices’ could help in understanding what electricity is
and how it comes to matter (or not to matter) in the ‘everyday’ (Strengers 2013). Building on
Strengers et al. (2012) approach on materialising energy systems as constituting practices of managing
electricity, we will explore the know-how (or embodied habits), institutional knowledge, engagements
and technologies (Gram Hanssen 2011) of ‘electricity-managing practices’, the electricity that they
produce and the ways in which the electricity is integrated into ‘everyday practices’. In conclusion, I
will argue that the ‘materialization’ through Eco-Manager is restricted to ‘individual’ physicality (or
to the needs of the body) (Pink et al. 2012).
References
Buchanan, K., Russo, R., Anderson B., (2014). The question of energy reduction: The problem(s) with
feedback. Energy Policy.77:89-96.
Hargreaves, T., Nye, M. , Burgess, J. (2010). Making energy visible: A qualitative field study of how
householders interact with feedback from smart energy monitors. Energy Policy. 38: 6111-6119.
Gram-Hanssen, K. (2011). Understanding change and continuity in residential energy consumption.
Journal of Consumer Culture. 11:61-78.
Strengers, Y, Maller, C. (2012).Materialising energy and water resources in everyday practices: In-
sights for securing supply systems. Global Environmental Change. 22:754-763.
Strengers, Y. (2013) Smart Energy Technologies in Everyday Life: Smart Utopia? London: Palgrave
Macmillan.
Pink, S., Leder Mackley, K. (2012). Video and a Sense of the Invisible: Approaching Domestic Ener-
gy Consumption through the Sensory Home. Sociological Research Online. 17: 3.
“Feedback in energy demand reduction: Examining evidence and exploring opportunities” Edinburgh, July 2016Page 127
SESSION 4A: Beyond Domesticity: Feedback Outside of the Home
e-Genie (Goal-setting and ENergy Information Engagement) in the workplace Alexa Spence*
1, Nick Banks
2, Ben Bedwell
1, Enrico Costanza
3, Eamonn Ferguson
1, Murray
Goulden1, Mike Jewell
4, Caroline Leygue
1
*Presenting author; Corresponding author – [email protected] 1 University of Nottingham
2 Centre for Sustainable Energy
3 Southampton University
4 Southampton University (now Sceneskope)
Abstract
Whilst a large proportion of carbon emissions stem from workplace buildings, research examining
interventions to reduce energy use in this space is sparse. We developed a tool – e-Genie – to engage
workplace occupants with energy data to encourage energy savings and trialled this in a small organi-
sation in London. Engagement was only moderate and certain parts of the tool received little attention.
Users particularly engaged with the tool in terms of existing space issues, in this case thermal comfort
complaints whilst electricity data and tools for taking action were mostly ignored. Building users were
motivated to save energy at work but felt that they didn’t have much control over their use of electrici-
ty. Our data points to the need to inform and support building users in recognising where they can
make a difference, e.g. in cooperative actions, such as asking managers for change, or discussing en-
ergy saving with colleagues. We conclude that energy engagement tools will be most successful in
relation to existing issues in the specific building context and in order to engage building users with
energy more broadly, a clear use-case must be defined or further incentives (e.g. rewards, gamifica-
tion) utilised.
Introduction
It is estimated that around 1/3 greenhouse gas emissions in the UK come from non-industrial work-
place buildings (DECC, 2011). However studies intervening to reduce energy use in a workplace set-
ting are few (Staddon et al., 2016). Notably the workplace setting is different from a residential set-
ting, given that users do not pay for electricity used, are in a social environment, and are subject to
organizational rules and policies (Bedwell et al., 2014). Encouragingly, it is observed that motivations
to save energy in the workplace are generally high (Leygue et al., 2016).
The role of the Facilities Manager (FM) has a particularly pivotal role in the potential for achieving
energy savings in a workplace but requires the support to do so (Goulden and Spence, 2015). Negotia-
tions around energy use and management in the workplace are complex and there is a need to support
communications between building users on this topic as requests made to the FM are often conflicting
and disruptive to other areas. Given energy saving hasn’t traditionally been a focus in the workplace,
leadership from senior management is particularly important in driving changes (Bedwell et al., 2016;
Goulden and Spence, 2015) and empirical evidence supports this, with the most successful energy
saving campaigns featuring strong management leadership (Staddon et al., 2016).
“Feedback in energy demand reduction: Examining evidence and exploring opportunities” Edinburgh, July 2016Page 128
A systematic review of previous interventions to save energy in the workplace has identified enable-
ment (providing autonomy and support to employees), and modelling (various forms of social influ-
ence) as key features of previously successful interventions to save energy in workplace buildings
(Staddon et al., 2016). The use of environmental restructuring is also a key feature of a successful en-
ergy saving intervention but the ways in which this can be done are disparate ranging from the instal-
lation of automation technology, to the use of signs and posters, to the use of electronic energy feed-
back devices. It is difficult to demonstrate the impact of energy displays given that these are often
combined with other intervention features, however there are indications that information alone is not
enough, and other features, such as additional control or automation, are likely to make this kind of
intervention more successful (Staddon et al., 2016).
Many energy displays installed are simple methods of communicating data that can be updated fre-
quently however displays allowing user interaction may be more engaging. For example, displays in a
domestic environment have demonstrated that those that allowed users to view, annotate and reflect
on energy traces in the domestic environment particularly enabled users to relate energy consumption
to their daily activities (Costanza et al. 2012).
Current Research
The current research aims to integrate interdisciplinary insights in the development and building of a
new energy engagement tool, named e-Genie (Goal-setting and ENergy Information Engagement).
We integrated interactive features into this energy feedback tool in order to engage building users with
their energy use rather than simply displaying energy consumption data. In addition, given individuals
are already motivated to save energy, we focused behavioural engagement aspects on helping individ-
uals plan how to transform their motivations into behaviour (using implementation intentions;
Gollwitzer & Sheeran, 2006). Furthermore, taking into account the observation that the potential for
individual behaviour change is often limited, we had a focus beyond individual behaviour to consider
collaborative behaviours and organisational policy changes. The e-Genie tool provides energy infor-
mation feedback (both electricity and gas) to building users, and encourages engagement with that in-
formation through labelling energy patterns observed, and acting on usage observed by contacting the
FM, discussing issues with other building users and through planning behaviour changes.
Method
Study Design
An early version of the e-Genie platform was deployed at the Digital Catapult in London in April
2016 in order to test the functionality of the system, to engage building users with the building’s ener-
gy use and to encourage energy saving behaviour. The platform was launched with a lunchtime semi-
nar, providing background about the tool to the building users, and using promotional materials (e.g.
e-Genie branded chocolate) in order to incentivise engagement. The functionality of the platform was
evaluated through technical monitoring of the data feeds and through ethnographic research. User en-
gagement and impact evaluation were evaluated through ethnographic research, ad hoc user inter-
views, and via a survey conducted pre deployment of the e-Genie platform and approximately two
weeks post deployment.
Deployment Site
The Digital Catapult is a not for profit organisation funded by Innovate UK in order to support break-
through ideas and innovations in the digital economy. It is housed in a modern building next to Kings
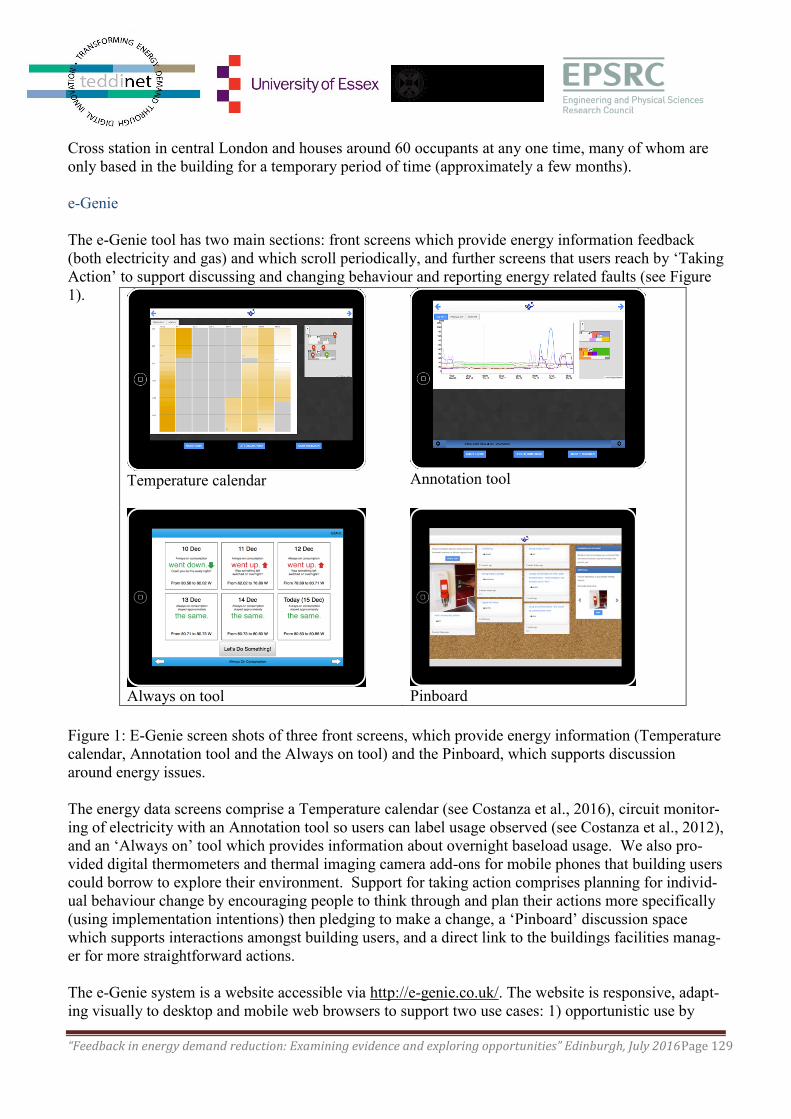
“Feedback in energy demand reduction: Examining evidence and exploring opportunities” Edinburgh, July 2016Page 129
Cross station in central London and houses around 60 occupants at any one time, many of whom are
only based in the building for a temporary period of time (approximately a few months).
e-Genie
The e-Genie tool has two main sections: front screens which provide energy information feedback
(both electricity and gas) and which scroll periodically, and further screens that users reach by ‘Taking
Action’ to support discussing and changing behaviour and reporting energy related faults (see Figure
1).
Figure 1: E-Genie screen shots of three front screens, which provide energy information (Temperature
calendar, Annotation tool and the Always on tool) and the Pinboard, which supports discussion
around energy issues.
The energy data screens comprise a Temperature calendar (see Costanza et al., 2016), circuit monitor-
ing of electricity with an Annotation tool so users can label usage observed (see Costanza et al., 2012),
and an ‘Always on’ tool which provides information about overnight baseload usage. We also pro-
vided digital thermometers and thermal imaging camera add-ons for mobile phones that building users
could borrow to explore their environment. Support for taking action comprises planning for individ-
ual behaviour change by encouraging people to think through and plan their actions more specifically
(using implementation intentions) then pledging to make a change, a ‘Pinboard’ discussion space
which supports interactions amongst building users, and a direct link to the buildings facilities manag-
er for more straightforward actions.
The e-Genie system is a website accessible via http://e-genie.co.uk/. The website is responsive, adapt-
ing visually to desktop and mobile web browsers to support two use cases: 1) opportunistic use by
Temperature calendar
Annotation tool
Always on tool
Pinboard
“Feedback in energy demand reduction: Examining evidence and exploring opportunities” Edinburgh, July 2016Page 130
staff as a situated display on tablets mounted at strategic "public" locations within the workplace (e.g.
by the watercooler), and 2) private use by individual members of staff on their own desktop or mobile
devices. To alleviate possible concerns about privacy, the complete website was only accessible via
devices connected to the workplace LAN (either in the building, or via VPN); external devices are on-
ly able to access e-Genie's front screens (and in this case only to view, not to annotate).
The implementation of the website was tightly coupled with the Digital Catapult workspace, visualis-
ing data generated by temperature sensors (developed by Wireless Things) placed in spaces around the
workspace, and electricity monitors (produced in-house) deployed at the buildings electrical incomers
and consumer boards (to capture both aggregate and circuit level electricity consumption). Data from
these sensors was fed to data hubs (Raspberry Pis) on the LAN that periodically pushed the data to a
remote data store, which was accessed and visualised by the e-Genie website.
Results and Discussion
The use of the e-Genie system overall was limited (N = 10; approximately 17% of building users). It
was clear there was room for improvement in the design and support of the system in order to make it
more focused, more engaging, and more robust.
Ethnographic evaluation
Whilst many occupants did try interacting with e-Genie, many of them did not go further than the
front screens. The system requirement for users to log in to use certain aspects may have put people
off exploring the tool. Observations and interviews suggest users found the system offered too much
information and too little guidance. There was a general uncertainty about how the system was sup-
posed to be used. This suggests the use case needs to be better defined. Where people did engage it
tended to be through the prism of what is most tractable to them, in this case, thermal comfort com-
plaints. It was notable that the Digital Catapult office, even though very new, suffers from the same
issues seen in other office buildings in the C-tech project, with frequent dissatisfaction with thermal
comfort. This dissatisfaction maps according to both personal preferences and location in the office
relative to the position of HVAC vents - as one office member put it “If they’re cold down the end,
they’ll turn it up and then we’ll be boiling hot”.
Occupants of the Digital Catapult (like many other buildings) have little direct control over their use
of electricity (e.g., laptop or monitor already automatically turn off) and heating at work, which means
that e-Genie needs to do a better job of supporting the user to recognise where they can make a differ-
ence.
In regards to the supporting equipment which was made available (thermometers and thermal camer-
as), their usage supports the points above. The thermal cameras, whilst attracting interest, were largely
unused as people were not clear on what the use case was. The thermometers however were adopted
and used by several occupants, reflecting how thermal comfort is a highly tractable issue for work-
place occupants. Where data from the thermometers was used it was in direct communications with
the FM, rather than with e-Genie. This suggests there is more work to be done on linking the support-
ing tech to the software.
Survey results
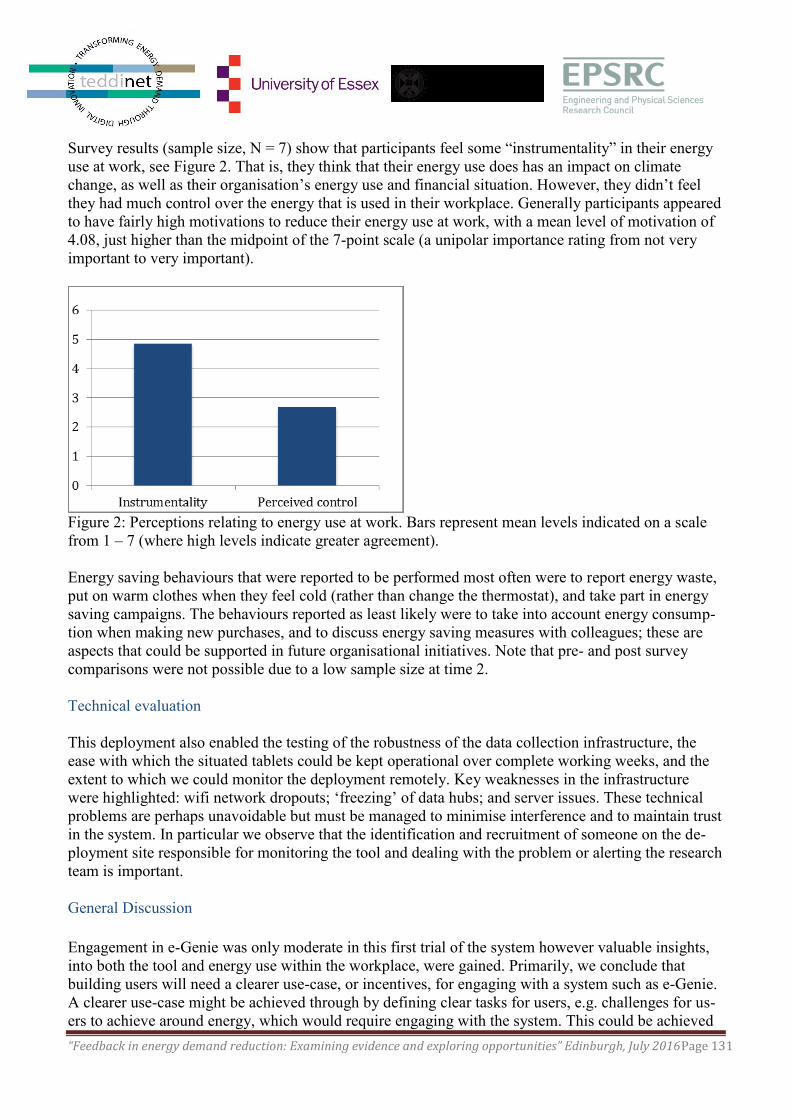
“Feedback in energy demand reduction: Examining evidence and exploring opportunities” Edinburgh, July 2016Page 131
Survey results (sample size, N = 7) show that participants feel some “instrumentality” in their energy
use at work, see Figure 2. That is, they think that their energy use does has an impact on climate
change, as well as their organisation’s energy use and financial situation. However, they didn’t feel
they had much control over the energy that is used in their workplace. Generally participants appeared
to have fairly high motivations to reduce their energy use at work, with a mean level of motivation of
4.08, just higher than the midpoint of the 7-point scale (a unipolar importance rating from not very
important to very important).
Figure 2: Perceptions relating to energy use at work. Bars represent mean levels indicated on a scale
from 1 – 7 (where high levels indicate greater agreement).
Energy saving behaviours that were reported to be performed most often were to report energy waste,
put on warm clothes when they feel cold (rather than change the thermostat), and take part in energy
saving campaigns. The behaviours reported as least likely were to take into account energy consump-
tion when making new purchases, and to discuss energy saving measures with colleagues; these are
aspects that could be supported in future organisational initiatives. Note that pre- and post survey
comparisons were not possible due to a low sample size at time 2.
Technical evaluation
This deployment also enabled the testing of the robustness of the data collection infrastructure, the
ease with which the situated tablets could be kept operational over complete working weeks, and the
extent to which we could monitor the deployment remotely. Key weaknesses in the infrastructure
were highlighted: wifi network dropouts; ‘freezing’ of data hubs; and server issues. These technical
problems are perhaps unavoidable but must be managed to minimise interference and to maintain trust
in the system. In particular we observe that the identification and recruitment of someone on the de-
ployment site responsible for monitoring the tool and dealing with the problem or alerting the research
team is important.
General Discussion
Engagement in e-Genie was only moderate in this first trial of the system however valuable insights,
into both the tool and energy use within the workplace, were gained. Primarily, we conclude that
building users will need a clearer use-case, or incentives, for engaging with a system such as e-Genie.
A clearer use-case might be achieved through by defining clear tasks for users, e.g. challenges for us-
ers to achieve around energy, which would require engaging with the system. This could be achieved
“Feedback in energy demand reduction: Examining evidence and exploring opportunities” Edinburgh, July 2016Page 132
through working with the FM to identify local issues that need to be addressed. Alternatively users
could be supported to generate their own tasks, for example through workshop discussions. Incentives
such as performance related targets or gamification related goals could also be introduced to encour-
age engagement.
We propose that the system overall needs to be more focused, and possibly simplified, again with the
intention that the use case is clearer. One possibility in achieving this is to focus e-Genie more around
thermal comfort issues, given that this is a problem that occurs across a large number of workplace
buildings. We highlight it is important here to support communications around comfort issues, given
the subjective nature of comfort with the aim of resolving issues to reduce the number of conflicting
demands placed upon the FM. Simplifying the system, may reduce it’s utility however. Whilst elec-
tricity may be of less interesting to building users generally, the removal of such a feature means that
at certain points when this might be interesting, e.g. installation of new equipment, the information is
not available.
This trial has allowed us to test the technical robustness of the system also needs to be more technical-
ly robust. In future, we recommend monitoring in place to automatically identify failures in the web
and local infrastructure. We also propose that responsibilities need to be defined within the project
team and in the workplace for regularly checking that the infrastructure is operating as expected.
Conclusions
We developed e-Genie - a theoretically grounded system for visualising energy data in the workplace
and engaging building users with understanding and reducing workplace energy use. Building users
engaged with e-Genie primarily around existing issues of thermal comfort and ignored electricity
screens and tools for supporting behaviour change. Users were motivated to save energy but felt little
control over their energy use behaviour. If energy engagement is desired within the workplace then
building users should be encouraged to recognise where they can make a difference in energy saving
and enabled in doing so, particularly in relation to undertaking cooperative action and asking for or-
ganisational changes. Energy engagement tools are likely to be most successful in relation to resolving
issues that already exist within a building. In order to engage building users with energy more broad-
ly, a clear use-case and/or incentive mechanism is likely to be needed.
“Feedback in energy demand reduction: Examining evidence and exploring opportunities” Edinburgh, July 2016Page 133
References
Bedwell, B., Leygue, C., Goulden, M., McAuley, D., Colley, J., Ferguson, E., Banks, N. and Spence,
A. (2014). Apportioning energy consumption in the workplace: a review of issues in using metering
data to motivate staff to save energy. Technology Analysis & Strategic Management. Special Issue of
Smart Metering Technology & Society. 1196-1211.
Bedwell, B., E. Costanza, and M. Jewell (Oct, 2016). Understanding energy consumption at work:
Learning from arrow hill. In Proceedings of the 19th ACM Conference on Computer Supported Co-
operative Work & Social Computing, CSCW ’16, New York, NY, USA. ACM.
Costanza, Enrico, Ramchurn, Sarvapali D. and Jennings, Nicholas R. (Sep, 2012) Understanding
domestic energy consumption through interactive visualisation: a field study. In Proceedings of the
2012 ACM Conference on Ubiquitous Computing, Pittsburgh, US.
Costanza, E., B. Bedwell, M. Jewell, J. Colley, and T. Rodden (May, 2016). ‘A bit like British Weath-
er, I Suppose’ Design and Evaluation of the Temperature Calendar. In Proceedings of the 34th Annu-
al ACM Conference on Human Factors in Computing Systems, CHI ’16, New York, NY, USA. ACM.
DECC (2011). UK climate change sustainable development indicator: 2010 greenhouse gas emis-
sions, provisional figures and 2009 greenhouse gas emissions by fuel type and end user. HM Gov.,
London.
Gollwitzer, P. M., & Sheeran, P. (2006). Implementation intentions and goal achievement: A me-
ta‐analysis of effects and processes. Advances in experimental social psychology, 38, 69-119.
Goulden, M. and Spence, A. (2015). Caught in the Middle: The Role of the Facilities Manager in Or-
ganisational Energy Use. Energy Policy. 85, 280-287.
Leygue, C., Ferguson, E. and Spence, A. (2016). Saving energy in the workplace: why, and for whom?
Unpublished manuscript.
Staddon, S., Cycil, C., Goulden, M., Leygue, C. and Spence, A. (2016). Intervening to Change Be-
haviour and Save Energy in the Workplace: A Systematic Review of Available Evidence. Energy Re-
search and Social Science, 17, 30-51.
“Feedback in energy demand reduction: Examining evidence and exploring opportunities” Edinburgh, July 2016Page 134
Energy Feedback in the Workplace: Effects of Display Units
Caroline Leygue and Alexa Spence, School of Psychology, University of Nottingham
Presenting author: Caroline Leygue, [email protected]
Abstract
This research investigates energy visibility and the utility of energy displays in the workplace. In two
studies using scenarios and mock-up displays, we examined the impact of framing energy use in terms
of costs (£), carbon (CO2) emissions or a combination of both. In study 1 (N = 93), we observe that
the changes in display units, and potentially in numbers, affect the extent to which participants feel
their savings can make a difference (i.e., instrumentality), which in turn affect energy saving inten-
tions, indicating that CO2 displays might be the best option. In study 2 (N = 142), we controlled for
these differences in numbers to look at the differences in units only. Results reveal that units alone
don’t affect instrumentality, but saving intentions and further sustainable choices, indicating that giv-
ing feedback in terms of costs, even if employees don’t pay for their energy use at work, might be
beneficial. This contrasting pattern of results reveal that best type of unit will depend on the choice to
give numerical feedback or not.
Introduction
Energy displays in the workplace
The British government, through energy companies, proposes to rollout smart meters across Britain by
2020. Research has indicated that these devices may help consumers to reduce between 5 and 15% of
their energy usage, however most of the existing studies focus on energy at home and research in the
workplace is scarce.
It has been suggested that around 33% of greenhouse gas emissions in the UK and 17% in the US are
released from shared buildings within the business sector (non-industrial) (DECC, 2011; United
States Department of State, 2010). Current advances on reducing energy use in workplaces has mostly
focused on improving appliances, system efficiency, or appointing key personnel with energy respon-
sibilities (e.g., facilities managers, eco-champions) (Aragón-Correa, Matı́as-Reche, & Senise-Barrio,
2004; Cordano & Frieze, 2000) . There has been little investigation of how normal, individual workers
(with no energy responsibilities) may change their own energy use behaviour to reduce emissions.
Carbon vs Costs Framing
Research has shown that considering units of displays, e.g., costs, carbon emissions is important for
their usefulness in the home, but it remains a question on what will be their effect in the workplace.
Indeed, it has been shown that costs will be the most popular display in the house, but in the work-
place, typically employees don’t pay for their energy use, so their effects might be different. Further-
more, it has been shown that showing energy use and savings in these terms could trigger a backlash,
as the low amounts of money saved made people think their savings were not worth their efforts en-
gaged in trying to reduce their energy use (Spence, Leygue, Bedwell, & O'Malley, 2014).
So, framing energy use in terms of carbon emissions can reduce that feeling that “it’s not worth it”,
and can also encourage other environmental behaviours (behaviour spillover) (Spence et al., 2014).
“Feedback in energy demand reduction: Examining evidence and exploring opportunities” Edinburgh, July 2016Page 135
However, the question remains whether these results can be generalised to the workplace, where ener-
gy use is “free of charge” for most employees, and where many electrical appliances are shared.
Present research
With the current research we want to fill in the gap in the existing literature regarding energy saving in
the workplace. Campaigns and interventions would benefit from the introduction of monitoring of
savings progress and the question of displays rise naturally from this. Even more, the question of units
is important, as their effects in the work context is bound to be different from their effect in the home,
where motivations to save energy are different. Furthermore, the present research looks at the mecha-
nism underlying these effects, and is the first to disentangle the differences between units and the con-
founded differences between numbers. In study 1, we will look at the effects of energy units on energy
displays as they would appear “in real life”, that is, accompanied by large differences in the amounts
reported. In study 2, we look at the mechanisms underlying these effects and investigate whether they
are due mainly to the units or to the differences in amounts. To achieve this, in study 2 we kept the
numbers appearing on the displays the same across all conditions, and talked about “X units of
pounds/CO2”
Study 1
Method
Participants. Participants were recruited in 3 companies, of which two were for-profit and one not for
profit. In total, 93 people participated in the study, 66 men and 27 women, aged between 18 and 62 (M
= 31.5, SD = 10.66).
Scenarios and Displays
Participants were asked to read a scenario where they had to imagine that they had started a new job
and their company was introducing a campaign to encourage their employees to reduce their energy
use by at least 10%. This was followed by two vignettes containing images of energy displays, where
their initial energy use before the campaign and their use afterwards, reduced by 10%, was described.
These vignettes and displays differed according to the condition participants were randomly assigned
to. In the costs condition, energy use was reported in the scenarios and on displays in terms of pounds,
e.g., “at the end of the month, you look at the display and it shows a cost of £21.50 for your energy
use this month”. In the carbon condition, energy use was reported in terms of CO2 emissions, e.g., “at
the end of the month, you look at the display and it shows 65.38Kg of CO2 emissions for your energy
use this month”. In the combined condition, energy use was reported both in terms of costs and CO2
emissions, e.g., “At the end of the month, you look at the display and it shows a cost of £21.50 and
65.38Kg of CO2 emissions for your energy use this month”1, see figure 1 for examples of displays.
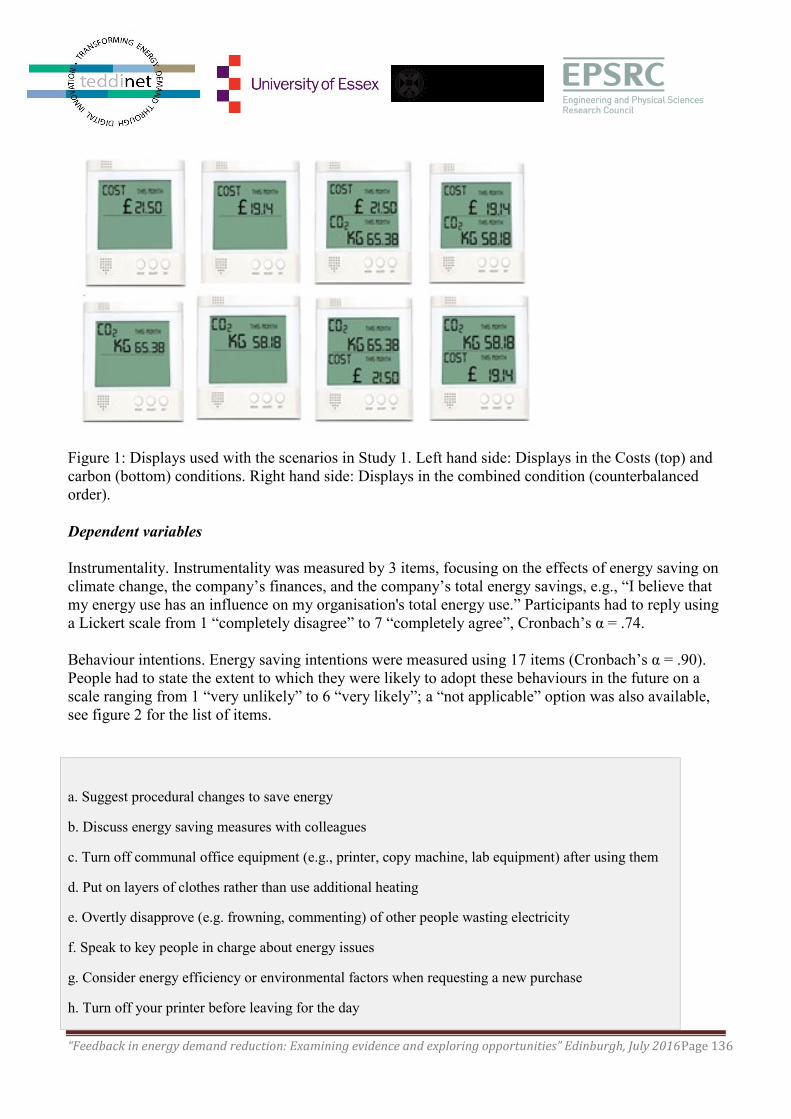
“Feedback in energy demand reduction: Examining evidence and exploring opportunities” Edinburgh, July 2016Page 136
Figure 1: Displays used with the scenarios in Study 1. Left hand side: Displays in the Costs (top) and
carbon (bottom) conditions. Right hand side: Displays in the combined condition (counterbalanced
order).
Dependent variables
Instrumentality. Instrumentality was measured by 3 items, focusing on the effects of energy saving on
climate change, the company’s finances, and the company’s total energy savings, e.g., “I believe that
my energy use has an influence on my organisation's total energy use.” Participants had to reply using
a Lickert scale from 1 “completely disagree” to 7 “completely agree”, Cronbach’s α = .74.
Behaviour intentions. Energy saving intentions were measured using 17 items (Cronbach’s α = .90).
People had to state the extent to which they were likely to adopt these behaviours in the future on a
scale ranging from 1 “very unlikely” to 6 “very likely”; a “not applicable” option was also available,
see figure 2 for the list of items.
a. Suggest procedural changes to save energy
b. Discuss energy saving measures with colleagues
c. Turn off communal office equipment (e.g., printer, copy machine, lab equipment) after using them
d. Put on layers of clothes rather than use additional heating
e. Overtly disapprove (e.g. frowning, commenting) of other people wasting electricity
f. Speak to key people in charge about energy issues
g. Consider energy efficiency or environmental factors when requesting a new purchase
h. Turn off your printer before leaving for the day
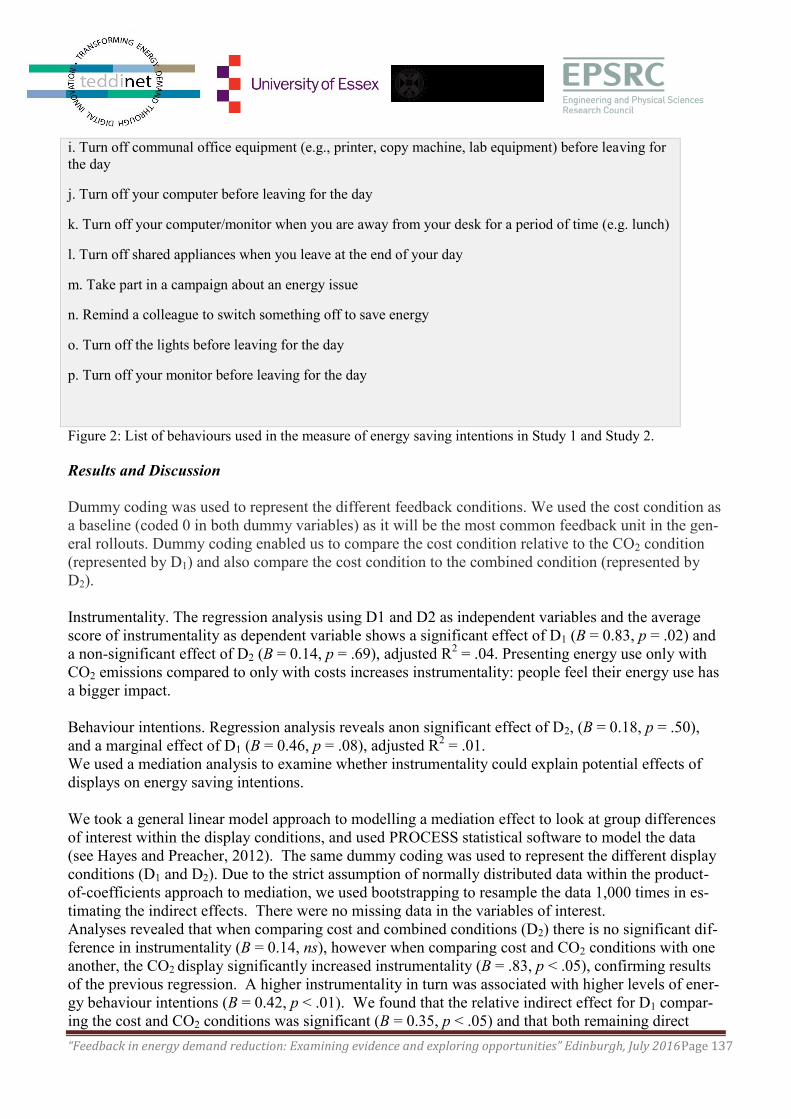
“Feedback in energy demand reduction: Examining evidence and exploring opportunities” Edinburgh, July 2016Page 137
i. Turn off communal office equipment (e.g., printer, copy machine, lab equipment) before leaving for
the day
j. Turn off your computer before leaving for the day
k. Turn off your computer/monitor when you are away from your desk for a period of time (e.g. lunch)
l. Turn off shared appliances when you leave at the end of your day
m. Take part in a campaign about an energy issue
n. Remind a colleague to switch something off to save energy
o. Turn off the lights before leaving for the day
p. Turn off your monitor before leaving for the day
Figure 2: List of behaviours used in the measure of energy saving intentions in Study 1 and Study 2.
Results and Discussion
Dummy coding was used to represent the different feedback conditions. We used the cost condition as
a baseline (coded 0 in both dummy variables) as it will be the most common feedback unit in the gen-
eral rollouts. Dummy coding enabled us to compare the cost condition relative to the CO2 condition
(represented by D1) and also compare the cost condition to the combined condition (represented by
D2).
Instrumentality. The regression analysis using D1 and D2 as independent variables and the average
score of instrumentality as dependent variable shows a significant effect of D1 (B = 0.83, p = .02) and
a non-significant effect of D2 (B = 0.14, p = .69), adjusted R2 = .04. Presenting energy use only with
CO2 emissions compared to only with costs increases instrumentality: people feel their energy use has
a bigger impact.
Behaviour intentions. Regression analysis reveals anon significant effect of D2, (B = 0.18, p = .50),
and a marginal effect of D1 (B = 0.46, p = .08), adjusted R2 = .01.
We used a mediation analysis to examine whether instrumentality could explain potential effects of
displays on energy saving intentions.
We took a general linear model approach to modelling a mediation effect to look at group differences
of interest within the display conditions, and used PROCESS statistical software to model the data
(see Hayes and Preacher, 2012). The same dummy coding was used to represent the different display
conditions (D1 and D2). Due to the strict assumption of normally distributed data within the product-
of-coefficients approach to mediation, we used bootstrapping to resample the data 1,000 times in es-
timating the indirect effects. There were no missing data in the variables of interest.
Analyses revealed that when comparing cost and combined conditions (D2) there is no significant dif-
ference in instrumentality (B = 0.14, ns), however when comparing cost and CO2 conditions with one
another, the CO2 display significantly increased instrumentality (B = .83, p < .05), confirming results
of the previous regression. A higher instrumentality in turn was associated with higher levels of ener-
gy behaviour intentions (B = 0.42, p < .01). We found that the relative indirect effect for D1 compar-
ing the cost and CO2 conditions was significant (B = 0.35, p < .05) and that both remaining direct
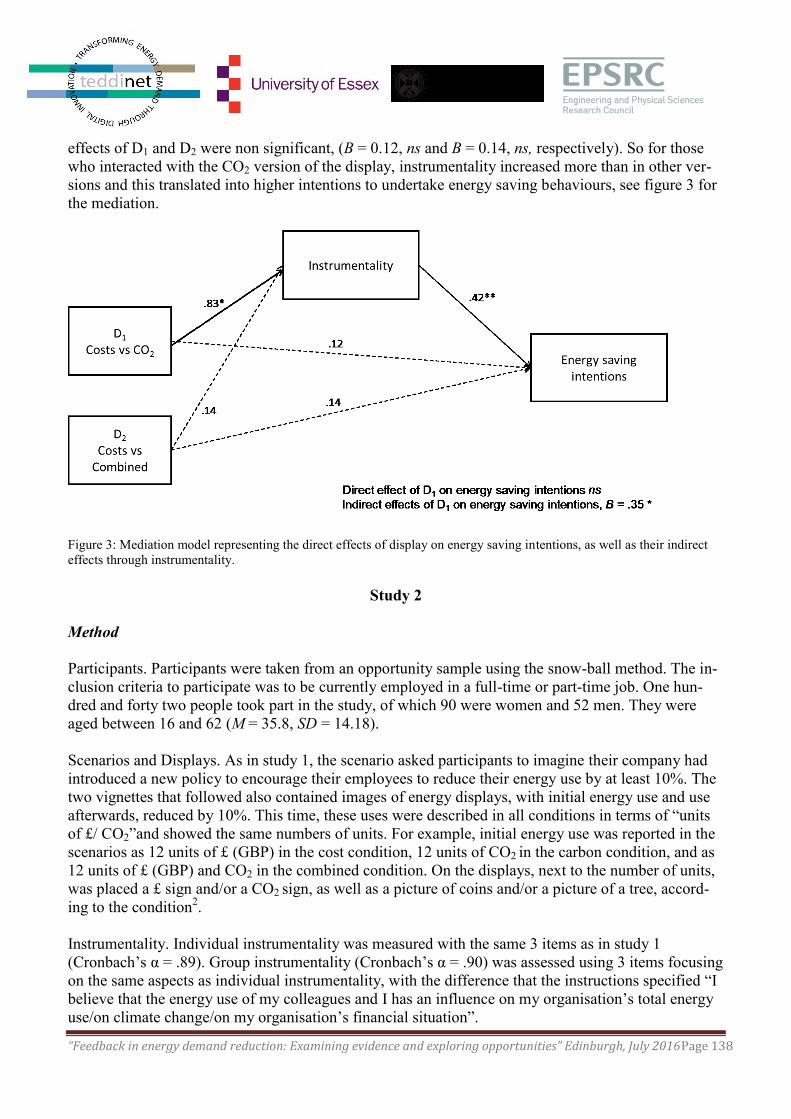
“Feedback in energy demand reduction: Examining evidence and exploring opportunities” Edinburgh, July 2016Page 138
effects of D1 and D2 were non significant, (B = 0.12, ns and B = 0.14, ns, respectively). So for those
who interacted with the CO2 version of the display, instrumentality increased more than in other ver-
sions and this translated into higher intentions to undertake energy saving behaviours, see figure 3 for
the mediation.
Figure 3: Mediation model representing the direct effects of display on energy saving intentions, as well as their indirect
effects through instrumentality.
Study 2
Method
Participants. Participants were taken from an opportunity sample using the snow-ball method. The in-
clusion criteria to participate was to be currently employed in a full-time or part-time job. One hun-
dred and forty two people took part in the study, of which 90 were women and 52 men. They were
aged between 16 and 62 (M = 35.8, SD = 14.18).
Scenarios and Displays. As in study 1, the scenario asked participants to imagine their company had
introduced a new policy to encourage their employees to reduce their energy use by at least 10%. The
two vignettes that followed also contained images of energy displays, with initial energy use and use
afterwards, reduced by 10%. This time, these uses were described in all conditions in terms of “units
of £/ CO2”and showed the same numbers of units. For example, initial energy use was reported in the
scenarios as 12 units of £ (GBP) in the cost condition, 12 units of CO2 in the carbon condition, and as
12 units of £ (GBP) and CO2 in the combined condition. On the displays, next to the number of units,
was placed a £ sign and/or a CO2 sign, as well as a picture of coins and/or a picture of a tree, accord-
ing to the condition2.
Instrumentality. Individual instrumentality was measured with the same 3 items as in study 1
(Cronbach’s α = .89). Group instrumentality (Cronbach’s α = .90) was assessed using 3 items focusing
on the same aspects as individual instrumentality, with the difference that the instructions specified “I
believe that the energy use of my colleagues and I has an influence on my organisation’s total energy
use/on climate change/on my organisation’s financial situation”.

“Feedback in energy demand reduction: Examining evidence and exploring opportunities” Edinburgh, July 2016Page 139
Energy saving intentions. The questionnaire included the same 17 items measuring intentions to save
energy at work as in Study 1 (Cronbach’s α = .90).
Budget allocation task. To look indirectly at actual sustainable choices, we used a budget allocation
task, in which we asked participants to distribute a budget of £100,000 among 5 possible features for
their workplace. To do this, they were given a choice of 20 features, of which 5 were sustainable (e.g.,
Ensure building operates at zero-carbon emissions by using Microgeneration).
Results and Discussion
The same dummy coding as in study 1 was used, to compare the cost condition relative to the
CO2 condition (D1) and the cost condition relative to the combined condition (D2). Both dummy vari-
ables were entered into linear regression analyses (OLS) to investigate their effects on each dependent
variable.
Instrumentality. The unit of display had no effect on individual instrumentality or group instrumentali-
ty. For individual instrumentality, neither D1 (B = 0.35, p = .30) nor D2 (B = -0.42, p = .20) reached a
significant effect (adjusted R2 = .02). The results were the same for D1 (B = 0.30, p = .37) and D2 (B =
-0.47, p = .16) for group instrumentality (adjusted R2 = .02).
Energy saving intentions. Regression analysis using D1 and D2 as independent variables and the mean
of energy saving behaviour intentions reveal that D1 has no significant effect (B = -0.31, p = .20) how-
ever D2 has a significant effect (B = -0.49, p = .04) on behavior intentions (adjusted R2 = .02). Interest-
ingly, it seems that compared to a costs display, presenting a combined display will decrease energy
saving intentions.
Budget allocation task. The amount of money allocated to sustainable features was summed to com-
pute a score of sustainable choices. This score was not further transformed as the distribution was not
very skewed, zskewness = -.45, ns, however kurtosis was significant, zkurtosis = -2.19, p < .05, indicating a
somewhat flat distribution. The OLS regression analysis indicates that D2 has no significant effect (B
= -3051.84, p = .47) however D1 has a significant effect (B = -11121.89, p = .01) on budget alloca-
tions (adjusted R2 = .04). This indicates that when the display gave feedback in terms of carbon emis-
sions, people were likely to spend less money on sustainable features compared to when the display
gave feedback in terms of costs, which is the opposite of the hypothesized spillover effect. This could
be due to the fact that in the scenario, they succeed in reducing their energy use, so this could be a re-
bound effect.
General Discussion
Our research is the first, to our knowledge, looking at the effects of energy displays in the context of
the workplace. Furthermore, it is the first time differences between displays are disentangled to ex-
plore the mechanisms underlying their effects. Two fundamental aspects in energy saving were ob-
served as dependent variables: instrumentality, that is, the extent to which people will feel their con-
tribution makes a difference, and behaviour intention.
Our results replicate results found in the context of home usage (Spence et al., 2014), in the context of
workplace usage, and show that giving energy feedback in terms of carbon can alter the “not so worth
it” effect of costs feedback, even when people don’t pay for their energy use (Study 1). However, they
“Feedback in energy demand reduction: Examining evidence and exploring opportunities” Edinburgh, July 2016Page 140
show that these effects might not be due to the “environmental” aspect of the feedback, but to the high
numbers. Indeed, when the confounded difference in numbers is removed, we observe that giving
feedback in terms of costs might be the best option (Study 2). Interestingly, our results here are similar
to the effects found in Evans et al. (2013), where presenting both costs and environmental arguments
can be detrimental to environmental behaviour.
Our research contains a number of limitations that should be corrected in future studies looking at the
effects of energy feedback in the workplace. Most importantly, the sample should bigger and allow for
comparisons between job roles in the workplace. Also, direct measures of energy saving behaviours
should be used, such as frequency of computer shut down, or electricity use monitoring.
Despite these limitations, this study brings important implications for policy on sustainability in the
workplace. Our results show that taking into account energy units, on displays and potentially in cam-
paigns more generally, is necessary in achieving the best possible results in energy saving at work.
When spaces and behaviours are monitored to track energy use and energy savings, displays showing
actual usage with exact numbers should preferably report usage in terms of carbon emission, to coun-
ter the potential backlash effect of the small numbers in displaying energy use in terms of costs. How-
ever, a solution can be found to this by showing the usage of several people (see Bedwell et al.,2014).
Other types of feedback exist, that do not include digits, or at least do not focus on digits: e.g., traffic
lights type of displays, or speedometer type of displays. In this case, using costs as a unit of feedback
can be more useful than other types such as carbon units or a combined display.
Footnotes
1 In the combined condition, the order of presentation of costs and CO2 emissions in the scenario and
on the display was counterbalanced. Participants randomly assigned to that combined condition were
in turn randomly assigned to one of the two orders of presentation. Participants in both order condi-
tions were gathered for all analyses, as order of presentation was not part of our investigation here. 2
As in study 1, the order of presentation of costs and CO2 emissions was counterbalanced in the com-
bined condition.
References
Aragón-Correa, J. A., Matı́as-Reche, F., & Senise-Barrio, M. E. (2004). Managerial discretion and
corporate commitment to the natural environment. Journal of Business Research, 57, 964-975.
Bedwell, B., Leygue, C., Goulden, M., McAuley, D., Colley, J., Ferguson, E., … Spence, A. (2014).
Apportioning energy consumption in the workplace: a review of issues in using metering data
to motivate staff to save energy.Technology Analysis & Strategic Management, 26(10), 1196-
1211.
Cordano, M., & Frieze, I. H. (2000). Pollution reduction preferences of US environmental managers:
Applying Ajzen's theory of planned behavior. Academy of Management Journal, 43, 627-641.
DECC (2011). UK climate change sustainable development indicator: 2010 greenhouse gas emissions,
provisional figures and 2009 greenhouse gas emissions by fuel type and end user. London: H.
Gov.
Evans, L., Maio, G. R., Corner, A., Hodgetts, C. J., Ahmed, S., & Hahn, U. (2013). Self-interest and
pro-environmental behaviour. Nature Climate Change, 3(2), 122-125.

“Feedback in energy demand reduction: Examining evidence and exploring opportunities” Edinburgh, July 2016Page 141
Spence, A., Leygue, C., Bedwell, B., & O'Malley, C. (2014). Engaging with energy reduction: Does a
climate change frame have the potential for achieving broader sustainable behaviour? Journal
of Environmental Psychology, 38, 17-28.
United States Department of State (2010). U.S. Climate Action Report 2010. Washington.
“Feedback in energy demand reduction: Examining evidence and exploring opportunities” Edinburgh, July 2016Page 142
Energy feedback in office workplaces: approach, design and implementation
Magdalena Boork (presenter), SP Technical Research Institute of Sweden, Sweden, email: magdale-
Cecilia Katzeff, KTH Royal Institute of Technology, Sweden
Abstract
This presentation includes the approach, progress and intermediate results from a Swedish research
project on energy feedback in office workplaces carried out in 2011-2014, with a follow-up project
running 2015-2017. The project aims at exploring how office workplaces can turn energy feedback
into action by supplying energy visualization tools and implementing energy feedback in organiza-
tional processes. The approach includes participatory design workshops in the development of visuali-
zation prototypes, an intervention program comprising reflective workshops and assignments to initi-
ate a process towards more energy efficient practices, as well as interviews to study the organizational
change. The long-term goal is permanent behavioural changes and reduction of so-called absence
electricity (electricity used when no one is present) in individual office rooms. The first project phase
focused on developing and implementing a system of three visualization prototypes in one office
workplace. In the second phase, a 1.5 year intervention program is applied at four different office
workplaces to explore how organizations can incorporate and translate energy feedback into sustaina-
ble practices. The presentation describes both project phases.
1. Introduction
Office premises have undergone major energy efficiency improvements since the 1990s and the total
energy supply is lower than 25 years ago (Statens Energimyndighet, 2007). The electricity use is more
or less constant, despite the increased amount of electrical equipment. Still, there is a great potential
for further efficiency inherent in the use of electrical equipment and employees’ routines. These
workplace practices form the basis for how energy is handled within the organization (Palm, 2009;
Palm & Thollander, 2010; Stephenson et al., 2010). Research has shown that although the introduc-
tion of electricity-feedback tools for households or workplaces generally may lead to an increased
awareness of electricity use, they are not sufficient to achieve lasting energy efficiency (e.g. Pierce &
Paulos, 2012; Katzeff, Broms, Jönsson, Westholm & Räsänen, 2013). The goal of reducing electricity
consumption is for example often in conflict with deep-rooted workplace routines and productivity
motives (Katzeff et al., 2013).
Although energy use at workplaces is often associated with productivity and necessary working tasks,
there is also unnecessary energy use, such as computers and lighting turned on when no one is present.
In the following we call this ‘absence electricity’. It does usually not serve any purpose and therefore
constitutes a considerable energy saving potential. The responsibility for energy use at office work-
places is, however, not always obvious. Management seldom focuses on energy saving routines, while
employees lack motivation and a sense of responsibility since energy savings are rarely rewarded
(Jain, Agrawal, Ghai, Truong & Seetharam, 2013; Katzeff et al., 2013).
Research on people’s energy use has so far primarily focused on households (Schwartz, Betz, Ramirez
& Stevens, 2010; Hargreaves, 2011; Katzeff et al., 2013). Even though employees are part of different
types of households, the energy-related behaviour tends to be different at home and at work. Energy
visualizations can increase the attention and discussion on energy issues, but it is not enough to
achieve lasting and sustainable practices. Hargreaves, Nye and Burgess (2013) found that household
users eventually lose interest in the visualization monitors and behavioural changes beyond the initial
“Feedback in energy demand reduction: Examining evidence and exploring opportunities” Edinburgh, July 2016Page 143
were not achieved. Similar conclusions were drawn from experiments with visualizations in office
workplaces in Katzeff et al. (2013). Therefore, the workplace routines need to be handled as well.
Strong leadership is an important factor to motivate the organization in change initiatives (see for ex-
ample Katzeff et al., 2013 and Hiatt & Creasey, 2003).
The research presented here aims at exploring the possibilities for office workplaces to turn energy
feedback into action by supplying energy visualization tools, but also by implementing energy feed-
back in organizational processes. The main long-term goal is permanent behavioural changes, result-
ing in lasting reduction of so-called absence electricity in individual office rooms. The first project
phase focused on the development and implementation of a system of electricity visualization proto-
types addressing different types of feedback on both individual and joint electricity use. The second,
ongoing, project phase focuses on how organizations can incorporate and translate energy feedback
into action to achieve sustainable practices. This presentation includes both project phases and prelim-
inary results until June 2016 and is built on Boork, Gustafsson, Dijkhuis and Katzeff (2015) and
Boork, Katzeff and Balksjö (2016).
2. Methodology
In the first project phase, a participatory design approach was used to involve end-users in the design
process and in the project. By involving users from the start of the design process, their ideas and
needs are catered for in the creative early phases of the process. In the later phases their evaluation of
the system certifies its usability and user quality.
In the second project phase, management and staff at four different workplaces were recruited to col-
laborate to reduce electricity use at their respective workplace. Besides electricity feedback via a visu-
alization tool, workshops are arranged at each workplace as part of an intervention program (see sec-
tion 4). The workshops aim to initialize the energy efficiency efforts, introduce methods and means to
reduce energy use and develop and plan for the implementation.
The process of change at the workplaces is studied through both qualitative and quantitative data col-
lection. Qualitative methods include focus group interviews (Wibeck, 2010), observations (Bryman,
2007) during workshops, and through log books kept by participants at each workplace. Electricity
use data from each workplace is also monitored. It is used to establish the energy saving potential and
is also analysed in relation to the qualitative data.
3. Designing energy visualization tools for office workplaces
The first project phase included one single workplace, where 30 office rooms were equipped with ad-
vanced measurement and control systems providing detailed data on heating, ventilation, lighting,
electricity and presence for each room. Most employees work with energy technology and energy ef-
ficiency. A substantial part of the employees combine traditional office duties with laboratory work in
the test facilities in the same building. The profession and competence of the employees were consid-
ered an advantage in the development of new energy visualization tools targeting office workplaces.
For details on this project phase, see Boork et al. (2015).
A participatory design approach was used to involve end-users in the design process, see Figure 10.
The initial work was focused on mapping the workplace culture and routines, including employees’
freedom of action. The mapping was primarily based on cultural probes methodology (Gaver, Dunne
& Pacenti, 1999). Three office spaces were identified as particularly important:
- The individual office room for its privacy.
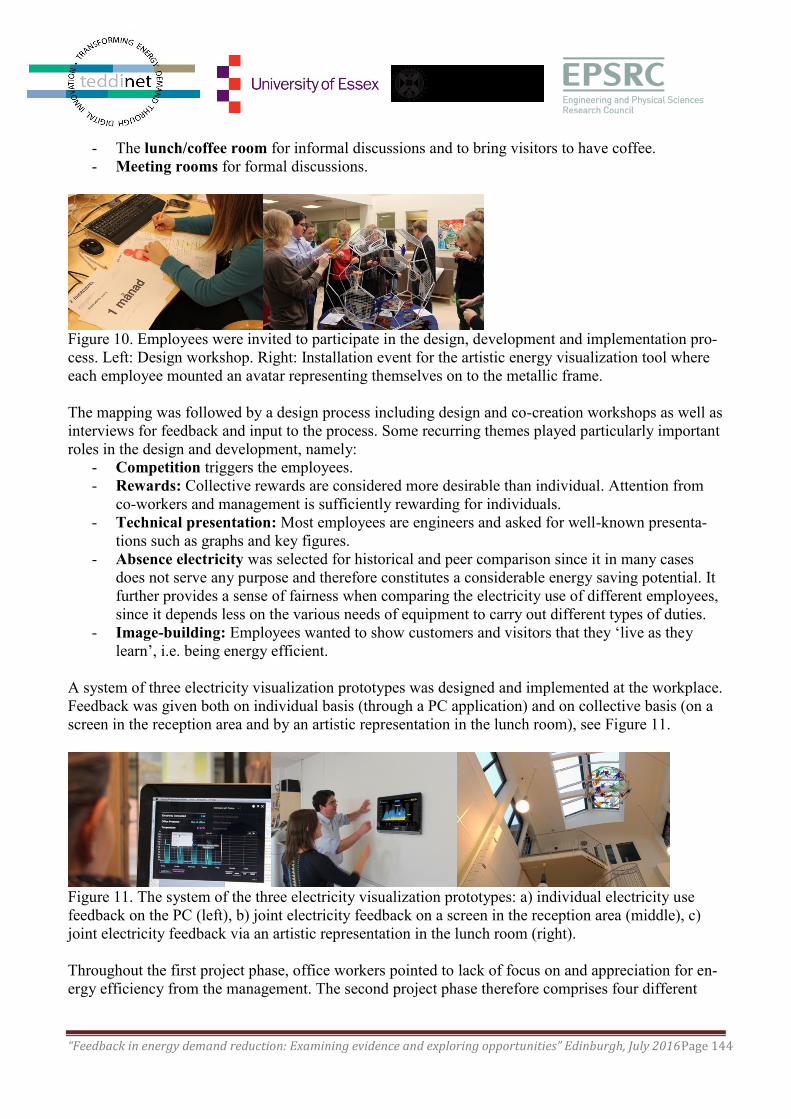
“Feedback in energy demand reduction: Examining evidence and exploring opportunities” Edinburgh, July 2016Page 144
- The lunch/coffee room for informal discussions and to bring visitors to have coffee.
- Meeting rooms for formal discussions.
Figure 10. Employees were invited to participate in the design, development and implementation pro-
cess. Left: Design workshop. Right: Installation event for the artistic energy visualization tool where
each employee mounted an avatar representing themselves on to the metallic frame.
The mapping was followed by a design process including design and co-creation workshops as well as
interviews for feedback and input to the process. Some recurring themes played particularly important
roles in the design and development, namely:
- Competition triggers the employees.
- Rewards: Collective rewards are considered more desirable than individual. Attention from
co-workers and management is sufficiently rewarding for individuals.
- Technical presentation: Most employees are engineers and asked for well-known presenta-
tions such as graphs and key figures.
- Absence electricity was selected for historical and peer comparison since it in many cases
does not serve any purpose and therefore constitutes a considerable energy saving potential. It
further provides a sense of fairness when comparing the electricity use of different employees,
since it depends less on the various needs of equipment to carry out different types of duties.
- Image-building: Employees wanted to show customers and visitors that they ‘live as they
learn’, i.e. being energy efficient.
A system of three electricity visualization prototypes was designed and implemented at the workplace.
Feedback was given both on individual basis (through a PC application) and on collective basis (on a
screen in the reception area and by an artistic representation in the lunch room), see Figure 11.
Figure 11. The system of the three electricity visualization prototypes: a) individual electricity use
feedback on the PC (left), b) joint electricity feedback on a screen in the reception area (middle), c)
joint electricity feedback via an artistic representation in the lunch room (right).
Throughout the first project phase, office workers pointed to lack of focus on and appreciation for en-
ergy efficiency from the management. The second project phase therefore comprises four different

“Feedback in energy demand reduction: Examining evidence and exploring opportunities” Edinburgh, July 2016Page 145
types of office workplaces, where various methods and means for integrating electricity feedback into
sustainable practices will be tested in collaboration with employees and management.
4. Intervention program to promote reflection and change
The second project phase is carried out as a field experiment with employees and management at four
office workplaces. The competences and working duties vary between the different workplaces. The
project engagement at each workplace is mainly driven by a specific person (usually an “enthusiast”)
and the decision to participate was usually taken by the workplace management. This means that the
workplaces participate voluntarily, while individual employees could not choose to sign up or not, but
were engaged due to their group affiliation.
The 1.5 year intervention program aims to initiate a process towards more energy efficient practices
and routines, built on collaboration between employees and management. The main types of activities
include: a) Workshops aiming to initialize each stage in the program, b) Electricity feedback to support
awareness regarding the correlation between practices and energy use, and c) Assignments and activi-
ties individually designed for each workplace to keep up a continuous process towards increased ener-
gy consciousness.
The intervention program can be divided into three stages:
1. Mapping energy-related practices and energy use at the workplaces, create interest in en-
ergy issues among the participants and begin to reflect on energy use and energy-related
behaviours. This stage aims at initializing increased awareness of energy use in the daily
life. Workshops were held in April and May 2016 (see Figure 12) and this stage has now
been completed.
2. Electricity feedback aims to further strengthening the energy awareness among the partici-
pants and to turn the new knowledge into action. The participants get access to a PC appli-
cation providing feedback on the electricity used in the individual office room or work sta-
tion. Compared to stage 1, where activities were mapped, the participants are here provided
by real consumption data, which gives them the possibility to link specific activities and
electricity use. Stage 2 will be initiated in June to August 2016.
Figure 12. The first workshop focused on mapping energy-related practices and energy use at the
workplace. A timeline was used to visualize the timely distribution of energy-related activities (left).
Workshop participants worked in groups to brainstorm ideas on how to make the workday more ener-
gy efficient (right).
3. Organizational change. The aim is to implement energy feedback in the organizational
processes at each workplace. This includes working out strategies and new sustainable
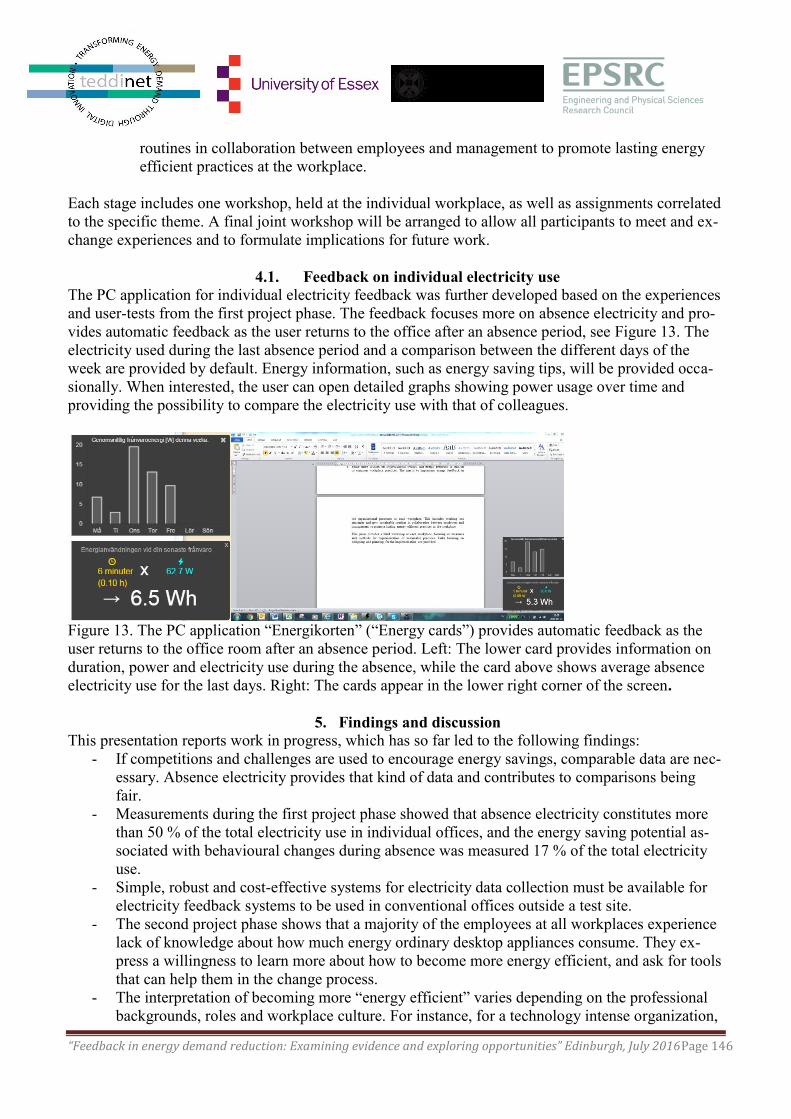
“Feedback in energy demand reduction: Examining evidence and exploring opportunities” Edinburgh, July 2016Page 146
routines in collaboration between employees and management to promote lasting energy
efficient practices at the workplace.
Each stage includes one workshop, held at the individual workplace, as well as assignments correlated
to the specific theme. A final joint workshop will be arranged to allow all participants to meet and ex-
change experiences and to formulate implications for future work.
4.1. Feedback on individual electricity use
The PC application for individual electricity feedback was further developed based on the experiences
and user-tests from the first project phase. The feedback focuses more on absence electricity and pro-
vides automatic feedback as the user returns to the office after an absence period, see Figure 13. The
electricity used during the last absence period and a comparison between the different days of the
week are provided by default. Energy information, such as energy saving tips, will be provided occa-
sionally. When interested, the user can open detailed graphs showing power usage over time and
providing the possibility to compare the electricity use with that of colleagues.
Figure 13. The PC application “Energikorten” (“Energy cards”) provides automatic feedback as the
user returns to the office room after an absence period. Left: The lower card provides information on
duration, power and electricity use during the absence, while the card above shows average absence
electricity use for the last days. Right: The cards appear in the lower right corner of the screen.
5. Findings and discussion
This presentation reports work in progress, which has so far led to the following findings:
- If competitions and challenges are used to encourage energy savings, comparable data are nec-
essary. Absence electricity provides that kind of data and contributes to comparisons being
fair.
- Measurements during the first project phase showed that absence electricity constitutes more
than 50 % of the total electricity use in individual offices, and the energy saving potential as-
sociated with behavioural changes during absence was measured 17 % of the total electricity
use.
- Simple, robust and cost-effective systems for electricity data collection must be available for
electricity feedback systems to be used in conventional offices outside a test site.
- The second project phase shows that a majority of the employees at all workplaces experience
lack of knowledge about how much energy ordinary desktop appliances consume. They ex-
press a willingness to learn more about how to become more energy efficient, and ask for tools
that can help them in the change process.
- The interpretation of becoming more “energy efficient” varies depending on the professional
backgrounds, roles and workplace culture. For instance, for a technology intense organization,
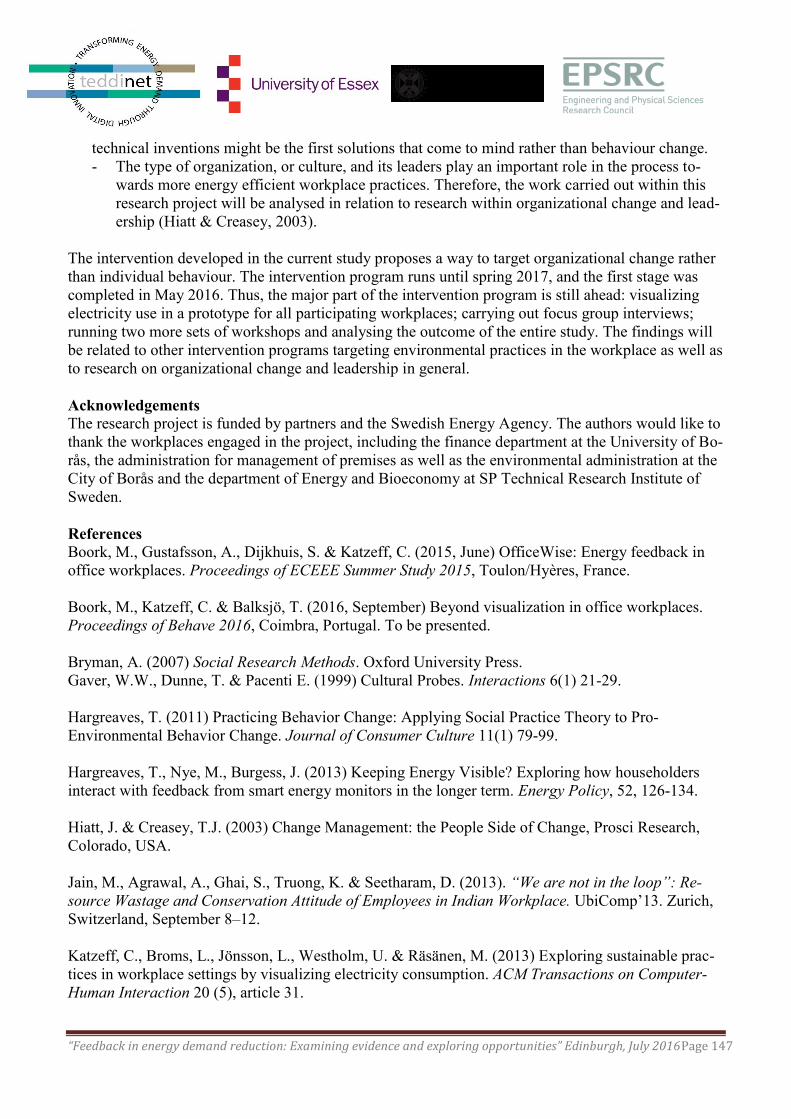
“Feedback in energy demand reduction: Examining evidence and exploring opportunities” Edinburgh, July 2016Page 147
technical inventions might be the first solutions that come to mind rather than behaviour change.
- The type of organization, or culture, and its leaders play an important role in the process to-
wards more energy efficient workplace practices. Therefore, the work carried out within this
research project will be analysed in relation to research within organizational change and lead-
ership (Hiatt & Creasey, 2003).
The intervention developed in the current study proposes a way to target organizational change rather
than individual behaviour. The intervention program runs until spring 2017, and the first stage was
completed in May 2016. Thus, the major part of the intervention program is still ahead: visualizing
electricity use in a prototype for all participating workplaces; carrying out focus group interviews;
running two more sets of workshops and analysing the outcome of the entire study. The findings will
be related to other intervention programs targeting environmental practices in the workplace as well as
to research on organizational change and leadership in general.
Acknowledgements
The research project is funded by partners and the Swedish Energy Agency. The authors would like to
thank the workplaces engaged in the project, including the finance department at the University of Bo-
rås, the administration for management of premises as well as the environmental administration at the
City of Borås and the department of Energy and Bioeconomy at SP Technical Research Institute of
Sweden.
References
Boork, M., Gustafsson, A., Dijkhuis, S. & Katzeff, C. (2015, June) OfficeWise: Energy feedback in
office workplaces. Proceedings of ECEEE Summer Study 2015, Toulon/Hyères, France.
Boork, M., Katzeff, C. & Balksjö, T. (2016, September) Beyond visualization in office workplaces.
Proceedings of Behave 2016, Coimbra, Portugal. To be presented.
Bryman, A. (2007) Social Research Methods. Oxford University Press.
Gaver, W.W., Dunne, T. & Pacenti E. (1999) Cultural Probes. Interactions 6(1) 21-29.
Hargreaves, T. (2011) Practicing Behavior Change: Applying Social Practice Theory to Pro-
Environmental Behavior Change. Journal of Consumer Culture 11(1) 79-99.
Hargreaves, T., Nye, M., Burgess, J. (2013) Keeping Energy Visible? Exploring how householders
interact with feedback from smart energy monitors in the longer term. Energy Policy, 52, 126-134.
Hiatt, J. & Creasey, T.J. (2003) Change Management: the People Side of Change, Prosci Research,
Colorado, USA.
Jain, M., Agrawal, A., Ghai, S., Truong, K. & Seetharam, D. (2013). “We are not in the loop”: Re-
source Wastage and Conservation Attitude of Employees in Indian Workplace. UbiComp’13. Zurich,
Switzerland, September 8–12.
Katzeff, C., Broms, L., Jönsson, L., Westholm, U. & Räsänen, M. (2013) Exploring sustainable prac-
tices in workplace settings by visualizing electricity consumption. ACM Transactions on Computer-
Human Interaction 20 (5), article 31.
“Feedback in energy demand reduction: Examining evidence and exploring opportunities” Edinburgh, July 2016Page 148
Palm, J. (2009) Placing barriers to industrial energy efficiency in a social context: a discussion of life-
style categorization. Energy Efficiency, 2, 263-270.
Palm, J. & Thollander, P. (2010) An interdisciplinary perspective on industrial energy efficiency. Ap-
plied Energy, 87, 3255-3261.
Pierce, J. and Paulos, E. (2012) Beyond Energy Monitors: Interaction, Energy, and Emerging Energy
Systems. Proceedings of CHI’12, ACM Press, New York, 665-674.
Schwartz, T., Betz, M., Ramirez, L. & Stevens, G. (2010) Sustainable Energy Practices at Work: Un-
derstanding the Role of Workers in Energy Conservation. Proceedings of NordiCHI 2010, Reykjavik,
Iceland.
Statens Energimyndighet (2007) Förbättrad energistatistik för lokaler – “Stegvis STIL” Rapport för
år 1: Inventering av kontor och förvaltningsbyggnader, (Report ER 2007:34), The Swedish Energy
Agency. In Swedish.
Stephenson, J., Barton, B. , Carrington, G., Gnoth, D., Lawson, R. & Thorsne, P. (2010) Energy cul-
tures: A framework for understanding energy behaviours. Energy Policy, 28, 6120-6129.
Wibeck. V. (2010) Fokusgrupper: Om fokuserade gruppintervjuer som undersökningsmetod,
Studentlitteratur, Lund. In Swedish.
“Feedback in energy demand reduction: Examining evidence and exploring opportunities” Edinburgh, July 2016Page 149
An Interactive and Diagnostic Energy Use Analysis Interface for Facilities
Managers
Paul Shabajee1, Daniel Schien
1, John Brenton
2, Chris Jones
2 and Chris Preist
1
1Department of Computer Science, University of Bristol
2 Sustainability, Estates Office, University of Bristol
Contact: [email protected]
Abstract
We describe an innovative, interactive diagnostic energy use analysis interface developed using open
source software for a commercial BMS (Building Management System). This supports the needs of
facilities managers to make practical use of high volumes of rich data from heating systems in order to
monitor the use of energy and evaluate and develop energy saving initiatives. The interface can be
used to easily detect a wide range of energy use issues, such as: under- and over-heating, sensor be-
haviour, fabric issues and behavioural anomalies. There is also the ability to ensure that local systems
are adhering to scheduling and are not being overridden locally. This is particularly valuable for elec-
tric space and water heating, to check that it is not active during expensive tariff periods, when the
grid is close to capacity, when costs are higher and when more carbon-intensive generation is brought
on line. The approach allows interactive interrogation of the data and allows nuanced benchmarking to
be undertaken. The result is effectively a toolbox for the exploration of anomalies that traditional
BMS threshold alarms would miss. The interface has been developed under the InnovateUK IODI-
CUS project as an enabling work for a decision-making interface for heating systems.
Background & Needs
The University of Bristol has a large estate of buildings, ranging from offices and student halls to
state-of-the-art research labs. It has a number of Building Management Systems (BMS) and, increas-
ingly, local renewable and low carbon energy sources. It also has plans to introduce energy storage
technologies. The various BMSs provide significant volumes of rich data from which fine-grained en-
ergy use and system behaviours can be estimated. However, analysis and making practical use of this
data can be problematic.
As part of the IODiCUS12
(Interoperable Open Digital Control Unit System) project (IODiCUS, 2016)
we have identified, through consultation with the University of Bristol Estates and Sustainability de-
partments, the need for facilities managers, to gain i) an overview of the performance and behaviours
of buildings and ii) be able to drill down into data to find patterns, issues, ‘hot’ or ‘cold’ spots in ener-
gy use, and anomalies in the data. In addition, they need to be able to evaluate and improve the use of
12
The IODiCUS project is funded by Innovate UK <http://www.iodicus.org/> – project partners are: the University of
Bristol Department of Computer Science, University of Bristol Estates and Sustainability Department, Secure Controls Ltd,
Critical Software Technologies, SH&BA, Telemetry Associates, Trusted Renewables
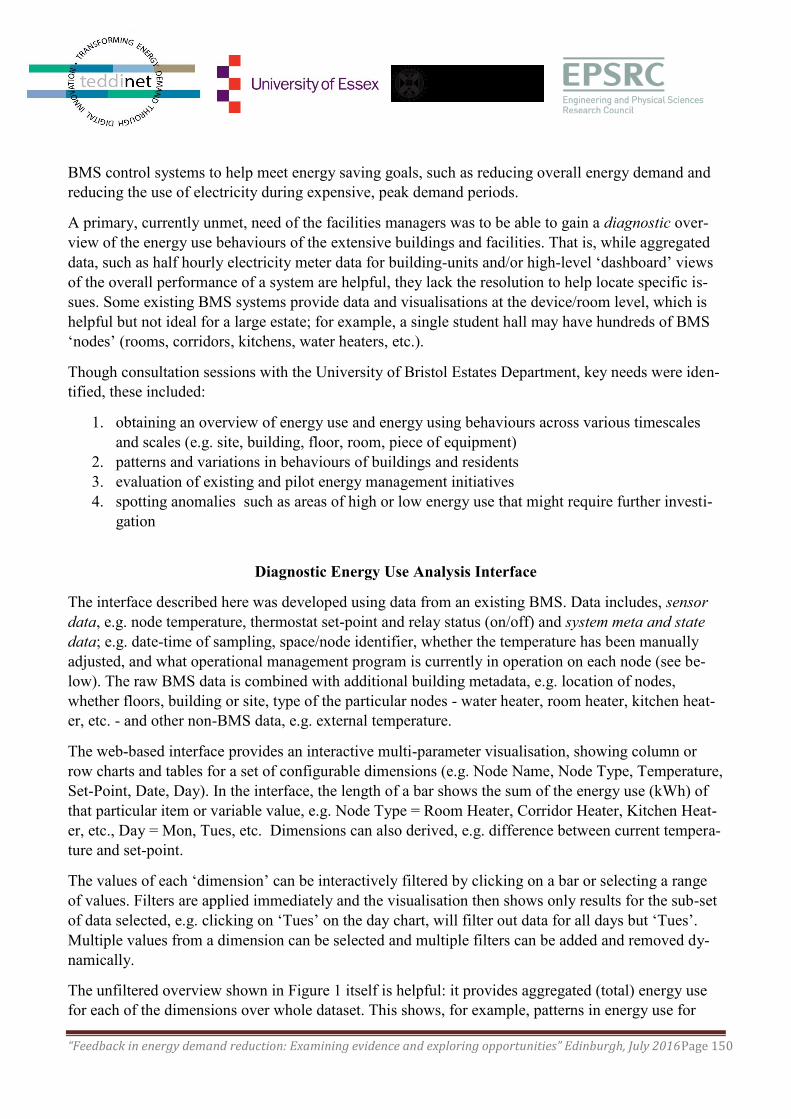
“Feedback in energy demand reduction: Examining evidence and exploring opportunities” Edinburgh, July 2016Page 150
BMS control systems to help meet energy saving goals, such as reducing overall energy demand and
reducing the use of electricity during expensive, peak demand periods.
A primary, currently unmet, need of the facilities managers was to be able to gain a diagnostic over-
view of the energy use behaviours of the extensive buildings and facilities. That is, while aggregated
data, such as half hourly electricity meter data for building-units and/or high-level ‘dashboard’ views
of the overall performance of a system are helpful, they lack the resolution to help locate specific is-
sues. Some existing BMS systems provide data and visualisations at the device/room level, which is
helpful but not ideal for a large estate; for example, a single student hall may have hundreds of BMS
‘nodes’ (rooms, corridors, kitchens, water heaters, etc.).
Though consultation sessions with the University of Bristol Estates Department, key needs were iden-
tified, these included:
1. obtaining an overview of energy use and energy using behaviours across various timescales
and scales (e.g. site, building, floor, room, piece of equipment)
2. patterns and variations in behaviours of buildings and residents
3. evaluation of existing and pilot energy management initiatives
4. spotting anomalies such as areas of high or low energy use that might require further investi-
gation
Diagnostic Energy Use Analysis Interface
The interface described here was developed using data from an existing BMS. Data includes, sensor
data, e.g. node temperature, thermostat set-point and relay status (on/off) and system meta and state
data; e.g. date-time of sampling, space/node identifier, whether the temperature has been manually
adjusted, and what operational management program is currently in operation on each node (see be-
low). The raw BMS data is combined with additional building metadata, e.g. location of nodes,
whether floors, building or site, type of the particular nodes - water heater, room heater, kitchen heat-
er, etc. - and other non-BMS data, e.g. external temperature.
The web-based interface provides an interactive multi-parameter visualisation, showing column or
row charts and tables for a set of configurable dimensions (e.g. Node Name, Node Type, Temperature,
Set-Point, Date, Day). In the interface, the length of a bar shows the sum of the energy use (kWh) of
that particular item or variable value, e.g. Node Type = Room Heater, Corridor Heater, Kitchen Heat-
er, etc., Day = Mon, Tues, etc. Dimensions can also derived, e.g. difference between current tempera-
ture and set-point.
The values of each ‘dimension’ can be interactively filtered by clicking on a bar or selecting a range
of values. Filters are applied immediately and the visualisation then shows only results for the sub-set
of data selected, e.g. clicking on ‘Tues’ on the day chart, will filter out data for all days but ‘Tues’.
Multiple values from a dimension can be selected and multiple filters can be added and removed dy-
namically.
The unfiltered overview shown in Figure 1 itself is helpful: it provides aggregated (total) energy use
for each of the dimensions over whole dataset. This shows, for example, patterns in energy use for
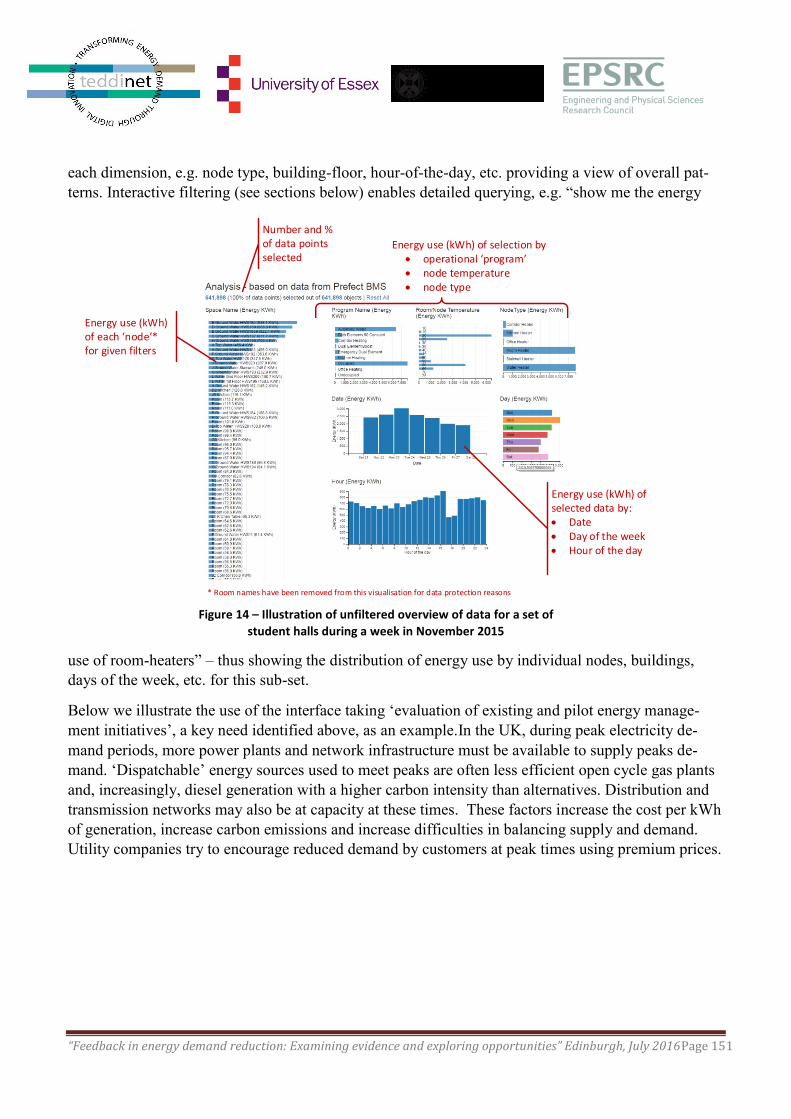
“Feedback in energy demand reduction: Examining evidence and exploring opportunities” Edinburgh, July 2016Page 151
each dimension, e.g. node type, building-floor, hour-of-the-day, etc. providing a view of overall pat-
terns. Interactive filtering (see sections below) enables detailed querying, e.g. “show me the energy
use of room-heaters” – thus showing the distribution of energy use by individual nodes, buildings,
days of the week, etc. for this sub-set.
Below we illustrate the use of the interface taking ‘evaluation of existing and pilot energy manage-
ment initiatives’, a key need identified above, as an example.In the UK, during peak electricity de-
mand periods, more power plants and network infrastructure must be available to supply peaks de-
mand. ‘Dispatchable’ energy sources used to meet peaks are often less efficient open cycle gas plants
and, increasingly, diesel generation with a higher carbon intensity than alternatives. Distribution and
transmission networks may also be at capacity at these times. These factors increase the cost per kWh
of generation, increase carbon emissions and increase difficulties in balancing supply and demand.
Utility companies try to encourage reduced demand by customers at peak times using premium prices.
Energy use (kWh) of each ‘node’* for given filters
Number and % of data points selected
Energy use (kWh) of selection by operational ‘program’ node temperature node type
* Room names have been removed from this visualisation for data protection reasons
Energy use (kWh) of selected data by: Date Day of the week Hour of the day
Figure 14 – Illustration of unfiltered overview of data for a set of
student halls during a week in November 2015
“Feedback in energy demand reduction: Examining evidence and exploring opportunities” Edinburgh, July 2016Page 152
For example, DUoS (Distribution Use of
System) charges are made by the regional
electricity network operators towards their
cost of operating the network, including
dealing with variation in demand. DUoS
charges are tiered into green, amber and red
price bands, with red being the most expen-
sive, illustrated for week-days (Monday to
Friday) in. Red DUoS periods are not ap-
plied on Saturday and Sunday in the distri-
bution region in which the University of Bristol’s properties are located.
Facilities and energy managers in customer organisations can respond by attempting to smooth out
demand on external electricity supply through, for example short-term energy buffering/storing
(boosting), reducing services at peak times, use (and storage) of local renewable energy.
At the University of Bristol the facilities managers use BMS scheduling functionality to attempt to
reduce electricity demand during red DUoS periods. For example by, lowering room thermostat set-
point temperatures by a few degrees centigrade during the red DUoS period (this can be over-ridden
manually by the resident) and adding heat to water heaters (storage tanks) prior to red DUoS periods
and reducing hot water set points during them, so that water is less likely to need heating during the
expensive period.
Figure 3 illustrates how the interface provides interactive exploration of the BMS data to help facili-
ties mangers assess the effectiveness of the BMS scheduling strategy. Users can click on the individu-
al bars in the ‘Day’ chart to select all of the week days (Mon-Fri) – this filters the dataset to include
only data points (instances) with those values for ‘Day’. In Figure 3, label 2 shows the comparison of
energy use (kWh) by hour-of-the-day for weekdays and weekends.
This demonstrates clearly that the facilities managers’ BMS scheduling approach has the desired ef-
fect of reducing energy use during the red-DUoS period, giving a visual and quantitative sense of
scale of the comparative effect.
Figure 3 also shows, in label 3. that further filters can then be applied, e.g. clicking on ‘Room Heater’
on the ‘Node Type’ chart would filter the dataset to include only ‘Room Heaters’, so that the specific
effects on different kinds of node can be seen. Similarly – clicking on individual ‘Program Name’ or
‘Space Name’ bars would filter results to include only data point with those values.
Figure 15 – Hypothetical illustration of demand and
DUoS charging bands for week-day (Mon-Fri)
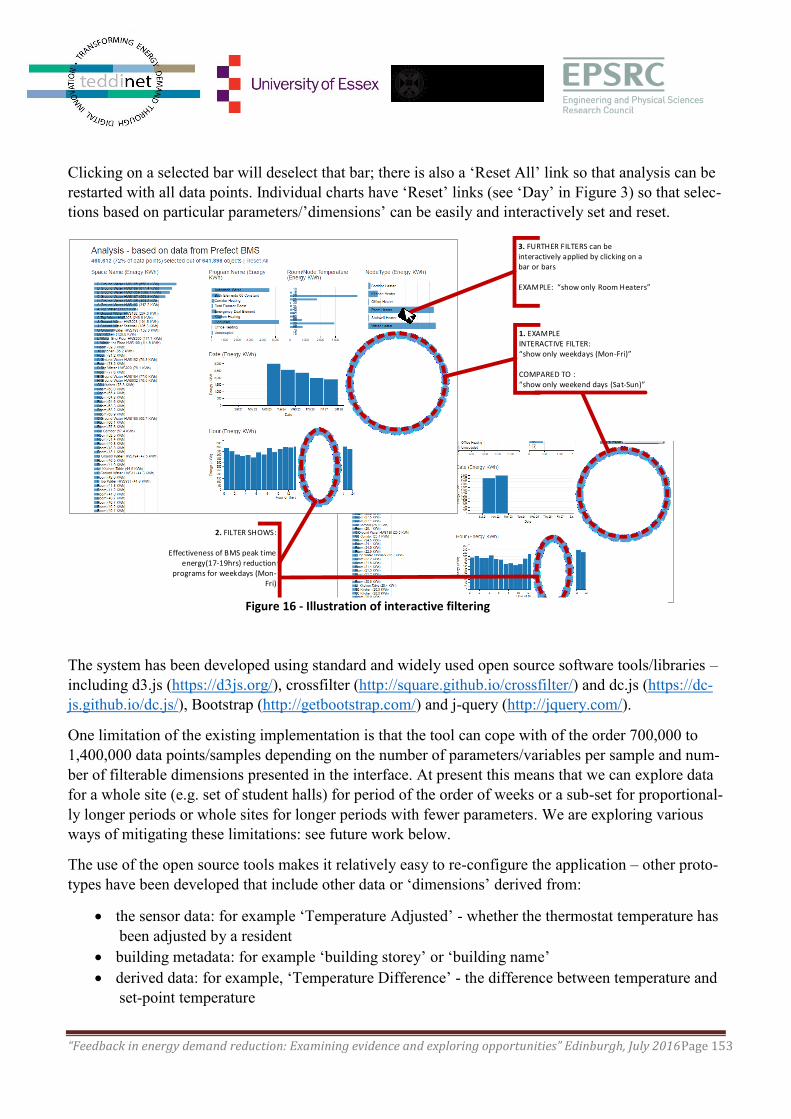
“Feedback in energy demand reduction: Examining evidence and exploring opportunities” Edinburgh, July 2016Page 153
Clicking on a selected bar will deselect that bar; there is also a ‘Reset All’ link so that analysis can be
restarted with all data points. Individual charts have ‘Reset’ links (see ‘Day’ in Figure 3) so that selec-
tions based on particular parameters/’dimensions’ can be easily and interactively set and reset.
The system has been developed using standard and widely used open source software tools/libraries –
including d3.js (https://d3js.org/), crossfilter (http://square.github.io/crossfilter/) and dc.js (https://dc-
js.github.io/dc.js/), Bootstrap (http://getbootstrap.com/) and j-query (http://jquery.com/).
One limitation of the existing implementation is that the tool can cope with of the order 700,000 to
1,400,000 data points/samples depending on the number of parameters/variables per sample and num-
ber of filterable dimensions presented in the interface. At present this means that we can explore data
for a whole site (e.g. set of student halls) for period of the order of weeks or a sub-set for proportional-
ly longer periods or whole sites for longer periods with fewer parameters. We are exploring various
ways of mitigating these limitations: see future work below.
The use of the open source tools makes it relatively easy to re-configure the application – other proto-
types have been developed that include other data or ‘dimensions’ derived from:
the sensor data: for example ‘Temperature Adjusted’ - whether the thermostat temperature has
been adjusted by a resident
building metadata: for example ‘building storey’ or ‘building name’
derived data: for example, ‘Temperature Difference’ - the difference between temperature and
set-point temperature
1. EXAMPLE INTERACTIVE FILTER: “show only weekdays (Mon-Fri)” COMPARED TO :“show only weekend days (Sat-Sun)”
2. FILTER SHOWS:
Effectiveness of BMS peak time energy(17-19hrs) reduction
programs for weekdays (Mon-Fri)
3. FURTHER FILTERS can be interactively applied by clicking on a bar or bars
EXAMPLE: “show only Room Heaters”
Figure 16 - Illustration of interactive filtering
“Feedback in energy demand reduction: Examining evidence and exploring opportunities” Edinburgh, July 2016Page 154
In the cases of user tasks such as, for example, identifying energy use ‘hot spots’ or anomalies, other
visualisations have also been developed at the level of individual ‘rooms’/nodes so that detailed be-
haviours can be investigated.
Beyond the kinds of analysis described above, early use of the interface by the University of Bristol’s
facilities managers have found that, for example:
Some rooms remain warm with no internal heat input overnight. This prompts investigation of
whether heat in domestic hot water being circulated through pipes through the rooms is being
lost to the room, which may point to a case for additional insulation,
In some rooms there are obvious sensor problems,
There is some unauthorised use of additional electrical heating, with attendant safety issues
Fast heat losses have been detected suggesting that windows have been left open unintention-
ally, can be detected.
Future Work
Development is on-going. Planned enhancements include: addition of other core metrics such as fi-
nancial cost and the addition of other metadata, such as room orientation (e.g. to help assess solar heat
gain). We are also developing various approaches to enhancing the system to overcome the current
limitations in number of data points, e.g. aggregating data-points, dynamic pre-filtering of data and
exploring ways to support more data points.
While initially designed for Facilities Managers we plan to experiment with a simplified version for
end-users.
References
IODiCUS. (2016). The IODiCUS Project. Retrieved March 11, 2016, from http://www.iodicus.org/
“Feedback in energy demand reduction: Examining evidence and exploring opportunities” Edinburgh, July 2016Page 155
Household energy-saving behavior and smart grid communication between utili-
ties and customers: Outcomes of the National Grid Smart Energy Solutions Program in Worcester, USA.
Josephine Munene1, Gregory Trencher
2, Nicholas Corsetti
3
1Presenting author: Clark University, Department of International Development, Community and En-
vironment, Worcester, MA, USA 2Corresponding author: Clark University, Department of International Development, Community and
Environment, Worcester, MA, USA. [email protected] 3National Grid, Waltham, MA, USA
Abstract
Smart metering and feedback technologies designed to foster changes in demand side behavior are a
key part of the smart grid paradigm. Smart grids and their technologies are under pilot testing all over
the world. They are shaped on assumptions that smart grid technologies can change consumer behav-
ior and reduce demand side energy consumption. Yet, empirical evidence for this currently lacks. As a
result, the question Do smart grids and smart technologies actually change behavior and promote
more sustainable energy use? is yet to be answered—notably at the scale of a city. This study exam-
ines the way by which residential customers adopted and engaged with smart grid technologies, and
the resulting changes in behavior from both these and pricing incentives from the utility. Data was ob-
tained by analyzing a random sample of 240 respondents to three questionnaires (total n=1,303) im-
plemented by a private sector consulting firm over summer in 2015. These questionnaires targeted
participating households in Worcester (population 181,045), Massachusetts, USA where National
Grid, the utility company, is piloting a two-year smart grid project involving 10,849 customers. This
paper discusses the concept of socializing in-home feedback technology devices in both high-income
and low-income households to influence energy saving behavior.
Our findings demonstrate that by creating a peak pricing scheme and diffusing household smart tech-
nologies, the program was able to foster an overall modest reduction in energy consumption through
energy saving behaviors, as well as prompting a shift to off-peak energy consumption. We found that
high-income customers saved the most energy, probably because they qualified for and had better ac-
cess to smart grid technologies provided for free by the utility. More so, customers that saved the most
energy were the active customers that were actively engaging with the digital picture frame and
WorcesterSmart web portal as they utilized technology to monitor their energy usage. We explore the
concept of socializing smart grid technology by interested and proactive customers. We conclude
however that the effectiveness of smart grid programs in shifting demand times in households could
be more successful if targeted customers actively interact with in-home technology whilst also adopt-
ing alternative behaviors to save energy. We also suggest that ‘socialization agents’ who are the key
players in smart grid programs should work together to increase socialization of technologies by con-
sumers.
Introduction: smart grid technology and influence on energy saving behavior
In December 2007, U.S. Congress passed and the President approved Title XIII of the Energy Inde-
pendence and Security Act of 2007 (EISA). The primary aim of EISA was to increase the use of digi-
tal information and the control of technology so as to improve the reliability, security and efficiency
“Feedback in energy demand reduction: Examining evidence and exploring opportunities” Edinburgh, July 2016Page 156
of the electric grid (U.S. Congress, 2007; Graab, 2010). As a result of this federal legislative and fund-
ing support such as the American Recovery and Reinvestment Act and EISA, the U.S. electric grid is
undergoing significant transformation (Chopra, 2011).
Smart grids and associated technologies are also under testing in residential and commercial settings
in various cities worldwide. Since they are currently enjoying massive government and private sector
investment (Mah, 2015; Reinprecht, 2016), government and utility expectations are accordingly high.
They are shaped on assumptions that smart grid technologies can change consumer behavior and re-
duce demand side energy consumption (Khan, 2016). Yet, empirical evidence for this currently lacks.
As a result, the question Do smart grids and smart technologies actually change behavior and pro-
mote more sustainable energy use? is yet to be answered—notably at the scale of a city.
This study attempts to fill this gap by examining customer behavioral responses to a smart grid pilot
program (Smart Energy Solutions [SES]) by National Grid (the utility), implemented in Worcester
with a population of 181,045 (City of Worcester, 2016) in Massachusetts, USA. The overall objective
was to determine the way by which residential customers adopted and engaged with smart grid tech-
nologies, and the resulting changes in behavior from both these and pricing incentives from the utility.
A defining feature of the program was a triple strategy to influencing demand side energy consump-
tion behavior: 1) free provision of smart in-home technologies such as smart plug control devices and
smart thermostats 2) provision of energy consumption feedback via digital picture frames and Internet
portals 3) real-time pricing plans. In particular, this study focuses on the influence of access to in-
home smart technologies on participating high and low-income households. Data was obtained by an-
alyzing a random sample of 240 responses to three surveys (total n=1,303) implemented by a private
consulting firm on behalf of National Grid over summer in 2015. This data was used to answer the
following research questions:
To what extent did (some) people adopt and engage with energy feedback technologies in the
home?
How did customers from high-income and low-income households change their energy use ac-
tivities in response to the pricing structure incentives and interaction with in-home technolo-
gies?
Has the program been able to reduce energy consumption in participant households?
We find that customers adopted and engaged with energy feedback technologies such as Worces-
terSmart web portal and digital picture frames. We also find that both high-income and low-income
households used the information to change their behavior towards energy saving activities. They em-
braced activities such as avoiding usage of energy intensive household appliances, and discussing en-
ergy conservation issues with family. Findings also reveal that real time pricing influenced consumers
to reduce demand of electricity. This was through the shifting of energy activities from peak event rate
that was expensive to off peak rate when electricity price was affordable.
Background
“Socialization agents” are crucial factors in fostering the socialization of energy feedback technology
and in-home smart devices, which can lead to increased awareness of energy consumption habits, and
potentially, reductions in energy consumption. Socialization in standard sociology and psychology, is
the process by which individuals identify their position and become entrenched parts of collectives
such as, for instance, a family, class or society (Skjølsvold, 2015). We see socialization as the
“Feedback in energy demand reduction: Examining evidence and exploring opportunities” Edinburgh, July 2016Page 157
possibility of humans interacting with in-home technology and incorporating feedback from these de-
vices in their daily life. In particular, the human behavior with regards to energy consumption could
be influenced by these technologies as people monitor their energy usage (Gottwalt, 2011). Adoles-
cents have been seen to have socialization agents such as parents, peer groups, social media, TV
commercials (Shim, 1996; Ryan, 2000) that influence the teens’ decision making and styles. In the
same way, we imagine key influential players in the socialization of smart grids and we refer to them
as “socialization agents”. We visualize these agents to be fundamental in smart grid programs: the
smart user, the utility, marketing companies and the government (Gungor, 2012; Harter, 2010; Far-
hangi, 2010). Of these, the vital player is the “smart user” on the demand side, who takes part in ac-
tively using the smart technology (Chesi, 2013, Goulden, 2014). Smart grid technology such as digital
picture frames, thermostats provide electricity monitoring that stimulates awareness and have the po-
tential of initiating savings because of increased insight on energy consumption (Geelen, 2013). The
extent to which in-home smart devices are socialized is influenced to a large degree by the level of
curiosity and active engagement of the user towards the technology. Yet socialization can also be sen-
sitive to electricity pricing. Consumers pay attention to when electricity rates are high and respond
accordingly by elevating their living style, re-organizing their day-to-day energy usage routine with
the aim of reducing their electric bills (Bouhafs, 2014). As other important socialization agents, utili-
ties may play several crucial roles. These include designing real time pricing plans to influence the
energy consumption patterns of the user, educating users about benefits of energy conservation and
additionally, by diffusing smart in-home technologies and to connect these with the customer (Bar-
bose, 2004; Gungor, 2012). Companies developing devices will perform the significant duty of de-
signing technology devices that are comfortable and convenient for customers (Gungor, 2012, Siano,
2014). All these players depend on the government to create policies to encourage societal diffusion of
smart technologies and in addition provide funds for R&D (Cavoukian, 2010; Faruqui, 2010). These
‘socialization agents’ should work in some level of collaboration to increase socialization of technolo-
gy at the home.
In addition to smart technologies, design of real time pricing plans from utilities can change behavior.
Given that costs are incurred by the utility in generating, transmitting and distributing electricity, costs
are recovered by charging customers a set tariff for each kilowatt-hour (kWh) of usage (Khan, 2016).
Typically, the most common approach used for pricing electricity is a flat rate tariff. The introduction
of distributed generation in the grid system has made it complex for old tariff methods to comply with
smart grid requirements (Sioshansi, 2010). The pricing system should be designed to advance rates to
meet developing challenges in form of environmental impact, management of bill, increase reliability
and to recover cost (Chitkara, 2016).
Methods and overview of case study
Smart energy solutions program (SES)
Massachusetts, the study site for this paper, has an established history of energy efficiency programs
in the electric utility sector (Hurley, 2008). The 2008 Green Communities Act enabled utilities to pro-
ceed even further, asserting: “Electric and natural gas resource needs shall first be met through all
available energy efficiency and demand reduction resources that are cost effective or less expensive
than supply” (Commonwealth of Massachusetts Acts of 2008). The Act mandated that each investor-
owned electric utility conduct a smart grid pilot with the overall objective of reducing active

“Feedback in energy demand reduction: Examining evidence and exploring opportunities” Edinburgh, July 2016Page 158
participants’ peak and average loads by at least 5%. Accordingly, National Grid13
, a utility company,
launched a pilot smart grid project called Smart Energy Solutions Program (SES). The program cost
$44 million. This was recovered through increased electricity charges to all National Grid customers
throughout the entire northeastern USA grid network (Moulton, 2015)
The SES program pilot is ongoing from January 2015 to December 2016. National Grid installed
15,00014
smart meters on the homes and business of the customers who are residents in Worcester,
Massachusetts. These customers were chosen when National Grid flagged their homes across 11 elec-
tric power supply feeders in the city. SES program customers were given the opportunity to choose
from several home energy management devices and technologies at no additional cost (National Grid,
2016). These included WorcesterSmart portal that shows personalized electric information to the cus-
tomer, digital picture frame, smart thermostat and plug control devices.
Customers were also enrolled in two different pricing plans. The default plan was the Smart Rewards
Pricing that combines Time of Use and Critical Peak Pricing structures. This pricing plan offers day-
time rates that are lower than the basic service rate (for a customer not in SES) for 335 days per year.
This plan has Time of Use kind of smart pricing that offers a variety of prices at peak time (8:00 am to
8:00 pm) and off-peak time (8:00 pm to 8:00 am and weekend). On the remaining days each year, i.e.
up to 30 days or 175 hours, called Conservation Days, rates would increase significantly during spe-
cifically designated hours known as peak events. The peak event rate is about five times the regular
rate. These peak events typically happen during summer months, when electricity is in high demand
and the supply is constrained. During these Conservation Days, customers are encouraged to take ac-
tion to conserve energy and reduce their electricity costs during those designated hours. National Grid
notifies customers through telephone messages and email the day before a peak event so they can plan
accordingly.
Customers were however given the alternative choice of opting for the Conservation Day Rebate plan.
This is modeled using the Peak Time Rebate structure. It offers customers the opportunity to stay at
the basic service rate as non-participating customers in the SES program and earn a rebate when they
reduce their energy usage below what they normally use during peak events. Customers receive a
credit the following month for any energy they saved during the previous month’s peak events on the
Conservation Days. This plan does not include the Time of Use rates for the 335 days of the year the
Smart Rewards Pricing plan offers. For more information on the different pricing plans see Chitkara
(2016) and National Grid (2016).
3.2 Data collection A stratified sampling technique was used by the consulting firm to select the survey respondents. As
shown in Table 1, the entire SES customer population (10,849 households as at September 2015) was
stratified into different segments, then random samples were taken from each strata. This was done in
accordance with the household’s enrollment in differing technology plans. The consulting firm sur-
veyed a total sample of 1,301 sampled customers across a total of three surveys while retaining the
13 National Grid is an international electricity transmission, distribution and gas distribution Company based in the UK
and northeastern US. As an energy distribution company, National Grid does not produce electricity or gas but connects
consumers to energy sources through its networks. It is the largest distributor of natural gas and electricity in the north-
eastern US, serving more than 3 million customers in New York, Massachusetts and Rhode Island. 14
At the onset of SES program, 15,000 smart meters were deployed. But at the time this research was conducted, some
customers had opted out; others shifted to different electricity suppliers or moved, reducing the number of participating
customers to 10,849.
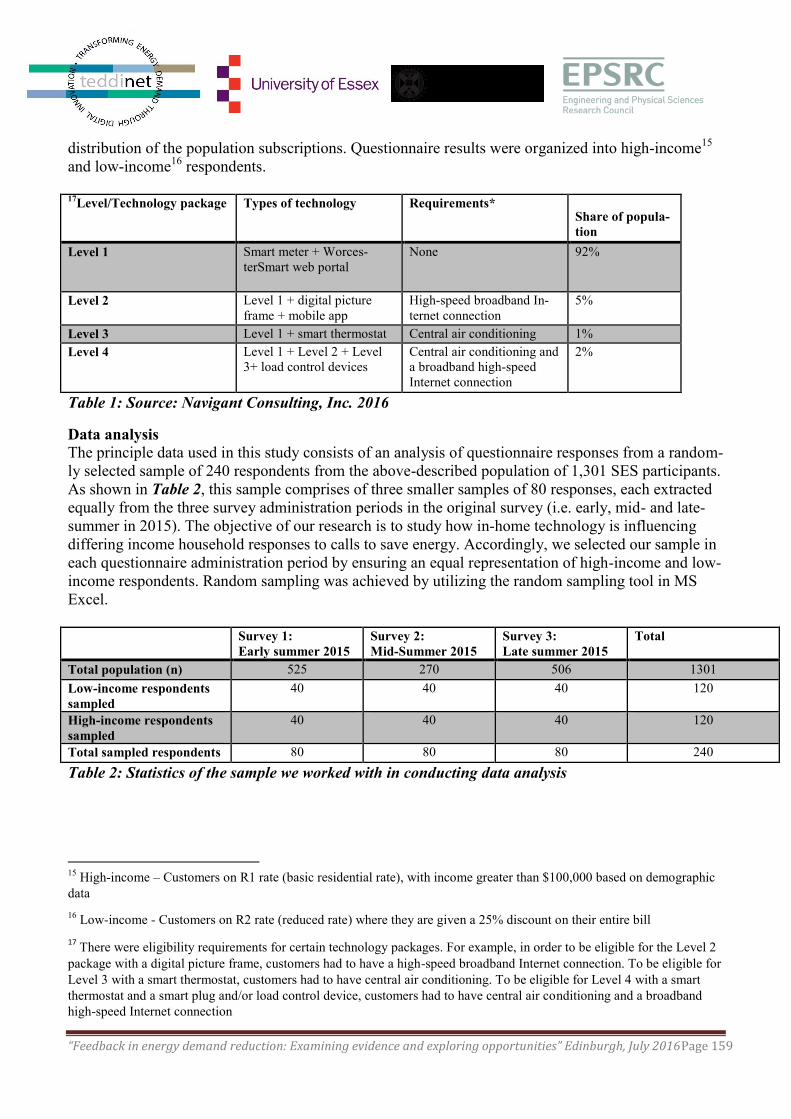
“Feedback in energy demand reduction: Examining evidence and exploring opportunities” Edinburgh, July 2016Page 159
distribution of the population subscriptions. Questionnaire results were organized into high-income15
and low-income16
respondents.
17
Level/Technology package Types of technology Requirements* Share of popula-
tion
Level 1 Smart meter + Worces-
terSmart web portal
None 92%
Level 2 Level 1 + digital picture
frame + mobile app
High-speed broadband In-
ternet connection
5%
Level 3 Level 1 + smart thermostat Central air conditioning 1%
Level 4 Level 1 + Level 2 + Level
3+ load control devices
Central air conditioning and
a broadband high-speed
Internet connection
2%
Table 1: Source: Navigant Consulting, Inc. 2016
Data analysis
The principle data used in this study consists of an analysis of questionnaire responses from a random-
ly selected sample of 240 respondents from the above-described population of 1,301 SES participants.
As shown in Table 2, this sample comprises of three smaller samples of 80 responses, each extracted
equally from the three survey administration periods in the original survey (i.e. early, mid- and late-
summer in 2015). The objective of our research is to study how in-home technology is influencing
differing income household responses to calls to save energy. Accordingly, we selected our sample in
each questionnaire administration period by ensuring an equal representation of high-income and low-
income respondents. Random sampling was achieved by utilizing the random sampling tool in MS
Excel.
Survey 1:
Early summer 2015
Survey 2:
Mid-Summer 2015
Survey 3:
Late summer 2015
Total
Total population (n) 525 270 506 1301
Low-income respondents
sampled
40 40 40 120
High-income respondents
sampled
40 40 40 120
Total sampled respondents 80 80 80 240
Table 2: Statistics of the sample we worked with in conducting data analysis
15
High-income – Customers on R1 rate (basic residential rate), with income greater than $100,000 based on demographic
data
16 Low-income - Customers on R2 rate (reduced rate) where they are given a 25% discount on their entire bill
17 There were eligibility requirements for certain technology packages. For example, in order to be eligible for the Level 2
package with a digital picture frame, customers had to have a high-speed broadband Internet connection. To be eligible for
Level 3 with a smart thermostat, customers had to have central air conditioning. To be eligible for Level 4 with a smart
thermostat and a smart plug and/or load control device, customers had to have central air conditioning and a broadband
high-speed Internet connection
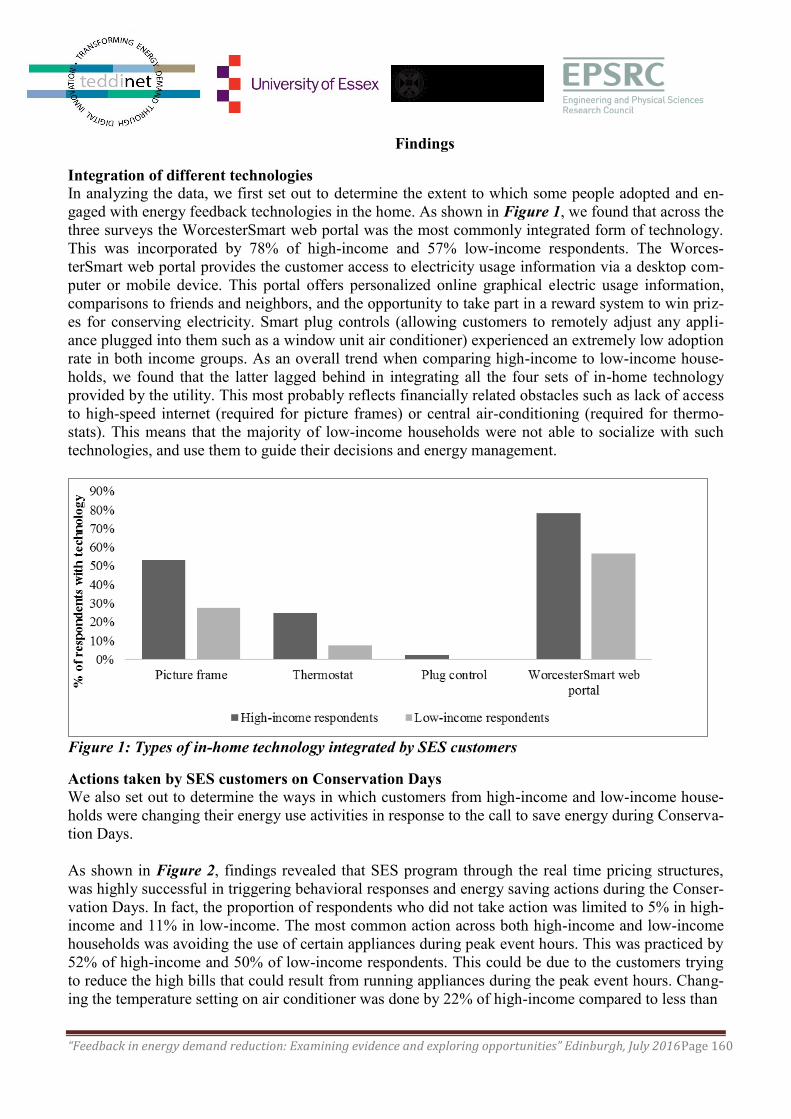
“Feedback in energy demand reduction: Examining evidence and exploring opportunities” Edinburgh, July 2016Page 160
Findings
Integration of different technologies
In analyzing the data, we first set out to determine the extent to which some people adopted and en-
gaged with energy feedback technologies in the home. As shown in Figure 1, we found that across the
three surveys the WorcesterSmart web portal was the most commonly integrated form of technology.
This was incorporated by 78% of high-income and 57% low-income respondents. The Worces-
terSmart web portal provides the customer access to electricity usage information via a desktop com-
puter or mobile device. This portal offers personalized online graphical electric usage information,
comparisons to friends and neighbors, and the opportunity to take part in a reward system to win priz-
es for conserving electricity. Smart plug controls (allowing customers to remotely adjust any appli-
ance plugged into them such as a window unit air conditioner) experienced an extremely low adoption
rate in both income groups. As an overall trend when comparing high-income to low-income house-
holds, we found that the latter lagged behind in integrating all the four sets of in-home technology
provided by the utility. This most probably reflects financially related obstacles such as lack of access
to high-speed internet (required for picture frames) or central air-conditioning (required for thermo-
stats). This means that the majority of low-income households were not able to socialize with such
technologies, and use them to guide their decisions and energy management.
Figure 1: Types of in-home technology integrated by SES customers
Actions taken by SES customers on Conservation Days
We also set out to determine the ways in which customers from high-income and low-income house-
holds were changing their energy use activities in response to the call to save energy during Conserva-
tion Days.
As shown in Figure 2, findings revealed that SES program through the real time pricing structures,
was highly successful in triggering behavioral responses and energy saving actions during the Conser-
vation Days. In fact, the proportion of respondents who did not take action was limited to 5% in high-
income and 11% in low-income. The most common action across both high-income and low-income
households was avoiding the use of certain appliances during peak event hours. This was practiced by
52% of high-income and 50% of low-income respondents. This could be due to the customers trying
to reduce the high bills that could result from running appliances during the peak event hours. Chang-
ing the temperature setting on air conditioner was done by 22% of high-income compared to less than
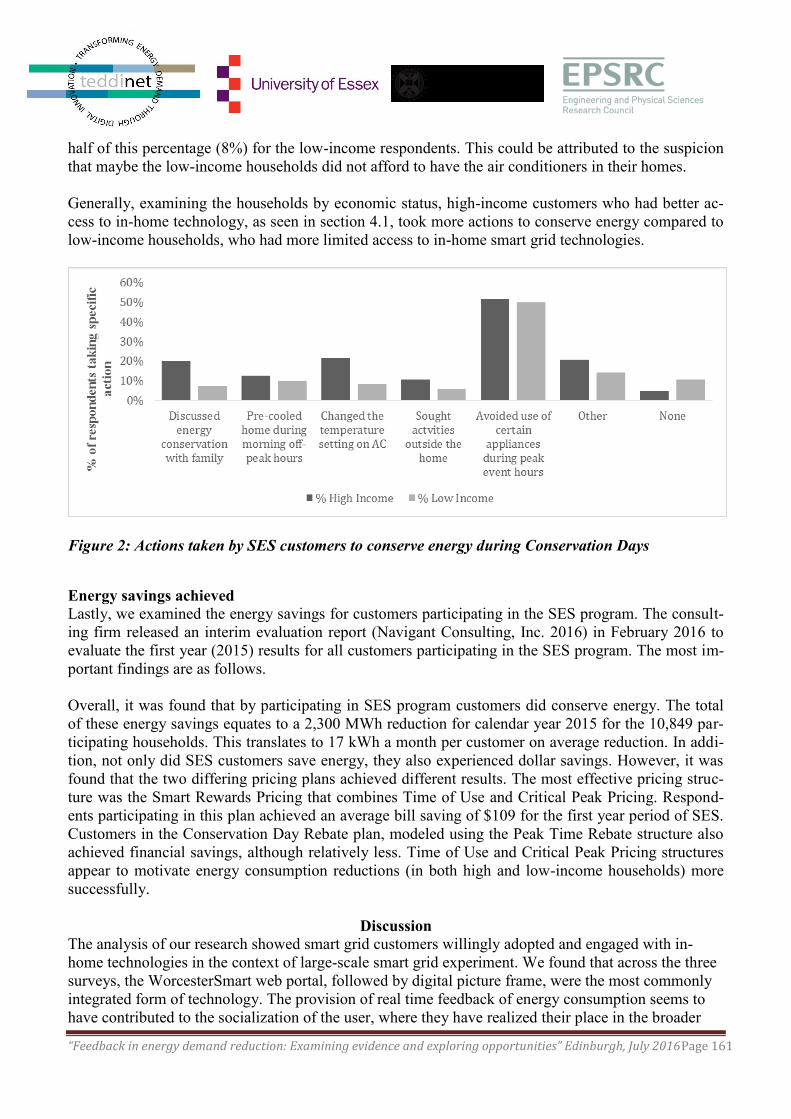
“Feedback in energy demand reduction: Examining evidence and exploring opportunities” Edinburgh, July 2016Page 161
half of this percentage (8%) for the low-income respondents. This could be attributed to the suspicion
that maybe the low-income households did not afford to have the air conditioners in their homes.
Generally, examining the households by economic status, high-income customers who had better ac-
cess to in-home technology, as seen in section 4.1, took more actions to conserve energy compared to
low-income households, who had more limited access to in-home smart grid technologies.
Figure 2: Actions taken by SES customers to conserve energy during Conservation Days
Energy savings achieved
Lastly, we examined the energy savings for customers participating in the SES program. The consult-
ing firm released an interim evaluation report (Navigant Consulting, Inc. 2016) in February 2016 to
evaluate the first year (2015) results for all customers participating in the SES program. The most im-
portant findings are as follows.
Overall, it was found that by participating in SES program customers did conserve energy. The total
of these energy savings equates to a 2,300 MWh reduction for calendar year 2015 for the 10,849 par-
ticipating households. This translates to 17 kWh a month per customer on average reduction. In addi-
tion, not only did SES customers save energy, they also experienced dollar savings. However, it was
found that the two differing pricing plans achieved different results. The most effective pricing struc-
ture was the Smart Rewards Pricing that combines Time of Use and Critical Peak Pricing. Respond-
ents participating in this plan achieved an average bill saving of $109 for the first year period of SES.
Customers in the Conservation Day Rebate plan, modeled using the Peak Time Rebate structure also
achieved financial savings, although relatively less. Time of Use and Critical Peak Pricing structures
appear to motivate energy consumption reductions (in both high and low-income households) more
successfully.
Discussion
The analysis of our research showed smart grid customers willingly adopted and engaged with in-
home technologies in the context of large-scale smart grid experiment. We found that across the three
surveys, the WorcesterSmart web portal, followed by digital picture frame, were the most commonly
integrated form of technology. The provision of real time feedback of energy consumption seems to
have contributed to the socialization of the user, where they have realized their place in the broader
“Feedback in energy demand reduction: Examining evidence and exploring opportunities” Edinburgh, July 2016Page 162
context of the entire energy distribution system. This technology-enabled socialization seems to be
influenced by the smart user’s curiosity regarding the novelty of the feedback data and devices, and a
willingness to use them to guide decisions about electricity use to reduce monthly expenditures. It was
also possibly influenced by some level of competition with his neighbors. Utilities, government and
companies that design smart grid technology could collaborate as important ‘socialization agents’ and
encourage customers to participate in energy saving behavior by providing access to smart grid in-
home technology. Thus, smart grid programs implemented in the future should consider affordable
access of smart grid in-home technology to all households when designing smart grid programs for
increased socialization of technology. By socialization, we refer to the ability of different components
to play a role in influencing interaction of smart grid technology. For instance, these ‘socialization
agents’ could collaboratively facilitate arrangements with householders to obtain the requirements
needed for the in-home technologies like digital picture frames. This could be achieved by partnering
with internet providers to provide a discount on high-speed internet access based on participation in
the smart grid in-home technology program. Additionally, we suggest that utilities could focus on ear-
ly adopters, learn from, and involve them as advocates for technology adoption and socialization to
other customers.
Related to obtaining in-home smart grid technology, we also found that high-income customers took
more actions to conserve energy during conservation days compared to low-income households. This
can be mostly explained by the lack of any obstacles in acquiring the freely provided technologies to
customers with high-speed Internet (for digital picture frames) or central air-conditioning (for smart
thermostats). These actions included avoiding usage of energy intensive household appliances, dis-
cussing energy conservation issues with family, pre-cooling homes in off-peak hours, adjusting air-
conditioning temperatures, and vacating households and/or avoiding activities inside the home. This
willingness to make behavioral changes could be attributed to the postulation that these high-income
households readily utilized the technology to make informed decisions about saving energy. The
higher participation in energy saving activities is also mostly likely the natural result of a higher expo-
sure to additional reminders that the high-income received from their in-home technology devices
such as the digital picture frame and the WorcesterSmart web portal. Such reminders were messages
from utility that provided electricity usage information, real time pricing, which are vital in guiding
more informed decisions about energy usage. As demonstrated in this case, utilities, as socialization
agents, have an important role to influence demand side energy consumption behavior through three
key strategies. First is through provision of smart in-home technologies such as smart plug control de-
vices and smart thermostats. Second is through provision of energy consumption feedback via digital
picture frames and Internet portal, with the third being real-time pricing plans.
Another finding was that there was reduction in energy demand in the SES program. In particular, the
total of these energy savings was approximately 2,300 MWh reduction for calendar year 2015. This
could appear as an insignificant achievement but this amount of energy could be sufficient to power a
local library in Worcester for a year. Also, the reduction was achieved by residential customers and
does not factor in commercial clienteles. National Grid was satisfied with this reduction. The utility
was not expecting massive energy efficiency savings as the initial goal was for a 5% reduction in en-
ergy and demand savings. This was achieved and continues to be exceeded, with the program still in
progress. Customers in the Smart Rewards Pricing also saved more energy and money compared to
those in Conservation Day Rebate Plan. This suggests that the real time pricing has succeeded in in-
fluencing behavior through attractive off peak rates and, conversely, expensive peak event rates.
Hence the program has demonstrated an ability to successfully guide customers to shift their energy
demanding activities to off-peak periods when pricing was low.
“Feedback in energy demand reduction: Examining evidence and exploring opportunities” Edinburgh, July 2016Page 163
Although participants in the program experienced energy savings, we foresee a possibility of future
rebound effects, also known as the Jevons paradox. This states that energy efficiency gains result in
increasing use of resources rather than reducing energy consumption (Sorrell, 2009). For instance,
11% of high-income and 6% of low-income respondents chose to seek activities outside home during
peak event hours. Though these customers avoided staying in the house in an effort to save energy, the
alternative actions taken might also have resulted in the consumption of other forms of energy such as
gas while driving to seek for alternative ways to spend their day and also other energy expenditures.
Projecting this situation on a large scale, we might end up saving energy in the indoor household set-
ting but increasing use of energy and other expenditures outside the household unit. It could be worth
considering the influence of environmentally meaningful behaviors that would accompany the techno-
logical influences to enable the successful achievement of the goal of saving energy holistically. For
instance, utilities could organize low-energy use community events during peak event hours that cus-
tomers participating in the program could consider doing on that day. At the very least, utilities could
seek to educate customers on the importance of ensuring that environmental benefits accrued from
electricity usage reductions were not offset by energy consumption elsewhere.
Conclusions
The main objective of our research was to examine customer behavioral responses to a smart grid pilot
program (Smart Energy Solutions [SES]) by National Grid (the utility), implemented in Worcester,
Massachusetts, USA. We set out to determine how customers adopted and engaged with smart grid
technologies, and the resulting changes in behavior from both these and pricing incentives from the
utility. We looked at customers across high-income and low-income households and their interaction
with the freely provided technology.
Our findings reveal that smart grid in-home technology can be socialized. We call on the collaboration
of all the socialization agents: utility, government and marketing companies; to provide affordable in-
home devices to the customer for the successful intensification of socialization. The majority of low-
income households were not able to socialize with technologies, and use them to guide their decisions
and energy management. Utilities ought to ensure that there are no major limitations inhibiting some
customers from acquisition of smart grid technologies. We were also interested in the difference in
energy consumption with the introduction of SES across participating households. We found that the
real time pricing encourages the consumers to take action towards saving energy where customers are
able to shift demand to when the rate is cheap.
Thus, influenced by the motivation to save money, and guided by technology, consumers in other
smart grid utility experiments could be brought to align their activities appropriately in response to
calls for energy conservation from power utilities. In effect, smart grid in-home technology provides
information of energy use in the house and influences the user to take actions to reduce energy con-
sumption and for that reason save money in their electric bills.
References
Alliance Commission on National Energy Efficiency Policy [ACNEEP ], (2013). Power Generation &
Smart Grid: Alliance Commission on National Energy Efficiency Policy.
Baldissin, D. S., Borger, F. G., Jorge, R. P., Moreira, V. C., Souto, E. A., & Pelegrini, M. A. (2015, June). In
23rd International Conference on Electricity Distribution. Lyon: CIRED.
Barbose, G., Goldman, C., & Neenan, B. (2004). A survey of utility experience with real time pricing.
“Feedback in energy demand reduction: Examining evidence and exploring opportunities” Edinburgh, July 2016Page 164
Lawrence Berkeley National Laboratory.
Bhat, K., Sundarraj, V., Pandita, S., Sinha, S., & Kaul, A. (2013). IEEE Global Consumer Socialization of
Smart Grid.
Blumsack, S., & Fernandez, A. (2012). Ready or not, here comes the smart grid!. Energy, 37(1), 61-68.
Bouhafs, F., et al. (2012). "Links to the future: communication requirements and challenges in the smart
grid." IEEE Power and Energy Magazine 10(1): 24-32.
Bouhafs, F., Mackay, M., & Merabti, M. (2014). Communication Challenges and Solutions in the Smart
Grid: Springer.
Cavoukian, A., Polonetsky, J., & Wolf, C. (2010). Smartprivacy for the smart grid: embedding privacy into
the design of electricity conservation. Identity in the Information Society, 3(2), 275-294.
Chesi, A., Ferrara, G., Ferrari, L., Magnani, S., & Tarani, F. (2013). Influence of the heat storage size
on the plant performance in a smart user case study. Applied energy, 112, 1454-1465.
Chitkara Aman , C.-C. D., Li Becky , and Sherwood James (2016). A review of Alternative Rate De-
signs: Industry experience with time-based and demand charge rates for mass-market custom-
ers. Retrieved from http://www.rmi. org/alternative_rate_designs.
Chopra, A., & Kundra, V. (2011). A POLICY FRAMEWORK FOR THE 21st CENTURY GRID:
Enabling Our Secure Energy Future.
City of Worcester, M. (2016). Welcome to Worcester, Massachusetts! Retrieved June 6th, 2016,
from http://www.worcesterma.gov/
Clarke, L., et al. (2007). "Scenarios of greenhouse gas emissions and atmospheric concentrations." US
Department of Energy Publications: 6.
Clastres, C. (2011). Smart grids: Another step towards competition, energy security and climate change ob-
jectives. Energy Policy, 39(9), 5399-5408.
Commonwealth of Massachusetts Acts of 2008, The 189th General Court of the Commonwealth of
Massachusetts, Chapter 169 Stat. (2008).
Davito, B., Tai, H., & Uhlaner, R. (2010). The smart grid and the promise of demand-side manage-
ment. McKinsey on Smart Grid, 3, 8-44.
Enkvist, P., et al. (2007). "A cost curve for greenhouse gas reduction." McKinsey Quarterly 1: 34.
Fan, Z., Kalogridis, G., Efthymiou, C., Sooriyabandara, M., Serizawa, M., & McGeehan, J. (2010).
The new frontier of communications research: smart grid and smart metering. Paper presented
at the Proceedings of the 1st International Conference on Energy-Efficient Computing and
Networking.
Fang, X., et al. (2012). "Smart grid—The new and improved power grid: A survey." IEEE communi-
cations surveys & tutorials 14(4): 944-980.
Farhangi, H. (2010). The path of the smart grid. Power and energy magazine, IEEE, 8(1), 18-28.
Faruqui, A., Harris, D., & Hledik, R. (2010). Unlocking the€ 53 billion savings from smart meters in
the EU: How increasing the adoption of dynamic tariffs could make or break the EU’s smart
grid investment. Energy Policy, 38(10), 6222-6231.
Feng, S., Zhang, J., & Gao, Y. (2015, May). Real options analysis for smart grid: the role of infor-
mation technology and public policy. In Proceedings of the 16th Annual International Confer-
ence on Digital Government Research (pp. 266-275). ACM.
Geelen, D., Reinders, A., & Keyson, D. (2013). Empowering the end-user in smart grids: Recommen-
dations for the design of products and services. Energy Policy, 61, 151-161.
Gharavi, H. and R. Ghafurian (2011). Smart grid: The electric energy system of the future, IEEE.
Gottwalt, S., Ketter, W., Block, C., Collins, J., & Weinhardt, C. (2011). Demand side management—
A simulation of household behavior under variable prices. Energy Policy, 39(12), 8163-8174.
Goulden, M., Bedwell, B., Rennick-Egglestone, S., Rodden, T., & Spence, A. (2014). Smart grids,
smart users? The role of the user in demand side management. Energy Research & Social
“Feedback in energy demand reduction: Examining evidence and exploring opportunities” Edinburgh, July 2016Page 165
Science, 2, 21-29. doi: 10.1016/j.erss.2014.04.008
Graab, A. C. (2010). Smart Grid: A Smart Solution to a Complicated Problem, The. Wm. & Mary L. Rev., 52,
2051.
Gungor, V. C., et al. (2012). "Smart grid and smart homes: key players and pilot projects." IEEE Industrial
Electronics Magazine 6(4): 18-34.
Hargreaves, T., Nye, M., & Burgess, J. (2010). Making energy visible: A qualitative field study of how
householders interact with feedback from smart energy monitors. Energy Policy, 38(10), 6111-6119.
doi: 10.1016/j.enpol.2010.05.068
Harter, G., et al. (2010). "Sustainable urbanization: the role of ICT in city development." Booz & Company
Inc., available at http://www. booz. com/media/uploads/Sustainable_Urbanization. pdf.
Horst, G. (2011). Consumer Engagement: Facts, Myths & Motivations. In Grid-Interop Forum 2011.
Hossain, E., Han, Z., & Poor, H. V. (2012). Smart grid communications and networking. New York:
Cambridge University Press.
Hurley, D., Takahashi, K., Biewald, B., Kallay, J., & Maslowski, R. (2008). Costs and Benefits of
Electric Utility Energy Efficiency in Massachusetts (Rep.). Cambridge, MA: Synapse Energy
Economics. PREPARED FOR: Northeast Energy Efficiency Council
Jain, R. K., et al. (2012). "Assessing eco-feedback interface usage and design to drive energy efficien-
cy in buildings." Energy and buildings 48: 8-17.
Khadgi, P., Bai, L., Evans, G., & Zheng, Q. P. (2015). A simulation model with multi-attribute utility func-
tions for energy consumption scheduling in a smart grid. Energy Systems, 6(4), 533-550.
Khan, A. R., Mahmood, A., Safdar, A., Khan, Z. A., & Khan, N. A. (2016). Load forecasting, dynam-
ic pricing and DSM in smart grid: A review. Renewable and Sustainable Energy Reviews, 54,
1311-1322.
Levinson, M. (2010). Is the smart grid really a smart idea? Issues in Science and Technology, 27(1), 39.
Lima, C. A. F. and G. D. M. Jannuzzi "Smart Grid implementation in developing countries: analysis focus-
sing consumer behaviour, markets and regulation."
Lutzenhiser, L., Cesafsky, L., Chappells, H., Gossard, M., Moezzi, M., Moran, D., ... & Wilhite, H. (2009).
Behavioral assumptions underlying California residential sector energy efficiency programs. Prepared
for the California Institute for Energy and Environment Behavior and Energy Program
Mah, D., Hills, P., Li, V. O., & Balme, R. (2014). Smart grid applications and developments: Spring-
er.
Moulton, C. (2015). A year in, Smart Energy program bright idea for most. Telegram Worcester MA,
Gatehouse Media, LLC
National Energy Technology Laboratory (2009). Smart Grid Principal Characteristics; ENABLES
ACTIVE PARTICIPATION BY CONSUMERS: U.S. Department of Energy Office of Elec-
tricity Delivery and Energy Reliability.
National Grid (2016). National, Grid. Retrieved June 5th 2016, 2016, from
https://www.nationalgridus.com/Default
Navigant Consulting, Inc. (2016). National Grid. Smart Energy Solutions Pilot. Colorado: Navigant
Consulting, Inc. .
Pierce, J. and E. Paulos (2012). Beyond energy monitors: interaction, energy, and emerging energy
systems. Proceedings of the SIGCHI Conference on Human Factors in Computing Systems,
ACM.
Ryan, A. M. (2000). "Peer groups as a context for the socialization of adolescents' motivation, en-
gagement, and achievement in school." Educational Psychologist 35(2): 101-111.
Samadi, P., et al. (2010). Optimal real-time pricing algorithm based on utility maximization for smart
grid. Smart Grid Communications (SmartGridComm), 2010 First IEEE International Confer-
ence on, IEEE.
“Feedback in energy demand reduction: Examining evidence and exploring opportunities” Edinburgh, July 2016Page 166
Shim, S. (1996). "Adolescent consumer decision‐making styles: the consumer socialization perspec-
tive." Psychology & Marketing 13(6): 547-569.
Siano, P. (2014). "Demand response and smart grids—A survey." Renewable and Sustainable Energy
Reviews 30: 461-478.
Simchak, T., Ungar, L., & Alliance, A. (2011). Realizing the Energy Efficiency Potential of Smart
Grid.
Sintov, N. D., & Schultz, P. W. (2015). Unlocking the potential of smart grid technologies with behavioral
science. Frontiers in psychology, 6.
Sioshansi, F. P. (Ed.). (2011). Smart grid: integrating renewable, distributed & efficient energy. Academic
Press.
Skjølsvold, T. M. and M. Ryghaug (2015). "Embedding smart energy technology in built environments: A
comparative study of four smart grid demonstration projects." Indoor and Built Environment 24(7):
878-890.
SmartMark Communications. (2015). Engaging the Small to Medium-Sized Business Through Smart Grid
Customer Education. Smart Energy IP.
Sorrell, S. (2009). Jevons’ Paradox revisited: The evidence for backfire from improved energy efficiency. En-
ergy policy, 37(4), 1456-1469.
Stragier, J., Derboven, J., Laporte, L., Hauttekeete, L., & De Marez, L. (2013). Kilowhat? A multidisciplinary
approach on the development of a home energy management system. Behaviour & Information Tech-
nology, 32(11), 1086-1104. doi: 10.1080/0144929x.2012.740638
Toft, B. M. a., & Thøgersen, J. (2015). Exploring private consumers’ willingness to adopt Smart Grid tech-
nology. International Journal of Consumer Studies, 39(6), 648-660. doi: 10.1111/ijcs.12201
U.S. Congress. (2007). Energy Independence and Security Act of 2007 [Cong. Public Law 110–140 from
110th Cong.]. Washington, D.C.: U.S. G.P.O.
U.S. Department of Energy [U.S. DOE]. (2016). Energy.Gov; Office of Electricity Delivery & Energy Relia-
bility. Retrieved from http://energy.gov/oe/services/technology-development/smart-grid
Uribe-Pérez, N., Hernández, L., de la Vega, D., & Angulo, I. (2016). State of the Art and Trends Re-
view of Smart Metering in Electricity Grids. Applied Sciences, 6(3), 68.
doi:10.3390/app6030068
Vasirani, M., & Ossowski, S. (2013). Smart consumer load balancing: state of the art and an empirical
evaluation in the Spanish electricity market. Artificial Intelligence Review, 39(1), 81-95.
Verbong, G. P., et al. (2013). "Smart grids or smart users? Involving users in developing a low carbon
electricity economy." Energy Policy 52: 117-125.
Vermont, T. L. (2014). Customer Participation in the Smart Grid - Lessons Learnt: U.S. Department
of Energy: Electricity Delivery and Reliability.
Wang, T.-H., & Chen, H.-H. (2016). Channel discovery algorithms for interference avoidance in
smart grid communication networks: a survey. Wireless Communications and Mobile Compu-
ting, 16(4), 427-440. doi: 10.1002/wcm.2523
Zhang, X., Pei, W., Deng, W., Du, Y., Qi, Z., & Dong, Z. (2015). Emerging smart grid technology for
mitigating global warming. International Journal of Energy Research, 39(13), 1742-1756.
Zipperer, A., Aloise-Young, P. A., Suryanarayanan, S., Roche, R., Earle, L., Christensen, D., . . .
Zimmerle, D. (2013). Electric energy management in the smart home: Perspectives on ena-
bling technologies and consumer behavior. Proceedings of the IEEE, 101(11), 2397-2408.
“Feedback in energy demand reduction: Examining evidence and exploring opportunities” Edinburgh, July 2016Page 167
Challenges of feedback in organisations- can we foster partnerships
not projects?
Richard J. Bull
Kathryn B. Janda
Institute of Energy and Sustainable De-
velopment
Environmental Change Institute
De Montfort University Oxford University
The Gateway South Parks Road
Leicester LE1 9BH Oxford OX1 3QY
e-mail: [email protected] email: [email protected]
Abstract
Using a lens of feedback and engagement this paper discusses the relationships between people, or-
ganisations, and energy use in workplaces. It reflects on two projects that explored participatory en-
ergy practices in public and private organisations. The first, “Working with Infrastructure, Creation of
Knowledge, and Energy strategy Development (WICKED)”, explored energy management practices
in a range of different retail companies. The second, ‘Gooddeeds’ aimed to collaboratively create an
ICT based tool and related social processes with a city municipality. The paper concludes, firstly, that
energy management sits against the backdrop of competing organisational, institutional and political
priorities and the core strategy of an organisation matters. Second, we need to move beyond the ‘them
and us’ culture and ‘information-deficit’ approach intrinsic in the notion of dashboards and feedback
to appreciate the positive contribution all can make to energy efficiency. Finally, there are still large
discrepancies across organisations with regards to energy management capabilities and metering tech-
nologies. In conclusion we note that relationships and partnerships are central in moving forward.
1. Introduction
This paper sheds light on the challenge of energy use in organisations. Latest estimates show that or-
ganisations (including commercial, public and industrial) worldwide account for between 50% and
60% of energy use worldwide with buildings constituting 18% of emissions from buildings in the UK
and 20% globally (Andrews and Johnson 2016; Stern et al 2016). A successful transition towards en-
ergy efficiency in organisations, as in society more widely, requires a shift in mind-set for policymak-
ers and building users as we move from a ‘them and us’ approach to feedback to a participatory ap-
proach that appreciates context, culture and complexity. A recent review of over twenty energy and
behaviour change interventions from around the world using the ‘behaviour change wheel’ as an ana-
lytic framework (Staddon et al 2016). The authors note that the most successful initiatives had a com-
bination of technological automation and ‘enablement’ – that is opportunities for building users to
move beyond education and training. The authors observe enablement appears to be linked to a
change in the relationships of the relevant actors and a shift in levels of employee control and respon-
sibility. ‘Enablement’ exhibits key traits of engagement, three benefits of which are noted by
Sovocool (2014). First, democracy is increased as all citizens have a right to participate and be repre-
sented in environmental decision making, second, non-experts are often more attune to the ethical
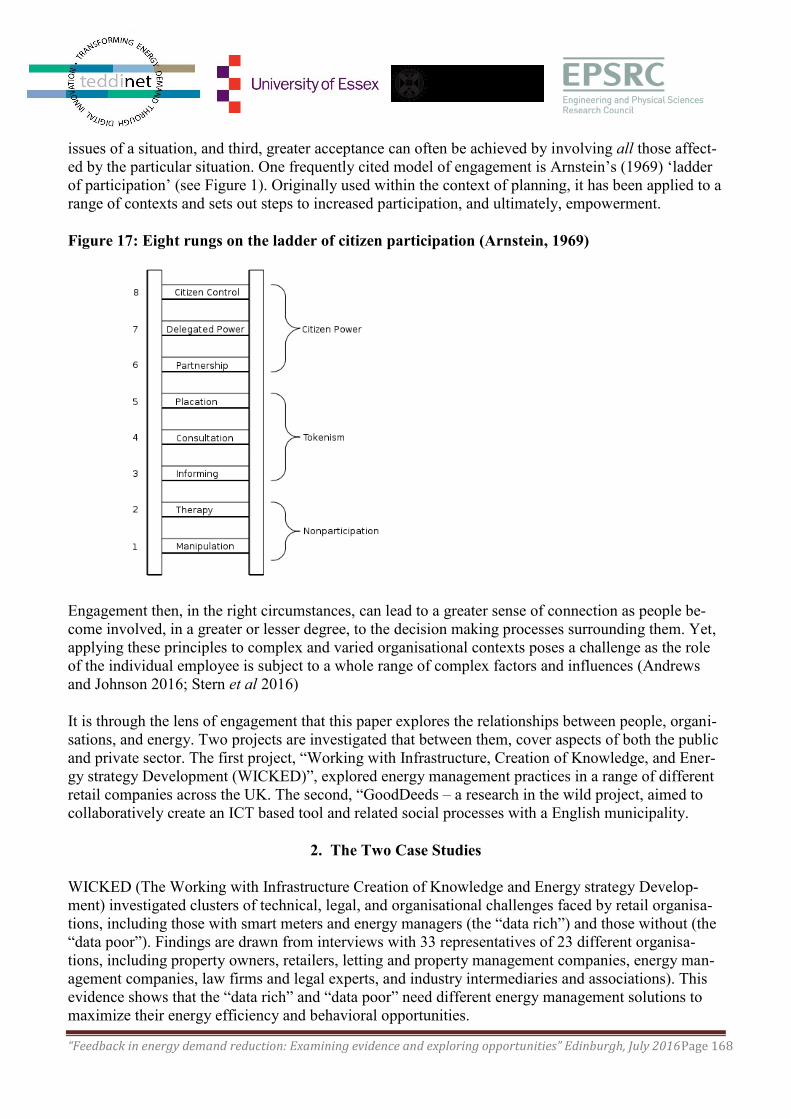
“Feedback in energy demand reduction: Examining evidence and exploring opportunities” Edinburgh, July 2016Page 168
issues of a situation, and third, greater acceptance can often be achieved by involving all those affect-
ed by the particular situation. One frequently cited model of engagement is Arnstein’s (1969) ‘ladder
of participation’ (see Figure 1). Originally used within the context of planning, it has been applied to a
range of contexts and sets out steps to increased participation, and ultimately, empowerment.
Figure 17: Eight rungs on the ladder of citizen participation (Arnstein, 1969)
Engagement then, in the right circumstances, can lead to a greater sense of connection as people be-
come involved, in a greater or lesser degree, to the decision making processes surrounding them. Yet,
applying these principles to complex and varied organisational contexts poses a challenge as the role
of the individual employee is subject to a whole range of complex factors and influences (Andrews
and Johnson 2016; Stern et al 2016)
It is through the lens of engagement that this paper explores the relationships between people, organi-
sations, and energy. Two projects are investigated that between them, cover aspects of both the public
and private sector. The first project, “Working with Infrastructure, Creation of Knowledge, and Ener-
gy strategy Development (WICKED)”, explored energy management practices in a range of different
retail companies across the UK. The second, “GoodDeeds – a research in the wild project, aimed to
collaboratively create an ICT based tool and related social processes with a English municipality.
2. The Two Case Studies
WICKED (The Working with Infrastructure Creation of Knowledge and Energy strategy Develop-
ment) investigated clusters of technical, legal, and organisational challenges faced by retail organisa-
tions, including those with smart meters and energy managers (the “data rich”) and those without (the
“data poor”). Findings are drawn from interviews with 33 representatives of 23 different organisa-
tions, including property owners, retailers, letting and property management companies, energy man-
agement companies, law firms and legal experts, and industry intermediaries and associations). This
evidence shows that the “data rich” and “data poor” need different energy management solutions to
maximize their energy efficiency and behavioral opportunities.
“Feedback in energy demand reduction: Examining evidence and exploring opportunities” Edinburgh, July 2016Page 169
In the public sector, Gooddeeds saw a team of academics working with the Energy Services team in
an East Midlands local authority to explore a collaborative approach to energy management via user-
groups and digital tools such as smartphones and social media. A user-group was formed with the in-
tention of ensuring representation of the full range of people involved in energy management – from
ordinary building users, the energy services team, the help desk, engineering and facilities manage-
ment and inclusive of the range of the municipality’s building stock that was also typical of UK non-
domestic buildings. This included a 1920’s office block, a 1970’s office block, a modern leisure centre
and a Victorian library. The purpose was to facilitate interactions and knowledge sharing and co-
develop an App to foster interaction between building users.
The user group was formed with help from the team leader of the Energy Services team who acted as
‘gatekeeper’ to the city council. An email was sent to 16 employees from various locations with a
range of roles and responsibilities. After a couple of attempts to recruit a suitable group a core of eight
was formed. It is worth noting here the difficulties encountered from the start with getting with key
actors within the organisation, for example, representatives of the help desk, facilities manage-
ment/contractors and the engineers being restricted. In part we believe this to be that as this project
began, staff in property services (the directorate in which all of these roles sit) were identified as ‘at
risk’ and began a process of re-organisation and possible staff redundancy.
The tool attempted to go beyond the provision of energy ‘feedback’ to building users and allows them
(expert and non-expert) to feedback into the system rather than simply receive feedback from it (fur-
ther details of the tool are available in Bull et al 2015). Findings from the analysis of a focus group
and semi-structured interviews revealed encouraging signs with regards to increased user-engagement
and digital tools, but challenges with regards to the ‘real world’ implementation of innovative, and
technologically grounded, approaches.
3. Key Findings
Findings across the two separate projects are presented separately below, and then jointly reflected on
in the conclusions. For the WICKED project three areas of variation were observed across the differ-
ent organisations in terms of concern, capacity and conditions. For Gooddeeds a key challenge centred
on competing organisational priorities and this is explored under variation in priorities. These are now
considered in turn.
3.1. Variation in concern
The idea of energy management was not new to any of our interviewees or case studies in WICKED.
However, each of the 6 organizations in our cases engaged in this topic in a different ways. Energy
management can mean many things, and each of our partners participated in a unique subset of the
possible topics that “energy management” denotes. All partners were interested in reducing “out of
hours” energy consumption, looking to minimize energy use in the hours their stores are not in ser-
vice. Beyond this, organizations were (un)concerned about a variety of other energy aspects. For ex-
ample, only one of our four retailers we talked to was interested in engaging their landlords through
the mechanism of green leases. None of the cases were seriously considering rolling out demand re-
sponse strategies, although one interviewee mentioned an early stage pilot project. Across the cases,
we found a number of instances where organizational infrastructures did not necessarily match the
high level concerns. For example, several energy managers expressed frustration with the ways in
which internal accounting mechanisms and pre-set thresholds for capital projects did not allow for
“Feedback in energy demand reduction: Examining evidence and exploring opportunities” Edinburgh, July 2016Page 170
upgrades that would otherwise seem reasonable.
3.2 Variation in capacity
In all cases, energy management is understaffed relative to the scale of the problem. All of the organi-
zations we interviewed, as well as our case studies, showed varying levels of effort devoted to the task
of improving energy management. Most, but not all, of our cases had an energy manager. This energy
manager is typically responsible for overseeing the entire portfolio of stores, which represents hun-
dreds of stores. In case 6, for instance, the staff member responsible for energy is also responsible for
water and waste in over 1000 premises. In all cases, the “energy manager” operated in a “1-to-many”
context, rather than a “1-to-1” relationship, like a store manager. While this slightly distant relation-
ship provides the ability to learn from multiple cases, it does not enhance the ability to understand
what is happening “on the ground”. The energy manager can usually only see what the data tell him or
her. For most cases, however, the energy information stayed with the energy manager. The premises
in case 6, for instance, have “smart” meters but the meters send their data to a central location and are
not pushed back out to the stores.
Even where energy managers are present in an organization, they rely strongly on external expertise
and hire third parties to provide data management, analytics, and display services. These capabilities
are not provided “in house” but instead are provided by consultants who may work entirely off-site or,
in some cases, be embedded within the organization. However, store managers have considerable
power to make independent decisions regarding sales displays and promotions, which includes adding
feature lighting. Although these decisions may impact energy use, the store managers are not required
to notify the energy managers or their team of making such changes. Their goal is to maximize sales,
not minimize energy use. This theme of conflicting priorities re-emerges shortly.
3.3 Variation in conditions
This relates to the physical and technical conditions present in each portfolio, which extends to the
presence and absence of meters and data. A perfect portfolio would have the database envisioned by
the consultant in case 2 above: an accurate and complete accounting of every energy-consuming item
in every store, updated in real time and without flaws, matched perfectly with energy data at sufficient
spatial and temporal resolution to be able to problem-solve deviations. Further, these deviations would
be automatically detected and flagged by smart algorithms, which could learn over time what is and is
not a genuine problem. The ideal database is far from the reality. The norm is energy managers oper-
ating mainly with energy data, set at arm’s length from 100s of stores, often without a complete list of
the building-level data, let along equipment or appliance-level data. In our investigations we found
common problems which include: heterogeneous building stocks; evolving data practices; and some
difficulties in relating the stocks and data to each other, let alone to problem-solving.
3.4 Variation in priorities
These variations across the retail sector provide an insight into the challenges for managers and em-
ployees with regards to energy in the workplace. Organisations are heterogeneous with energy man-
agement competing against a host of organisational priorities and capabilities. As the manager of the
retail companies is role is to maximum sales, not minimise energy use, so in Gooddeeds a similar pic-
ture emerges within the municipality as employees and the energy management team face a challeng-
ing set of issues and competing priorities (see Table 1).
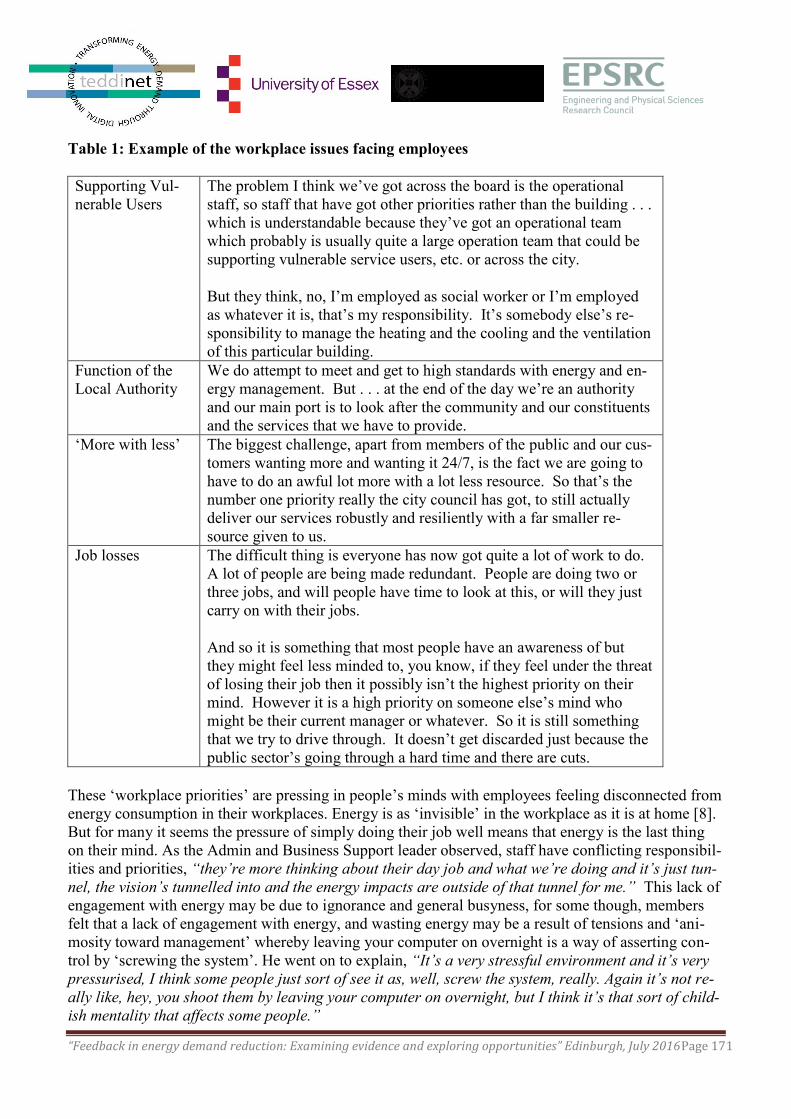
“Feedback in energy demand reduction: Examining evidence and exploring opportunities” Edinburgh, July 2016Page 171
Table 1: Example of the workplace issues facing employees
Supporting Vul-
nerable Users
The problem I think we’ve got across the board is the operational
staff, so staff that have got other priorities rather than the building . . .
which is understandable because they’ve got an operational team
which probably is usually quite a large operation team that could be
supporting vulnerable service users, etc. or across the city.
But they think, no, I’m employed as social worker or I’m employed
as whatever it is, that’s my responsibility. It’s somebody else’s re-
sponsibility to manage the heating and the cooling and the ventilation
of this particular building.
Function of the
Local Authority
We do attempt to meet and get to high standards with energy and en-
ergy management. But . . . at the end of the day we’re an authority
and our main port is to look after the community and our constituents
and the services that we have to provide.
‘More with less’ The biggest challenge, apart from members of the public and our cus-
tomers wanting more and wanting it 24/7, is the fact we are going to
have to do an awful lot more with a lot less resource. So that’s the
number one priority really the city council has got, to still actually
deliver our services robustly and resiliently with a far smaller re-
source given to us.
Job losses The difficult thing is everyone has now got quite a lot of work to do.
A lot of people are being made redundant. People are doing two or
three jobs, and will people have time to look at this, or will they just
carry on with their jobs.
And so it is something that most people have an awareness of but
they might feel less minded to, you know, if they feel under the threat
of losing their job then it possibly isn’t the highest priority on their
mind. However it is a high priority on someone else’s mind who
might be their current manager or whatever. So it is still something
that we try to drive through. It doesn’t get discarded just because the
public sector’s going through a hard time and there are cuts.
These ‘workplace priorities’ are pressing in people’s minds with employees feeling disconnected from
energy consumption in their workplaces. Energy is as ‘invisible’ in the workplace as it is at home [8].
But for many it seems the pressure of simply doing their job well means that energy is the last thing
on their mind. As the Admin and Business Support leader observed, staff have conflicting responsibil-
ities and priorities, “they’re more thinking about their day job and what we’re doing and it’s just tun-
nel, the vision’s tunnelled into and the energy impacts are outside of that tunnel for me.” This lack of
engagement with energy may be due to ignorance and general busyness, for some though, members
felt that a lack of engagement with energy, and wasting energy may be a result of tensions and ‘ani-
mosity toward management’ whereby leaving your computer on overnight is a way of asserting con-
trol by ‘screwing the system’. He went on to explain, “It’s a very stressful environment and it’s very
pressurised, I think some people just sort of see it as, well, screw the system, really. Again it’s not re-
ally like, hey, you shoot them by leaving your computer on overnight, but I think it’s that sort of child-
ish mentality that affects some people.”
“Feedback in energy demand reduction: Examining evidence and exploring opportunities” Edinburgh, July 2016Page 172
4. Conclusions
Relationships can be difficult in any context and not least, in the workplace where myriad priorities
and cultures collide. Four different sets of variations sit across these two organizational sectors yet
these two studies coalesce as they illustrate the challenge of energy efficiency within organisations.
Three broad lessons can be observed from these two projects that can serve as recommendations both
for operational improvements and for the future research agenda in this field. Firstly, the core strategy
of an organisation matters. Thus engagement around energy efficiency needs to happen within, and be
aligned to, existing relationships, roles and teams. Further research is needed into how different inter-
nal organisational cultures frame employee duties, behaviours, and expectations, particularly with re-
gard to data, analytics, and feedback. This also applies to how budgets are managed and financial tar-
gets are set for organisations. If energy efficiency targets are going to compete with core business ac-
tivities and profitability then there will be only one winner. Second, we need to move beyond the
‘them and us’ culture and ‘information-deficit’ approach intrinsic in the narrow interpretation of ener-
gy efficiency as dashboards and feedback. Employee engagement should be framed in a way that
acknowledges the positive contribution they can make to energy efficiency, rather than treating them
as a ‘problem to be solved’ or another management project. Finally, the challenge of organizing and
achieving greater participation in the workplace is ever-present and the technical challenges that exist
for smaller organisations, around both accessing the energy data via metering and makings sense of
the data once its received, should not be dismissed. Relationships take time, trust and technical com-
petency.
References
Andrews, R., and E. Johnson (2016.) Energy use, behavioral change, and business organisations: Re-
cent findings and proposing a future research agenda. Energy Research & Social Science 11, pp. 195-
208.
Arnstein, S. (1969). A ladder of citizen participation. Journal of the American Institute of Planners
35: pp. 216-244.
Bull, R., Lemon, M., Everitt, D., and G. Stuart (2015). Moving beyond feedback: Energy behaviour
and local engagement in the United Kingdom. Energy Research & Social Science 8, pp. 32-40.
Burgess, J., and M. Nye (2008). Re-materialising energy use through transparent monitoring systems.
Energy Policy 36: pp. 4454-4459.
Sovacool, B, (2014). What are we doing here? Analyzing fifteen years of energy scholarship and pro-
posing a social science research agenda. Energy Research & Social Science 1: pp. 1-29.
Staddon, S., Cycil, C., Goulden, M., Leygue, C., and A. Spence (2016). "Intervening to Change Beha-
viour and Save Energy in the Workplace: A Systematic Review of Available Evidence. Energy Re-
search & Social Science, 17, pp. 30-51.
Stern, P., Janda, K., Brown, M., Steg, L., Vine, E., and Lutzenhiser, L. (2016) "Opportunities and in-
sights for reducing fossil fuel consumption by households and organizations." Nature Energy 1:16043.
(2016).

“Feedback in energy demand reduction: Examining evidence and exploring opportunities” Edinburgh, July 2016Page 173
Taylor, M., and K. Janda (2015). New Directions for Energy and Behaviour: Whither Organizational
Research? In Proceedings of ECEEE Summer Study, 1-6 June 2015 (Toulon/Hyères, France). Vol. 9
- Dynamics of Consumption, pp. 2243-2253. European Council for an Energy-Efficient Economy.
“Feedback in energy demand reduction: Examining evidence and exploring opportunities” Edinburgh, July 2016Page 174
SESSION 4B: Linking to Theories & Disciplines
The role of non-numeric feedback in reducing domestic energy consumption: Les-
sons from Freiburg and Besançon
Arian Mahzouni School of Architecture and the Built Environment, Royal Institute of Technology
(KTH), Stockholm ([email protected])
Abstract
This paper combines insights from neo-institutional theory and practice theory to better understand the
elements and dynamics underlying households’ energy-consuming practices in everyday life (e.g.,
cooking, washing, lightning, space heating and cooling, and water heating). By undertaking a compar-
ative case study between the cities of Freiburg (Germany) and Besançon (France), it will provide new
insights into the role of non-numeric energy feedback in reducing energy use at home. The purpose of
this paper is twofold: to contribute to future research in the field of non-numeric energy feedback; and
then recommending policies to turn the energy-consuming practices in a more energy-reducing direc-
tion. The primary results show that non-numeric feedback, mostly in the form of home energy audits
and comparative feedback, provides households with tailored advice on energy-saving options. How-
ever, non-numeric feedback can be more effective once different energy-consuming practices are cat-
egorised in a way to better understand the complexity of the phenomenon of household energy con-
sumption.
1. Introduction
European countries have designed and implemented a wide range of pathways and incentives to re-
duce households’ energy consumption. However, along any pathway, it is important to investigate
how far the individual efforts are converted into collective action. Many studies show the importance
of interventions to change the technical and physical factors such as introducing retrofit practices to
improve the energy performance of building envelops or assisting households in acquiring more ener-
gy-efficient appliances. However, soft factors such as occupant behaviour related to energy-
consuming practices have not been adequately examined despite their potential role in influencing the
energy use at home (cf. Abrahamse et al., 2005, p. 282; Steemers & Yun, 2009, p. 633; Allcott &
Mullainathan, 2010, p. 1204; Burger et al., 2015, p. 12).
Energy feedback has recently draw large attention for its potential in providing relevant information
on energy consumption to end users (cf. Darby, 2008; Gupta & Chandiwala, 2010; van Dam et al.,
2010), which includes two major types: numeric (e.g., utility bills, smart metering, in-home-displays)
and non-numeric (e.g., advice from friends, relatives and home audits). The latter has not been sys-
tematically examined in the literature and remains relatively unknown to the policymakers. Therefore,
this paper will develop an analytical framework based on the four elements of energy-consuming
practices (embodied habits, engagements, technologies, and institutionalised knowledge) discussed by
“Feedback in energy demand reduction: Examining evidence and exploring opportunities” Edinburgh, July 2016Page 175
Gram-hanssen (2014) to better understand the role of non-numeric energy feedback in reducing
household energy consumption. It will draw on the experiences from the cities of Freiburg and Besan-
çon. These cities have implemented a wide range of policy instruments to reduce the households’ en-
ergy use, as a key strategy to realize their ambitious climate and energy targets. The following ques-
tions have been addressed throughout this on-going study:
If and how non-numeric feedback mechanisms can increase awareness and knowledge of house-
hold’s energy consumption, and encourage people to make a commitment to saving energy at
home;
What would be the contribution of the neo-institutional theory and practice theory in understand-
ing and supporting non-numeric energy-feedback mechanisms to change energy consumption be-
haviour at home;
How far non-numeric feedback, usually shaped by cultural-cognitive element of institutions, could
be extended to and applied in a variety of different contexts.
2. Rationale
Energy feedback can provide valuable information for policy interventions aimed at changing energy-
consuming practices at home. However, as highlighted by Martiskainen (2007:23), any measure to
change the household’s energy consumption behaviour should preferably consider both internal fac-
tors (individual with their attitudes, values and lifestyles) and external factors (planning policy frame-
work, fiscal and regulatory incentives, and social constraints). Weber (1997, p. 835) emphasizes the
social factors by claiming that “Energy consumption belongs to the realm of technology, energy con-
servation to the realm of society”. It is therefore necessary to study the patterns of energy-consuming
practices beyond the household level and in a larger social and institutional context. Here, I discuss
the neo-institutional theory to define ‘institutions’ and then practice theory to define ‘practices’.
According to Scott (2008, p. 48) ‘institutions’ are “comprised of regulative, normative and cultural-
cognitive elements that, together with associated activities and resources, provide stability and mean-
ing to social life.” The three analytical elements of institutions shape and are shaped by the existing
social order “in interdependent and mutually reinforcing ways” (Scott, 2008, p. 50). However, the
normative and cultural-cognitive institutions (values, habits), in contrast to regulative institutions (pol-
icies, laws and regulations), are deeply embedded in our culture and therefore involve a measure of
‘self-evaluation’ and ‘self-enforcing’.
In this paper, the energy-consuming practices, which are profoundly anchored in our culture, are iden-
tified as cultural-cognitive institutions; the energy efficiency standards and policies introduced by
government, as regulative institutions; and the energy efficiency standards exercised by housing in-
dustry to build their own energy efficiency norms, as normative institutions. Depending on territorial-
ly-bounded factors (e.g., planning policy framework and actor constellation), these elements interact
with each other in a particular way to maintain or change the existing energy-consuming practices. For
instance, in the UK, as suggested by Adams (2004, p. 605) “politicians have placed too much reliance
on market mechanisms and information campaigns to change prevalent attitudes and behaviour and
not enough on direct and effective regulation. For example, although the Building Regulations were
apparently tightened in 1990 to promote greater energy efficiency, builders were allowed to offset im
“Feedback in energy demand reduction: Examining evidence and exploring opportunities” Edinburgh, July 2016Page 176
provements in one area against another, so making it possible for the thermal efficiency of walls to be
decreased if double glazing were introduced”. In this case, the building industry attempts to create its
own energy efficiency standards and norms relatively different from the one introduced by govern-
ment. The reason for using this type of ‘business as usual ‘practices’ in the building industry as high-
lighted by Mahzouni (2015, p. 288) might be that ”long periods of increasing returns in existing tech-
nological systems and the institutions that have supported them have created different types of ‘lock-
ins’” and pace dependency.
The recently developed practice theory (cf. Shove & Walker, 2010; Karvonen, 2013;Gram-hanssen,
2014) provides a comprehensive insight into the elements of households’ energy-consuming practices.
Lounsbury & Crumley (2007, p.995) define ‘practices’ as “activity patterns across actors that are in-
fused with broader meaning and provide tools for ordering social life and activity”. So, in contrast to
behavioural approach, which claims that practices are determined by individuals’ norms, perceptions
and attitudes, the focus of the practice theory is on ‘collective structures of practices’. Furthermore,
the core message of the practice theory is that households do not consume energy by itself, they rather
carry out indoor practices related to different daily activities (such as food conversation, cooking,
washing, socializing and relaxing) that require energy consumption (see also Lorek & Vergragt, 2015,
p. 26). Gram-hanssen (2014, p. 94) argues that households’ energy consumption is largely guided by
four interrelated elements that hold practices together: embodied habits; engagements; technologies;
and institutionalised knowledge, each discussed in detail in the following.
Embodied habits are routinized, taken-for-granted and unconscious practices, which are part of eve-
ryday habits of the households. As part of cultural-cognitive elements of institutions, they usually date
back to childhood and are shaped by family upbringing, which could explain the huge variations in
energy consumption among households. We often perform these practices unconsciously, for exam-
ple, all the small activities we do every morning when we wake up such as turning the light on, put-
ting the coffee on, etc. These practices impose huge variations among households, depending on a
wide range of socio-economic and demographic factors. For instance, high electricity consumption in
a certain household may relate to very different practices such as extensive washing, cooking, and
computer & entertainment activities or might depends on the type and amount of cold appliances and
food practices of the households. In order to better understand these variations, we need to get more
insight into the energy-consuming practices the households perform in their everyday life.
Engagements, which explain the reason for performing a certain practice, are mostly not related to
energy, as mentioned earlier. When we are turning on TV our intention is not to consume energy but
to watch a TV program. Our intention to perform energy-consuming practices (e.g., cooking, washing
and keeping a nice indoor climate) at home could be influenced by cultural-cognitive institutions (life-
style, attitudes, expectations and preferences). Practices could be collectively shaped, where people
try to create a social identity and distinct themselves from other groups.
Technologies, which are designed to improve the energy performance of building envelops, can sup-
port sustainable occupant practices e.g., by constructing low-energy buildings and retrofitting existing
houses, or by acquiring new energy-efficient appliances (such as microwave ovens and electric cook-
ers) that influence the way of conserving and preparing food relative to previous times.
“Feedback in energy demand reduction: Examining evidence and exploring opportunities” Edinburgh, July 2016Page 177
Institutionalised knowledge: The energy-consuming practices could be influenced by various inter-
ventions to increase the households’ knowledge on energy-saving options, e.g.,:
Mass media campaigns, in which households usually receive overload of general information that
may not properly apply to their situation;
Home audits, where households receive only relevant information and are offered energy-saving
options based on their real energy consumption (Abrahamse et al., 2005, p. 277);
Comparative feedback, the recent studies (cf. Dixon et al., 2014, p. 1; Allcott, 2011, p. 1084;
Cabinet Offiice, 2011, p. 18; Abrahamse et al., 2005, p. 279) show that providing households with
feedback about their energy consumption levels, in comparison with the performance of other
households in similar settings, can be a successful intervention to reducing household energy con-
sumption. In comparative feedback, a feeling of competition, social comparison, and group pres-
sure can be stimulated, where households feel socially and morally obliged to contribute to public
goods such as reduced greenhouse gas emissions.
To sum up, the policy interventions are identified as regulative elements of institutions that can pro-
vide households with necessary knowledge and feedback to reduce their energy use at home e.g., by
introducing energy efficiency rating systems for appliances and buildings, and by the advice from en-
ergy advisors and craftsmen on how to alter practices and use technologies to achieve energy-saving.
As a result, new practice can gradually become routinized and taken-for-granted, replacing the old
one. The neo-institutionalism could help to better understand the institutionalization and diffusion
process of new practices. Lounsbury & Crumley (2007, p.993) claims that “new practices become es-
tablished via legitimacy and diffusion”.
3. Methodology
This paper applies a comparative case study (cf. Yin, 2009, 2003; Merriam, 2009), which involves the
analysis and synthesis of key patterns of households’ energy consuming practices across two cities of
Freiburg and Besançon. It addresses the intervention policies that have been introduced to alter the
households’ energy consuming practices. It will, in particular, discuss if and how these cities have
applied energy feedback in their interventions by looking at the program “200 Familien aktiv fürs
Klima” in Freiburg and “Familles actives pour le climat” in Besançon. These programs (regulative
institutions) have been designed and implemented to address and change the energy-consuming prac-
tices (cultural-cognitive institutions) at home.
The empirical work is conducted in two stages. An extensive desk study will be carried out to map
various activities and programmes that have been implemented in both cities aimed at raising aware-
ness and knowledge of households on energy use. It will, in particular, discuss the outcome (the pos-
sibilities and obstacles) of using the ‘comparative feedback’, as a way to facilitate social learning for
reducing energy use. In the second stage, the results from the desk study will be cross-checked by
conducing semi-structured interviews with involved households and with key actors at neighbourhood
and city levels. The aim is to obtain detailed data on practices behind households’ energy consump-
tion, and thus proposing ways for turning these practices in a more sustainable direction. In so doing,
interviews will be designed to obtain information about routines, engagements, technologies, and
knowledge related to each practice. This can be quite comprehensive, as energy is used in relation to
many different practices to provide energy services at home (e.g., lightning, washing, cooking, space
“Feedback in energy demand reduction: Examining evidence and exploring opportunities” Edinburgh, July 2016Page 178
heating and cooling and water heating). Therefore, this study will focus only on space heating practic-
es.
4. Primary findings
Both cities of Freiburg and Besançon have carried out a wide range of information campaigns to in-
fluence the energy-consuming practices at home. In 2009, the City of Besançon launched the “cli-
mate-active families” initiative aimed at actions and tools to reduce the energy consumption at home
by 15%. Through home audits, workshops, knowledge sharing, and meeting with other families, the
families (Initially 170) have tried to exchange practical experience on energy-efficient choices and
reduce their energy bills without giving up the home comfort (Ville de Besançon, 2016)18
.
The initiative by the City of Besançon has been a success story, from which the City of Freiburg in
2011started to draw many lessons in the framework of its partnership with the City of Besançon. The
involved households in the project “200 climate-active families” have been able to overview their life-
styles and consumption habits in everyday life. The aim has been to create a feedback mechanism for
sharing knowledge and experiences with the partners cities of Besançon and Padua on more efficient
use of resources (City of Freiburg, 2014, p. 8)19
. As part of this initiative, the City of Freiburg initiat-
ed the program ‘Zuhause A+++’, in which all households can receive free energy-saving home audits
and advice on how to make their home and lifestyle more energy efficient. The program, which will
be run until October 2016, provides households with personalized and tailored information combined
with rewards (such as a free LED lamp). Two weeks after home audit, a home energy report is sent to
the investigated household, which includes key results and recommendations to reduce their energy
use.
5. Conclusions
The aim of this paper is to investigate the often under-emphasised non-numeric energy feedback that
may contribute to energy efficiency at home and help policymakers in designing and implementing
effective household energy reduction policies. It examines the possibility to combine neo-institutional
theory and practice theory in searching for ideas that have large effects on reducing energy use at
home.
The initial results from this study prove the potential importance of regulative institutions (in form of
policy interventions) for energy efficiency. It is suggested that cultural-cognitive institutions, which
shape energy-consuming practices, should be targeted more systematically. However, energy-
consuming practices are highly influenced by both personal and social values, and therefore the poten-
tial role of non-numeric feedback to better address and alter these practices remains a challenge. Nev-
ertheless, to better understand the complex phenomenon of household energy consumption each inter-
vention should focus on a certain practice or a group of interrelated practices. For instance, practices
behind space heating could be very different from practices behind using electrical appliances for
washing, cooking, lightning, and entertaining. The energy-consuming practices should be categorised
18
In addition, the program encouraged a reduction of travel-related energy use, water use and waste production, which is
beyond the scope of this study.
19 For the scope of this study, Padua is excluded from this analysis.
“Feedback in energy demand reduction: Examining evidence and exploring opportunities” Edinburgh, July 2016Page 179
in a way to increase our understanding about the complexity of the phenomenon, and thus gaining
synergies in designing and implementing interventions.
References
Abrahamse, W., Steg, L., Vlek, C., & Rothengatter, T. (2005). A review of intervention studies aimed
at household energy conservation. Journal of Environmental Psychology, 25(3), 273–291.
doi:10.1016/j.jenvp.2005.08.002
Adams, D. (2004). The changing regulatory environment for speculative housebuilding and the
construction of core competencies for brownfield development. Environment and Planning A,
36, 601–624. doi:10.1068/a3557
Allcott, H. (2011). Social norms and energy conservation. Journal of Public Economics, 95(2011),
1082–1095. doi:10.1016/j.jpubeco.2011.03.003
Allcott, H., & Mullainathan, S. (2010). Behavior and Energy Policy. Science, 327(5970), 1204 –1205.
doi:10.1126/science.1180775
Burger, P., Bezençon, V., Bornemann, B., Brosch, T., Carabias-Hütter, V., Farsi, M., … Volland, B.
(2015). Advances in understanding energy consumption behavior and the governance of its
change – outline of an integrated framework. Frontiers in Energy Research, 3:29.
doi:10.3389/fenrg.2015.00029
Cabinet Office. (2011). Behaviour Change and Energy Use. Cabinet Office Behavioural Insights
Team, the UK government, London, July 2011.
City of Freiburg. (2014). Freiburg Green City: Approaches to sustainability. International Affairs
Division, Green City Office, City of Freiburg im Breisgau.
Darby, S. (2008). Energy feedback in buildings: improving the infrastructure for demand reduction.
Building Research & Information, 36(5), 499–508. doi:10.1080/09613210802028428
Dixon, G. N., Deline, M. B., McComas, K., Chambliss, L., & Hoffmann, M. (2014). Using
Comparative Feedback to Influence Workplace Energy Conservation: A Case Study of a
University Campaign. Environment and Behavior, 1–27. doi:10.1177/0013916513520417
Gram-hanssen, K. (2014). New needs for better understanding of household’s energy consumption –
behaviour, lifestyle or practices? Architectural Engineering and Design Management, 10(1-2),
91–107. doi:10.1080/17452007.2013.837251
Gupta, R., & Chandiwala, S. (2010). Understanding occupants: feedback techniques for large-scale
low-carbon domestic refurbishments. Building Research & Information, 38(5), 530–548.
doi:10.1080/09613218.2010.495216
Karvonen, A. (2013). Towards systemic domestic retrofit: a social practices approach. Building
Research & Information, 41(5), 563–574. doi:10.1080/09613218.2013.805298
Lorek, S., & Vergragt, P. J. (2015). Sustainable consumption as a systemic challenge : inter- and
transdisciplinary research and research questions. In Lucia A. Reisch and John Thøgersen (Ed.),
Handbook of Research on Sustainable Consumption (pp. 19–32). Cheltenham: Edward Elgar
Publishing.
Lounsbury, M., & Crumley, E. T. (2007). New Practice Creation: An Institutional Perspective on
Innovation. Organization Studies, 28(7), 993–1012. doi:10.1177/0170840607078111
“Feedback in energy demand reduction: Examining evidence and exploring opportunities” Edinburgh, July 2016Page 180
Mahzouni, A. (2015). The “Policy Mix” for Sustainable Urban Transition: The city district of
Hammarby Sjöstad in Stockholm. Environmental Policy and Governance, 25(4), 288–302.
doi:10.1002/eet.1688
Martiskainen, M. (2007). Affecting consumer behaviour on energy demand. Final report to EdF
Energy March 2007, Science and Technology Policy Research, University of Sussex.
Merriam, S. B. (2009). Qualitative research: A guide to design and implementation. San Francisco:
John Wiley and Sons.
Scott, W. R. (2008). Institutions and Organizations: Ideas and Interests. (3rd ed.) Los Angeles: Sage
Publications.
Shove, E., & Walker, G. (2010). Governing transitions in the sustainability of everyday life. Research
Policy, 39(2010), 471–476. doi:10.1016/j.respol.2010.01.019
Steemers, K., & Yun, G. Y. (2009). Household energy consumption: a study of the role of occupants.
Building Research & Information, 37(5-6), 625–637. doi:10.1080/09613210903186661
Van Dam, S. S., Bakker, C. a., & van Hal, J. D. M. (2010). Home energy monitors: impact over the
medium-term. Building Research & Information, 38(5), 458–469.
doi:10.1080/09613218.2010.494832
Weber, L. (1997). Some reflections on barriers to the efficient use of energy. Energy Policy, 25(10),
833–835. doi:10.1016/S0301-4215(97)00084-0
Ville de Besançon. (2016). Familles Actives pour le Climat. Retrieved June 10, 2016, from
http://www.besancon.fr/index.php?p=1722
Yin, R. K. (2003). Case study research: Design and methods. 3th ed. Thousand Oaks: Sage
Publications.
Yin, R. K. (2009). Case Study Research: Design and Methods. 4th ed. Thousand Oaks: Sage
Publications.
“Feedback in energy demand reduction: Examining evidence and exploring opportunities” Edinburgh, July 2016Page 181
Constructing policy feedback on energy feedback: when is feedback ‘working’?
Rosalyn A.V. Robison1 *
, Chris Foulds1
1 Global Sustainability Institute, Anglia Ruskin University, UK
*presenting author: [email protected],
Abstract
In light of the finite nature of fossil fuel resources, and environmental impacts including climate
change, energy feedback tools are now commonly used to promote energy saving. We argue that there
are significant similarities between the assumptions underlying the widespread provision of explicit
forms of energy feedback and the increasing invocation of the importance of ‘Evidence-Based Policy’
(EBP). These similarities raise questions about what exactly constitutes ‘strong(er)’ evidence, and
how users, researchers and policymakers go about determining what ‘works’. Building on an exten-
sive, mixed-methods dataset relating to the iMeasure online energy feedback case study (including
user feedback profiles, survey responses, interview, netnography) together with an in-depth review of
policy literature, our aims in this work are to illustrate and explore the (multiple) measures by which
we might assess one energy feedback tool as ‘successful’; and the implications the use of these differ-
ent measures may carry for the future direction of the policy programmes they are part of.
1. Introduction
Energy feedback tools exist in a variety of shapes, sizes and forms, and the number of different varia-
tions continue to increase as companies and researchers develop their understanding of the field. En-
ergy feedback initiatives could encompass energy labels, energy bills and personal notetaking, as well
as digital tools including In Home Displays (IHDs) and web-based applications. In the current paper
we are developing (the subject of this extended abstract and talk), we argue that there are significant
similarities between the assumptions underlying the widespread provision of explicit forms of energy
feedback and those of ‘Evidence-Based Policy’ (EBP), namely relating to the ways in which data or
‘evidence’ are expected to influence future actions. These shared assumptions also raise interesting
questions about what constitutes evidence in the first place, how an initiative may be assessed as
‘working’ or not, and how something could be deemed to be a ‘success’. These ideas are recurrent
themes throughout this extended abstract and, as such, are revisited in more depth in the following
paragraphs.
There has been much research on whether, and how much, different forms of feedback reduce usage
(for a brief overview, see for example Buchanan et al, 2015). However, some users actively use feed-
back for other purposes, such as energy ‘monitoring’ (understanding usage patterns better), in order to
e.g. better negotiate with suppliers, or simply due to an enjoyment of ‘data’. These wider aims there-
fore may not have an explicit energy reduction aim at all, as discussed further in Foulds et al (in re-
view). This thereby challenges the dominant discourse that feedback is solely a means to one end (re-
ducing consumption); in fact a range of measures exist against which feedback provision may be as-
sessed as ‘successful’. Furthermore, evaluation criteria of current smart meter rollouts20
will play a
critical role in shaping what they achieve since the assessment of success “actively constructs the
20
For example: “the EU aims to replace at least 80% of electricity meters with smart meters by 2020 wherever it is cost-
effective to do so” https://ec.europa.eu/energy/en/topics/markets-and-consumers/smart-grids-and-meters
“Feedback in energy demand reduction: Examining evidence and exploring opportunities” Edinburgh, July 2016Page 182
contexts in which it operates” (Power, 1994; p7). That is, what gets measured and indeed the process
of that measurement, then focuses one’s subsequent actions in particular ways.
‘Evidence-Based Policy’ has been increasingly emphasised by politicians, and policy workers since at
least the late 1990s. David Blunkett, in a speech to the ESRC on 2 Feb 2002 declared: “This Govern-
ment has given a clear commitment that we will be guided not by dogma but by an open-minded ap-
proach to understanding what works and why” (emphasis added). Indeed, “using evidence as the basis
for formulating public policy appears so uncontroversial as to be almost impossible to oppose”
(Pearce et al, 2014; p161), and it is thereby unsurprising that the UK government is also currently in-
vesting heavily in ‘What Works Centres’21
. Although there is recognition of the possibility that evi-
dence may be moulded or selected to fit policy preferences (“Policy-Based Evidence”, EBP’s ‘evil
twin’ according to Pearce et al., 2014), often this is interpreted as a shortcoming of the individuals in-
volved, rather than (perhaps inevitably) bound up with the fundamental assumptions regarding the na-
ture of ‘objective’ evidence. In addition, EBP prefers quantitative ‘evidence’ since: “the managerial
side of policy making emphasizes that “only what can be measured, can be managed.” (Nowotny,
2007; p479). However in reality a wide range of qualitative measures may also be significant, and ne-
glecting these is likely to preference certain outcomes of feedback provision over others.
In fact, EBP is itself a form of feedback. Both EBP and energy feedback aimed at energy reduction
assume that feeding back (usually quantitative) information on past performance will shape future ac-
tions. Indeed the same rhetoric can be used for both: if only it were possible to find the ‘right’ type of
information to provide to policymakers/feedback users, they could make the ‘right’ decisions. Or, put
another way, data can be converted into ‘evidence’ which leads to a more informed user/policymaker,
which leads to a better decision.
Thus, the respective energy feedback and EBP ‘projects’ both depend on very similar assumptions,
and indeed each feeds into the other. An illustration of this is how, during the smart meter rollout, pol-
icy feedback on energy feedback will be used to inform the future direction of that same policy. As
proposed by the UK’s Department of Energy and Climate Change (DECC, 2012; p4) “monitoring and
evaluation of the smart meter roll-out will provide an essential feedback loop to inform decisions by
Government … on smart metering implementation”. In reflecting upon this, we argue that it is thus
increasingly important to unpack what exactly constitutes ‘strong(er)’ evidence, which would include
considering how users, researchers and policymakers go about determining what ‘works’.
As far as we are aware, no research has been undertaken that has brought these two different research
agendas together. We see significant value in this bridging in order to further ‘open up’ the policy
agenda around energy feedback. Acknowledging that ‘objective’ policy evaluation of energy feedback
programme is impossible, questions that might be asked about the current explicit energy feedback
programmes in the context of evidence-based policy literature include: what trade-offs may be hidden
through the use of particular ‘success’ criteria? How can transparency in one area mask effects in an-
other? Exploring these questions may help us both better understand how political contexts shape in-
terpretations of evidence (Muller, 2016) – specifically relating to future energy feedback ‘evidence’
produced by the research community – and indeed how feedback used to inform policy (such as eval-
uation metrics) can shape that political context itself (Pierson, 1993).
21
https://www.gov.uk/guidance/what-works-network
“Feedback in energy demand reduction: Examining evidence and exploring opportunities” Edinburgh, July 2016Page 183
Finally, we note as an aside that there are numerous important implicit forms of feedback, including
sensory feedback e.g. lights being on, thermal comfort (Strengers, 2013; Foulds et al, 2014). In this
work however, our interest is in the parallels and interplays between energy feedback and policy de-
velopment, and we focus therefore on the explicit forms of energy feedback commonly advocated by
policymakers, such as those accompanying smart meter rollout across Europe (Giordano et al, 2011).
2. Research aims
Given these pertinent issues, the aims of this paper-in-progress, are:
(1) to investigate the measures by which we might assess one energy feedback tool as ‘work-
ing’ or ‘successful’; and
(2) to explore the implications that the use of these different measures carry for the future di-
rection(s) that such tools might take, especially with regard to the policy programmes they are (or may
be) part of.
In furthering these aims we will explore current constructions of evaluative evidence on energy feed-
back initiatives more widely, and also how the traditions of the energy feedback community itself (e.g.
what counts as ‘good’ knowledge and metrics) can funnel researchers and designers in particular di-
rections.
3. Data
Our paper will build on two distinct datasets and streams of analysis. These are (1) a review of the
policy literature (particular to do with policy evaluations) regarding energy feedback programmes; and
(2) experimentation with a novel (energy feedback) empirical dataset to demonstrate the multiple
meanings of what exactly constitutes success.
Our work to date has been concentrated in (2), and we do not believe a similar interpretation has been
undertaken before. This work builds on data relating to an established online energy feedback tool -
iMeasure.org22
. One of the founding objectives of iMeasure was to progress feedback research, and its
setup was accompanied by a review of existing online carbon feedback tools (Bottrill, 2007) thus
providing an explicit point at which the positioning of the tool was considered.
Our wider research project concerning this case study has produced a significant amount of different
data. These include: an extensive longitudinal dataset (several years’ worth of data from 2007 on-
wards for several hundred users); a survey of 571 users; 10 iMeasure user interviews plus 1 founder
interview; and extensive netnography of forums, social media and general online presences of the tool.
Each of these datasets construct different sorts of ‘realities’ that essentially tell different stories of
what the energy feedback tool and how it is experienced in various ways – which thereby provides us
with a good foundation for contrast and comparisons in the context of what could be seen to be ‘work-
ing’.
Through these data (and case study), we will we illustrate our previous arguments, looking at the mul-
tiplicity of:
22
Now part of Pilio: http://www.piliogroup.com/
“Feedback in energy demand reduction: Examining evidence and exploring opportunities” Edinburgh, July 2016Page 184
aims (implicit/explicit; of different actors);
impacts (savings achieved; user numbers/diversity; user/developer satisfaction; data quality);
temporalities (energy reduction timescales; rebound/trickle effects; frequency of use; tool lon-
gevity);
and implications for feedback policy, design and research.
(This is of course an indicative, rather than exhaustive, list.)
4. Final thoughts
In the conclusions of this future paper, we intend to draw out policy implications, for example in rela-
tion to the evaluation of the success(es) of the (In-Home Display element of the) current smart meter
roll-out, as well as for the design and delivery of energy feedback initiatives themselves. We also hope
to raise useful reflections on how the energy feedback research communities themselves construct our
evidence, which may be of use as researchers design and interpret their own studies. There are also
implications, in terms of potential messages which may be drawn, for how the vast amount of smart
meter data that is now beginning to be collected, stored (in the UK, via Data & Communications
Companies, and the government’s National Energy Efficiency Data-Framework respectively) is ulti-
mately evaluated. Many different constructions of the same data will be enabled. And perhaps we
should embrace this, rather than strive for one identifiable and agreed conclusion.
References
Ayres, I., Raseman, S., & Shih, A. (2012). Evidence from two large field experiments that peer
comparison feedback can reduce residential energy usage. Journal of Law, Economics, and Organiza-
tion.
Blunkett, D. (2002), ‘Influence or irrelevance: can social science improve government’.
Speech to the Economic and Social Research Council, 2 February.
Bottrill, C. (2007). Internet-based carbon tools for behaviour change. University of Oxford En-
vironmental Change Institute, Oxford (available online at
http://www.eci.ox.ac.uk/research/energy/downloads/botrill07-calculators.pdf).
Buchanan, K., Russo, R., & Anderson, B. (2015). The question of energy reduction: The prob-
lem (s) with feedback. Energy Policy, 77, 89-96.
DECC (2012). Smart Meters Programme: Government Response to consultation on infor-
mation requirements for Monitoring and Evaluation.
Foulds, C., Robison, R.A.V. & Macrorie, R. (in review) Energy monitoring as a practice: In-
vestigating use of the iMeasure online energy feedback tool
Foulds, C., Royston, S., Buchanan, K & Hargreaves, T. (2014) The many faces of feedback:
Beyond the kWh. In: Foulds, C. and Jensen, C.L. (Eds.) Practices, the Built Environment and Sus-
tainability – A Thinking Note Collection. Cambridge, Copenhagen, London: GSI, DIST, BSA CCSG.
pp.19-21.
Giordano, V., Gangale, F., Fulli, G., Jiménez, M. S., Onyeji, I., Colta, A., ... & Maschio, I.
(2011). Smart Grid projects in Europe: lessons learned and current developments. JRC Reference Re-
ports, Publications Office of the European Union.
Müller, B. (2016). Policy gaps: future challenges for research. Building Research & Infor-
mation, 44(3), 338-341.
Nowotny, H. (2007). How many policy rooms are there? Evidence-based and other kinds of
science policies. Science, Technology & Human Values, 32(4), 479-490.

“Feedback in energy demand reduction: Examining evidence and exploring opportunities” Edinburgh, July 2016Page 185
Pearce, W., Wesselink, A., & Colebatch, H. K. (2014). Evidence and meaning in policy mak-
ing. Evidence & Policy, 10(2).
Pierson, P., 1993. When effect becomes cause: Policy feedback and political change. Cam-
bridge: Cambridge University Press.
Power, M. (1994). The audit explosion (No. 7). Demos.(pp 6-8).
Strengers, Y. (2013) Smart energy technologies in everyday life: Smart utopia? Basingstoke:
Palgrave Macmillan.
“Feedback in energy demand reduction: Examining evidence and exploring opportunities” Edinburgh, July 2016Page 186
Energy feedback: Place, Policy and Mobility
Authors: Dr Heather Lovell, School of Social Sciences, University of Tasmania, Austral-
ia/School of GeoSciences, University of Edinburgh, UK, [email protected]; Dr
Gareth Powells, School of Geography, Politics and Sociology, Newcastle University, UK,
Abstract
In this paper we examine the providers of energy feedback and those involved in its governance. We
draw on theories of policy and knowledge mobility to conceptualise our findings, and explore the
ways in which energy feedback has been framed, drawing on empirical material from the UK and
Australia. A key finding from our initial empirical research in both countries is that energy feedback is
seen as being able to do a great deal of (often new) work. In other words, energy feedback provides a
policy solution to a host of policy problems, including climate change, fuel poverty, poor energy mar-
ket function and limited customer engagement. Second, we analyse the mobility of knowledge gener-
ated from three large energy feedback trials, namely Smart Grid Smart City (Australia), the Customer
Led Network Revolution, and the Energy Demand Reduction Project (both UK). We explore the
careful positioning of these trials as having domestic and international applicability, and begin to con-
sider the extent to which they have met these ambitions.
Introduction
The main aims of this paper are twofold: first, to explore the ways in which energy feedback has been
framed by those organisations involved in its governance; and, second, to examine the international
mobility of energy feedback information, knowledge and learning from three energy feedback trials in
the UK and Australia. We are interested in establishing the work that energy feedback is conceptual-
ised as doing, i.e. how it is being positioned as the means of solving a host of (often intractable,
longstanding) policy problems, from fuel poverty to electricity sector modernisation. Further, the pa-
per provides a preliminary investigation of how three large energy feedback trials have been posi-
tioned as having a global audience and reach, i.e. producing generalised learning or placeless
knowledge, and the degree to which they have been successful in achieving this objective. This draft
paper reflects work in progress, and feedback and comments are welcomed.
In our analysis we draw on the concepts of knowledge and policy mobility to better understand the
framing and mobility/immobility of energy feedback research. Policy mobility is a relatively new area
of scholarship with interdisciplinary origins in political science (policy transfer, lesson drawing), eco-
nomic geography, and science and technology studies. It is defined as "... a conceptualisation of policy
making as a global-relational, social and spatial process which interconnects and constitutes actors,
institutions and territories." (McCann and Ward, 2012: 328). Connected to this through the wider
‘mobilities turn’ in social science (Sheller and Urry, 2006) is the notion of knowledge mobility,
which theorizes knowledge as flowing between urban nodes unencumbered by national borders, and
as an integral part of both urban governance and urban economy.
“Feedback in energy demand reduction: Examining evidence and exploring opportunities” Edinburgh, July 2016Page 187
The focus of this paper is on the governance of energy feedback, and is thus distinctive to the majority
of domestic energy feedback studies that have tended to concentrate on householders (albeit with
some important exceptions, see for example Bulkeley et al., 2016). In contemporary highly liberalised
and privatised energy infrastructure systems a number of organisations are central to governing energy
feedback. It is a collaborative governance policy area, with private sector utilities, government, regu-
lators, advocacy organisations and community groups all involved.
The paper is based on primary empirical research underway by the authors in Australia and the UK,
funded by the Australian Research Council (Lovell) and the UK’s energy retailer, Ofgem, through its
Low Carbon Networks Fund (Powells). The Australian case study is Smart Grid Smart City, a large-
scale Australian federal government-funded program of smart grid and household energy efficiency
trials, partnered with industry, which ran from 2010 to 2014 in the state of New South Wales, Austral-
ia. The UK cases are the Customer Led Network Revolution (CLNR) project and the Energy Demand
Research Project (EDRP): large multi-faceted projects which included studies of energy feedback in a
number of empirical settings across the UK.
The paper is organized into three parts. We begin by briefly introducing the literature on policy and
knowledge mobilities. Second, we review energy feedback research and summarise findings of pre-
liminary analysis on the policy framing of energy feedback in the UK and Australia. We then consider
the ways in which new knowledge about energy feedback is being positioned geographically, drawing
on our three case studies.
Conceptualising energy feedback through the lens of policy and knowledge mobility
In recent years scholarship on both policy and knowledge mobility has flourished. These emerging
fields of research are part of the relatively recent ‘mobilities turn’ in social sciences that theorizes con-
temporary life as generative of movement in all manner of ways (Hannam et al., 2006; Sheller and
Urry, 2006; Urry, 2004). A key feature of the world theorized as mobile are relays of knowledge, ide-
as, practices and norms between nodes in a topological rather than territorial world. The significance
of this is that it suggests that knowledge generated in such a world is ‘born mobile’; if it is recognized
and valued it will move, or rather it will be distributed, to other nodes – other places. What we are in-
terested to explore here is the geography of these mobilities of energy feedback knowledge and poli-
cies. In particular, we are attentive to urban-global mobilities as well as the effects of territorial and
economic geographies of boundaries and borders.
The concept of policy mobility has been developed over the last decade in an effort to capture empiri-
cal observations about the contemporary international movement of policy (Ward 2006; Peck 2011;
McCann 2011). A number of ideas have been proposed by policy mobility scholars, building on exist-
ing scholarship in political science (on policy transfer and diffusion, see for example Dolowitz and
Marsh, 1996; Walker, 1969), economic geography (on globalisation and neoliberalism, see for
example Jessop, 2003; Peck, 2002), and science and technology studies (see for example Jacobs,
2012). First, that policy ideas and programs appear to be circulating with greater ease and increasing
in scope and scale – a phenomenon linked to wider processes of globalisation - and termed ‘fast poli-
cy’. The notion of ‘fast policy’ conveys the increasing time pressure under which policy decisions are
having to be made (Peck 2011). Second, policy mobility scholarship is attentive to the materiality of
policy, that is the objects and things that constitute policies, exploring how they are an integral part of
“Feedback in energy demand reduction: Examining evidence and exploring opportunities” Edinburgh, July 2016Page 188
the policy making process (Peck and Theodore 2015). The heterogeneous networks comprising people
and technologies that comprise policy are termed assemblages, defined by policy mobility scholars as
“… a purposive gathering of people, institutional capacities, expertise, models, techniques and tech-
nologies, political sustenance, etc. from local sources and, crucially, from elsewhere.” (McCann
2011b, p. 144). Third, policy mobility scholars have documented the ways in which policy is increas-
ingly being made beyond the formal, official government venues concentrated on in studies of policy
transfer and diffusion within political science scholarship - with non-state actors such as multi-
national companies and consultants identified as crucial (McCann 2011a; McCann and Ward 2012;
Prince 2012), particularly in highly technical areas of new policy development (Larner and Laurie
2010).
With regard to the related but distinct subset of scholarship on knowledge mobilities, it is worth not-
ing that economic geographers have long studied flows of knowledge in a largely sub-disciplinary ex-
amination of innovation, including topics such as intellectual property as a feature of local economic
development (see Döring and Schnellenbach, 2006; Feldman, 1999). More recently however, “a sus-
tained body of critically engaged research has emerged, focusing on the circulation of urban policy
models and knowledge” (Temenos and McCann, 2013, p825). This is new interest in knowledge mo-
bility is notable for three reasons; first for its emphasis on global circuits of knowledge mobility rather
than local knowledge transfer and spillover, secondly for its explicitly urban emphasis, and thirdly
because of the way it theorizes policy and knowledge mobilities as being co-constitutive.
Energy feedback
Having outlined the concepts of knowledge and policy mobility, we now turn to consider how energy
feedback is defined and its current knowledge base and policy development, concentrating on the UK
and Australia.The term ‘feedback’ describes changes in a system or process because of information:
“The modification, adjustment, or control of a process or system (as a social situa-
tion or a biological mechanism) by a result or effect of the process, especially by a
difference between a desired and an actual result; information about the result of a
process, experiment, etc.; a response” (OED, 2016).
Energy feedback is a term used more specifically to refer to the provision of information on energy
use to relevant parties. In this paper we focus on energy feedback to householders, i.e. domestic con-
sumers of energy, with respect to electricity. In this context energy feedback is about the provision of
more frequent, understandable, and more granular energy information to householders. Energy feed-
back can be categorised as either direct “…immediate, from the meter or an associated display moni-
tor” or indirect “…feedback that has been processed in some way before reaching the energy user”
(Darby, 2006: 3).
Over the last decade the technical capabilities for providing energy feedback have expanded, with the
emergence of digital communications-enabled meters connected to in-home displays (IHDs), energy
monitors on individual appliances, household temperature sensors, and so on. Domestic energy feed-
back was traditionally about improved billing and energy labels, but it now mostly encompasses digi-
tally-enabled forms of information provision and engagement with householders.
“Feedback in energy demand reduction: Examining evidence and exploring opportunities” Edinburgh, July 2016Page 189
In what has become an obligatory reference document for researchers interested in the effectiveness of
various forms of energy feedback, Darby (2010) made clear the diversity of recent energy feedback
studies both in terms of the range of interventions being trialled in the early 21st century but also the
range of conceptual apparatus being deployed. There was then, and remains, great uncertainty about
exactly which interventions, in which combinations targeted at which households will generate the
greatest changes in energy use. Analysis of the UK EDRP data shows that direct energy use feedback
to households generates total energy savings of between 0 and 11%, with an average of 3%, while
feedback in combination with a time of use pricing regime reduced early evening (peak) consumption
by ‘up to 10%’ but did not reduce total energy use (AECOM, 2011). What this range of uncertainty in
household response indicates is that a ‘one-size-fits-all approach’ is not appropriate. Complex interac-
tions between several factors make energy feedback a nuanced and context-sensitive endeavour.
In their summary for the Californian government (which draws on Darby’s mainly Northern European
research), Mahone and Haley (2011) identify three modes of feedback-based energy efficiency initia-
tives: those with an individual household focus which often invoke financial / efficiency benefits as
the motivating factor; those with a peer or comparative element which invoke competition as a moti-
vating factor; and those with a community focus which rely on a sense of common purpose and col-
lective action to bring about energy use changes. These forms of feedback have been thoroughly test-
ed by scholars in a wide range of disciplines over the last decade, and most studies are in agreement
on the importance of contextually attuning a package of interventions rather than ‘fitting and forget-
ting’ feedback devices (see for example Faruqui et al., 2010) . The breadth of this research also re-
veals many wrinkles in the often smoothed out imaginary of future smart energy systems, such as us-
ers’ disengagement (Burchell et al., 2016; Westskog et al., 2015), the long term ‘backgrounding’ of
IHDs which erodes the effectiveness of interventions (Hargreaves et al., 2013), and unintended conse-
quences of IHD installations such as induced fears and anxiety (Raimi and Carrico, 2016).
Exploring the ways in which energy feedback has been framed in the UK and Australian policy
The term ‘energy feedback’ has been used much more extensively in UK policy compared with Aus-
tralia. For instance, an Advanced Google search looking for the specific terms “energy feedback” in
the title of the page in Australia yielded just 25 matches, and the UK 190 matches. But the conceptu-
alization of the role of energy feedback by those organisations involved in its governance appears to
be broadly similar across the two countries. In particular, policy attention has centred on new technol-
ogies enabling energy feedback, namely the smart meter and IHDs.
Smart meters as enablers of energy feedback
Energy feedback has become a key feature of UK energy policy since the Department for Energy and
Climate Change took on the responsibility for a national “roll-out” of smart meters to all homes in the
UK by 2020. In its public facing website, Smart Energy GB - an arm’s length agency acting on behalf
of government - makes it explicit that all homes in the UK will be offered a smart meter and that this
includes an in-home display (IHD):
“An in-home display – a handheld digital device that sits in your home and allows
you to see how much energy you are using as well as how much it's costing you in
pounds and pence, in near real time. This may be called lots of things - like an IHD
or smart meter display.” (Smart Energy GB, 2016)
“Feedback in energy demand reduction: Examining evidence and exploring opportunities” Edinburgh, July 2016Page 190
Similarly in Australia there has been a focus on smart meters as an ‘enabling technology’ for energy
feedback (and more broadly demand side participation (‘DSP’)):
"... enabling metering technology is important for consumers to have the ability to
take up some DSP options and be able to capture the value of their decisions. Cur-
rently, where a consumer makes an informed decision to switch to a flexible retail
offer or take up of different DSP products (ie install smart appliances); the market
is generally unable to support that choice due to a lack of installed advanced meter-
ing capability.” (AEMC, 2012: 77).
The UK smart metering roll-out is already using some of the most unequivocal research findings to
present smart metering and IHDs as positive additions to UK homes and to overcome common objec-
tions found across prior qualitative research. Utilities are, for example, promising a coaching session
at the time of installation to overcome issues of disengagement and perceived concerns about how
smart meters may be domesticated by households (Aune, 2007; Jensen et al., 2009; Sundramoorthy
et al., 2011);
“During your smart meter installation, the installer will show you exactly how your
in-home display works and set it up for you. The display communicates with your
smart meter to show you information about your energy usage. Position it some-
where useful, such as your kitchen or living room, and you can see exactly how
much you're using and what it’s costing at a glance.” (Smart Energy GB, 2016)
and reassuring customers about privacy (McKenna et al., 2012);
“Who can access my smart meter data and how is it used? Only your supplier, and
they won’t share any of it without your permission… The meter will keep your data
secure.” (Smart Energy GB, 2016).
Central to this paper, however, are the ways in which Smart Energy GB along with energy market
regulators in Australia are making direct links between smart meters, framed as a bundle of connected
technologies including IHDs, and a range of wider policy problems. This is operating through two dif-
ferent discourses: first, is that smart meters through the effects of the IHD are able to resolve energy
market failures; second, is that when combined with IHDs smart meters can play a pivotal role in a
much wider range of energy policy problems.
Smart meters as market correction devices
In the UK context, Ofgem’s smarter markets program positions smart meters as able to act as market
correction devices:
“smart meters open the door to far greater customer involvement in the energy
market. Through this, we will have a more dynamic and competitive market.”
(Ofgem, 2015a)
Thus the work that is being done by energy feedback here - facilitated by the smart meter - is to allow
the individual householder to effectively participate as an informed consumer within energy markets.
The 2015 Australian Energy White Paper similarly encapsulates this objective, as follows:
“Feedback in energy demand reduction: Examining evidence and exploring opportunities” Edinburgh, July 2016Page 191
“Effective and timely consumer access to their own data from these [smart] meters
(either directly or through an authorised agent) is critical to enable a more sophis-
ticated response to cost-reflective tariffs and help consumers select the best services
for their needs.” (Department of Industry and Science, 2015: 12).
A dimension of this policy framing is that customers’ engagement with the market is deemed to be
important to improving market functioning, with IHD-delivered feedback positioned as one of the
central mechanisms for customer engagement. The logic being employed here in the UK in particular
is that more engaged customers will have greater expectations of suppliers and will thus incentivise
innovation:
“Consumers find the market more engaging … Increased consumer engagement
encourages providers to innovate.” (Ofgem, 2015b)
IHD-equipped smart meters as a silver bullet
Successfully responding to climate change and energy insecurity crises via a smart grid is framed as
contingent upon effective successful smart metering, with feedback from IHDs positioned as an essen-
tial part of that process. In these energy policy narratives - which are circulating most noticeably in
the UK - smart meters therefore unlock solutions to a host of diverse energy policy problems includ-
ing CO2 emissions reductions, fuel poverty, active matching of supply and demand for power, energy
security, network reliability, long term planning and market efficiency gains:
“Smart meters help enable the smart grid, which is a whole new way of running our
energy networks. … The energy network we have now was designed for a time when
our gas and electricity needs were much simpler. Now, we’re using more energy
and have to find ways to reduce our carbon emissions. We need to integrate new
technologies, like electric cars and solar and wind energy.
The smart grid has the potential to help us solve lots of Britain’s energy prob-
lems.” (Smart Energy GB, 2016; emphasis added)
The smart meter itself is framed as necessary but, on its own, insufficient for the realisation of these
potential solutions and remains contingent upon being bundled with effective energy feedback through
IHDs. Attention to IHDs in Australia has been more limited, but there is a similar broader recognition
of both the opportunities but also the challenges of achieving effective energy feedback:
“Influencing energy consumption by changing consumer behaviour presents a sig-
nificant energy efficiency opportunity, but it requires responsive feedback and con-
tinuous engagement.” (NSW Government 2013 Energy Efficiency Action Plan,
p12).
Large energy feedback trials and their mobility
In this section we turn to explore how three UK and Australian energy feedback trials have been posi-
tioned as having a global reach, i.e. able to produce generalised learning or placeless knowledge. We
report on preliminary analysis of how successful they have been in achieving this objective.
“Feedback in energy demand reduction: Examining evidence and exploring opportunities” Edinburgh, July 2016Page 192
Australia: Smart Grid Smart City (SGSC) There has been careful positioning of the location of SGSC trials as able to generate highly transfera-
ble knowledge, relevant to other places within Australia and internationally. For example, one of the
seven original objectives for SGSC - as listed in the government’s SGSC pre-deployment report - was
to:
“Develop an innovative solution that can serve as a global reference case.” (Department of the Environment, 2009: 16).
In the Executive Summary to the Final Report on SGSC this global ambition is somewhat toned down
– with more emphasis on the value of SGSC findings domestically, to Australia - but it is nevertheless
claimed that:
"The Smart Grid, Smart City Program was arguably one of the widest-ranging
technology assessments of smart grid products in the world." (AEFI, 2014: 5).
Further, the geography of the SGSC trials is carefully explained with regard to how and why the trial
locations were selected in order to maximize the applicability (or mobility) of the SGSC findings:
"The trial was largely focussed on the greater Newcastle and Sydney CBD areas…
The selection of appropriate geographic locations for the trial was considered criti-
cal to producing reliable data that could be accurately extrapolated to assess the
viability of a large scale smart grid roll-out in Australia. The greater Newcastle ar-
ea was selected as one of the focal points for the trial due to its mix of regional and
suburban characteristics that result in representative geography, climate, socioeco-
nomic and demographic factors. The customer demographic and socioeconomic in-
dicators in Newcastle closely reflect the demographic attributes of a typical Austral-
ian city." (AEFI, 2014: 10).
Forthcoming empirical research will investigate how successful SGSC has been in achieving its aspi-
rations to be a global reference case: a survey of all registered users (c1500) of the SGSC Information
Clearing House - an online database comprising the full data sets and reports from SGSC - is planned
for the second half of 2016. Meanwhile, some indication of the international mobility of SGSC can be
gleaned from exploratory internet searches: a Google Scholar search for citations of key SGSC docu-
ments (final main report (AEFI, 2014) and final customer report (Langham et al., 2014)) identified
several citations, but from Australia only; and a Google Advanced Search for “smart grid smart city”
(exact phrase, in title of page) had the following number of hits, by country: Australia - 40; UK - 6;
US – 44. These findings tentatively indicate some international mobility of SGSC.
UK: CLNR and EDRP In the UK a great deal of the recent research into smart grids and meters and the role of feedback in
interacting with each has been paid for either directly or indirectly by national government bodies or
their key operational partners, such as the UK energy markets regulator Ofgem. This research has
been explicitly tied to national policy challenges, and a common criteria for the ‘evidence’ being pro-
duced through Low Carbon Network funding and the smart metering program is that, similar to Aus-
tralia and the case of SGSC, it must be “nationally applicable” if the projects are to report successful
“Feedback in energy demand reduction: Examining evidence and exploring opportunities” Edinburgh, July 2016Page 193
delivery of the research projects. The geography and rationale here is that locally specific cases are
not seen as valid uses of nationally collected tax-payer or energy bill payers’ money, and that the UK
as a whole must solve what is framed as the collective, national challenge of sustainable energy provi-
sion. This is explicitly written into the terms of the funding and as a result the claims made by re-
search teams reporting on the findings of research undertaken on this basis.
“An important feature of the CLNR project is that trials are taking place on real
networks and with real customers to produce real-world, usable data. … We pur-
posely selected a range of rural and urban locations for our network technology tri-
als to ensure our findings can be applied more across the UK. These locations com-
bined offer a representative sample of 80% of Great Britain’s total electricity distri-
bution network, which means that the learning we gain from these trials will be ap-
plicable to 80% of GB networks.” (CLNR, 2014).
CLNR included several sub-projects (‘trials’ in the project vernacular) of households using in-home
displays to optimise their energy use. The research activity included analysis of energy usage data as
well as survey and semi-structured interview data. The quantitative data sets have been made publical-
ly available, and the findings published in a number of channels (Bulkeley et al., 2016; Powells et al.,
2014, 2015). The EDRP was an earlier (2007-10) smart meter research project comprised of a port-
folio of large scale trials aiming to understand how consumers react to improved information about
their energy consumption over the long term. (ref 23
). These large scale studies hoped to create gen-
eral, transferable knowledge of the impact of smart meters and displays as an evidence base ahead of a
UK-wide implementation of smart meters. The project was administered entirely by third parties on
the UK regulator’s behalf (Ofgem) with four of the UK’s ‘big six’ energy suppliers delivering the tri-
als and an independent consultant analysing the data. In total over 50,000 households were included in
the trials which ran from 2007 until 2010. The data from these trials has also now been made available
to the research community via the UK Data Service24
.
Our analysis of these data points to multi-scalar flows of policy-knowledge emanating from the trials
we have studied. There are clearly claims and actual flows of knowledge that are global in nature –
such as California’s governmental review using Darby’s European review of trials, and SGSC’s stated
aim to be a global pioneer through the generation of globally important policy innovation. However,
we observe that the national remains an important boundary in energy feedback research mobility be-
cause of the ethical and political mandate that nationally publically funded research must generate
knowledge that is applicable across the same tax-paying territory. In identifying this multi-scalar ge-
ography we do not make a comparative analysis of Australia vs UK, but rather we draw on cases from
both countries to argue that the concepts of policy and knowledge mobilities that emphasize the im-
portance of local context and materiality in knowledge production are useful in understanding the cir-
culation of knowledge both within territories and national energy systems and between them.
23
https://www.ofgem.gov.uk/gas/retail-market/metering/transition-smart-meters/energy-demand-research-project
24 https://www.ukdataservice.ac.uk/
“Feedback in energy demand reduction: Examining evidence and exploring opportunities” Edinburgh, July 2016Page 194
Summary and Conclusions
In this draft paper we have begun to explore the governance of energy feedback policy and the mobili-
ty of energy feedback trials, drawing on empirical research underway in the UK and Australia. We
propose scholarship on policy and knowledge mobility as a suitable conceptual framework for evalu-
ating energy feedback in this way, because of its focus on the geographies of knowledge claims, and
its attentiveness to context. In particular, this literature enables our analysis to go beyond ideas of lo-
cal knowledge spillovers found in innovation theories, in which knowledge circulates or spills into lo-
cal innovation networks, to think about global circuits and connections. By connecting these insights
with the policy mobilities literature which emphasizes the social, economic and political geographies
that animate and shape policy mobilities we are able in this draft paper to start to develop an analysis
which can attend to both the mobility but also the factors which constrain, block and route knowledge
differently. Our preliminary analysis reveals a mixture of global and some national flows. In conclu-
sion, the following tentative observations can be made:
1. Energy feedback has in recent years become an area of governance reinvigorated by, and in-
creasingly framed by, technical innovations in smart metering and IHDs. This is the case in the
UK as well as Australia;
2. Energy feedback is seen in policy circles as being able to do a great deal of work, potentially
providing a policy solution to a host of policy problems, including climate change, fuel pov-
erty, energy market function problems, and customer engagement;
3. Those organisations involved in the three energy feedback trials discussed here - SGSC (Aus-
tralia) and CLNR and EDRP (UK) - have made substantial efforts to position the trials and
findings from them as globally and nationally relevant;
4.Further research is required to establish the extent to which these ambitions for policy and
knowledge mobility of trial findings have been realized. Early indications suggest domes-
tic/national mobilities have been most significant.
Acknowledgements
Dr Heather Lovell would like to thank the Australian Research Council for funding the project ‘Smart
Grids Messy Society’. Dr Gareth Powells would like to thank the collaborators on the Customer-Led
Network Revolution Project: Northern Powergrid, British Gas, Durham University, National Energy
Action and EA Technology.
Bibliography
AECOM, 2011. Energy Demand Research Project: Final Analysis Executive Summary. OFGEM,
London.
AEFI, 2014, "Smart Grid, Smart City: Shaping Australia's Energy Future - Executive Report",
(Arup, Energeia, Frontier Economics, & the Institute for Sustainable Futures (University of
Technology Sydney) (AEFI), Canberra)
“Feedback in energy demand reduction: Examining evidence and exploring opportunities” Edinburgh, July 2016Page 195
AEMC, 2012, "Power of choice review - giving consumers options in the way they use electricity.
Final Report", (Australian Energy Market Commission, Sydney)
Aune, M., 2007. Energy comes home. Energy Policy 35, 5457–5465.
Burchell, K., Rettie, R., Roberts, T.C., 2016. Householder engagement with energy consumption
feedback: The role of community action and communications. Energy Policy 88, 178–186.
doi:10.1016/j.enpol.2015.10.019
Bulkeley H, Powells G, Bell S, 2016, "Smart grids and the constitution of solar electricity conduct"
Environment and Planning A 48 7-23
Customer-Led Network Revolution, 2014. Newsletter 05 [WWW Document]. URL
http://www.networkrevolution.co.uk/wp-content/uploads/2014/06/Final-CLNR-PDF-
newsletter-05-Apr-2014.pdf (accessed 6.21.16).
Darby S, 2006, "The effectiveness of feedback on energy consumption" A Review for DEFRA of the
Literature on Metering, Billing and direct Displays 486 2006
Darby, S., 2010. Literature review for the Energy Demand Research Project.
Department of Industry and Science, 2015, "Energy White Paper", (Australian Government)
Department of the Environment W, Heritage and the Arts, , 2009, "Smart Grid, Smart City: a new
direction for a new energy era", (Commonwealth of Australia, Canberra, Australia)
Dolowitz D, Marsh D, 1996, "Who learns what from whom: a review of the policy transfer literature"
Political Studies 44 343-357
Döring, T., Schnellenbach, J., 2006. What do we know about geographical knowledge spillovers and
regional growth?: A survey of the literature. Regional Studies 40, 375–395.
doi:10.1080/00343400600632739
Faruqui, A., Sergici, S., Sharif, A., 2010. The impact of informational feedback on energy consump-
tion—A survey of the experimental evidence. Energy, Demand Response Resources: the US
and International ExperienceDemand Response Resources: the US and International Experi-
ence 35, 1598–1608. doi:10.1016/j.energy.2009.07.042
Feldman, M.P., 1999. The New Economics Of Innovation, Spillovers And Agglomeration: Areview
Of Empirical Studies. Economics of Innovation and New Technology 8, 5–25.
doi:10.1080/10438599900000002
Hannam, K., Sheller, M., Urry, J., 2006. Editorial: Mobilities, Immobilities and Moorings. Mobilities
1, 1–22. doi:10.1080/17450100500489189
Hargreaves, T., Nye, M., Burgess, J., 2013. Keeping energy visible? Exploring how householders in-
teract with feedback from smart energy monitors in the longer term. Energy Policy, Special
Section: Transition Pathways to a Low Carbon Economy 52, 126–134.
doi:10.1016/j.enpol.2012.03.027
Jensen, J.O., Gram-Hanssen, K., Røpke, I., Christensen, T.H., 2009. Households’ use of information
and communication technologies–a future challenge for energy savings? Informations-og
kommunikations-teknologi i husholdningerne–en energipolitisk udfordring 77.
Jacobs J M, 2012, "Urban geographies I: Still thinking cities relationally" Progress in Human
Geography 36 412-422
Jessop B, 2003, "The crisis of the national spatio-temporal fix and the ecological dominance of
globalizing capitalism", Department of Sociology, Lancaster University, Lancaster, UK,
http://www.lancs.ac.uk/fass/sociology/papers/jessop-crisis-of-the-national-spatio-temporal-
fix.pdf
Langham E, Downes J, Brennan T, Fyfe J, Mohr S, Rickwood P, White S, 2014, "Smart Grid, Smart
City, Customer Research Report. Report prepared June 2014.", (by the Institute for
Sustainable Futures as part of the AEFI consortium for Ausgrid and EnergyAustralia, Sydney)
“Feedback in energy demand reduction: Examining evidence and exploring opportunities” Edinburgh, July 2016Page 196
Mahone, A., Haley, B., 2011. Overview of Residential Energy Feedback and Behavior‐based Energy
Efficiency. Energy and Environmental Economics, Inc., San Francisco.
McKenna, E., Richardson, I., Thomson, M., 2012. Smart meter data: Balancing consumer privacy
concerns with legitimate applications. Energy Policy, Modeling Transport (Energy) Demand
and Policies 41, 807–814. doi:10.1016/j.enpol.2011.11.049
McCann E, Ward K, 2012, "Policy assemblages, mobilities and mutations: Toward a multidisciplinary
conversation" Political studies review 10 325-332
Ofgem, 2015a. Infographic guide: Smart means - engaged consumers [WWW Document]. URL
https://www.ofgem.gov.uk/publications-and-updates/infographic-guide-smart-means-engaged-
consumers%20 (accessed 6.21.16).
Ofgem, 2015b. Infographic guide: What does a smarter energy market look like? [WWW Document].
URL https://www.ofgem.gov.uk/publications-and-updates/infographic-guide-what-does-
smarter-energy-market-look (accessed 6.21.16).
OED, 2016, "Feedback - Oxford English Dictionary definition",
http://www.oed.com/view/Entry/68965?rskey=8icknX&result=2#eid,
Peck J, 2002, "Political economies of scale: fast policy, interscalar relations, and neoliberal workfare"
Economic geography 78 331-360
Powells, D.G., Blake, D.L., 2016. Urban Science Networks and Local Economy: The Case of New-
castle Upon Tyne. http://eprints.ncl.ac.uk.
Raimi, K.T., Carrico, A.R., 2016. Understanding and beliefs about smart energy technology. Energy
Research and Social Science 12, 68–74. doi:10.1016/j.erss.2015.12.018
Sheller, M., Urry, J., 2006. The new mobilities paradigm. Environ. Plan. A 38, 207–226.
doi:10.1068/a37268
Smart Energy GB, 2016. Smart Meter FAQ [WWW Document]. URL
https://www.smartenergygb.org/en/faqs (accessed 6.17.16).
Sundramoorthy, V., Cooper, G., Linge, N., Liu, Q., 2011. Domesticating Energy-Monitoring Systems:
Challenges and Design Concerns. IEEE Pervasive Computing 10, 20–27.
doi:10.1109/MPRV.2010.73
Temenos, C., McCann, E., 2013. Geographies of Policy Mobilities. Geography Compass 7, 344–357.
doi:10.1111/gec3.12063
Urry, J., 2004. Connections. Environ. Plan. D-Soc. Space 22, 27–37. doi:10.1068/d322t
Walker J L, 1969, "The diffusion of innovations among the American states" American political
science review 63 880-899
Westskog, H., Winther, T., Sæle, H., 2015. The effects of in-home displays-revisiting the context.
Sustainability (Switzerland) 7, 5431–5451. doi:10.3390/su7055431
“Feedback in energy demand reduction: Examining evidence and exploring opportunities” Edinburgh, July 2016Page 197
Advances in understanding energy consumption behavior and the governance of
its change – outline of an integrated framework
Annika Sohre, University of Basel, Switzerland
This extended abstract is based on the published paper:
Burger et al., (2015). Advances in understanding energy consumption behavior and the governance of
its change – Outline of an integrated framework. Frontiers in Energy Research, 3, 29.)
Abstract
Feedback instruments that aim to substantially reduce the total energy consumption at the individual
level have partially been found to be effective in changing people’s behavior in single domains. How-
ever, the so far weak success story on reducing overall energy consumption indicates that our under-
standing of the determining factors of individual energy consumption as well as of its change is far
from being conclusive. Among others, the scientific state of the art is dominated by analyzing single
domains of consumption and by neglecting embodied energy. It also displays strong disciplinary splits
and the literature often fails to distinguish between explaining behavior and explaining change of be-
havior. Moreover, there are knowledge gaps regarding the legitimacy and effectiveness of the govern-
ance of individual consumption behavior and its change. Against this backdrop, the aim of this paper
is to establish an integrated interdisciplinary framework that offers a systematic basis for linking the
different aspects in research on energy related consumption behavior, thus paving the way for estab-
lishing a better evidence base to inform societal actions. The framework connects the three relevant
analytical aspects of the topic in question: (1) it systematically and conceptually frames the objects,
i.e., the energy consumption behavior and its change (explananda); (2) it structures the factors that po-
tentially explain the energy consumption behavior and its change (explanantia); (3) it provides a dif-
ferentiated understanding of change inducing interventions in terms of governance. Based on the ex-
isting states of the art approaches from different disciplines within the social sciences, the proposed
framework is supposed to guide interdisciplinary empirical research.
1. Introduction - Problem Statement, Aims, and Relevance
Transforming today’s energy systems in industrialized countries requires a substantial reduction of the
total energy consumption at the individual level. Selected instruments as feedback instruments have
been found to be effective in changing people’s behavior in single domains. However, societies are
not yet really on track with the ambitious goals they aspire to. In Switzerland – comparable to other
industrialized countries – the total final energy consumption of private households in 2012 exceeded
the consumption in 2000 by 4.5%, instead of the intended decrease (BFE, 2013: 5). The so far weak
success story on reducing overall energy consumption indicates that our understanding of the deter-
mining factors of individual energy consumption as well as of its change is far from being conclusive.
Among others, the scientific state of the art is dominated by analyzing single domains of consumption
and by neglecting embodied energy. It also displays strong disciplinary splits and the literature often
fails to distinguish between explaining behavior and explaining change of behavior. Moreover, there
are knowledge gaps regarding the legitimacy and effectiveness of the governance of individual con-
sumption behavior and its change.
Against this backdrop, the aim of this paper is to establish an integrated interdisciplinary framework
that offers a systematic basis for linking the different aspects in research on energy related
“Feedback in energy demand reduction: Examining evidence and exploring opportunities” Edinburgh, July 2016Page 198
consumption behaviour (ECB), thus paving the way for establishing a better evidence base to inform
societal actions. The framework connects the three relevant analytical aspects of the topic in question:
(a). it systematically and conceptually frames the objects, i.e., the energy consumption behavior and
its change (explananda);
(b) it structures the factors that potentially explain the energy consumption behavior and its change
(explanantia);
(c) it provides a differentiated understanding of change inducing interventions in terms of governance.
It seems that both our understanding of the determining factors of energy-related consumption and our
understanding of the drivers and barriers of change need to be improved for making progress toward
reduced energy consumption in households. The distinction between understanding behavior and un-
derstanding change of behavior has been introduced on purpose. (cf. also Darnton, 2008). The first
explains energy consumption behavior (ECB) as it is today, and the second explains its change. This
distinction is decisive and allows us to unfold the different scientific tasks stated above:
The first goal of “explaining ECB” implies answering the following two questions:
(1) What is ECB? (2) Which factors determine ECB?
Question (1) is by no means trivial, as an explanation is basically dependent upon what is to be ex-
plained and different disciplines subsume different meanings under the term ECB. Thus, answering
question (1) is a first indispensable step toward clarifying the research object (explanandum, a). Ques-
tion (2) then addresses the explaining factors of the behavior in question (explanantia, b), e.g., milieu
related aspects, decision heuristics, spontaneous developments, norms etc.
However, explaining “ECB” includes neither the temporal dimension of change nor the reduction
goals. Hence, there is a second explanatory goal, namely explaining “change of energy consumption
behavior toward reduction”. Accordingly and following the above made distinction between ex-
planandum and explanantia, two further questions can be formulated:
(3) What is “change of ECB?” (4) Which factors explain changes of ECB?
Again, answers to question (3) are not as straightforward as it first may seem. Among others, a clear
definition of the scope of “change” is mandatory. Are we simply talking in terms of reduced kJ on the
individual level or do we broaden “change” to capture a changed perception of what makes up quality
of life (cf. Mourik and Rotmann, 2013)? Hence, analyzing behavior and analyzing its change force us
to first clarify the object of interest (explanandum, a).
Question (4) also asks for clarification, as the term “factors explaining changes” (explanantia, b) could
be interpreted in two ways. First, it can refer to those factors that explain behavior according to ques-
tion (2). As changing behaviors ask for different determinants, we need to identify the variation of the
factors within the types. Second, “factors” can also refer to interventions, political instruments etc.,
i.e., to elements directed to steer behavior toward a change. However, we do not use the term “factor”
in that second sense. Instead, we propose to add a fifth question:
(5) What are the constituents to be taken into account to successfully govern change of ECB?
“Feedback in energy demand reduction: Examining evidence and exploring opportunities” Edinburgh, July 2016Page 199
Question 5 deals with the realm of governance. Given the complex scientific debate on “governance
of societal change,” it is worth considering this topic and refraining from an exclusive focus on politi-
cal instruments.
An abundance of literature already contributes to many aspects within the sketched explanatory fields.
Whether the current state of the art copes with the indicated distinctions and their inherent complexity
is at least doubtful. Despite the large number of scientific studies, science still struggles with under-
standing ECB and the triggers for changing it. There is only partial knowledge on what forms of gov-
ernance induce which changes in what kind of energy-related behavior of which individuals. Most
importantly, the scientific state of the art displays strong disciplinary splits (Keirstead, 2006) to the
effect that there is only little understanding of the interrelations among different aspects of ECB
across the different fields. To cope with this requirement, we base our framework on the existing state
of the art in the disciplines we represent, i.e., psychology, economics, consumer behavior, business
science, sociology, and political science.25
Some integrated models have already been set up in (more or less) interdisciplinary approaches (e.g.
Hitchcock, 1993; Dholakia et al.,1983; Wilk, 2002; Keirstead, 2006; Stephenson et al., 2010; Wilson
and Dowlatabadi, 2007). While recognizing the instruction value of these models, there are obviously
some important caveats. First, there is a gap between economics and the other types. Second, all rely
on some disciplinary, partly contested theory. Third, governance of change is often only represented
by the very general category “intervention,” leaving it as a black box. Hence, we follow Wilson and
Dowlatabadi’s (2007) statement that there is still an academic gap regarding integrated, interdiscipli-
nary models or frameworks that systematically capture the different explanatory tasks regarding ECB
and its (governed) change. Our paper contributes to closing this gap.
Moreover, there is a practical add-on. The authors of the original paper are all members of the work
package on change of behavior within the Swiss Competence Center for Research in Energy, Society,
and Transition (SCCER-CREST)26
. In this context the proposed framework in this paper already
guides research providing empirical evidence for business, political, and civil society actors on the
change of ECB. For example it proved to be successful as the basic concept for the newly established
SCCER-CREST long-term Swiss Household Energy Demand Survey (SHEDS).
2. An integrated framework
Following the overall definition that a conceptual framework provides a rather general descriptive
foundation for explanatory inquiries, our framework does not give explanations by itself, but frames
the space for searching for explanations. Moreover and in contrast to the frameworks mentioned
above, we refrain from building the framework onto a specific theoretical fundament. Searching for
such a common theoretical basis is an unrealistic endeavor given the manifold of theoretical behavior
approaches, e.g., rational choice, bounded rationality, theory of planned behavior, norm-activation-
model, value-belief-norm characteristics, social practice theory etc. (cf. Keirstead, 2006; Wilson and
Dowlatabadi, 2007; Darnton, 2008; Stephenson et.al, 2010; Karatasou et al., 2014). Accordingly, the
framework is problem oriented, not theory oriented.
25
The thus composed framework is based on the results of the disciplinary reviews (cf. in the original paper,
Burger et al., 2015). However, it also goes beyond them by relating and integrating them within an
interdisciplinary framework.
26 http://www.sccer-crest.ch.
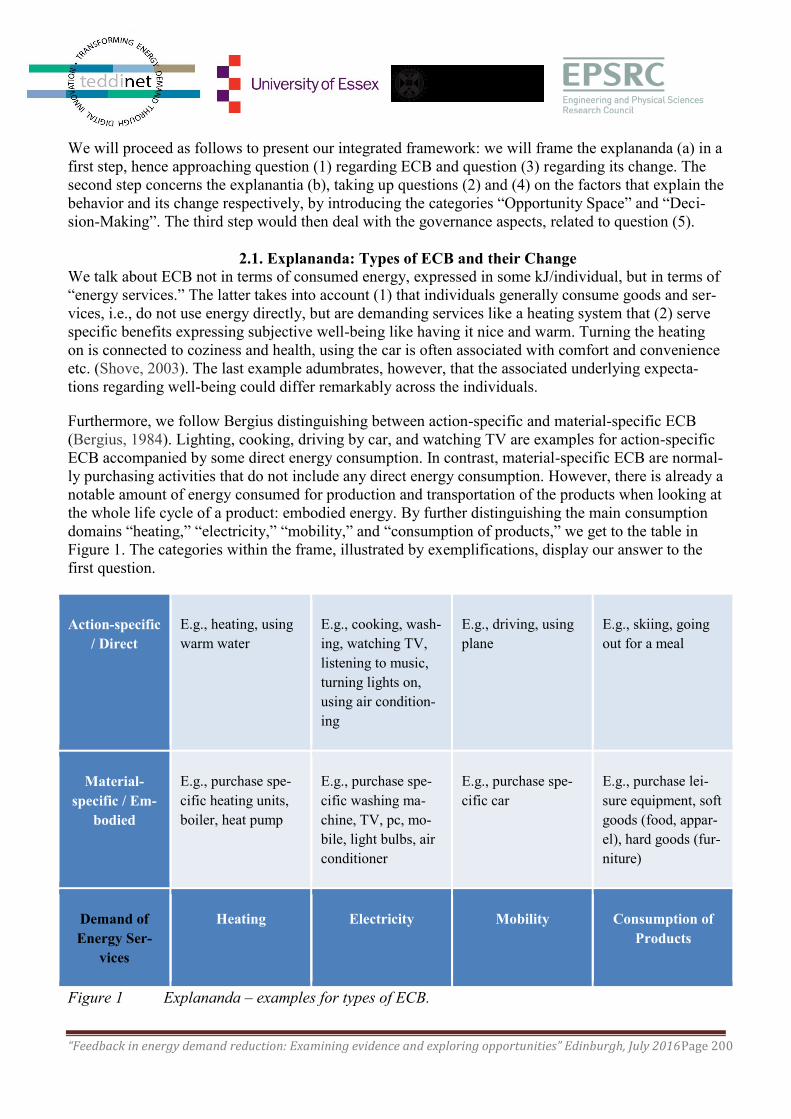
“Feedback in energy demand reduction: Examining evidence and exploring opportunities” Edinburgh, July 2016Page 200
We will proceed as follows to present our integrated framework: we will frame the explananda (a) in a
first step, hence approaching question (1) regarding ECB and question (3) regarding its change. The
second step concerns the explanantia (b), taking up questions (2) and (4) on the factors that explain the
behavior and its change respectively, by introducing the categories “Opportunity Space” and “Deci-
sion-Making”. The third step would then deal with the governance aspects, related to question (5).
2.1. Explananda: Types of ECB and their Change
We talk about ECB not in terms of consumed energy, expressed in some kJ/individual, but in terms of
“energy services.” The latter takes into account (1) that individuals generally consume goods and ser-
vices, i.e., do not use energy directly, but are demanding services like a heating system that (2) serve
specific benefits expressing subjective well-being like having it nice and warm. Turning the heating
on is connected to coziness and health, using the car is often associated with comfort and convenience
etc. (Shove, 2003). The last example adumbrates, however, that the associated underlying expecta-
tions regarding well-being could differ remarkably across the individuals.
Furthermore, we follow Bergius distinguishing between action-specific and material-specific ECB
(Bergius, 1984). Lighting, cooking, driving by car, and watching TV are examples for action-specific
ECB accompanied by some direct energy consumption. In contrast, material-specific ECB are normal-
ly purchasing activities that do not include any direct energy consumption. However, there is already a
notable amount of energy consumed for production and transportation of the products when looking at
the whole life cycle of a product: embodied energy. By further distinguishing the main consumption
domains “heating,” “electricity,” “mobility,” and “consumption of products,” we get to the table in
Figure 1. The categories within the frame, illustrated by exemplifications, display our answer to the
first question.
Action-specific
/ Direct
E.g., heating, using
warm water
E.g., cooking, wash-
ing, watching TV,
listening to music,
turning lights on,
using air condition-
ing
E.g., driving, using
plane
E.g., skiing, going
out for a meal
Material-
specific / Em-
bodied
E.g., purchase spe-
cific heating units,
boiler, heat pump
E.g., purchase spe-
cific washing ma-
chine, TV, pc, mo-
bile, light bulbs, air
conditioner
E.g., purchase spe-
cific car
E.g., purchase lei-
sure equipment, soft
goods (food, appar-
el), hard goods (fur-
niture)
Demand of
Energy Ser-
vices
Heating Electricity Mobility Consumption of
Products
Figure 1 Explananda – examples for types of ECB.
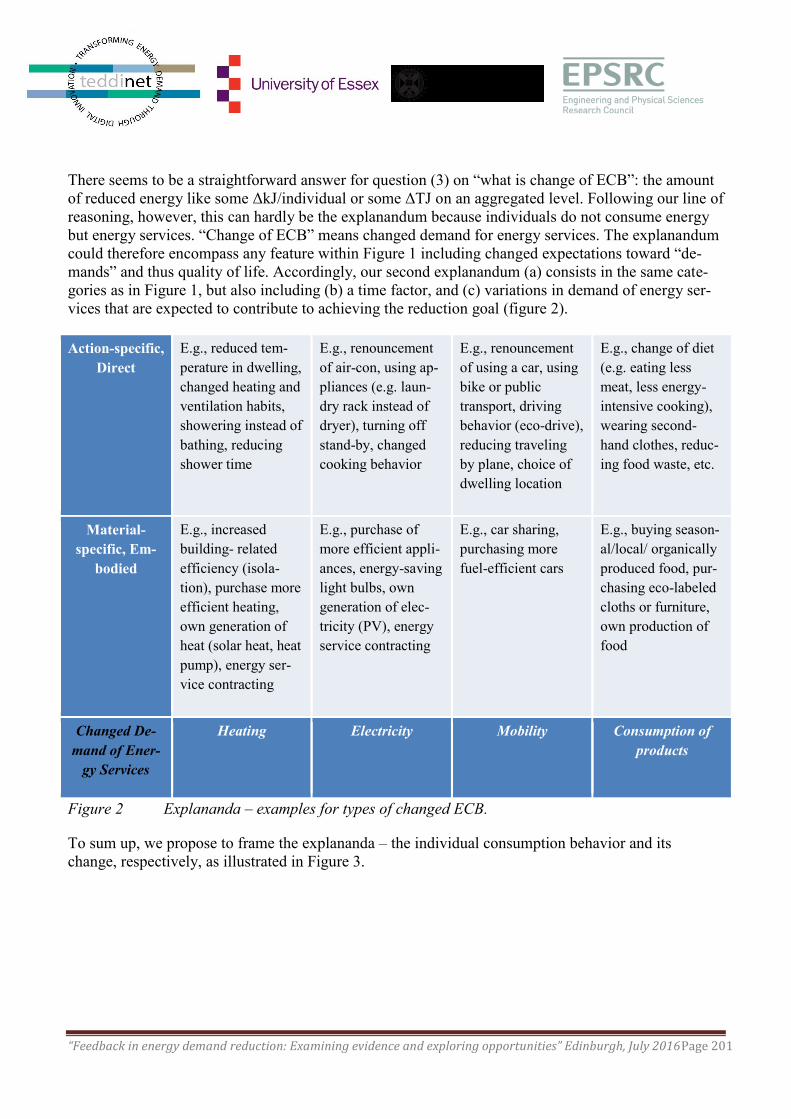
“Feedback in energy demand reduction: Examining evidence and exploring opportunities” Edinburgh, July 2016Page 201
There seems to be a straightforward answer for question (3) on “what is change of ECB”: the amount
of reduced energy like some ΔkJ/individual or some ΔTJ on an aggregated level. Following our line of
reasoning, however, this can hardly be the explanandum because individuals do not consume energy
but energy services. “Change of ECB” means changed demand for energy services. The explanandum
could therefore encompass any feature within Figure 1 including changed expectations toward “de-
mands” and thus quality of life. Accordingly, our second explanandum (a) consists in the same cate-
gories as in Figure 1, but also including (b) a time factor, and (c) variations in demand of energy ser-
vices that are expected to contribute to achieving the reduction goal (figure 2).
Action-specific,
Direct
E.g., reduced tem-
perature in dwelling,
changed heating and
ventilation habits,
showering instead of
bathing, reducing
shower time
E.g., renouncement
of air-con, using ap-
pliances (e.g. laun-
dry rack instead of
dryer), turning off
stand-by, changed
cooking behavior
E.g., renouncement
of using a car, using
bike or public
transport, driving
behavior (eco-drive),
reducing traveling
by plane, choice of
dwelling location
E.g., change of diet
(e.g. eating less
meat, less energy-
intensive cooking),
wearing second-
hand clothes, reduc-
ing food waste, etc.
Material-
specific, Em-
bodied
E.g., increased
building- related
efficiency (isola-
tion), purchase more
efficient heating,
own generation of
heat (solar heat, heat
pump), energy ser-
vice contracting
E.g., purchase of
more efficient appli-
ances, energy-saving
light bulbs, own
generation of elec-
tricity (PV), energy
service contracting
E.g., car sharing,
purchasing more
fuel-efficient cars
E.g., buying season-
al/local/ organically
produced food, pur-
chasing eco-labeled
cloths or furniture,
own production of
food
Changed De-
mand of Ener-
gy Services
Heating Electricity Mobility Consumption of
products
Figure 2 Explananda – examples for types of changed ECB.
To sum up, we propose to frame the explananda – the individual consumption behavior and its
change, respectively, as illustrated in Figure 3.
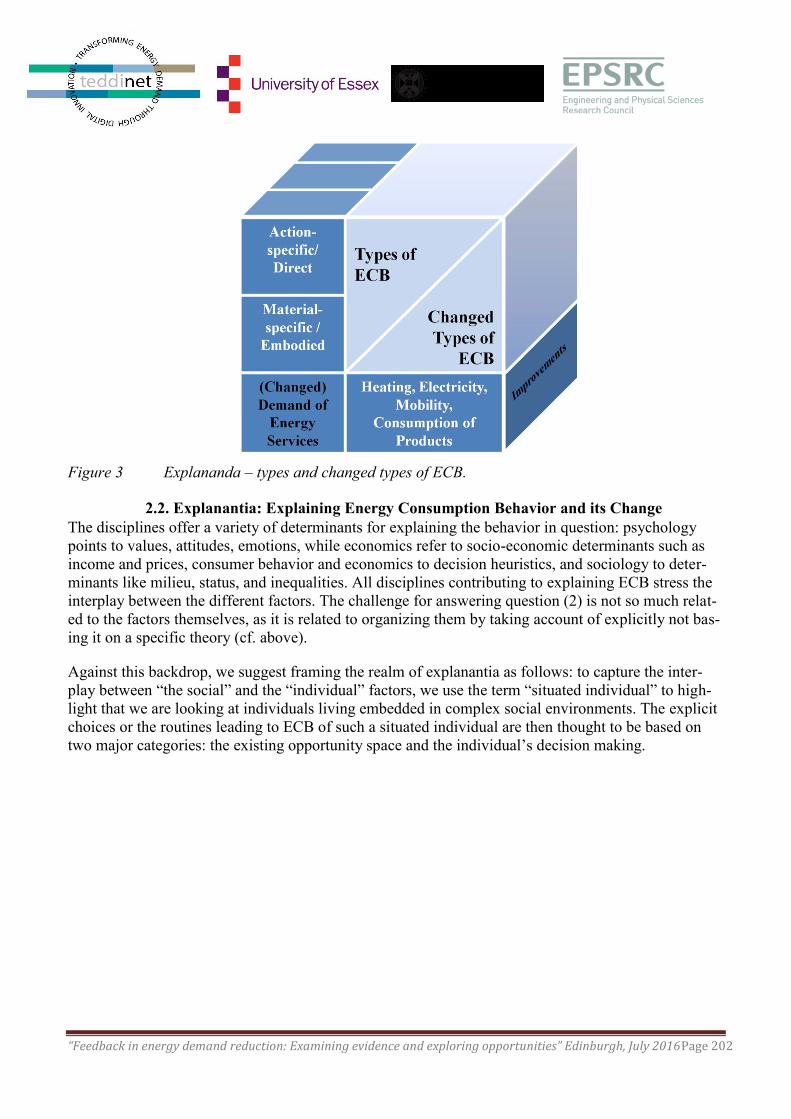
“Feedback in energy demand reduction: Examining evidence and exploring opportunities” Edinburgh, July 2016Page 202
Figure 3 Explananda – types and changed types of ECB.
2.2. Explanantia: Explaining Energy Consumption Behavior and its Change The disciplines offer a variety of determinants for explaining the behavior in question: psychology
points to values, attitudes, emotions, while economics refer to socio-economic determinants such as
income and prices, consumer behavior and economics to decision heuristics, and sociology to deter-
minants like milieu, status, and inequalities. All disciplines contributing to explaining ECB stress the
interplay between the different factors. The challenge for answering question (2) is not so much relat-
ed to the factors themselves, as it is related to organizing them by taking account of explicitly not bas-
ing it on a specific theory (cf. above).
Against this backdrop, we suggest framing the realm of explanantia as follows: to capture the inter-
play between “the social” and the “individual” factors, we use the term “situated individual” to high-
light that we are looking at individuals living embedded in complex social environments. The explicit
choices or the routines leading to ECB of such a situated individual are then thought to be based on
two major categories: the existing opportunity space and the individual’s decision making.
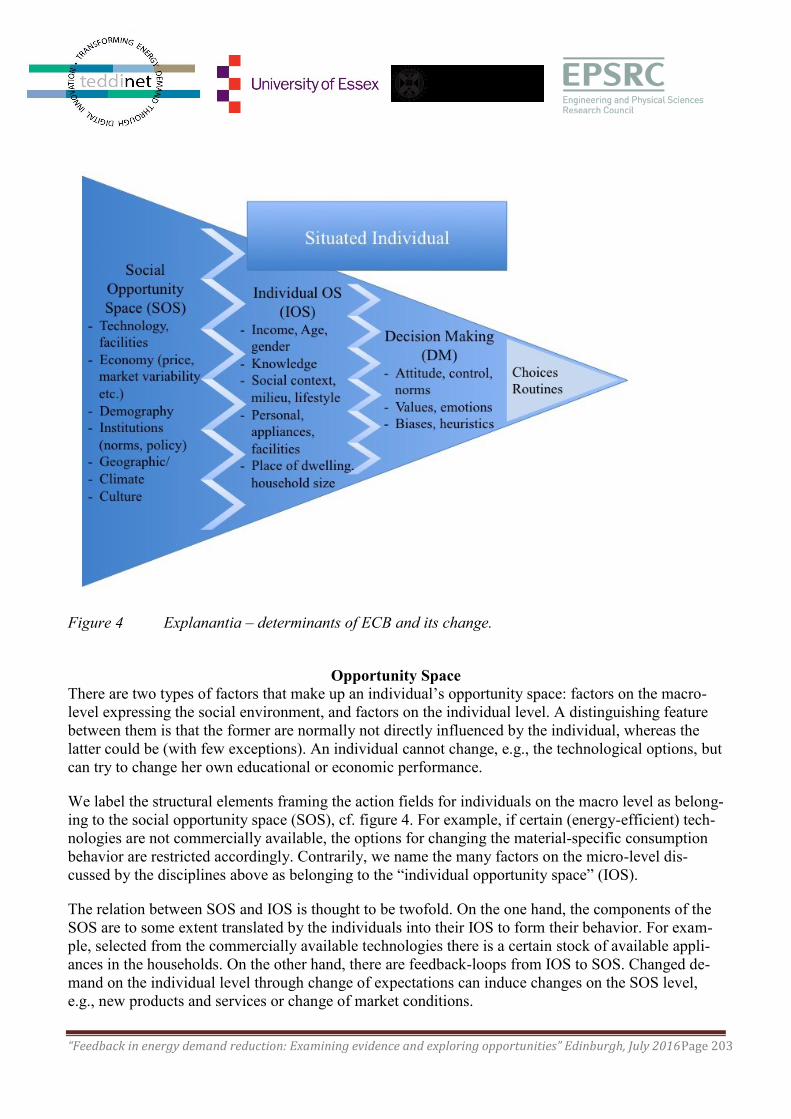
“Feedback in energy demand reduction: Examining evidence and exploring opportunities” Edinburgh, July 2016Page 203
Figure 4 Explanantia – determinants of ECB and its change.
Opportunity Space
There are two types of factors that make up an individual’s opportunity space: factors on the macro-
level expressing the social environment, and factors on the individual level. A distinguishing feature
between them is that the former are normally not directly influenced by the individual, whereas the
latter could be (with few exceptions). An individual cannot change, e.g., the technological options, but
can try to change her own educational or economic performance.
We label the structural elements framing the action fields for individuals on the macro level as belong-
ing to the social opportunity space (SOS), cf. figure 4. For example, if certain (energy-efficient) tech-
nologies are not commercially available, the options for changing the material-specific consumption
behavior are restricted accordingly. Contrarily, we name the many factors on the micro-level dis-
cussed by the disciplines above as belonging to the “individual opportunity space” (IOS).
The relation between SOS and IOS is thought to be twofold. On the one hand, the components of the
SOS are to some extent translated by the individuals into their IOS to form their behavior. For exam-
ple, selected from the commercially available technologies there is a certain stock of available appli-
ances in the households. On the other hand, there are feedback-loops from IOS to SOS. Changed de-
mand on the individual level through change of expectations can induce changes on the SOS level,
e.g., new products and services or change of market conditions.
“Feedback in energy demand reduction: Examining evidence and exploring opportunities” Edinburgh, July 2016Page 204
The SOS and IOS encompass together the realm of potential determinants of ECB as well as its
change. It is not the factor per se that will change, but how it is instantiated today. Prices will always
be determinants, but their variation leads to different behaviors. The task consists in looking at those
variations that will lead to the expected change of behavior. Moreover and as expressed by the notion
“opportunity,” it is neither the case that every single contextual factor is a necessary prerequisite in
explaining the observable ECB nor is the listing of the factors in the graph meant as being exhaustive.
Decision-Making
Given their social and IOS, individuals make specific decisions “translating” the elements within the
OS into a specific observable material- or action-specific ECB. Hence, besides the factors within the
OS, there are additionally those factors that are determinants for “decision-making”, as belief struc-
tures, value systems, attitudes, emotions, motivations, heuristics, and biases. For example, demands
for comfort, motivations like financial benefits, or environmentally friendly values and emotions
could translate the OS-factors into behavior X, whereas other determinants for decision-making could
lead to behavior Y. Thereby, we let “decision-making” encompass both – conscious choices as well as
routines, as long as the latter implicitly includes the option for choices.
That scheme of explanantia (cf. figure 4) is meant to function as a heuristic that helps to sort the com-
plexity of potential explaining factors. It is not to be confused with a sequenced model or theory, as
we already pointed out above. No causal claims have been linked to the factors within SOS and IOS
and the factors for decision-making. Causal claims have to be empirically established. We expect that
the according evidence on how the different factors in and between the three different dimensions
(SOS, IOS, and DM) “play” together will lead to a better understanding of what determines ECB and
its change. For example, constraints in the SOS might be so severe as to make it extremely costly for
an individual to act on his/her values or to react to price incentives. Similarly, the individuals’ value
system might determine how they react to common behavioral economic incentives. For example, in-
dividuals react differently to the very same economic incentive to invest in home improvements
(Stern, 1986, 2014). Thus, by starting to look into how these different dimensions interact, we expect
to get a more comprehensive explanation of ECB and its changes.
2.3 Governance of Individual Behavior Patterns
The third component of our framework deals with the governance of individual behavior, following
question (5). “Governance” is not just another word for “policy” but refers to constellations of instru-
ments, institutions, and actors that collectively shape individual action toward common goals. “Gov-
ernance of ECB” potentially includes all three dimensions politics, polity, and policy. Drawing on this
and in light of the differentiated picture of ECB as well as the multiple factors that explain the various
types of behavior and their changes, governance of ECB turns out to be a complex issue itself. It is not
merely about the proper design of single policy instruments addressing particular factors. Rather, gov-
ernance is about the design of complex instrumental arrangements that address different factors in a
coordinated way. These instrumental arrangements are themselves created and enacted by institution-
ally embedded collective actors (i.e., not only the state but also business and civil society) affecting
the design and implementation of instruments as well as their legitimacy and effectiveness. Questions
to be answered then include: who (what constellation of actors) is governing, under which conditions
(institutional setting) with what means (set of policy instruments) to address which determining fac-
tors of which type of individual energy-related behavior? These basic questions can orient both the
empirical analysis of existing governance arrangements and the design of practical governance
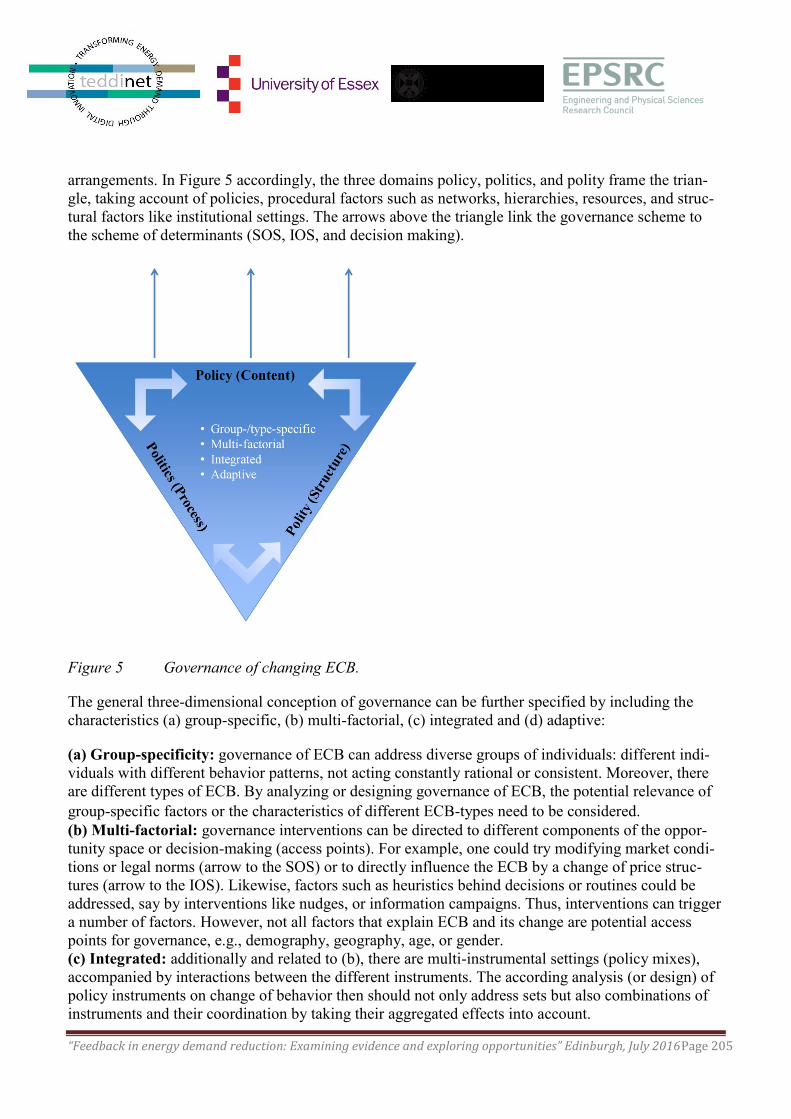
“Feedback in energy demand reduction: Examining evidence and exploring opportunities” Edinburgh, July 2016Page 205
arrangements. In Figure 5 accordingly, the three domains policy, politics, and polity frame the trian-
gle, taking account of policies, procedural factors such as networks, hierarchies, resources, and struc-
tural factors like institutional settings. The arrows above the triangle link the governance scheme to
the scheme of determinants (SOS, IOS, and decision making).
Figure 5 Governance of changing ECB.
The general three-dimensional conception of governance can be further specified by including the
characteristics (a) group-specific, (b) multi-factorial, (c) integrated and (d) adaptive:
(a) Group-specificity: governance of ECB can address diverse groups of individuals: different indi-
viduals with different behavior patterns, not acting constantly rational or consistent. Moreover, there
are different types of ECB. By analyzing or designing governance of ECB, the potential relevance of
group-specific factors or the characteristics of different ECB-types need to be considered.
(b) Multi-factorial: governance interventions can be directed to different components of the oppor-
tunity space or decision-making (access points). For example, one could try modifying market condi-
tions or legal norms (arrow to the SOS) or to directly influence the ECB by a change of price struc-
tures (arrow to the IOS). Likewise, factors such as heuristics behind decisions or routines could be
addressed, say by interventions like nudges, or information campaigns. Thus, interventions can trigger
a number of factors. However, not all factors that explain ECB and its change are potential access
points for governance, e.g., demography, geography, age, or gender.
(c) Integrated: additionally and related to (b), there are multi-instrumental settings (policy mixes),
accompanied by interactions between the different instruments. The according analysis (or design) of
policy instruments on change of behavior then should not only address sets but also combinations of
instruments and their coordination by taking their aggregated effects into account.
“Feedback in energy demand reduction: Examining evidence and exploring opportunities” Edinburgh, July 2016Page 206
(d) Adaptive: current patterns of ECB are the result of a certain incumbent governance regime and
changing ECB requires its transformation. As individual behavior can only be changed step by step
and as attempts of governing energy-related behavior are embedded in complex societal situations that
include many options for unexpected development and side effects, governance of change is an ongo-
ing task. Analytically, it requires including uncertainty and the capacities for on-going adaptive forms
of governance.
Put in a nutshell, “governance” offers a differentiated set of categories for analyzing the steering side
of change of ECB. It directs the researcher to taking account of the different dimensions of govern-
ance, of different groups and types of behavior as well as the variety of explaining factors, and re-
quirements of integration and adaptability. It provides a conceptual basis, which allows looking at
which type of governance arrangements has the potential to influence which type of determinants to
get which type of change of behavior. Which factors are really relevant in what fields of change of
ECB has to be established empirically.
Besides, the question of desirability or legitimacy arises. The “bossy state” telling citizens how to be-
have or how to change behavior and leaving the individual with only restricted choices is rarely com-
patible with a liberal stand. Likewise, scientists can certainly not prescribe how individuals should
live their lives. Is there something like a liberal paternalism expressed for example in nudging efforts?
In any case, research on governance of change of behavior needs to be accompanied by scrutinizing
the legitimacy of such governance.
3. Synthesis and Outlook
Putting the three pieces together then, we come to the overall framework as illustrated in Figure 6.
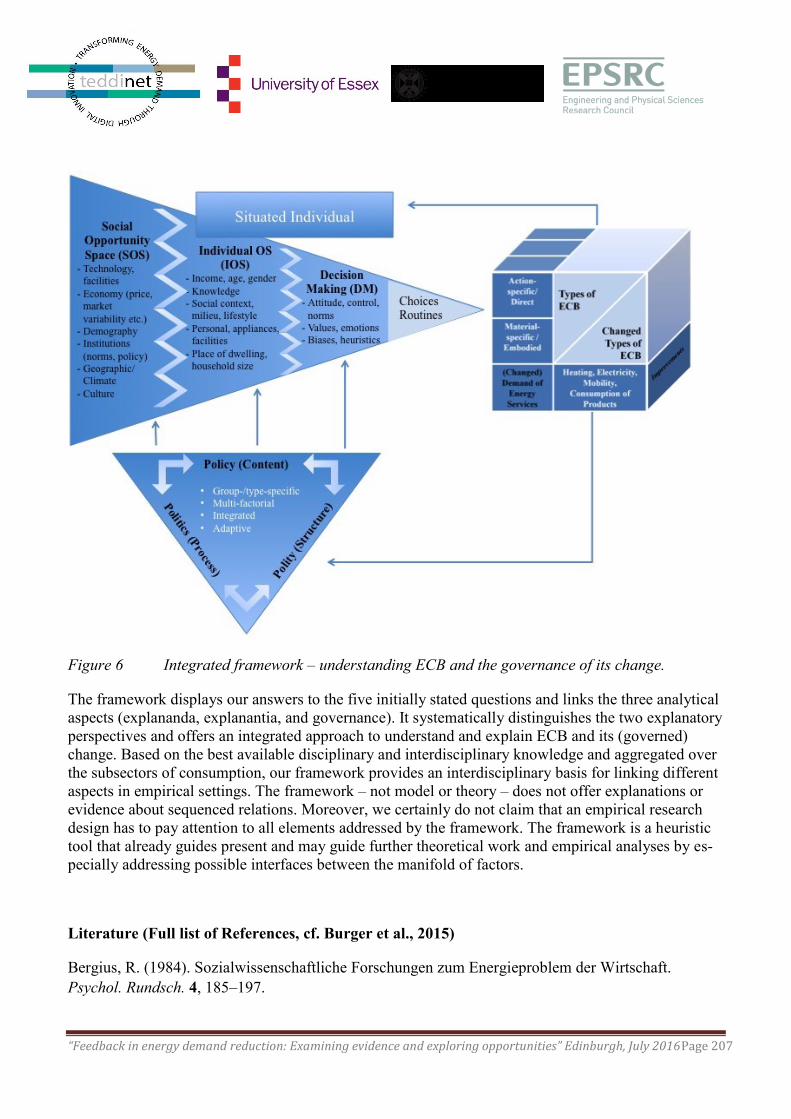
“Feedback in energy demand reduction: Examining evidence and exploring opportunities” Edinburgh, July 2016Page 207
Figure 6 Integrated framework – understanding ECB and the governance of its change.
The framework displays our answers to the five initially stated questions and links the three analytical
aspects (explananda, explanantia, and governance). It systematically distinguishes the two explanatory
perspectives and offers an integrated approach to understand and explain ECB and its (governed)
change. Based on the best available disciplinary and interdisciplinary knowledge and aggregated over
the subsectors of consumption, our framework provides an interdisciplinary basis for linking different
aspects in empirical settings. The framework – not model or theory – does not offer explanations or
evidence about sequenced relations. Moreover, we certainly do not claim that an empirical research
design has to pay attention to all elements addressed by the framework. The framework is a heuristic
tool that already guides present and may guide further theoretical work and empirical analyses by es-
pecially addressing possible interfaces between the manifold of factors.
Literature (Full list of References, cf. Burger et al., 2015)
Bergius, R. (1984). Sozialwissenschaftliche Forschungen zum Energieproblem der Wirtschaft.
Psychol. Rundsch. 4, 185–197.
“Feedback in energy demand reduction: Examining evidence and exploring opportunities” Edinburgh, July 2016Page 208
BFE. (2013). Analyse des schweizerischen Energieverbrauchs 2000-2012 nach Verwendungszwecken.
Authors: Prognos, Infras, TEP Energy. Bern: BFE.
Burger et al., (2015). Advances in understanding energy consumption behavior and the governance of
its change – Outline of an integrated framework. Frontiers in Energy Research, 3, 29.
Darnton, A. (2008). Reference Report: An Overview of Behaviour Change Models and Their Uses:
Government Social Research Behaviour Change Knowledge Review, London.
Dholakia, R. R., Dholakia, N., and Firat, A. F. (1983). From social psychology to political economy: a
model of energy use behavior. J. Econ. Psychol. 3, 231–247. doi:10.1016/0167-4870(83)90004-1
Hitchcock, G. (1993). An integrated framework for energy use and behaviour in the domestic sector.
Energy Build. 20, 151–157. doi:10.1016/0378-7788(93)90006-G
Karatasou, S., Laskari, M., and Santamouris, M. (2014). Models of behavior change and residential
energy use: a review of research directions and findings for behavior-based energy efficiency. Adv.
Build. Energy Res. 8(2), 137–147. doi:10.1080/17512549.2013.809275
Keirstead, J. (2006). Evaluating the applicability of integrated domestic energy consumption
frameworks in the UK. Energy Policy 34, 3065–3077. doi:10.1016/j.enpol.2005.06.004
Mourik, R., and Rotmann, S. (2013). “Closing the loop – behaviour change in dsm: from theory to
practice,” in Analysis of case studies IEA DSM Task 24. Deliverable 2 for IEA Implementing
Agreement DSM Task 24. Paris: International Energy Agency.
Shove, E. (2003). Converging conventions of comfort, cleanliness and convenience. J. Consum.
Policy 26, 395–418. doi:10.1023/A:1026362829781
Stephenson, J., Barton, B., Carrington, G., Gnoth, D., Lawson, R., and Thorsnes, P. (2010). Energy
cultures: a framework for understanding energy behaviours. Energy Policy 38, 6120–6129.
doi:10.1016/j.enpol.2010.05.069
Stern, P. C. (1986). Blind spots in policy analysis: what economics doesn’t say about energy use. J.
Policy Anal. Manag. 5, 200–227. doi:10.1002/pam.4050050202
Wilk, R. (2002). Consumption, human needs, and global environmental change. Global
Environmental Change 12(1), 5–13. doi:10.1016/S0959-3780(01)00028-0
Wilson, C., and Dowlatabadi, H. (2007). Models of decision making and residential energy use. Annu.
Rev. Environ. Resour. 32, 169–203. doi:10.1146/annurev. energy.32.053006.141137
“Feedback in energy demand reduction: Examining evidence and exploring opportunities” Edinburgh, July 2016Page 209
Beyond calorie counting: What can energy feedback learn from weight loss pro-
grams?
Michelle Shipworth, UCL Energy Institute, University College London, [email protected]
Abstract
Losing weight used to be seen as an exercise in counting calories and limiting their intake. This re-
quired knowing the calorie content of each food ingested, with dieters referring to reference materials
on the calorie content of foods. One problem with the calorie counting approach is the difficulty of
measuring the effect of different foods on the body, since the body does not absorb all the calories
present in some foods. Another problem is the different "value for calories" in different foods; some
calories come in foods that are nutrient rich, while others are "empty" of goodness. Moreover, gov-
ernments are increasingly abandoning a calorie-counting approach to weight loss, using instead cul-
turally relevant food based dietary guidelines, such as images of healthy meals on plates. These com-
municate graphically what a healthy meal looks like. Finally, anti-obesity policies are now exploring
how "obesogenic environments" may be creating conditions that make it extremely difficult for indi-
viduals to lose weight. This paper explores the possibilities and difficulties of energy demand reduc-
tion programs learning from weight loss programs.
Extended abstract
In the 1980s, weight loss programs focused on counting calories, different ways of explaining the cal-
orie content of food and targeted individuals with clear weight problems (Wing et al 2012). This ap-
proach required knowing the calorie content of each food ingested, with dieters referring to reference
materials on the calorie content of foods.
The difficulty of measuring the effect of different foods on the body is one problem with the calorie
counting approach. The system used for determining the energy value of foods, founded over a centu-
ry ago by Atwater at the US Department of Agriculture, has been found to significantly mis-estimate
the available calorie content of some foods and over-estimate the available calorie content of almonds
by 32% (Novotny et al 2012). One reason for this is the amount of energy it takes to digest food. Barr
& Wright (2010) have shown that digesting a whole-food meal consumes 20% of energy available in
the meal whereas digesting processed food consumes only 11% of meal energy. It takes twice as much
energy to digest protein as carbohydrate and protein also reduces hunger more effectively (Acheson et
al 2011). In energy demand reduction, we are a long way short of providing the equivalent of a rea-
sonably accurate calorie counter reference. Even though households may know whether their overall
"calorie intake" is increasing or decreasing, they don't know what actions by which members of the
household are making a difference. Even if it were possible to provide a reference akin to a calorie
counter, there are reasons beyond the difficulty of measuring calorie intake for calorie counting falling
out of favour as a weight loss tool.
The different "value for calories" in different foods is another reason for calorie counting falling out of
favour; some calories come in foods that are nutrient rich, while others are "empty" of goodness. Even
Weight Watchers has decided that calorie counting is unhelpful given that not all calories are created
equal (Sachs 2011). For instance, whereas "trans fatty acids from partially hydrogenated vegetable oils
have clear adverse effects and should be eliminated… polyunsaturated fatty acids are essential and
“Feedback in energy demand reduction: Examining evidence and exploring opportunities” Edinburgh, July 2016Page 210
reduce risk of heart disease…(so) increasing intakes of nuts, fish, soy products and nonhydrogenated
vegetable oils will improve the mix of fatty acids and have a markedly beneficial effect on rates of
CHD (coronary heart disease) (Willett 2012 p.13). Analogous to different foods are the different spe-
cific services provided by a kWh. A kWh consumed by using a mobile phone to surf the web may
provide more value than a kWh consumed by leaving the hall light on overnight, suggesting the possi-
bility of energy saving programs targeting low value kWh savings. Unfortunately, unlike "value for
calorie", "value per kWh" varies enormously depending on the specific technology providing the ser-
vice, the person receiving the service and when and where the service is provided.
It is also difficult to consistently count calories. It requires a lot of individual motivation, is complicat-
ed and time consuming and not easily accommodated in everyday shopping, cooking and eating hab-
its. These problems reflect those found in studies of the use of energy feedback devices, which fre-
quently fail to live up to the energy reduction expectations of policy makers.
In the 1990s, weight loss programs shifted from a focus on counting calories to one on culturally rele-
vant food-based dietary guidelines. Nutrient requirements were transformed into something individu-
als could understand and act on to achieve healthy weight an good health (Dwyer 2012, Weisell & Al-
bert 2012). Food pyramids and healthy eating plates abounded; these communicate graphically what a
healthy meal or diet looks like. Calorie counting was increasingly seen as a tool appropriate for use by
health experts and the small minority of individuals particularly motivated to control their weight. Ex-
amples of food-based dietary guidelines include the NHS "eatwell plate" and the Harvard School of
Public Health "healthy eating plate". Physical plates with imagery have also been developed to help
with portion control and food selection at mealtimes. These images and physical support tools are easy
to use when engaged in the everyday routine of eating meals. The content of these communications
shifted to culturally relevant social routines (e.g. meals), but the target of the campaigns remained in-
dividual behaviour change, although more recently there are arguments to further target the approach
and visuals to particular groups in societies (Hawkes 2015, Montagnese et al 2015). Is there a role for
a "healthy eating plate" of energy demand services? What would this look like?
Pullinger et al 2014 outline the EPSRC TEDDINET funded IDEAL project (Intelligent Domestic En-
ergy Advice Loop (March 2013-March 2017), which aims to use disaggregated smart meter data to
provide tailored feedback informed by social practice theory. Citing Spurling et al, Shove et al and
Hand et al, they outline social practice theory as investigating a specific 'entity' that can be conceptual-
ised as constituting three classes of elements: materials ("physical spaces and artefacts"), competen-
cies ("skills and know-how of the performer") and meanings. The specific elements vary over time,
according to the availability of materials and variation in "cultural and social norms". The project uses
social practice theory in two ways. Firstly, they use it to inform the understanding of different energy
consuming routines, such as space heating and washing. Secondly, they view the feedback device as
the material component of a new practice of reflecting on energy consumption. However, project out-
puts have not yet outlined what that feedback might constitute.
Shove & Royston (2014) express scepticism with such an approach, arguing that energy use is so
deeply embedded in everyday life that "it is impossible to treat energy as something that can be
stripped out from the detail of daily life. Helping people understand their energy consumption, as if
this were a topic in its own right, is therefore of limited value. Knowing just how much energy is used
in making tea, or in doing the laundry will not transform established habits and practices that are em-
bedded in the fabric of social life as we know it today…If we are to understand how people engage
“Feedback in energy demand reduction: Examining evidence and exploring opportunities” Edinburgh, July 2016Page 211
with energy systems, it is not the meter that needs to get smarter, but our understanding of what ener-
gy is for and how it is used."
In the 2010s, although individual behaviour is still considered important in weight loss programs, obe-
sity programs increasingly include investigation of "obesogenic environments"; the physical and so-
cial environment creating conditions that make it extremely difficult for individuals to lose weight
(Roberto et al 2015; Government Office for Science 2007).
"Calorie-focused thinking may have already exacerbated the epidemics of obesity and related
diseases….Yes, calories count, and calorie balance sheets matter, but net intake or expenditure
probably results more from qualitative distinctions in the foods we eat than conscious attempts
at quantitative control. New public health initiatives and messages focused on encouraging con-
sumption of whole/minimally processed foods would be ideal, especially to counteract industry's
near-exclusive marketing of foods that are highly processed/refined and concentrated sources of
the most rapidly absorbable starches and sugars. Promoting the consumption of whole foods will
require careful attention to food systems, cultural traditions, peer influences, food environments,
assistance programmes and a host of other issues beyond the scope of the present commentary."
(Lucan & DiNicolantonio 2015 p.577, emphasis added)
Likewise, energy demand research informed by theories from science and technology studies finds
that the built and technical environments can create conditions that push energy consumption up. An-
thropological studies have found similar social drivers for energy consumption. Shove (2015, p.40)
argues that consumers are not necessarily "both willing and able to modify the timing of what they do
[given] the extent to which daily rhythms are socially, and not individually, orchestrat-
ed…Understanding the potential for rescheduling the timing of energy demand arguably depends on
much better understanding of the social ordering and orchestration of daily life…[including] standard-
ised working hours - a patterning that generates spikes and peaks of demand when people return
home, an in the morning before they set off for work." She argues that the focus needs to shift to the
range of public policies that impact on this temporal ordering, (e.g. education, employment) but also
cautions that this shift in focus is a poor fit with current policy making.
References
Acheson, K. J., Blondel-Lubrano, A., Oguey-Araymon, S., Beaumont, M., Emady-Azar, S., Ammon-
Zufferey, C., Monnard, I., Pinaud, S., Nielsen-Moennoz, C. and Bovetto, L. (2011) Protein
choices targeting thermogenesis and metabolism, American Journal of Clinical Nutrition,
93(3), 525-534, Available from: <Go to ISI>://WOS:000287475000010.
Barr, S. B. and Wright, J. C. (2010) Postprandial energy expenditure in whole-food and processed-
food meals: implications for daily energy expenditure, Food & Nutrition Research, 54,
10.3402/fnr.v54i0.5144, Available from:
http://www.ncbi.nlm.nih.gov/pmc/articles/PMC2897733/.
Dwyer, J. T. (2012) Dietary standards and guidelines: similarities and differences among countries in
Jr, J. W. E., Macdonald, I. A. and Zeisel, S. H., (eds): Present Knowledge in Nutrition, Tenth
Edition, John Wiley & Sons, Available from:
http://is.muni.cz/el/1411/jaro2013/BVAJ0222/um/39181669/39181807/Present_Knowledge_in
_Nutrition__10th_Ed_.pdf.
Government Office for Science, Butland, B., Jebb, S., Kopelman, P., McPherson, K., Thomas, S.,
Mardell, J. and Parry, V. (2007) FORESIGHT Tackling Obesities: Future Choices – Project
“Feedback in energy demand reduction: Examining evidence and exploring opportunities” Edinburgh, July 2016Page 212
Report 2nd Edition, Department of Innovation Universities and Skills, London, Available
from:
https://www.gov.uk/government/uploads/system/uploads/attachment_data/file/287937/07-
1184x-tackling-obesities-future-choices-report.pdf.
Hawkes, C., Smith, T. G., Jewell, J., Wardle, J., Hammond, R. A., Friel, S., Thow, A. M. and Kain, J.
(2015) Smart food policies for obesity prevention, The Lancet, 385(9985), 2410-2421, Availa-
ble from: http://www.sciencedirect.com/science/article/pii/S0140673614617451 [Accessed
2015/6/19/].
Lucan, S. C. and DiNicolantonio, J. J. (2015) How calorie-focused thinking about obesity and related
diseases may mislead and harm public health. An alternative., Public Health Nutrition, 18(4),
571-81.
Malhotra, A., DiNicolantonio, J. J. and Capewell, S. (2015) It is time to stop counting calories, and
time instead to promote dietary changes that substantially and rapidly reduce cardiovascular
morbidity and mortality, Open Heart, 2(1), Available from:
http://openheart.bmj.com/content/2/1/e000273.short.
Montagnese, C., Santarpia, L., Buonifacio, M., Nardelli, A., Caldara, A. R., Silvestri, E., Contaldo, F.
and Pasanisi, F. (2015) European food-based dietary guidelines: A comparison and update, Nu-
trition, 31(7–8), 908-915, Available from:
http://www.sciencedirect.com/science/article/pii/S0899900715000076 [Accessed 2015/8//].
Novotny, J. A., Gebauer, S. K. and Baer, D. J. (2012) Discrepancy between the Atwater factor predict-
ed and empirically measured energy values of almonds in human diets, The American Journal
of Clinical Nutrition, Available from:
http://ajcn.nutrition.org/content/early/2012/06/28/ajcn.112.035782.abstract.
Pullinger, M., Lovell, H. and Webb, J. (2014) Influencing household energy practices: a critical review
of UK smart metering standards and commercial feedback devices, Technology Analysis &
Strategic Management, 26(10), 1144-1162, Available from:
http://www.tandfonline.com/doi/pdf/10.1080/09537325.2014.977245.
Roberto, C. A., Swinburn, B., Hawkes, C., Huang, T. T. K., Costa, S. A., Ashe, M., Zwicker, L., Caw-
ley, J. H. and Brownell, K. D. (2015) Patchy progress on obesity prevention: emerging exam-
ples, entrenched barriers, and new thinking, The Lancet, 385(9985), 2400-2409, Available
from: http://www.sciencedirect.com/science/article/pii/S014067361461744X [Accessed
2015/6/19/].
Sachs, A. (2011) Weight Watchers Dieters Can Have a Free Lunch? Why Weight Watchers is letting
people eat fruit with abandon, Time Magazine, Available from:
http://content.time.com/time/magazine/article/0,9171,2042344,00.html.
Shove, E. (2015) Linking low carbon policy and social practice in Strengers, Y. and Maller, C., (eds):
Social Practices, Interventions and Sustainability: Beyond Behaviour Change, Routledge, Ab-
ingdon, Oxon, UK, 31-44.
Shove, E. and Royston, S. (2014) Smart meters don't make us any smarter about energy use, The Con-
versation, Available from: https://theconversation.com/smart-meters-dont-make-us-any-
smarter-about-energy-use-23057.
Weisell, R. and Albert, J. (2012) The role of United Nations agencies in establishing international die-
tary standards in Jr, J. W. E., Macdonald, I. A. and Zeisel, S. H., (eds): Present Knowledge in
Nutrition, Tenth Edition, John Wiley & Sons, Available from:
http://is.muni.cz/el/1411/jaro2013/BVAJ0222/um/39181669/39181807/Present_Knowledge_in
_Nutrition__10th_Ed_.pdf.
Willett, W. C. (2012) Dietary fats and coronary heart disease, Journal of Internal Medicine, 272(1),
13-24, Available from: <Go to ISI>://WOS:000305510600002.

“Feedback in energy demand reduction: Examining evidence and exploring opportunities” Edinburgh, July 2016Page 213
Wing, R. R., Gorin, A. and Tate, D. F. (2012) Strategies for changing eating and exercise behaviour to
promote weight loss and maintenance in Jr, J. W. E., Macdonald, I. A. and Zeisel, S. H., (eds):
Present Knowledge in Nutrition, Tenth Edition, John Wiley & Sons, Available from:
http://is.muni.cz/el/1411/jaro2013/BVAJ0222/um/39181669/39181807/Present_Knowledge_in
_Nutrition__10th_Ed_.pdf.
“Feedback in energy demand reduction: Examining evidence and exploring opportunities” Edinburgh, July 2016Page 214
SESSION 5A: Communities & Collectives
Householder engagement with energy consumption feedback: The role of
community action and communications
Kevin Burchell*, Ruth Rettie and Thomas C Roberts
* Policy Studies Institute, University of Westminster
This abstract is based on the published paper:
Burchell, K., Rettie, R. and Roberts, T (2016) Householder engagement with energy consumption
feedback: the role of community action and communications. Energy Policy, 88:78–186.
Abstract
The provision of energy consumption feedback on in-home displays (IHDs) has a prominent role in
government strategies for domestic energy demand reduction. Research suggests that IHDs can
support energy consumption reduction, but also that engagement with IHDs is: not appealing to many
householders (because it data-oriented and insufficiently relevant to everyday life), is often short-term,
can be limited to one household member (leading to conflict), often seems to reinforce existing
practices and can be difficult to convert into demand reduction. In this paper, we draw on research
carried out in a project called Smart Communities. This study was distinctive because the energy
consumption feedback was: accompanied by a weekly email communications programme that
emphasised consumption monitoring and engagement with the feedback, provided within the context
of a programme of local community action (such as workshops and other events) and implemented
over two years. Thus, while many feedback projects focus on content, this study emphasises the
importance of context. Project findings suggest that, although by no means panaceas, approaches such
as these can support long-term engagement with energy consumption feedback and can support
behaviour change. The community action was important because it promoted a valuable sense of
‘being part of something’ among participants. The email programme was important because it
prompted action and engagement, and because it led to a sense of ‘working together, but apart’ among
the participants who were not involved in the community action activities. The importance of the
local, informal, friendly and supportive tone of the emails cannot be over-emphasised. In our
discussion, we suggest that what our work did was render feedback relevant to everyday life, we
discuss ways in which the insights from this work might support large-scale energy consumption
feedback programmes, and we encourage policy-makers to start planning future app-based feedback
platforms.
“Feedback in energy demand reduction: Examining evidence and exploring opportunities” Edinburgh, July 2016Page 215
Transforming Feedback into Collective Knowledge
Lara Schibelsky Godoy Piccolo*, Harith Alani
Knowledge Media Institute, The Open University
Milton Keynes, UK
{lara.piccolo, h.alani}@open.ac.uk
Abstract
Energy feedback can assume a strategic role in energy policies to promote energy conservation in
large scale. But it is well known from the literature that feedback alone does not always lead to
energy savings in domestic environment. People usually need more specific guidance on how to
change their behaviour in an effective and sustainable way, reflecting their own values and cir-
cumstances. Based on this assumption, this research considers energy consumption feedback as a
learning element part of a 3-steps process: i) self-perception - people first need to understand
their values and motivations to save energy; ii) understand consumption - become aware of how
they are using electricity, opportunities to change habits and behaviour, and impact of their con-
sumption; iii) collective knowledge - promoting dialogue and collaboration to define best practic-
es and engage people with energy conservation as a social issue. In this abstract, we describe the
tools we have applied to develop this process and summarise the feedback received from a group
of community leaders in the UK working on promoting energy savings. Results point out that fa-
miliarity with technology may be a strong barrier for people to adopt and make sense of energy
feedback. And suggests that tools to mediate discussions around energy savings can help over-
coming this barrier that prevents people’s engagement. By bridging the gap between strongly mo-
tivated people and the more technically skilled ones, we are able to transform feedback info r-
mation into collective knowledge.
1. Introduction
As one of the humanity development foundations, electricity keeps challenge science both in technical and social aspects. Many technical innovations still rely on individuals’ adoption and behaviour change to be successful 0. Finding the right strategies to engage people with the energy issue, though, has proven to be a complex task. Some people might be indifferent to the issue, but many recognise the need to rethink the way energy has been consumed or generated. Even so, a number of barriers, many already identified in literature, may prevent changes in behaviour towards energy conservation.
Although ubiquitous, energy is also invisible. A diversity of feedback technology has been made avail-able to bring energy to a more “tangible” and measurable dimension. But several experiences, both in literature and also in our research have proven that just providing feedback is not enough for engaging people with energy conservation as a social issue 00. Cultural aspects, social norms, energy regulation, design of appliances, the relationship with energy suppliers, are examples of the multitude of forces that influence the way people perceive energy and make sense of the feedback, when it is provided.
To cope with these “social” variables, in the context of the project DecarboNet27
, we rely on dialogue and collaboration as social dynamics to engage people with energy conservation as a social issue. As
27
DecarboNet (www.decarbonet.eu) funded by the European Commission focused on raising awareness of climate change.
“Feedback in energy demand reduction: Examining evidence and exploring opportunities” Edinburgh, July 2016Page 216
part of our Energy Trial, we have developed tangible artefacts 00 and an online platform 0 to mediate discussions around energy consumption within social groups, as explained as follows.
After describing our tools, in this abstract we summarise results of the feedback provided by communi-ty leaders in the UK on how the tools and strategies could be applied to support their existing energy saving campaigns. We then conclude the abstract with some main findings, and pointing out on going and future works.
2. Towards building collective knowledge
As reported in 0, we propose a 3-steps strategy mediated by a set of tools to trigger discussions and col-laboration around energy saving:
1) Developing self-perception is the first step, supported by the paper tool Value Tree. It aims to leverage personal and group values, identifying then the forces that lead or prevent people in this group from saving energy.
2) The second step involves the House Mapping tool, another paper-based artefact to help people understand their own consumption at the appliances level, and to identify opportunities for savings. Energy consumption feedback is also provided in this step for people to evaluate the impact of current energy-related habits.
3) Once this individual knowledge is developed, we introduce the EnergyUse, an online space to share energy saving experiences and to build knowledge collectively.
This process was built taking into account a set of guidelines that summarises lessons learned from the literature and from our previous studies 0:
Apply energy monitors as learning tools: we are relying on smart plugs for people to learn how to configure appliances efficiently, quantifying benefits of shutting-down or unplugging devices, quantifying costs of daily actions, etc. 0.
Create mechanisms and strategies for sharing personal experiences: instead of focusing on providing general recommendations for reducing energy consumption, we expect people to build knowledge collectively by sharing stories and experiences.
Promote emotional (not only rational) involvement: people must feel confortable to evaluate and discuss the trade-off between environmentally friendly choices and individual values, such as com-fort, security, and so on. Discussions and negotiation among people in a social group have been en-couraged to come up with concrete possibilities to save energy.
The tangible and online artefacts that mediate this process are described in the next subsections.
2.1 Tangible artefacts
Components of the DecarboNet Utility Toolkit 0, the tangible artefacts Value Tree and House Mapping
were designed to mediate activities in the domestic context towards energy conservation 0. Value Tree
aims at linking personal values with environmental commitment and energy usage, thus creating a
shared understanding within a group of users, usually a family. Group members list 5 personal values
regarding the environment and energy, such as protection, comfort, etc. Then they negotiate and agree
on a final list of the 5 main values to be represented in their collective tree.
For the House Mapping, participants are invited to draw the layout of their house, considering all the
energy points and appliances. They start from the room each person feels most comfortable in. Once
the mapping is complete, participants apply the Mood Tokens on the top of the map. The tokens
represent the feelings related to how energy is consumed there ranging from very good (happy) to
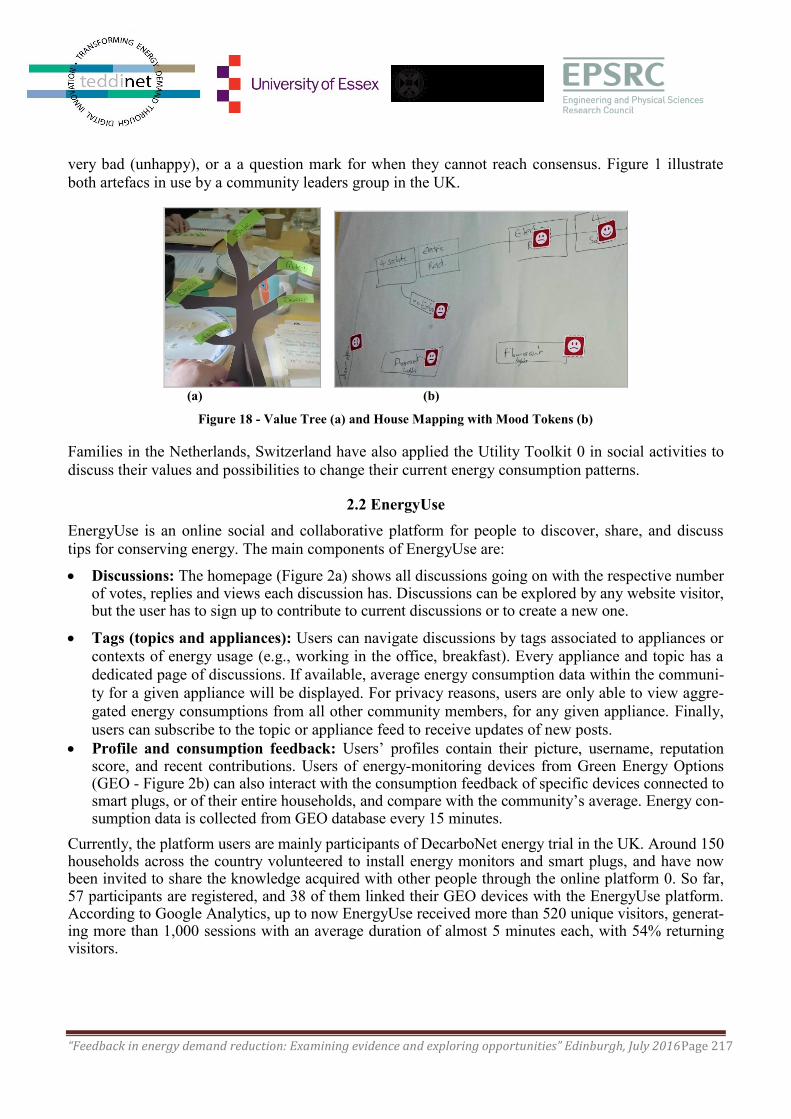
“Feedback in energy demand reduction: Examining evidence and exploring opportunities” Edinburgh, July 2016Page 217
very bad (unhappy), or a a question mark for when they cannot reach consensus. Figure 1 illustrate
both artefacs in use by a community leaders group in the UK.
(a) (b)
Figure 18 - Value Tree (a) and House Mapping with Mood Tokens (b)
Families in the Netherlands, Switzerland have also applied the Utility Toolkit 0 in social activities to
discuss their values and possibilities to change their current energy consumption patterns.
2.2 EnergyUse
EnergyUse is an online social and collaborative platform for people to discover, share, and discuss
tips for conserving energy. The main components of EnergyUse are:
Discussions: The homepage (Figure 2a) shows all discussions going on with the respective number of votes, replies and views each discussion has. Discussions can be explored by any website visitor, but the user has to sign up to contribute to current discussions or to create a new one.
Tags (topics and appliances): Users can navigate discussions by tags associated to appliances or
contexts of energy usage (e.g., working in the office, breakfast). Every appliance and topic has a
dedicated page of discussions. If available, average energy consumption data within the communi-
ty for a given appliance will be displayed. For privacy reasons, users are only able to view aggre-
gated energy consumptions from all other community members, for any given appliance. Finally,
users can subscribe to the topic or appliance feed to receive updates of new posts.
Profile and consumption feedback: Users’ profiles contain their picture, username, reputation score, and recent contributions. Users of energy-monitoring devices from Green Energy Options (GEO - Figure 2b) can also interact with the consumption feedback of specific devices connected to smart plugs, or of their entire households, and compare with the community’s average. Energy con-sumption data is collected from GEO database every 15 minutes.
Currently, the platform users are mainly participants of DecarboNet energy trial in the UK. Around 150 households across the country volunteered to install energy monitors and smart plugs, and have now been invited to share the knowledge acquired with other people through the online platform 0. So far, 57 participants are registered, and 38 of them linked their GEO devices with the EnergyUse platform. According to Google Analytics, up to now EnergyUse received more than 520 unique visitors, generat-ing more than 1,000 sessions with an average duration of almost 5 minutes each, with 54% returning visitors.
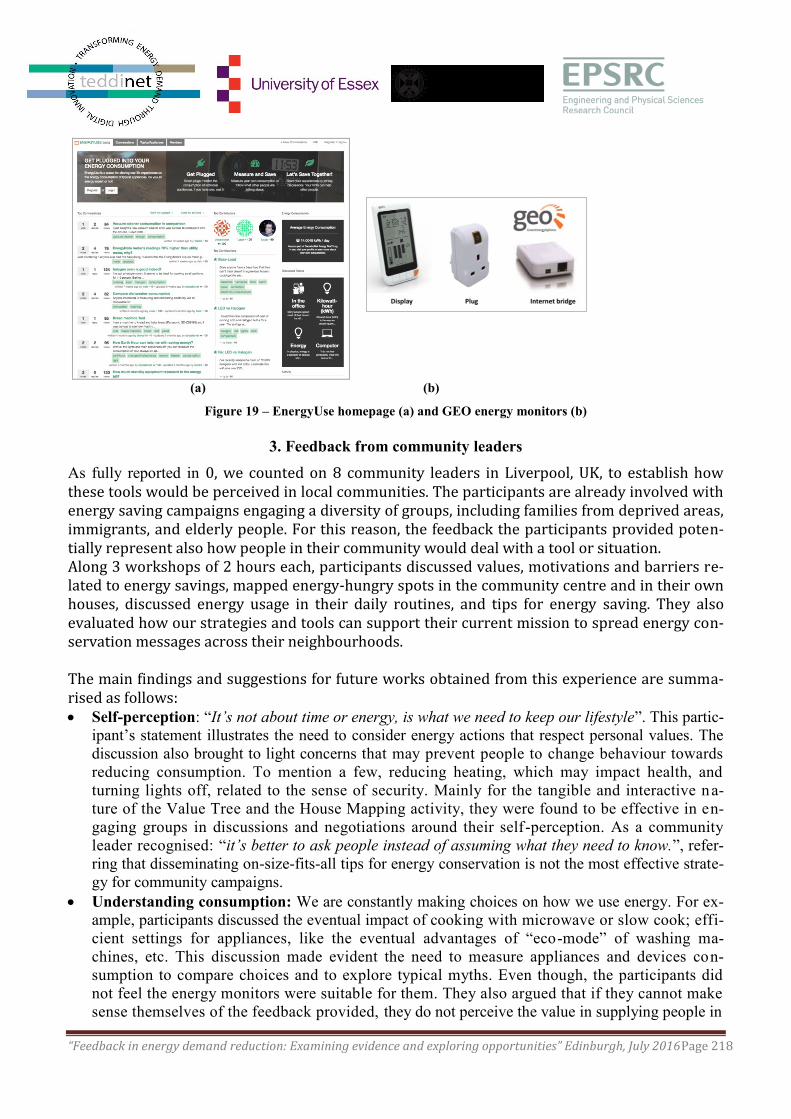
“Feedback in energy demand reduction: Examining evidence and exploring opportunities” Edinburgh, July 2016Page 218
(a) (b)
Figure 19 – EnergyUse homepage (a) and GEO energy monitors (b)
3. Feedback from community leaders
As fully reported in 0, we counted on 8 community leaders in Liverpool, UK, to establish how these tools would be perceived in local communities. The participants are already involved with energy saving campaigns engaging a diversity of groups, including families from deprived areas, immigrants, and elderly people. For this reason, the feedback the participants provided poten-tially represent also how people in their community would deal with a tool or situation. Along 3 workshops of 2 hours each, participants discussed values, motivations and barriers re-lated to energy savings, mapped energy-hungry spots in the community centre and in their own houses, discussed energy usage in their daily routines, and tips for energy saving. They also evaluated how our strategies and tools can support their current mission to spread energy con-servation messages across their neighbourhoods. The main findings and suggestions for future works obtained from this experience are summa-rised as follows: Self-perception: “It’s not about time or energy, is what we need to keep our lifestyle”. This partic-
ipant’s statement illustrates the need to consider energy actions that respect personal values. The
discussion also brought to light concerns that may prevent people to change behaviour towards
reducing consumption. To mention a few, reducing heating, which may impact health, and
turning lights off, related to the sense of security. Mainly for the tangible and interactive na-
ture of the Value Tree and the House Mapping activity, they were found to be effective in en-
gaging groups in discussions and negotiations around their self-perception. As a community
leader recognised: “it’s better to ask people instead of assuming what they need to know.”, refer-
ring that disseminating on-size-fits-all tips for energy conservation is not the most effective strate-
gy for community campaigns.
Understanding consumption: We are constantly making choices on how we use energy. For ex-
ample, participants discussed the eventual impact of cooking with microwave or slow cook; effi-
cient settings for appliances, like the eventual advantages of “eco-mode” of washing ma-
chines, etc. This discussion made evident the need to measure appliances and devices con-
sumption to compare choices and to explore typical myths. Even though, the participants did
not feel the energy monitors were suitable for them. They also argued that if they cannot make
sense themselves of the feedback provided, they do not perceive the value in supplying people in
“Feedback in energy demand reduction: Examining evidence and exploring opportunities” Edinburgh, July 2016Page 219
the community with these monitors. Electricity consumption in kilowatt/hour rarely emerged as
a topic.“There’s an assumption that people know about kWh. Everything that comes out infor-
mation-wise is in that level! This is too technical!”, mentioned a participant. They preferred to
check an estimate cost online instead of measuring consumption. Money is still the main target for
making energy tangible and measurable, even though the little money associated with individual
appliance consumption was too low to raise interest. External factors, such as tariff options, deals
with energy suppliers, characteristics of buildings, appliances settings, etc. frequently dominated
the conversation.
Collective knowledge: Sharing experiences with other people is a common approach in all as-
pects of our lives. For instance, participants mentioned asking neighbours’ advise on operating
typical devices, such as boilers or thermostat in efficient way, since they are likely to have similar
equipment.
EnergyUse has the purpose of empowering technically skilled people keen to learn from feedback
devices and disseminating this experience across the community. Even though, the community
leaders considered the platform too technical in terms of content and interaction design. As a par-
ticipant clarified “open-ended question is more confusing in the end of the day. People need op-
tions or choices.”, referring to the suggestion of creating menus related to everyday activities such
as cooking, then the options of appliances related to that, rather than a forum-based format. Also,
to expand the target user group to those who are not that familiar or keen on technology, the plat-
form should evolve to support the navigation by people interested only in consuming tips, and
should target also money and tariffs. A community leader also strongly suggested offering incen-
tives to bring people to discuss energy conservation online. According to their experience “some
people have a natural desire to learn more, but [for some people] vouchers might help”.
4. Conclusion and Future works
Some preliminary results of evaluating the Energy Trial pointed out the energy monitors as valuable learning tools, but not suitable to everyone. Installing them, making sense of the feedback, and trans-forming it into alternatives to save energy require some degree of familiarity with technology, which is not a reality for many people in the society, including the community leaders involved in our research. But some people are actually skilled and keen to explore the potential of the devices. This group of us-ers should be identified, empowered, and invited to disseminate their knowledge with others.
This study also suggested that people in general usually do not spontaneously talk about energy either online or in conversations. They actually need an external motivation, a trigger to do so. The tangible artefacts applied in this study, the Value Tree and Value Map, were found to be effective in triggering discussions within social groups. DecarboNet is now expanding the energy trial inviting new users and investigating what interventions/technology is more suitable to specific group of people, considering different degrees of familiarity with technology, and levels of concern related to saving energy that goes from saving money to protect the natural environment.
5. References
EEA (European Environment Agency). “Achieving energy efficiency through behaviour change: what
does it that?” Technical Report N5/2013.
Piccolo, L., et al. (2014) Energy Consumption Awareness in the Workplace: Technical Artefacts and
Practices, Proc. of IHC ’14, 41-50.

“Feedback in energy demand reduction: Examining evidence and exploring opportunities” Edinburgh, July 2016Page 220
Piccolo, L.S.G., Baranauskas, C. Azevedo, R. (2016). A socially inspired energy feedback
technology: challenges in a developing scenario. AI & Society, pp. 1-17, Springer.
http://link.springer.com/article/10.1007/s00146-016-0653-8
Huizenga, J. et al. (2015) Shedding lights on human values: an approach to engage families with
energy conservation. INTERACT 2015, Bamberg, Springer. 210–218.
DecarboNet. Utility Toolkitt. http://www.decarbonet.eu/2014/10/10/utility-toolkit/
DecarboNet. Citizen Engagement Platform. http://Energyuse.eu
Piccolo, L. et al. (2014) Motivating online engagement and debates on energy consumption”, ACM
Web Science 2014, ACM, Bloomington, US, 109-118.
Piccolo. L. S. G and Smith, C. (2015) Designing to raise collective awareness and leverage energy
savings. British HCI '15. ACM, Lincoln. 289-290.
Piccolo, L.S. G. and Alani, H. (2016) Strategies And Tools To Raise EnergyAwareness Collectively.
Accepted for publication at BEHAVE’16 - 4th
European Conference on Behaviour and Energy
Efficiency, Coimbra. Sept, 2016.
“Feedback in energy demand reduction: Examining evidence and exploring opportunities” Edinburgh, July 2016Page 221
Social Media and Smart Phones: A way of influencing behavioral change using
feedback.
Stephenson, A. National Energy Action, Ruse, J.L. National Energy Action. Lemon, M. De-Montfort
University. Presented by Andy Stephenson – e-mail [email protected]
Abstract
Low income households face daily decisions in how they use energy. Traditionally, helping these
households to meet energy needs has been done through fabric improvements to a building alongside
advice provision. Whilst advice provision is designed to help the household manage their energy ef-
fectively, in practice the way people live in their homes or use their energy systems is sometimes ig-
nored. Truly understanding the social causes, pressures and lifestyles which can contribute to fuel
poverty can not only help devise ways of tackling the problem but can also provide households with
real information and support which can be community based. This in turn can create a more effective
management of energy and a reduction of energy consumption. This paper highlights a project that
sort to address these issues by looking at behavioural change research and then using social media as a
method of creating interaction with a competition and developing an understanding of people’s life-
styles. It shows the importance of interaction between households, a community, and those agencies
looking to deliver measures to reduce fuel poverty and the benefits that this approach can deliver.
Background
There are many people in the UK who are in Fuel Poverty. This is where a person cannot afford to
effectively keep warm in the coldest weather and often have to make a decision between heating a
house to keep warm or feeding themselves. Fuel Poverty is caused by a complex series of factors
which vary from household to household, but essentially there are three key factors that cause fuel
poverty (NEA 2016).
These being:
Increasing fuel bills
Low income
Low energy efficient housing
There are official definitions by which levels of fuel poverty are measured, in England this is by
something known as the Low Income High Cost method and in the devolved administration it is
measured by the 10% definition. At the time of writing this paper, levels of fuel poverty in England in
2013 (DECC 2015) stood at 2.73 Million households or 12% of the population and across the UK as a
whole at 4.5 Million or 17% of the population.
It should be noted though that these figures only reflect the households that fall under the definition
and that have been identified.
Energy prices are also key to levels – in 2004 the average energy bill for both gas and electricity was
£617.00 and by 2015 this had risen to £1254.0028
doubling people’s bills. Saving energy is therefore a
key part in helping people save money.
28
Figures based upon a usage of 15,000 kWh per year of gas and 3800kWh per year of electricity.
“Feedback in energy demand reduction: Examining evidence and exploring opportunities” Edinburgh, July 2016Page 222
This paper is written on the findings of a project designed to help people help themselves. It focused
on how people’s behavior towards energy could be improved over the longer term and to help them
takes actions which alongside improvements which could help reduce the potential of fuel poverty and
help keep households warm in winter. The main tool for this project was Facebook and was used not
solely to inform actions but to also to put emphasis on the ability of friends and neighbours to make
improvements.
The scheme was carried out in an area known as The Meadowell in North Tyneside. This area was
selected for several reasons. Firstly a project called Meadow Well Connected (MWC) had been look-
ing at ways over several years to help people manage resident’s fuel bills. Secondly, Meadowell is one
of the more deprived areas of the country. Ranked at 338 (DCLG 2015) on the IMD score across Eng-
land out of 6791, it falls within the 5% most deprived wards of the country. Thirdly and most im-
portantly, funding for the project was provided via North Tyneside Council and so had to be carried
out in their area.
Methodology
Given the title “Game of Homes”29
The project was designed to create a friendly competition between
households around saving energy and promoting activities. The 10 participating households were pro-
vided with energy efficiency advice from a qualified advice30
provider tailored to suit their needs. A
game card with 10 top tips31
was distributed which participants were encouraged to implement on a
daily basis and then discuss what they had done on the MWC Facebook page. Points were awarded
for each post and the number of times that an activity had been carried out. Additional points were
also awarded for carrying out measures that were not included within the tips along with savings made
to energy bills and consumption comparing previous years and initial data. The project was carried out
between the 28th
November 2015 and the 28th
February 2016. In order to ensure that households did
not just switch their heating off to reduce bills to gain extra points putting health at risk, data loggers
were installed to measure the temperatures within the properties over that period of time.
The aim of the project was to try and develop behavior change by using accessible technology. It was
designed to both show people how easy it is for them to reduce energy consumption and manage it,
and also to implement these actions themselves so they could appreciate the simplicity of it. At the
same time the scheme also developed a peer to peer support mechanism by which the methods used to
make savings were also be given to family, friends and neighbours who were not part of the scheme.
By posting on Facebook on a daily basis, the intention was that the methods they used to save energy
and the actions that they carried out became an everyday activity, embedding energy savings within
their sub-conscious and helping them to embed behavior change over the long term.
Trying to understand behaviours across a range of disciplines has been the subject of much research
and a range of differing approaches. E.g. Heiskanen, Johnson & Robinson. (2010); The European En-
vironment Agency (EEA 2012); Shove, (2003) and Davis, Campbell, Hilden, Hobbs and Mitchie
(2015).
29
The title and project concept belongs to Giacene 2015 who developed the game.
30 The advice provider was qualified to City and Guilds level 3 Energy Awareness.
31 See Box 3

“Feedback in energy demand reduction: Examining evidence and exploring opportunities” Edinburgh, July 2016Page 223
The project though focused on the findings of report carried out by the Behavioural Insights team in
the Cabinet Office on behalf of DECC This report identified three main areas that need to be consid-
ered in any scheme for people to change behaviours. These being:
1. The tendency to ‘discount the future’;
2. The power of social norms; and
3. The use of defaults
1. Discounting the future. One of the barriers to making energy efficiency improvements relates
to the fact that the benefits are accrued over a long period of time, whereas the costs associated
with them are immediate and sometimes large. People often may prefer a smaller reward today
over a larger reward in the future.
To address this, the project did not focus on high cost measures but instead focused on simple tips
and low cost items to help people make immediate savings and also show them how these savings
could accrue over a period of time giving them more certainty when managing finances.
2. Social norms. People are heavily influenced by what others around them are doing. This project
used social norms through Facebook posting to encourage the adoption of green behaviours.
3. Defaults. Individuals tend to go with the flow of pre-set options, or defaults, often regardless of
whether the pre-set options maximise their wellbeing. There is also a tendency for people to revert
Box 3 – The 10 top tips that participating households were given
1. Keep the Curtains drawn from Dusk. Do not let them fall over radiators as this will just di-
rect the heat out of the window
2. Don’t heat rooms which are not used – either turn the heating off in the room, or down it
down low
3. If you have a room thermostat, do not use the boiler stat. Leave the Boiler stat on high and
operate the temperature from the room stat. 20 degrees is the maximum it should be set at.
This keeps the house at a temperature that is comfortable and prevents cold related ill-
nesses.
4. Turn off equipment when not in use including lights, chargers, TV’s Play stations etc.
This includes turning appliance OFF standby
5. Where possible use a pressure cooker or slow cooker to cook food. The Slow Cooker uses
less energy than any other cooking equipment.
6. Only fill the kettle with the amount of water needed, do not overfill.
7. Use low energy light bulbs wherever possible. LED lamps use a fraction of the energy of
standard bulbs and last up to 10 times longer. They are more expensive than other lamps,
but will save money from longer life and lower energy use.
8. Check bills against meter readings. Lend an energy display if possible and understand
how much energy is used in different situations. This will help you low your energy con-
sumption
9. Dry washing wherever possible outside, if bad weather means they need to be dried in-
side, don’t hang them direct on the radiators. Use a radiator hanger which will still let heat
into the room but dries clothes at the same time.
10. Wash at a lower temperature. If your washing machine can be turned down to wash at 40
or even 30 degrees, use the function, it takes less time and uses less electricity in heating
the water.
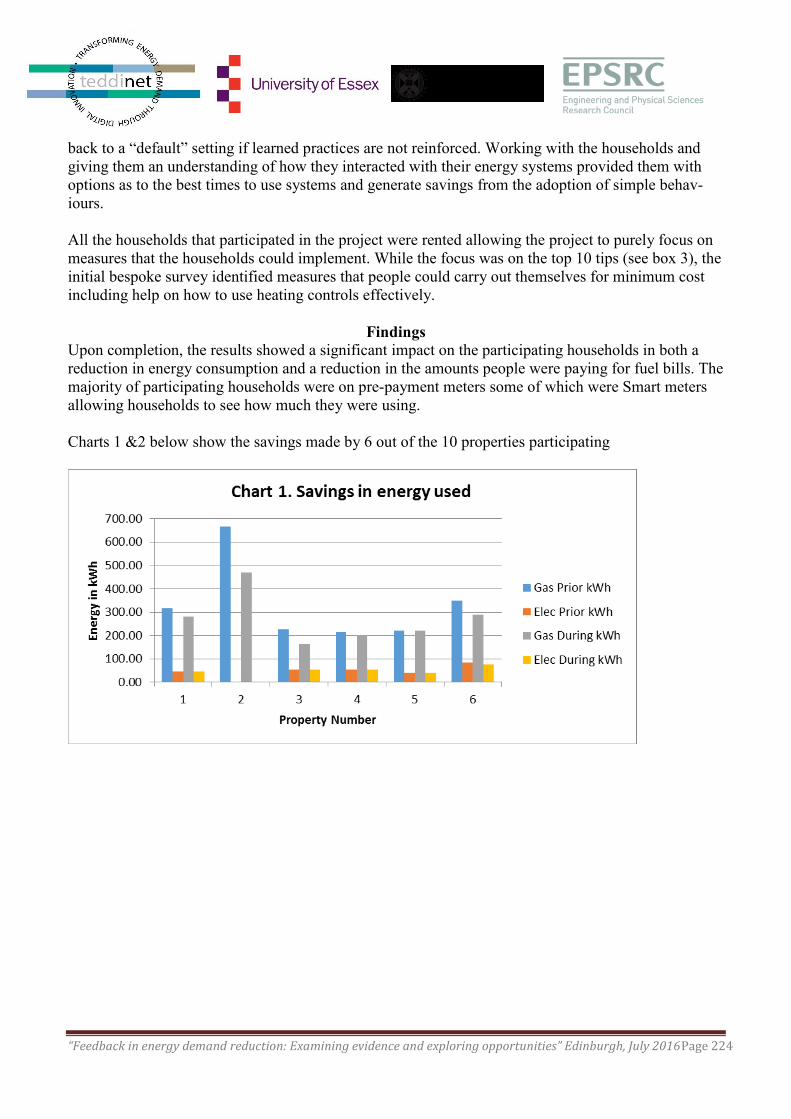
“Feedback in energy demand reduction: Examining evidence and exploring opportunities” Edinburgh, July 2016Page 224
back to a “default” setting if learned practices are not reinforced. Working with the households and
giving them an understanding of how they interacted with their energy systems provided them with
options as to the best times to use systems and generate savings from the adoption of simple behav-
iours.
All the households that participated in the project were rented allowing the project to purely focus on
measures that the households could implement. While the focus was on the top 10 tips (see box 3), the
initial bespoke survey identified measures that people could carry out themselves for minimum cost
including help on how to use heating controls effectively.
Findings
Upon completion, the results showed a significant impact on the participating households in both a
reduction in energy consumption and a reduction in the amounts people were paying for fuel bills. The
majority of participating households were on pre-payment meters some of which were Smart meters
allowing households to see how much they were using.
Charts 1 &2 below show the savings made by 6 out of the 10 properties participating
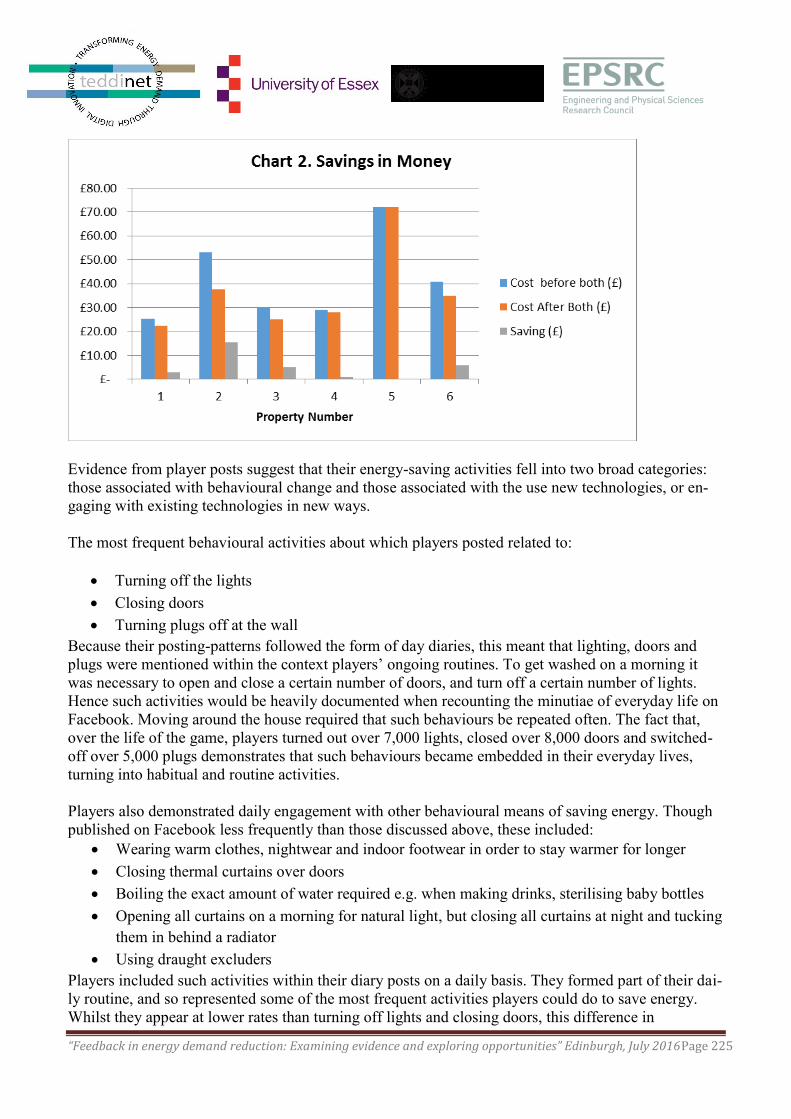
“Feedback in energy demand reduction: Examining evidence and exploring opportunities” Edinburgh, July 2016Page 225
Evidence from player posts suggest that their energy-saving activities fell into two broad categories:
those associated with behavioural change and those associated with the use new technologies, or en-
gaging with existing technologies in new ways.
The most frequent behavioural activities about which players posted related to:
Turning off the lights
Closing doors
Turning plugs off at the wall
Because their posting-patterns followed the form of day diaries, this meant that lighting, doors and
plugs were mentioned within the context players’ ongoing routines. To get washed on a morning it
was necessary to open and close a certain number of doors, and turn off a certain number of lights.
Hence such activities would be heavily documented when recounting the minutiae of everyday life on
Facebook. Moving around the house required that such behaviours be repeated often. The fact that,
over the life of the game, players turned out over 7,000 lights, closed over 8,000 doors and switched-
off over 5,000 plugs demonstrates that such behaviours became embedded in their everyday lives,
turning into habitual and routine activities.
Players also demonstrated daily engagement with other behavioural means of saving energy. Though
published on Facebook less frequently than those discussed above, these included:
Wearing warm clothes, nightwear and indoor footwear in order to stay warmer for longer
Closing thermal curtains over doors
Boiling the exact amount of water required e.g. when making drinks, sterilising baby bottles
Opening all curtains on a morning for natural light, but closing all curtains at night and tucking
them in behind a radiator
Using draught excluders
Players included such activities within their diary posts on a daily basis. They formed part of their dai-
ly routine, and so represented some of the most frequent activities players could do to save energy.
Whilst they appear at lower rates than turning off lights and closing doors, this difference in

“Feedback in energy demand reduction: Examining evidence and exploring opportunities” Edinburgh, July 2016Page 226
frequencies can in a sense be attributed to the varying repetitive potential of energy saving activities.
While the postings showed an enormous differences in terms of the frequencies with which players
are posting about activities, they had all become equally as routine. Activities became embedded in
the day-diary routines of players, and represented significant behavioural change in terms of the kinds
of activities that became common place for members of a household.
Similarly, players demonstrated regular and consistent energy-saving habits which developed during
the game. E.g. some had identified that they had chosen not to watch television in order to save ener-
gy. This could also encourage other, more unintended results. Not watching television meant that
children would play with toys and board games together, or play together outside. Hence, not watch-
ing television in order to save energy could in fact enable more social interaction for members of a
household. In addition, adult players often mentioned that they had chosen to read a book rather than
watch the television, even though this would not have been their first choice of activity had they not
been thinking about saving energy. Thinking about energy usage and turning off the television, then,
could also have implications for developing the literacy habits of individual players. Thus turning off
the TV had wider implications in terms of its potential for achieving social and personal development.
Other activities which players generally conducted on a daily basis included:
Washing dishes by half-filling a plastic tub with water which was at a lower temperature
Sweeping floors rather than using a hoover
Mopping floors with one bucket of water, with the water at a lower temperature
Going to bed with a hot water bottle
Taking showers instead of baths
Having a shower on economy setting
Letting hair dry naturally
Using an extra blanket when sitting in the living room
Drying clothes using a clothes horse, radiator or air drier
Hence, the range of activities that players carried out in order to save energy encompassed a broad
spectrum of behaviours – from washing habits to cleaning techniques and means of preparing food.
Technological adaptations:
At various points in the game players demonstrated engagement with technological means of saving
energy at home. At the start of the game one of the most frequently posted-about activities by the en-
ergy champions related to purchasing sealant and tape in order to close gaps in doors and window
frames, as well as in walls and floors. At the later stages of the game this also included putting cling-
film over the windows. Throughout the game, players would periodically post about other technologi-
cal interventions such as using energy-saving lamps around the house.
The most frequent and popular use of technologies was the purchasing and fashioning of ‘bespoke’
draught excluders by players. One player fashioned a draught excluder that could be stapled to the
door, thus overcoming the problem of being unable to place excluders in front of the door when leav-
ing the house. Not only was this tip shared with other players, but they visited others at home in order
to help them make an excluder, and gifting others with their own attachable excluders. This method of
preventing draughts was expanded in the final quarter of the game to include sticking curtains to the
wall using Velcro. Hence, the game opened up a space in which players could creatively develop
technologies to save energy, according to their own needs and imagination.
“Feedback in energy demand reduction: Examining evidence and exploring opportunities” Edinburgh, July 2016Page 227
Players would also use technology as a means of informing their behaviour within the house. As the
game continued, players demonstrated an ever-increasing engagement with indoor-room thermome-
ters, heating timers and their gas and electricity meters. Hence the game can to incorporate an inter-
play between players’ increasing ability to assess their own energy usage and needs, and not only
adapt their behaviours accordingly but to plan ahead for the most efficient use of energy at different
times of the day. Hence, one form of behaviour changed induced by the game became that of in-
creased engagement with monitoring technologies, and their practical application within the home.
Observations
All the participants managed to make savings and found the experience to be beneficial in helping
them think about energy efficiency on a more frequent basis. The amount and kind of energy saving
behaviours, and the frequency with which individual players were able to post, were inherently linked
with their personal lives and the context of their daily routines. This therefore means that our under-
standing of the kinds of behaviour changes achieved during the game needs to encompass an individ-
ually tailored perspective which takes the different lives that people lead (even when living on the
same street) into account.
The use of Facebook by a means of measuring the activity of the players proved to be a successful
way to monitoring activities, although a change had to be made in the rules to allow a maximum num-
ber of posts in a single day to avoid sheer overload. Players then found innovative ways of evidencing
their energy-saving activities on Facebook. At the start of the game, players would post large numbers
of single photos in order to illustrate particular activities and earn points. After the imposition of a
five-post limit, however, players began to look for more creative ways of evidencing a large number
of activities within one post. This involved the use of photo-editing software on smartphones in order
to combine a number of pictures into one, and even adding text to describe them, and one person went
so far as to put all of their photos into a video incorporating both text and a soundtrack.
What these pictures, videos etc. show is that the game became a medium through which players could
not only save energy, build points and win prizes: it also became a medium for the expression of play-
er creativity and shows a true engagement with, and enjoyment of, the game itself.
The variety of player lifestyles showed us that households have different energy needs and different
daily routines (which influenced the amount of time they spent at home), as well as widely differing
abilities for employing technologies to access social media sites. The use of social media was shown
in this project to be a useful tool for people to adopt energy saving behaviours and could work again
in other areas. Lifestyles and occupancy have an influence on practice and opportunities exist regard-
less of the length of time people spend in their homes. It cannot be expected that each household with-
in that community will have the same energy needs and same daily routine. However, the fact that one
player who was outside of the home for most of the day was eventually able to overtake a player who
stayed at home for much longer periods of time shows that such differences can in some ways be
overcome by players themselves, and their own extensive capacity for creativity, innovation and de-
termination.
References
NEA (2016) www.NEA.org.uk
DECC (2015). Crown Copyright, Annual Fuel Poverty Statistics Report 2015, www.gov.uk/decc

“Feedback in energy demand reduction: Examining evidence and exploring opportunities” Edinburgh, July 2016Page 228
DECC (2016) HM Government Domestic Energy Prices; data sources and methodology. Part of the
Energy price statistics information.
DCLG (2015) HM Government English Indices of Depravation 2015
Heiskanen, E., Johnson, M., Robinson, S. (2010). Low-carbon communities as a context for individual
behaviour change. Energy Policy,38: 7586–95.
European Environment Agency (2012) Achieving Energy Efficiency through behaviour change; What
does it take? Technical report No5/2103
Shove, E. (2003) Converging conventions of comfort, cleanliness and convenience, Journal of con-
sumer policy, Vol. 26, No 4, 12.2003, p.395-418.
Darnton, A. (2008), Practical Guide: An overview of behavior change models and their uses. GSR
(Government Social Research Unit) Behaviour Change Knowledge Review, Government Social Re-
search Unit, HM Treasury.
Rachel Davis, Rona Campbell, Zoe Hildon, Lorna Hobbs & Susan Michie (2015) Theories of behav-
iour and behaviour change across the social and behavioural sciences: a scoping review, Health Psy-
chology Review, 9:3, 323-344, DOI:10.1080/17437199.2014.941722
“Feedback in energy demand reduction: Examining evidence and exploring opportunities” Edinburgh, July 2016Page 229
Working in out. How the prepayment meter took on a new role for social housing
tenants with solar PV
Nicolette Fox, Research Fellow, Sussex Energy Group, Science Policy Research Unit, University of
Sussex. [email protected]
Take 7 YouTube film: cied.ac.uk/engagement/newsandevents/index/nikkifox
Abstract
Take 7 - 7 families, 7 prepayment meters, 7 solar roofs – 1 estate. The Take 7 study examined over ten months what happens when you give seven families, living in
social housing, the opportunity to be able to use their own generated free electricity. Using a social
practice approach it looked at how households adapted their domestic routines to be able to use the
solar power they were generating and the impact this has on their lives. The study found that monitor-
ing became important to the households in working out how to undertake prosuming – producing and
consuming – solar energy. It also discovered that there were different types of monitoring used by the
households and, far from being just information tools, they were instrumental in helping to embed
prosuming knowledge in day to day routines. What stood out from the findings was that, to varying
degrees, all seven households turned to their prepayment meters to help them monitor and develop
embodied knowledge around their solar energy use.
1. Introduction
Whatever electricity system evolves within the UK over the next few decades, it will be significantly
different from the one today given the challenges it needs to address, as Newberry and Green high-
light:
“Ambitious environmental targets, rising electricity prices, rapid technical progress, com-
bined with cheaper and better information and communication technologies will have a dra-
matic impact on the electricity sector of the twenty-first century...Decarbonising the economy
means increasing the share of electricity, which will power cars and heat pumps, reducing the
importance of oil and gas but creating new and more concentrated demand patterns.” (New-
bery, Green 2011 p xxv)
In 2010 the Department of Energy and Climate Change (Decc) introduced the microgeneration Feed-
In Tariff scheme to “enable broad participation of individuals and communities, as well as energy
professionals, in the ‘big energy shift’ to a low carbon economy’ (Decc 2009 cited in Decc 2015).
However, the Government also hoped that the uptake of microgeneration technologies - “small scale
renewable electricity production at point of use” – could offer a number of other benefits to house-
holders and the energy network ” (Bahaj, James 2007 p2124).
“The Microgeneration Strategy will, alongside RHI and FITs , support the growth of Micro-
generation and thus help to deliver the wider benefits of: greater consumer engagement (in-
cluding greater energy awareness, potentially leading to lower energy demand and load -
shifting); public acceptance of alternative ways of delivering energy needs; diversifying the

“Feedback in energy demand reduction: Examining evidence and exploring opportunities” Edinburgh, July 2016Page 230
energy mix; reducing dependence on (imported) fossil fuels; greater energy security at the
small scale; business and employment opportunities…” (Decc 2010 p12 – emphasis added).
For households, a key attraction of being a producer and consumer - prosumer - is the opportunity to
save money on electricity bills that have risen rapidly in recent years. And yet a major study (Bulkeley
et al 2014) of solar photovoltaic (PV) homeowners in the UK found that while they had increased en-
ergy awareness, they were generally not active prosumers. Instead their focus was generally much
more on the income stream from the Government’s feed-in-tariffs, rather than saving money through
using their own electricity (Bulkeley et al 2014).
Even if such households are not currently making the most of their solar energy, they are, arguably,
well placed to cope with potential future increases to electricity prices (Newbery, Green 2011 p xxv).
As energy supply becomes increasingly decarbonised, there will inevitably be “winners and losers”
(Walker 2013 p183). Some households will be more able to afford low carbon technologies to ad-
dress fuel costs, while others will potentially be left out in the cold. Households who are currently
vulnerable to fuel poverty are at the front line of those who could well be the “losers” in a transition to
a decarbonised world.
But what happens when those vulnerable to fuel poverty are given the means to create their own ener-
gy without access to feed-in-tariffs? How do they adapt their routines to capture solar power given
that its generation is influenced by weather, seasons and changing daylight hours? What knowledge
and skills are required to make the best use of solar energy including the role of monitoring and what
impact does this have on the household?
Take 7 is believed to be the first UK longitudinal study to explore what producing and consuming -
prosuming - renewable energy looks like in households who rely on prepayment electricity meters. It
undertakes an in-depth investigation into whether social housing tenants with meters, can become ac-
tive producers and consumers of renewable energy following the installation of solar panels, and how
this evolves.
2. Methodology & Theory
The research consisted of a series of in-depth interviews with seven families over ten months. All the
households lived in social housing with their children and relied on prepayment electricity meters.
Over four seasons the study tracked their solar journeys, both prior to and following the installation of
solar PV panels by their social landlord. The households were also given the opportunity to make
video diaries of the experience.
The study drew on a social practice lens to offer insights into how prosuming develops in a domestic
setting. Such an approach also helped shine light on the different types of monitoring that individual -
‘practitioners’ - took up as their relationship to prosuming evolved. As Shove et al write, “Monitor-
ing, whether instant or delayed, provides practitioners with feedback on the outcomes and qualities of
past performances” and how this might shape future activity (2012 p99). The authors also highlight
how it is often difficult “separating monitoring from doing” (2012, p99). This small, but in-depth,
study revealed just this, that the ‘doing’ and the monitoring, invariably became intertwined as high-
lighted below in some of the initial findings:
“Feedback in energy demand reduction: Examining evidence and exploring opportunities” Edinburgh, July 2016Page 231
3. Finding & Discussion
3.1 Turning to the prepayment meter as a solar PV tool
“You’re conscious of it at the beginning, because I think you’re …a bit sceptical, as you’re thinking,
‘How is this working and why is it working and what’s happening?’ And then after a while you’re
thinking, ‘Well it does work because I did my little test’. Then it just becomes the normal thing that’s
working in your house and it’s saving you money”.
The families in the study had a ‘love-hate’ relationship with their prepayment meters. They thought it
was wrong that they were paying over the odds for their energy, but for most it was a device that they
could not imagine living without. For these families the prepayment meter was essential for keeping
on top of tight budgets and their interaction with it was an embodied experience - both mentally and
physically. Constantly 'feeding' a hungry meter demanded a mental agility in working out how much
electricity was needed for certain tasks before the money ran out. It also demanded a physical pres-
ence - checking the meter, going to the shops, 'topping-up' and returning home - that bears no resem-
blance to paying a quarterly bill by direct debit. As Sian highlights below, the prepayment meters
meant that she could both ‘see’ and ‘feel’ her energy use because of the physicality involved:
“On a key[prepayment] meter, you know, you've got to physically take the key out to go and physical-
ly top up, or you don't have no electric in your house. It is totally cut off. For us, we do see it, we do
feel it, because we physically have to do something about it, whereas if you are on a quarterly bill you
don't, [the electrics are] just there.... I always had to check …’Are we alright? Yep’, “Can we go an-
other couple of days before I have to top up?’ ‘Right I'll put this money by for that.’”
Given the close relationship between the prepayment meter and domestic routines, it is perhaps not so
surprising that the families turned to this ‘tried and tested’ piece of technology to help them navigate
their way to becoming prosumers. From the outset of getting the solar panels, they started to impro-
vise with their prepayment meters. Some carried out specific tests, others just kept a close eye on the
credit - but either way they started to develop a knowledge of what it means to be a prosumer of solar
energy. As Harry explained: “I’ve got the TV on, I’ve got the Sky box on, and I have been using elec-
tric all day, so you just want to keep pushing…One day we used 20 to 30 pence…’ We had the wash-
ing machine on all day.”
The prepayment meter offered the householders a way of knowing energy that was embodied both
physically and mentally, and this experience started to be applied to prosuming. Thus individuals
started to develop practical, embodied knowledge - “know-how” - based on their experiences rather
than just factual information - “know-what” - that was given to them by the solar installation company
(Royston 2014 p150). This was a key piece of the prosuming jigsaw that helped, where work and fam-
ily life allowed, households to utilise solar power through their daily routines.
3.2 Learning to ‘read’ the weather
“Yeah like in the mornings… I’ll get them up for school and I’ll be like sitting on my bed like doing
my hair …and I’ll put the weather on, so I know whether it’s going to be sunny...”
Many of the households realised through checking their prepayment meters, that utilising solar power
was not simply about turning on the washing machine, but working out when best to do this - whether
“Feedback in energy demand reduction: Examining evidence and exploring opportunities” Edinburgh, July 2016Page 232
it should be synchronised with the sun or form part of a sequence of domestic routines. In addition to
using prepayment meters, households also started to develop new skills around ‘reading’ the weather -
not only by looking out the window but also monitoring weather forecasts. For example, Moria, who
is quoted above, would watch the forecast in the morning on the television and then set the delay but-
ton on her washing machine to coincide with the sunniest part of the day in order to maximise her use
of the solar power while at work.
3.3 Using the prepayment meter to deepen the practice
By the winter Rose started to experiment with being more systematic in how she used her prepayment
meter to support her use of solar electricity. Over a couple of months she fairly regularly record the
figures of how much money she had spent on electricity and recorded this against what had been hap-
pening during the day: “The fact I've got to go check the electricity anyway to see how much is on
there and then... I write it down instantly what's left on. And then I'll work out how much has been
used.” She adds, “Because I write it down…every day…the oven’s been on, …or what the weather’s
been like, or sometimes the lights on early…I can see the saving and I can show them to other people,
‘Look at this, we’ve saved this much!’ ”
Out of the seven households, Rose became the most proficient in prosuming and made the biggest fi-
nancial savings – reducing her electricity by around 50 percent – not only in the summer but also sig-
nificantly over the winter. The savings impacted not only on her family finances but also on her confi-
dence. In the past it was her husband who was the energy ‘expert’ but the monitoring gave her an ex-
pertise as well. As she says, “I mean Tony knows all his stuff anyway….[but] it’s me doing it. I…
check the electricity and I write all down what we do in a day.…cos it’s me doing most of the day to
day chores…It’s me that’s been doing it all…I’ve learnt a lot and I’ve realised that yeah, just because
it’s a bit overcast… [the solar panels] still work”.
The monitoring not only increased Rose’s confidence and knowledge around the household’s energy
use, but also her well-being. The checking of the prepayment meter was no longer tied to simply wor-
rying about how little credit was left on it, but was also a reminder of how much money she had saved
on her electricity costs:
“In the stress levels … it works wonders because if …there’s only a couple of pounds on [the prepay-
ment meter], I know it’s going to be fine until tomorrow…I haven’t got to panic about putting the
emergency on…Any savings that have been made or the less the money I haven’t had to put on it, just
goes into the shopping, into the other bills in the house so [it] makes… that little less of a burden to
keep worrying about the electricity every five minutes. Because I used to be awful for checking it,
checking it, make sure it’s not going to run out…And now I don’t have as much of a worry to keep
checking it…because I know it is.”
3.4 How a solar energy monitor spoke out
“The [solar energy] monitor has made a hell of a difference because I mean… it just tells you. It’s
like it speaks to you… ‘Go on, go and put a load of washing on! And go on, go and do this, go and do
that, you’re saving you’re generating, you’re not generating!’ So it does, it does tell you.”
While Rose started to use her prepayment meter more systematically over the winter, for most fami-
lies it became less useful. With daylight hours dwindling and the sun no longer a reliable visual cue,
“Feedback in energy demand reduction: Examining evidence and exploring opportunities” Edinburgh, July 2016Page 233
the prepayment meter proved not such a sensitive tool for picking up small amounts of energy sav-
ings. However for three of the families this did not matter, they found that by keeping up their
prosuming routines they were still saving some energy and money, albeit at a reduced rate compared
with the summer. However for the other three households they struggled to keep up their practice of
prosuming during the winter.
Part way through the winter, all the households received solar energy monitors from their social land-
lord. For many of the families the monitors offered a helpful visual cue, in addition to the sun. For ex-
ample, when it glowed green they knew that they were generating solar power even if outside there
was no sun. For Moira it was a revelation. She had loved her solar panels, but stopped being an active
prosumer at the start of winter because she believed that without sun she was not generating any ener-
gy. However, the solar energy monitor immediately revealed that this was not always the case and
gave her the knowledge she needed to come back into the prosuming fold, as her quote at the top of
this section highlights.
Yet not all the families found the solar energy monitors helpful. One never used it and another put it
away after a short time. In one household there was mixed feelings: while Harry found it beneficial to
knowing when solar energy was being generated, his wife Freya found it intrusive. As she says, “I’m
just set in my ways. I don’t like something saying, ‘Oh I’m green’ or whatever, ‘Quick go and put the
tumble drier on, do the washing!’ No, I’ll do it when I’m ready to do it, when I feel like it.”
4 Conclusion
The study showed that prosuming can help to reduce vulnerability to fuel poverty, at least for part of
the year. All the families used monitoring to help them save on their electricity costs – but it was
much more than just an information tool. In many cases monitoring became part of the practice of
prosuming – the “doing” (Shoe et al 2012, p99): improvising with the prepayment meter, ‘reading’ the
weather, synchronising routines with the sun and combining the visual cue of a solar energy monitor
with embodied knowledge. Different families drew on different ways of monitoring – but overall it
helped all of them to get more out of their solar power and, for at least part of the year, they no longer
had to constantly ‘feed’ a ‘hungry’ meter.
All the names used in this paper have been changed to protect identities and ensure confidentiality.
References:
Bahaj, A., James, P. (2007), Urban energy generation: The added value of photovoltaics in social
housing, Renewable and Sustainable Energy Reviews 11 - 2121–2136
Bulkeley, H., Bell, S., Lyon S., Powells, G., Judson, E., Lynch, D. (2014) Customer-Led Network
Revolution Durham University Social Science Research Report.
Decc (2010) Impact assessment for the Microgeneration Strategy
Decc (2015) Performance and Impact of the Feed-in Tariff Scheme: Review of Evidence
Newbery D., Green T. (2011), Foreword in Jamasb T., Pollitt M., The future of electricity demand -
customers, citizens and loads, Cambridge University Press

“Feedback in energy demand reduction: Examining evidence and exploring opportunities” Edinburgh, July 2016Page 234
Royston, S. (2014) Dragon-breath and snow-melt: Know-how, experience and heat flows in the home.
Energy Research & Social Science 2 p 148-158.
Shove, S., Pantzar, M., Watson, M. (2012) The Dynamics of Social Practice, Sage Publications
Walker, G. (2012) Inequality, sustainability and capability: locating justice in social practice in
Shove, E., Spurling, N. (2012) Sustainable Practices - Social theory and climate change. Routledge
“Feedback in energy demand reduction: Examining evidence and exploring opportunities” Edinburgh, July 2016Page 235
Reflections on designing an engaging in-home energy dashboard using participa-
tory design and gamification
Georgina Wooda Dan van der Horst
b, Rosie Day
a, Shuli Liu
c, Mark Gaterell
d, Panos Petridis
e, Atif
Hussainc and Ashish Shukla
c . Presenting author contact email address: [email protected]
aSchool of Geography, Earth and Environmental Sciences, University of Birmingham
bSchool of GeoSciences, University of Edinburgh
cSchool of Energy, Construction and Environment, Coventry University
dFaculty of Technology, University of Portsmouth
eAston Business School, Aston University
Abstract
Trials of smart energy in-home displays (IHDs), or ‘dashboard’-style applications for use on tablet or
smartphone, have been reported in numerous papers in recent years. Varying levels of success have
been described in terms of user engagement, particularly with members of the household beside the
bill payer. EPSRC Smarter Households looks to explore two possible ways of increasing engagement
with a new energy dashboard: participatory design and game mechanics. Participatory or co-design
approaches to research have been praised but difficulties in applying the principles in practice have
been noted. Gamification has seen success in the fitness sector and in pro-environmental efforts,
where a clear motive to change behaviour in a particular direction has been applied (e.g. to help a user
to lose weight or save energy). However its relevance to engagement rather than direct behaviour
change is currently unclear. This paper reflects upon the process of designing a dashboard application
displaying real-time information on electricity and gas use (along with indoor environmental indica-
tors), specifically two co-design and feedback workshops which were held with housing association
staff in 2015 and 2016. We offer some reflections on the challenges associated with implementing a
participatory approach, and with integrating gamification in a meaningful way in situations where be-
haviour change (in particular towards saving energy) is not always desirable or appropriate.
Introduction
Trials of smart energy in-home displays (IHDs), or ‘dashboard’-style applications for use on tablet or
smartphone, have been reported in numerous papers in recent years (e.g. Alahmad et al. 2012, Bu-
chanan et al. 2015). Varying levels of success have been described in terms of user engagement, par-
ticularly with other members of the household beside the bill payer (Hargreaves et al. 2010).
There have been few attempts, to our knowledge, to actively engage users in the design of an energy
in-home display. Anderson and White (2009) used focus groups with a strong design element to pin
down the types of displays people preferred. After one focus group, participants were given an IHD
available on the market to test, which had some influence over the eventual designs they produced.
Another study found little agreement within households as to their preferred IHD design, leading to
the suggestion that multiple options should be available to choose from (Froehlich et al. 2012).
“Feedback in energy demand reduction: Examining evidence and exploring opportunities” Edinburgh, July 2016Page 236
Smarter Households, an Engineering and Physical Sciences Research Council (EPSRC) project fund-
ed under the BuildTEDDI programme, looks to help households to manage their energy use according
to their own priorities, whether they are looking to save money, help the environment, or feel more
comfortable at home. A core component of the project is the design and trial of an ‘Energy Dash-
board’ application displaying real-time information on electricity and gas use, as well as temperature,
relative humidity and carbon dioxide, from a system of sensors. This is being developed for trial by 20
social housing properties in the Midlands of England.
In this paper, we outline an important step of the dashboard design process, namely participatory
workshops with housing association staff. We reflect upon the benefits and drawbacks of this ap-
proach and the ways in which it has helped us to make sense of the role of gamification for meaning-
ful householder engagement with energy use.
Background
Participatory design is a set of methodologies and practices that centre on working in collaboration
with users to try to reach a more successful end product. Muller and Druin (2010) describe a “third
space” of “hybrid experiences” that participatory design can invoke: “…practices that take place nei-
ther in the users’ domain, nor in the technology developers’ domain, but in an ‘in-between’ region that
shares attributes of both spaces.” (p2). Participatory or co-design approaches to game design research
have been praised (Vanden Abeele and Van Rompaey 2006) but several authors have noted the diffi-
culties in applying the principles in practice (e.g. Scaife et al. 1997; Danielsson and Wiberg 2006).
There is a key decision to be made in terms of framing: to what extent existing ideas for the game
should be communicated to participants in order to provide context and help to ensure emerging ideas
are usable and ‘relevant’, but at the same time not constraining creativity or channelling ideas too far
in the designers’ (possibly preferred) direction. Equally, a potential weakness of participatory design
methods is losing the creative ‘spark’ that professional designers might bring to the table. Academ-
ics/designers are in disagreement over the most appropriate role for the user: Danielsson and Wiberg
(2006) engaged participants as “informants” (c.f. Druin 2002), framing their design for a game around
gender issues before engaging teenagers from the target audience. They also overrode some of the
suggestions from the participants later on that did not fit with their remit for the game. Conversely,
Vanden Abeele and Van Rompaey (2006) engaged senior citizens early in the game-design research
process. The resulting game ideas were mostly multiplayer with a distinct social element.
However, early engagement elsewhere has led to issues. All et al. (2012) reflect on the extent to which
framing the scenario task around a map influenced ideas and limited creativity, but also provided
guidance and more useful outcomes, potentially. Complete freedom might have limited the usefulness
of the resulting ideas. This suggests that there is a need for a careful balance between framing the
workshop to make outcomes useful to the designers, and overly influencing ideas to suit designers’
previous plans.
Beyond engaging users in the design process, there is also a need to engage participants when they are
using the product, and try to keep them interested over a significant period of time. Gamification (the
application of game mechanics to non-game environments) is one way of motivating users to take
part, remain involved and keep interest levels high. Aspects of gamification include- at the simplest
level- points, badges and leaderboards, but can stretch to making pledges and competing with oneself
or others. Gamification has seen success in the fitness sector and in pro-environmental efforts, where a
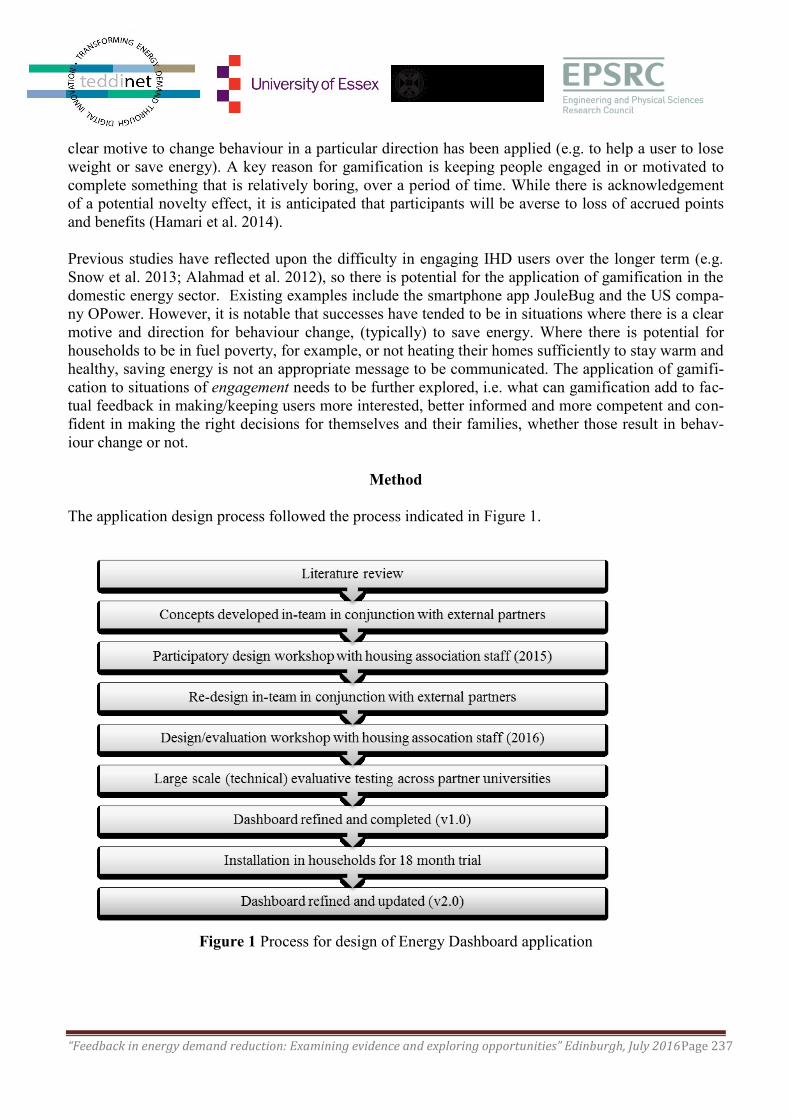
“Feedback in energy demand reduction: Examining evidence and exploring opportunities” Edinburgh, July 2016Page 237
clear motive to change behaviour in a particular direction has been applied (e.g. to help a user to lose
weight or save energy). A key reason for gamification is keeping people engaged in or motivated to
complete something that is relatively boring, over a period of time. While there is acknowledgement
of a potential novelty effect, it is anticipated that participants will be averse to loss of accrued points
and benefits (Hamari et al. 2014).
Previous studies have reflected upon the difficulty in engaging IHD users over the longer term (e.g.
Snow et al. 2013; Alahmad et al. 2012), so there is potential for the application of gamification in the
domestic energy sector. Existing examples include the smartphone app JouleBug and the US compa-
ny OPower. However, it is notable that successes have tended to be in situations where there is a clear
motive and direction for behaviour change, (typically) to save energy. Where there is potential for
households to be in fuel poverty, for example, or not heating their homes sufficiently to stay warm and
healthy, saving energy is not an appropriate message to be communicated. The application of gamifi-
cation to situations of engagement needs to be further explored, i.e. what can gamification add to fac-
tual feedback in making/keeping users more interested, better informed and more competent and con-
fident in making the right decisions for themselves and their families, whether those result in behav-
iour change or not.
Method
The application design process followed the process indicated in Figure 1.
Figure 1 Process for design of Energy Dashboard application

“Feedback in energy demand reduction: Examining evidence and exploring opportunities” Edinburgh, July 2016Page 238
At all points up until household installation, the application and its early prototypes functioned with
‘dummy’ data. It only displays real time personal sensor data when used by a participating household
with sensors installed in their home.
Workshop and Prototype 1 (2015)- The ‘Energy Garden’
The first workshop was held in Spring 2015 with staff from a UK housing association taking part in
the research project. 4 men and 5 women volunteered from a range of departments across the organi-
sation including Media and Data Protection. The workshop was approximately 90 minutes long, and
followed the structure detailed in Table 1. This structure takes inspiration from the process used by
All et al. (2012).
While we recognise that the users engaged in the workshops were not the very end users, they gave us
a more balanced view of social housing customer needs, as well as the perspective of the housing as-
sociation as a user and supplier of the developed system. In addition to their professional role in the
social housing organisation, workshop participants were domestic energy users themselves.
Annotating or adding content to hand or computer-drawn sketches, and organising paper cut-outs and
backgrounds, has been noted to work well in other studies (Druin 2002; Danielsson and Wiberg
2006), hence we used this method to structure participant feedback.
Table 1 Structure of Workshop 1 (2015)
0-10 mins 10-15 mins 15-45 mins 45-50
mins
50-85 mins 85-90 mins
Introduction to
project and aims
of workshop
Participants to
read and sign
consent forms
Ice breakers
(brainstorms
around en-
ergy-using
activities)
Evaluation of current
gamified dashboard
concept
-Demo of prototype so
far
-Annotation of screen
shot images in pairs
-Guided group discus-
sion
Short
break
Designing a
new lev-
el/element
-Group crea-
tive activity
followed by
guided dis-
cussion
Exit ques-
tionnaire and
thanks
The first prototype created by the project team (and presented to the participants of Workshop 1 as an
initial idea) was highly gamified, with a virtual world (in the form of a garden) that the user navigated
around in order to learn about their real time and historic electricity and gas consumption and their
indoor environment. The incorporation of fantasy elements and travelling to other worlds was also
suggested by the project team. Due to the early stage of development, it was shown to participants via
computer and still images.
The absence of monetary units in the first prototype was criticised by participants, as was the level of
gamification and 3D graphics. Overwhelmingly the message was that outputs needed to be “tangible”

“Feedback in energy demand reduction: Examining evidence and exploring opportunities” Edinburgh, July 2016Page 239
with “things that translate to their everyday lives”, rather than any fantasy elements, and a “flatter”
design was desirable and would be easier to use.
When asked to develop a new level or element for the application during the workshop, participants
storyboarded a different concept: a smartphone app for setting and tracking personal goals. Whilst
similar to apps already available on the market, this helped us to see priorities and preferences of our
target audience and shape a second prototype around these. Time was spent following the workshop
changing the prototype according to feedback, and integrating design elements suggested in the work-
shop.
Workshop and Prototype 2 (2016)- the 2D and 3D dashboard
The second workshop was held in Spring 2016. 2 men and 3 women attended. One participant took
part in both workshops. Following feedback from Workshop 1, the introduction to the workshop and
the purpose of the project was also adjusted to be clearer (Table 2).
Table 2 Structure of Workshop 2 (2016)
0-10 mins 10-20 mins 20-45 mins 45- 85 mins 85-90 mins
Introduction to
project and aims
of workshop
Participants to
read and sign con-
sent forms
Changes made
since last work-
shop
Demonstration
through Power-
Point slides
Participants try out
application on tablet
Annotation of game
screen shot images
Complete list of tasks
Guided dis-
cussion
Exit questionnaire
and thanks
The second prototype dashboard was flatter (rather than requiring navigation around a virtual world).
Reflecting on outcomes of Workshop 1, and following the results of Froehlich et al’s (2012) study, we
designed a 2D (graph) and 3D (house) view of the dashboard, to allow for different preferences of in-
formation display. We also incorporated different gamification elements to support this: points award-
ed for exploring hints and tips (and returning to these if a particular indoor environment issue e.g. high
CO2 needs addressing); and the ability to set yourself a personalised goal and follow progress. This
was presented to the participants of Workshop 2. Due to the later stage of development, participants
were able to try out the application on tablets.
The annotation activity was repeated but the workshop was focused far more around feedback and cri-
tique rather than co-design. This was for several reasons: the later stage of development; having al-
ready integrated design ideas from Workshop 1; and the challenges met in Workshop 1 around en-
couraging co-design to take place. Participants also answered a list of tasks- questions to test the usa-
bility of the application, such as “What was the temperature in the lounge at 2am today?”.
Participants in Workshop 2 were positive about the prototype, trying out the different features and re-
flecting on different uses of the application, such as pinpointing issues with the property, or helping
people learn about increasing their level of comfort and wellbeing in the winter through not just heat-
ing one room:
“Feedback in energy demand reduction: Examining evidence and exploring opportunities” Edinburgh, July 2016Page 240
“Actually it is educating the older generation…..do you understand that your gas fire and your
electric fire, although you’re nice and toasty warm in your one room, it’s actually costing you
twice as much as if you had it at a steady temperature, you could have the rest of the house and
the humidity at a decent standard, but it’s not going to cost you any more…” (Workshop 2 par-
ticipant)
Summary of findings
Challenges arose in Workshop 1 over integrating gamification in a meaningful way to make the dash-
board more helpful and engaging, rather than distracting from its overall purpose. While game-like
visualisation elements were not overly popular in Workshop 1, and a virtual world was seen as dis-
tracting from the purpose of the dashboard, participants were keen on goals or targets. This inspired us
to use gamification to support useful features such as learning what issues exist in your own home (re-
al-time colour highlighting supported by data) and how best to tackle these (tailored hints and tips).
Integration of gamified elements was also key to helping users engage with budgeting, and learning
about how practical actions link to bills:
“I’d love to have this, to get to the end of the week and wow…my actions have actually saved
myself five quid…that a week, times fifty two, is a potential saving of the year…” (Workshop
2 participant)
It is, of course, necessary to pay attention to the heating season and not oversimplify aggregate sav-
ings across a year. However the quote above does suggest that gamification can be applied in mean-
ingful ways for engagement rather than behaviour change (with the user setting goals or targets them-
selves, or simply becoming more informed about how actions link to bills, and to health and comfort,
which may not result in a net energy saving).
Reflections and next steps
This paper has put forward and tested participatory design methods with adults as a means of gaining
input into the design of an energy dashboard application, and the best ways in which to use gamifica-
tion for user engagement. There is a clear place for these methods in developing applications which
are suited to the target audience- and in redefining suitable audiences to target with a product- but as
with authors previously publishing in this area, we faced challenges doing truly participatory design.
Framing helped to guide ideas to be relevant and useful to the designers, and there was a need to take
a prototype to a stage in which participants had something to critique, even if this meant a significant
shift from the prototype later on. A tendency towards critiquing content, which dominated the first
workshop, has been noted previously (Danielsson and Wiberg 2006).
Participatory design helped us to reflect upon ways in which gamification can be useful to the user,
and how to make use of it to help people make their own decisions about comfort and energy use. It
also helped us to define customer and housing association priorities.
A more extended analysis of the workshop results, combined with results of (soon to be held) large
scale technical evaluations will be written up for publication in due course.
“Feedback in energy demand reduction: Examining evidence and exploring opportunities” Edinburgh, July 2016Page 241
Acknowledgements
This research was funded under EPSRC BuildTEDDI grant EP/K002716/1 ‘An Intelligent Digital
Household Network to Transform Low Carbon Lifestyles’. It is a collaboration between 5 UK univer-
sities led by Coventry University, in conjunction with a UK housing association and energy supplier.
References
Alahmad, M., Wheeler, P.G., Schwer, A., Eiden, J. and Brumbaugh, A. (2012) A comparative study
of three feedback devices for residential real-time energy monitoring, IEEE Transactions on Industri-
al Electronics 59: 4, 2002-2013.
All, A., Van Looy, J. and Nunez Castellar, E.P. (2012) An evaluation of the added value of co-design
in the development of an educational game for road safety, International Journal of Game-Based
Learning 3:1, 1-17.
Anderson, W. and White, V. (2009) Exploring consumer preferences for home energy display func-
tionality: Report to the Energy Saving Trust, Centre for Sustainable Energy: Bristol.
Buchanan, K., Russo, R. and Anderson, B. (2014) Feeding back about eco-feedback: How do con-
sumers use and respond to energy monitors? Energy Policy 23: 2014, 138-146.
Danielsson, K. and Wiberg, C. (2006) Participatory design of learning media: designing educational
computer games with and for teenagers, Interactive technology and smart education 4, 275-292.
Druin, A. (2002) The role of children in the design of new technology, Behaviour and information
technology 21:1, 1-25.
Froehlich, J., Findlater, L., Ostergren, M., Ramanathan, S., Peterson, J., Wragg, I., Larson, E., Fu, F.,
Bai, M., Patel, S.N. and Landay, J.A. (2012) The design and evaluation of prototype eco-feedback
displays for fixture-level water usage data, CHI ’12, May 5–10, 2012, Austin, Texas, USA.
Hamari, J., Koivisto, J. and Sarsa. H. (2014) Does Gamification Work? — A Literature Review of
Empirical Studies on Gamification, 47th
Hawaii International Conference on System Science (HICSS),
January 2014, pp. 3025-3034.
Hargreaves, T. Nye, M. and Burgess, J. (2010) Making energy visible: A qualitative field study of
how householders interact with feedback from smart energy monitors, Energy Policy 38: 2010, 6111-
6119.
Muller, M.J. and Druin, A. (2010) Participatory Design: The Third Space in HCI, in: The human-
computer interaction handbook, Julie A. Jacko and Andrew Sears (Eds.). L. Erlbaum Associates Inc.,
Hillsdale, NJ, USA 1051-1068.
Scaife, M., Rogers, Y., Aldrich, F. and Davies, M. (1997) Designing for or designing with? Informant
design for interactive learning environments, Proceedings of CHI ‘97, 22-27 March 2007, Atlanta
GA.

“Feedback in energy demand reduction: Examining evidence and exploring opportunities” Edinburgh, July 2016Page 242
Snow, S., Buys, L., Roe, P. and Brereton, M. (2013) Curiosity to cupboard- self reported disengage-
ment with energy use feedback over time, OzCHI’13, November 25 - 29 2013, Adelaide, Australia.
Vanden Abeele, V. and Van Rompaey, V. (2006) Introducing human-centred research to game design:
designing game concepts for and with senior citizens, Proceedings of CHI 2006, 22-27 April 2006,
Montreal, Quebec.
“Feedback in energy demand reduction: Examining evidence and exploring opportunities” Edinburgh, July 2016Page 243
Exploring the Challenges and Opportunities of Eco-Feedback Technology for
Shifting Electricity Use at Home*
Nervo Verdezoto, Department of Computer Science, University of Leicester, University Road,
Leicester, LE1 7RH, UK. [email protected]
Abstract
Encouraging people to reduce or shift resource consumption is one of the main areas where there is a
huge spread of feedback technology (so called eco-feedback) such as smart electricity meters to make
people aware of their energy use. Although these technologies have managed to raise awareness re-
garding people’s energy consumption, they have not been widely accepted/adopted as most of these
technologies have focused on the individual behavior change and have often ignored the complexities
of people’s everyday practices. Traditionally, the design of FTs has relied on persuasion and highly
attentive interfaces aiming to change people’s behaviors often resulting in information overload, an-
noyance or just being ignored. As a result, people still find it difficult to make sense of the energy
feedback received and have problems embracing these technologies into their everyday practices. Dif-
ferent game-based approaches have been used to increase the user engagement with feedback technol-
ogy but mostly focusing on encouraging people to reduce the amount of electricity they consume.
During this talk, I present the challenges and opportunities for encouraging people to shift the timing
of consumption activities based on different case studies coming from my participation on the
EcoSense project – a multidisciplinary energy project in Denmark.
Introduction
There is a growing desire to address societal challenges in sustainability through the use of energy
feedback technology (FT) –so called eco-feedback technology. Indeed, more and more eco-feedback
FT is being implemented to support people's self-awareness of resource consumption (e.g., water,
heating, energy) through the use of lighting mechanisms, attentive feedback (e.g., energy displays and
meters) and visualizations (Froehlich, Findlater, & Landay, 2010). Although FTs have managed to
raise awareness about resource consumption, many challenges still remain, as many people have prob-
lems adopting them (Barreto, Karapanos, & Nunes, 2013; Snow, Buys, Roe, & Brereton, 2013), as
these technologies have often failed to consider how people actually use and integrate these devices
into their everyday lives and routines. To increase the user engagement with feedback technologies,
game-based approaches (Bang, Torstensson, & Katzeff, 2006; Gustafsson, Katzeff, & Bang, 2010)
have been applied, however, most of these efforts only focus on encouraging people to reduce the
amount of energy they consume. However, addressing sustainability challenges is not only a matter of
reducing consumption but also a matter of consuming electricity at the right time.
* This work is based on my earlier work as part of the EcoSense project and the references are included and highlighted
(#) at the bottom of this abstract.
“Feedback in energy demand reduction: Examining evidence and exploring opportunities” Edinburgh, July 2016Page 244
Exploring Challenges And Opportunities For Shifting
In this section, I will describe some of the challenges and opportunities for eco-feedback technology
as a result of my participation in the EcoSense project that I consider important for the Energy Feed-
back Symposium.
Getting People to Shift their Resource Consumption
Getting people to shift their resource consumption is not an easy task. Based on our experience
understanding and developing interventions to encourage people to shift electricity usage, we have
highlighed three main challenges (Brewer, Verdezoto, Rasmussen, et al., 2015). First, the concept of
shifting is more complex for people to understand than electricity curtailament. To enable people to
shift, they should be able to understand the reasons and motivations for shifting such as the dynamics
of power generation of the modern grid (Brewer, Verdezoto, Rasmussen, et al., 2015). Second, people
should be informed about the good and bad times to use electricity – off-peak times or when there is
more or less renewable power generation. Understanding when to shift is difficult as there are several
data sources to take into account as we reported in (Brewer, Verdezoto, Rasmussen, et al., 2015). The
basic idea is to provide people with information regarding the forecast of electricity use desirability as
well as with a historical view of electricity usage (Brewer, Verdezoto, Rasmussen, et al., 2015) so that
people can check and combine these information to identify possible activities and times for shifting.
However, understanding the concept of shifting and providing historic and desirable usage feedback
are not a gateway for shifting as we experienced while conducting two pilot studies of the ShareBuddy
game (Brewer, Verdezoto, Holst, & Rasmussen, 2015). Levering prior work on game-based ap-
proaches in the sustainability domain, we made the first attempt to address shifting through the design
of a casual mobile game to encourage players to reduce and shift their electricity usage patterns.
ShareBuddy integrates real resource data into the game play to enable players to share their resources
with their buddy – the character in the game. All the real savings of electricity by reducing or shifting
are translated into resource points that enable users to play. ShareBuddy provides both feedback on
player’s electricity usage as well as a CO2 intensity forecast of electricity use desirability for the next
24 hours – “green” hours to use electricity. While our first pilot study on a student dormitory reported
that no player had attempted to shift as they had difficulties understanding the concept of shifting, our
second pilot study reported that most players understood the concept of shifting and were aware of the
CO2 forecast, however, very few players attemped to actually shift due to the complexity of their
everyday practices. For instance, an individual might frequently be outside the home (e.g., at school,
restaurant or any other social setting) when it is the right time to use electricity. In particular, our
participants found electricity curtailment easier as there is no need to make sense of different kind of
data (Brewer, Verdezoto, Holst, et al., 2015). Third, the dynamic nature of shifting e.g., weather
conditions (how much the wind blows), imports, or failures in the generation affect the feedback
provided on daily basis (Brewer, Verdezoto, Rasmussen, et al., 2015). This variability poses
challenges on people’s activities as the feedback is not static and it is continuosly changing making
more difficult for people to understand and adapt their everyday practices and routines to shift
electricity use.
“Feedback in energy demand reduction: Examining evidence and exploring opportunities” Edinburgh, July 2016Page 245
Exploring the Flexibility Potential of Everyday Life
Our second case explores the challenges experienced by different types of households (3 single-
person, a couple, and a family) regarding the use of eco-feedback technology to support shifting the
timing of consumption activities in a one-week trial per household (Rasmussen, Nielsen, &
Verdezoto, 2016). Rather than using a game, we took a more simplistic strategy combining an ambi-
ent awareness system (AAS) –an augmented clock– with a mobile app and proactive and positive
suggestions to make people aware about the good and bad times to use electricity. Traditionally, de-
mand shifting seeks a reduction of peak demand through shifting to off-peak times but this can have a
negative connotation as people might fear additional charges if the utility can figure out their energy
usage times. However, viewing energy by the CO2 emitted by electricity consumption and not in kWh
used, can offer more opportunities for shifting if people are willing to use electricity at the right time.
While our participants increased their energy awareness, only certain types of household activities
were recognized as “shiftable” and participants expressed the need to plan ahead as long as these ac-
tivities would not affect other everyday practices. An interesting finding was that some of our partici-
pants felt guilty using electricity when they were not able to consider the forecast information while
performing everyday practices (Rasmussen, Nielsen, & Verdezoto, 2016).
Understanding the Complexities of Everyday Practices
As people do not see themselves as consumers of energy (Strengers, 2011), we found practice theory
to be a helpful tool to understand the complexities of everyday practices and to uncover the challenges
of shifting electricity use. Taking a practice-oriented research approach and based on our experience,
we have proposed the Contextual Wheel of Practice (COWOP) as a research framework for
Sustainable HCI (Entwistle, Rasmussen, Verdezoto, Brewer, & Andersen, 2015). COWOP aims to
support designers and researchers with a practical tool to further understand the complexities of
everyday practices (suitable to shift vs. non-negotiable) towards the design of technological
interventions that better fit people’s everyday practices. In addition, COWOP serves as a boundary
object supporting a shared understanding among people with different backgrounds and
understandings regarding electricity usage. COWOP is composed by four different, equallly important
and interrelated quadrants to account for: 1) the individual (e.g., values, skills), 2) societal structure
(e.g., social norms), 3) infrastructure (e.g., physical environment), and 4) near materiality (e.g.,
technology). Rather than focusing only on the individual behavior, COWOP highlights aspects that
shape and change everyday practices that are important to consider when designing interventions. In
particular, especial attention should be given to how to support the articulation of work in everyday
practices that refers to all the planning and coordination of who, what, when, where, and how to
perform specific practices (Verdezoto, 2015).
Discussion And Conclusion
First, the examples highlight the importance of understanding the complexities of people’s everyday
practices when designing eco-feedback technology. Based on our experience, we have suggested tak-
ing a more practice-based research approach to facilitate the identification of activities that could be
potentially “shiftable” in people’s everyday practices.
“Feedback in energy demand reduction: Examining evidence and exploring opportunities” Edinburgh, July 2016Page 246
Second, as most FTs rely on screen, keyword, or tactile interaction focusing on the centre of user’s
attention, these methods might not be sufficient to interact with the physical world as many everyday
interactions take place in the periphery of user’s attention. As a result, FTs are often ignored; cause
information overload or drag attention away from the user’s primary activity. In our projects, we have
started looking at how FTs could be embeded into everyday settings through the use of physical and
peripheral features of ambient awareness systems. Early feedback highlights how giving simple
information through an ambient clock could make people aware and trigger actions towards more
sustainable behaviors. Furthermore, we also saw how the combination of the web forecast and the
physical clock could offer more opportunities to support shifting and their integration into everyday
practices.
Future work should further investigate the ways on how people appropriate FTs in relation to their
everyday practices, uncovering the participation of all the involved actors. In particular, the notion of
appropriation in Sustainable HCI has been overlooked as most research has taken a narrow focus on
individual behavior change.
Acknowledgments
I thank all my colleagues, students and participants from all the projects I have reported in this ab-
stract paper. This work has been supported by The Danish Council for Strategic Research as part of
the EcoSense project (11-115331) and by the Danish Energy Agency project: Virtual Power Plant for
Smartgrid Ready Buildings (12019).
References
Bang, M., Torstensson, C., & Katzeff, C. (2006). The PowerHhouse: A Persuasive Computer Game
Designed to Raise Awareness of Domestic Energy Consumption. In W. A. IJsselsteijn, Y. A.
W. de Kort, C. Midden, B. Eggen, & E. van den Hoven (Eds.), Persuasive Technology (pp.
123–132). Springer Berlin Heidelberg. Retrieved from
http://link.springer.com/chapter/10.1007/11755494_18
Barreto, M., Karapanos, E., & Nunes, N. (2013). Why don’t families get along with eco-feedback
technologies?: a longitudinal inquiry. In Proceedings of the Biannual Conference of the Italian
Chapter of SIGCHI (pp. 1–4). Trento, Italy: ACM.
(#) Brewer, R. S., Verdezoto, N., Holst, T., & Rasmussen, M. K. (2015). Tough Shift: Exploring the
Complexities of Shifting Residential Electricity Use Through a Casual Mobile Game. In Pro-
ceedings of ACM SIGCHI Annual Symposium on Computer-Human Interaction in Play (CHI
PLAY ’15). London, UK.
(#) Brewer, R. S., Verdezoto, N., Rasmussen, M. K., Entwistle, J. M., Grønbæk, K., Blunck, H., &
Holst, T. (2015). Challenge: Getting Residential Users to Shift Their Electricity Usage Pat-
terns. In Proceedings of the 2015 ACM Sixth International Conference on Future Energy Sys-
tems (pp. 83–88). Bangalore, India: ACM.
(#) Entwistle, J. M., Rasmussen, M. K., Verdezoto, N., Brewer, R. S., & Andersen, M. S. (2015). Be-
yond the Individual: The Contextual Wheel of Practice As a Research Framework for Sustain-
able HCI. In Proceedings of the 33rd Annual ACM Conference on Human Factors in Compu-
ting Systems (pp. 1125–1134). New York, NY, USA: ACM.
http://doi.org/10.1145/2702123.2702232
“Feedback in energy demand reduction: Examining evidence and exploring opportunities” Edinburgh, July 2016Page 247
Froehlich, J., Findlater, L., & Landay, J. (2010). The design of eco-feedback technology. In Proceed-
ings of the SIGCHI Conference on Human Factors in Computing Systems (pp. 1999–2008).
Atlanta, Georgia, USA: ACM.
Gustafsson, A., Katzeff, C., & Bang, M. (2010). Evaluation of a pervasive game for domestic energy
engagement among teenagers. Comput. Entertain., 7(4), 1–19.
(#) Rasmussen, M. K., Nielsen, L. L., & Verdezoto, N. (2016). Exploring the Flexibility Potential of
Everyday Life: Challenges and Opportunities for Environmental Sustainability. Under review
on track #9 “Environmental sustainability, socio-technical transitions and practices”. The 6th
STS Italia Conference on Sociotechnical Environments.
Snow, S., Buys, L., Roe, P., & Brereton, M. (2013). Curiosity to cupboard: self reported disengage-
ment with energy use feedback over time. In Proceedings of the 25th Australian Computer-
Human Interaction Conference: Augmentation, Application, Innovation, Collaboration (pp.
245–254). Adelaide, Australia: ACM.
Strengers, Y. A. A. (2011). Designing eco-feedback systems for everyday life. In Proceedings of the
SIGCHI Conference on Human Factors in Computing Systems (pp. 2135–2144). Vancouver,
BC, Canada: ACM.
(#) Verdezoto, N. (2015). Exploring Challenges and Opportunities for Eco-Feedback Technology.
Workshop on Expanding the Boundaries: A SIGCHI HCI & Sustainability at CHI 2015.
“Feedback in energy demand reduction: Examining evidence and exploring opportunities” Edinburgh, July 2016Page 248
Triggering Electricity-Saving Through Smart Meters: Play, Learn And Interact
Using Gamification And Social Comparison
Roberta Castri*1, Devon Wemyss
2, Francesca Cellina
1, Vanessa De Luca
1, Vivian Frick
2, Evelyn
Lobsiger-Kägi2, Pamela Galbani Bianchi
1 and Vicente Carabias
2
1: SUPSI University of Applied Sciences and Arts of Southern Switzerland
CH – 6952 Canobbio, Switzerland
*e-mail: [email protected], web: http://www.supsi.ch
2: ZHAW Zurich University of Applied Sciences
CH – 8401 Winterthur, Switzerland
e-mail: [email protected], web: http://www.zhaw.ch
Abstract
The present study tests and compares the efficacy of two different social game modes, collaborative
and competitive, as interventions to motivate electricity-saving behaviour at the household level by
means of a gamified mobile App, called Social Power. The collaborative game has a common savings
goal that the team aims to reach collectively. The competitive game compares weekly savings and
thus sets two cities against each other to save the most. The App integrates electricity saving challeng-
es, tips, quizzes in order to motivate participants to earn points and reach set consumption reduction
goals. Smart meter data complements the user experience by showing hourly and weekly electricity
consumption which is directly compared to their own historical consumption and their team’s savings
performance. While completing challenges on the App, participants learn how to positively improve
electricity use in their household. Participants are encouraged to interact with each other over Blog
and Facebook pages which provide additional information about the weekly challenge and overall in-
tervention. Overall, there were significant electricity savings in both game modes compared to histori-
cal values and the control group, however the feeling of community building and social interaction
was minimal. Thus the game approach was successful, but future studies can better integrate interac-
tion elements.
1 Introduction
Due to its enhanced energy feedback capacity, the advent of smart metering has been growingly
praised as a potential solution to assist society’s collective goal of reducing energy demand and adopt-
ing energy-efficient lifestyles. However, for a socio-technical innovation such as smart metering to be
effective, the information feedback needs to be embedded into a wider system of communication and
awareness-building to create a relation with the end-user, as it is not automation and fine control that
hold the promise of improving customer’s knowledge and motivation for change spontaneously (Dar-
by, 2010). Like other eco-innovations, smart meters ultimately require the acceptance and action of
people and communities to ensure success (Sabadie, 2013).
Hence much research is under way, particularly in the household domain, to test different feedback
modes aiming to positively impact energy-related behaviour and enhance the efficacy of smart meter
information to engage consumers.
“Feedback in energy demand reduction: Examining evidence and exploring opportunities” Edinburgh, July 2016Page 249
Considering the many limitations of individual decision-making (Heiskanen et al., 2012) and the fact
that human behaviour is socially embedded also when it comes to energy-related choices (Welsch &
Kuling, 2009), current energy feedback research orients around the social aspects of energy consump-
tion. In general, literature suggests that the inclusion of socially- based, engaging, competitive and
comparative feedback is more effective in reducing individual energy consumption (Abrahamse et al,
2005; Carrico & Riemer, 2011; Fischer, 2007; Schultz et al., 2007; Darby, 2006; Degen et al., 2013;
Vine et al. 2013) compared to more generalized and non-targeted information (Costanzo et al., 1986;
Breukers et al., 2013).
However, as behavioural change also implies educating and guiding consumers towards appropriate
actions, motivating engagement in energy-saving practices is very much about finding innovative
ways of learning.
In this context, gamification - the use of game design techniques and game mechanics in a real-world
context – provides an engaging, self-reinforcing and playful setting in which to raise energy policy
and management issues and features the virtue of increasing intrinsic motivation, engagement and
learning (Malone and Lepper, 1987; McGonigal, 2011). Considering that learning itself is fundamen-
tally a social process that is “situated within the practices of the community of practice, rather than
something which exists ‘out there’ in books” (Lave & Wenger, 1991), gamification techniques turn
out to be more effective in motivating behaviour change when the acquired knowledge is coupled with
hands-on, everyday life experiences.
In synergy with gamification, social comparison can also effectively trigger motivation (Grevet et al.,
2010). Depending on the context in which it is employed, social comparison may enhance collectiv-
ism when individuals understand that they are part of a larger picture (Haluza-DeLay, 2007). Or it can
lead, for example, to competitive feelings and striving for better performance (Siero et al., 1996). In
both cases, social group feedback can lead to a strong personal identification with one’s own group,
resulting in a more cooperative behaviour within the group (Wit & Wilke, 1988). Thus, both a collab-
orative and competitive perspective may co-exist and work together with social group feedback con-
tributing to the attainment of a collective goal. Considering that most environmental concerns today
are affected by collective behaviour, social group feedback emerges as an opportunity to encourage
people to increase individual action in order to attain a more significant collective impact for change.
2 Methodology
A local neighbourhood energy contest acted as the frame for the recruitment of 108 volunteering
households, ready to take part in a field experiment on collective electricity-saving in the respective
cities of Winterthur (n = 55), Canton Zurich, and Massagno (n = 53), Canton Ticino, Switzerland. The
energy contest took place over a period of 13 weeks, between February and May 2016. Out of the 108
recruited households, 46 actively played until the end of the contest period.
The participating households were provided with Social Power, a gamified mobile App for
smartphones, designed to maximise the efficacy of electricity feedback derived from smart meters by
means of a playful, interactive, and social learning narrative.
The pilot project seeks to determine whether a difference in game setting might impact social group
performance and better motivate people to manage their electricity consumption at home more sus-
tainably. Thus two Social Power game forms are implemented in the mobile App as behavior-change
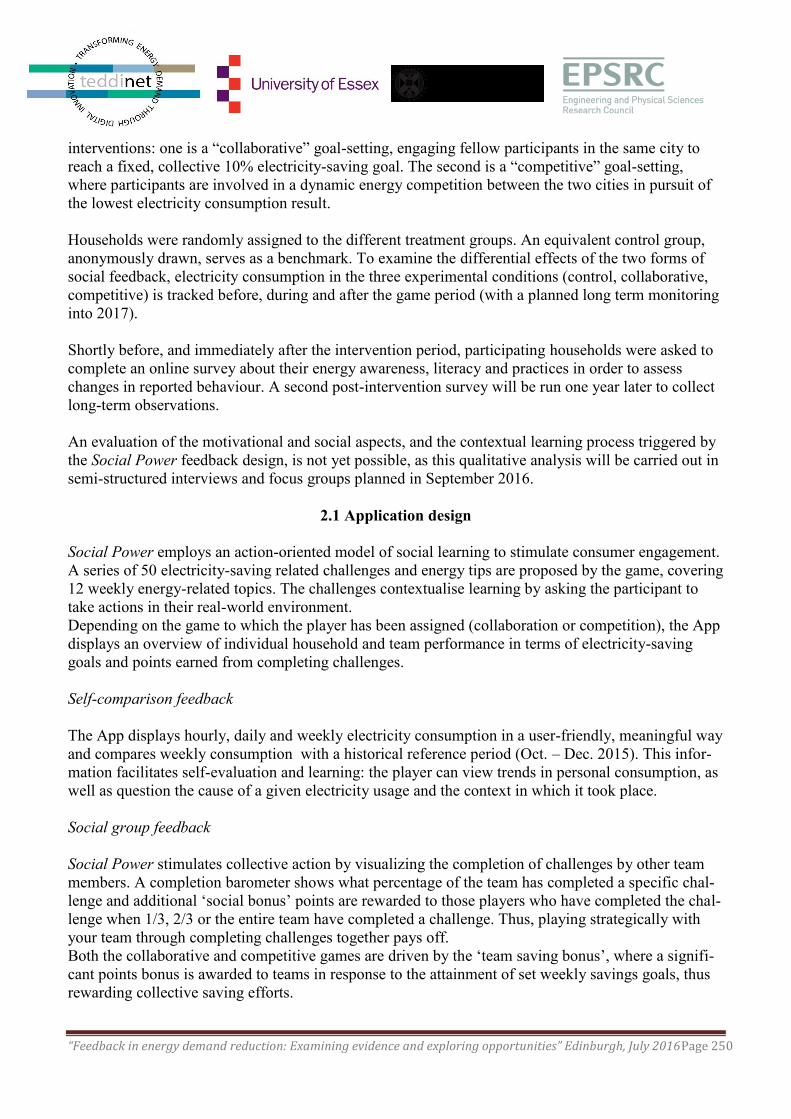
“Feedback in energy demand reduction: Examining evidence and exploring opportunities” Edinburgh, July 2016Page 250
interventions: one is a “collaborative” goal-setting, engaging fellow participants in the same city to
reach a fixed, collective 10% electricity-saving goal. The second is a “competitive” goal-setting,
where participants are involved in a dynamic energy competition between the two cities in pursuit of
the lowest electricity consumption result.
Households were randomly assigned to the different treatment groups. An equivalent control group,
anonymously drawn, serves as a benchmark. To examine the differential effects of the two forms of
social feedback, electricity consumption in the three experimental conditions (control, collaborative,
competitive) is tracked before, during and after the game period (with a planned long term monitoring
into 2017).
Shortly before, and immediately after the intervention period, participating households were asked to
complete an online survey about their energy awareness, literacy and practices in order to assess
changes in reported behaviour. A second post-intervention survey will be run one year later to collect
long-term observations.
An evaluation of the motivational and social aspects, and the contextual learning process triggered by
the Social Power feedback design, is not yet possible, as this qualitative analysis will be carried out in
semi-structured interviews and focus groups planned in September 2016.
2.1 Application design
Social Power employs an action-oriented model of social learning to stimulate consumer engagement.
A series of 50 electricity-saving related challenges and energy tips are proposed by the game, covering
12 weekly energy-related topics. The challenges contextualise learning by asking the participant to
take actions in their real-world environment.
Depending on the game to which the player has been assigned (collaboration or competition), the App
displays an overview of individual household and team performance in terms of electricity-saving
goals and points earned from completing challenges.
Self-comparison feedback
The App displays hourly, daily and weekly electricity consumption in a user-friendly, meaningful way
and compares weekly consumption with a historical reference period (Oct. – Dec. 2015). This infor-
mation facilitates self-evaluation and learning: the player can view trends in personal consumption, as
well as question the cause of a given electricity usage and the context in which it took place.
Social group feedback
Social Power stimulates collective action by visualizing the completion of challenges by other team
members. A completion barometer shows what percentage of the team has completed a specific chal-
lenge and additional ‘social bonus’ points are rewarded to those players who have completed the chal-
lenge when 1/3, 2/3 or the entire team have completed a challenge. Thus, playing strategically with
your team through completing challenges together pays off.
Both the collaborative and competitive games are driven by the ‘team saving bonus’, where a signifi-
cant points bonus is awarded to teams in response to the attainment of set weekly savings goals, thus
rewarding collective saving efforts.
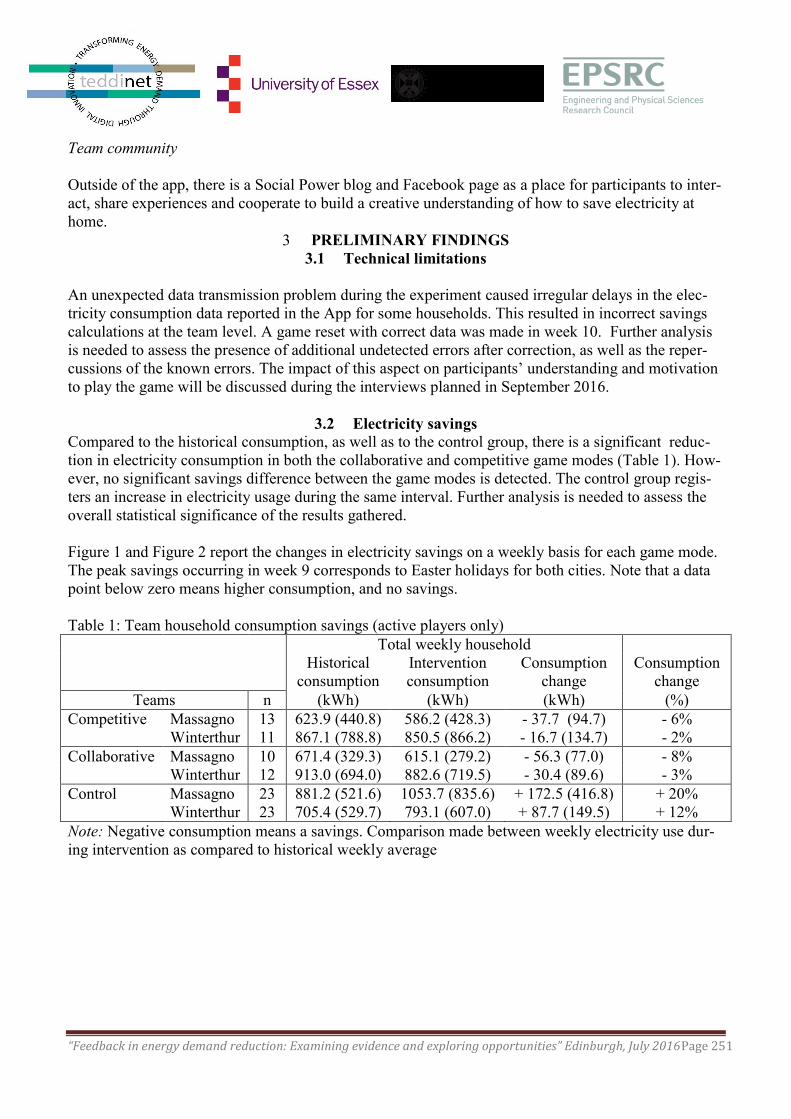
“Feedback in energy demand reduction: Examining evidence and exploring opportunities” Edinburgh, July 2016Page 251
Team community
Outside of the app, there is a Social Power blog and Facebook page as a place for participants to inter-
act, share experiences and cooperate to build a creative understanding of how to save electricity at
home.
3 PRELIMINARY FINDINGS
3.1 Technical limitations
An unexpected data transmission problem during the experiment caused irregular delays in the elec-
tricity consumption data reported in the App for some households. This resulted in incorrect savings
calculations at the team level. A game reset with correct data was made in week 10. Further analysis
is needed to assess the presence of additional undetected errors after correction, as well as the reper-
cussions of the known errors. The impact of this aspect on participants’ understanding and motivation
to play the game will be discussed during the interviews planned in September 2016.
3.2 Electricity savings
Compared to the historical consumption, as well as to the control group, there is a significant reduc-
tion in electricity consumption in both the collaborative and competitive game modes (Table 1). How-
ever, no significant savings difference between the game modes is detected. The control group regis-
ters an increase in electricity usage during the same interval. Further analysis is needed to assess the
overall statistical significance of the results gathered.
Figure 1 and Figure 2 report the changes in electricity savings on a weekly basis for each game mode.
The peak savings occurring in week 9 corresponds to Easter holidays for both cities. Note that a data
point below zero means higher consumption, and no savings.
Table 1: Team household consumption savings (active players only)
Total weekly household
Historical
consumption
Intervention
consumption
Consumption
change
Consumption
change
Teams n (kWh) (kWh) (kWh) (%)
Competitive Massagno 13 623.9 (440.8) 586.2 (428.3) - 37.7 (94.7) - 6%
Winterthur 11 867.1 (788.8) 850.5 (866.2) - 16.7 (134.7) - 2%
Collaborative Massagno 10 671.4 (329.3) 615.1 (279.2) - 56.3 (77.0) - 8%
Winterthur 12 913.0 (694.0) 882.6 (719.5) - 30.4 (89.6) - 3%
Control Massagno 23 881.2 (521.6) 1053.7 (835.6) + 172.5 (416.8) + 20%
Winterthur 23 705.4 (529.7) 793.1 (607.0) + 87.7 (149.5) + 12%
Note: Negative consumption means a savings. Comparison made between weekly electricity use dur-
ing intervention as compared to historical weekly average
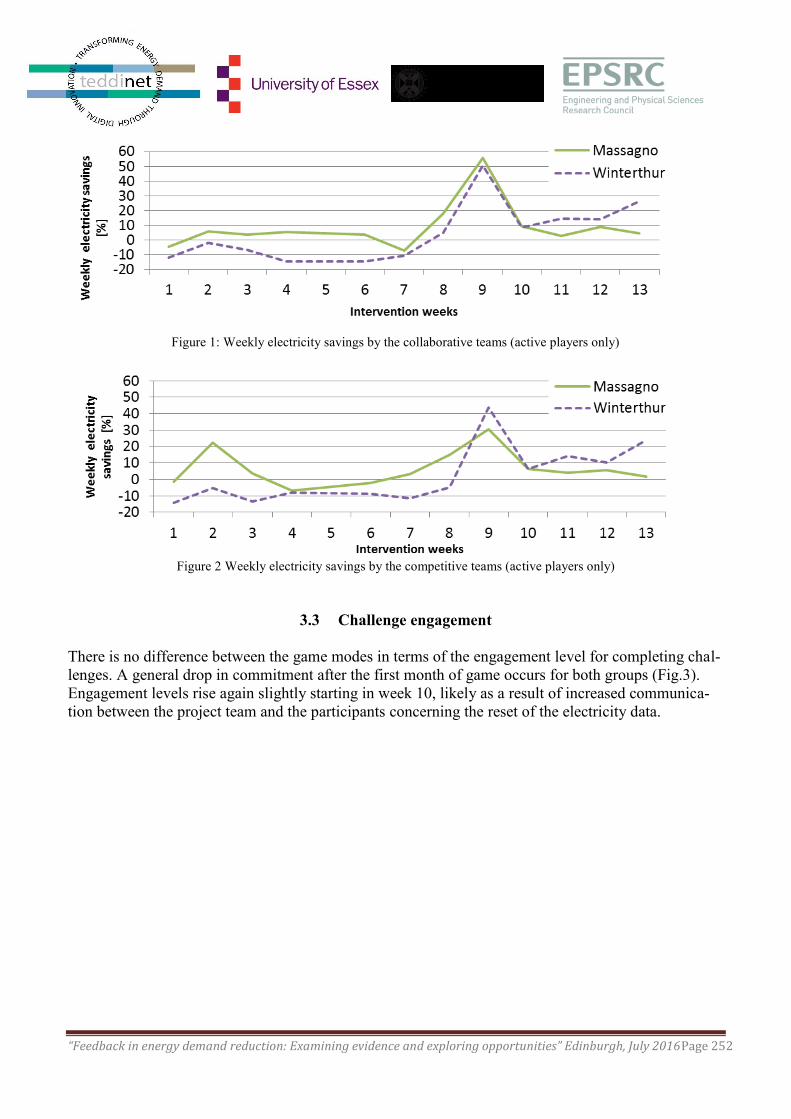
“Feedback in energy demand reduction: Examining evidence and exploring opportunities” Edinburgh, July 2016Page 252
Figure 1: Weekly electricity savings by the collaborative teams (active players only)
Figure 2 Weekly electricity savings by the competitive teams (active players only)
3.3 Challenge engagement
There is no difference between the game modes in terms of the engagement level for completing chal-
lenges. A general drop in commitment after the first month of game occurs for both groups (Fig.3).
Engagement levels rise again slightly starting in week 10, likely as a result of increased communica-
tion between the project team and the participants concerning the reset of the electricity data.
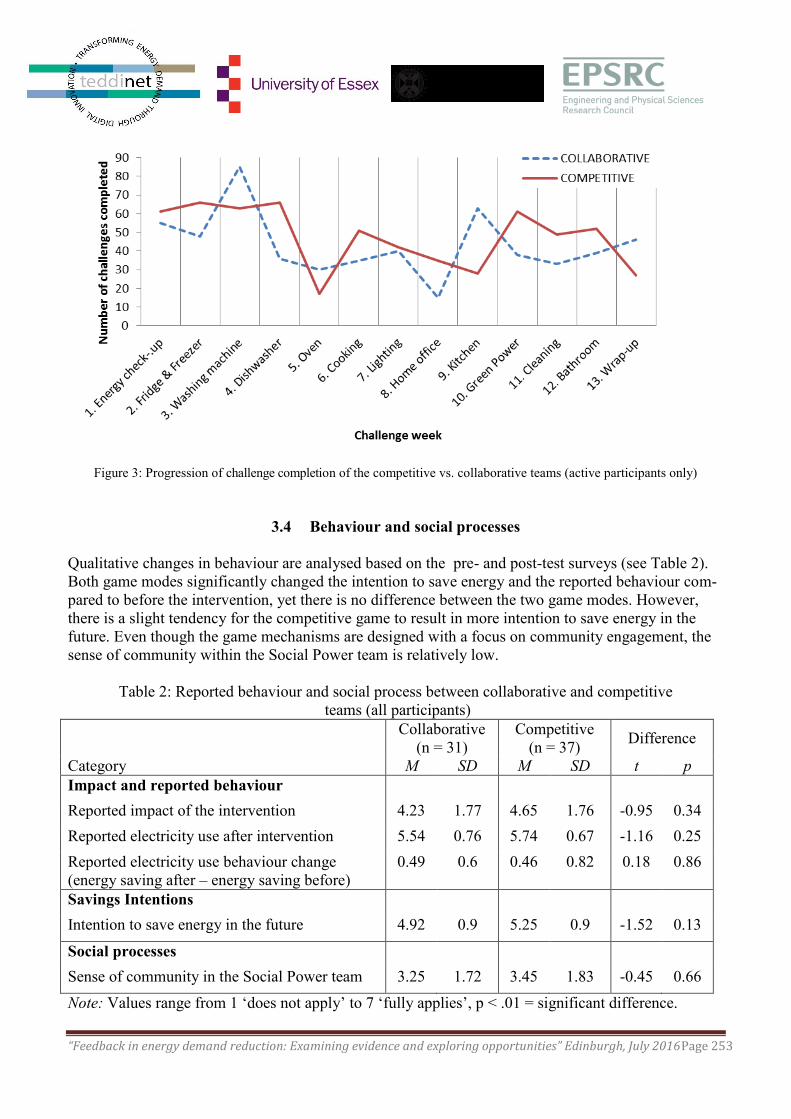
“Feedback in energy demand reduction: Examining evidence and exploring opportunities” Edinburgh, July 2016Page 253
Figure 3: Progression of challenge completion of the competitive vs. collaborative teams (active participants only)
3.4 Behaviour and social processes
Qualitative changes in behaviour are analysed based on the pre- and post-test surveys (see Table 2).
Both game modes significantly changed the intention to save energy and the reported behaviour com-
pared to before the intervention, yet there is no difference between the two game modes. However,
there is a slight tendency for the competitive game to result in more intention to save energy in the
future. Even though the game mechanisms are designed with a focus on community engagement, the
sense of community within the Social Power team is relatively low.
Table 2: Reported behaviour and social process between collaborative and competitive
teams (all participants)
Collaborative
(n = 31)
Competitive
(n = 37) Difference
Category M SD M SD t p
Impact and reported behaviour
Reported impact of the intervention 4.23 1.77 4.65 1.76 -0.95 0.34
Reported electricity use after intervention 5.54 0.76 5.74 0.67 -1.16 0.25
Reported electricity use behaviour change
(energy saving after – energy saving before)
0.49 0.6 0.46 0.82 0.18 0.86
Savings Intentions
Intention to save energy in the future 4.92 0.9 5.25 0.9 -1.52 0.13
Social processes
Sense of community in the Social Power team 3.25 1.72 3.45 1.83 -0.45 0.66
Note: Values range from 1 ‘does not apply’ to 7 ‘fully applies’, p < .01 = significant difference.
“Feedback in energy demand reduction: Examining evidence and exploring opportunities” Edinburgh, July 2016Page 254
4 Conclusions
This preliminary analysis finds that the deployment of both a competitive and collaborative social
game mode is effective in reducing electricity consumption. Neither approach outperformed the other,
but long term efficacy of these feedback mechanisms will be examined in 2017.
The sense of community in the Social Power teams has been reported as rather low. Hence, it appears
that the reported results are not specifically impacted by the wider social setting of the game, but pos-
sibly the self-comparison feedback instead. With the current results and experimental design, it is not
possible to differentiate the effect between the individual feedback and social game mechanics, but
planned follow-up interviews will help gain deeper insights into the motivational and social processes
triggered (or inhibited).
Critical points in the present design might be (1) team formation and (2) anonymity, both of which
were modelled as to accommodate a rather large team size (n = 30): players were randomly assigned
to teams and did not create their own teams and natural social groups. Also, to preserve single users’
privacy, performances were displayed to others only in aggregate form. Since the online world is ab-
sent of many basic cues of identity, personality, and social roles, this setting can make it harder for
players to collaborate on a common goal.
Here, relying on out-of-game social media sources (Blog, Facebook) to motivate group engagement
seems not to be effective. In the future, the communication aspect between team members should be
revisited. An interesting field of research might be the integration of game design that facilitates exist-
ing real-life relationships over merely network-based virtual communities to maximize intra-group
communication and support.
Acknowledgements
The research has been supported by the Gebert Rüf Stiftung under the BREF program Social Innova-
tion, as well as carried out thanks to the Swiss utilities AEM Massagno and Stadtwerk Winterthur.
References
Abrahamse, W., L. Steg, et al. (2005) A review of intervention studies aimed at household energy
conservation. Journal of Environmental Psychology 25(3): 273-291.
Breukers, S., Mourik, R., & Heiskanen, E. (2013) Changing energy demand behavior: Potential of
demand-sidemanagement. In J. Kauffmann & K.-M. Lee (Eds.), Handbook of Sustainable Engineer-
ing (pp. 773-792). Dordrecht: Springer.
Carrico, A. R., & Riemer, M. (2011) Motivating energy conservation in the workplace: An evaluation
of the use of group-level feedback and peer education. Journal of Environmental Psychology, 31, 1-
13.
Costanzo, M., Archer, D., Aronson, E., & Pettigrew, T. (1986) Energy conservation behavior: The
difficult path from information to action. American Psychologist, 41, 521-528.
Darby, S. (2006) The effectiveness of feedback on energy consumption – A review for DEFRA of the
literature on metering, billing and direct displays, Environmental Change Institute, University of Ox-
ford.
“Feedback in energy demand reduction: Examining evidence and exploring opportunities” Edinburgh, July 2016Page 255
Darby, S. (2010) Smart metering: what potential for householder engagement? Building Research &
Information, 38(5), 442 – 457.
Degen, K., Efferson C., Frei F., Goette L, Lalive R. (2013) Smart Metering, Beeratung oder Sozialer
Vergleich – was beinflusst den Elektrizitätsverbrauch? Ewz, Bundesamt für Energie BFE
Forschungsprogramm Energie-Wirtschaft-Gesellschaft.
Donath, J., Karahalios, K. and Viegas, F. (1999) Visualizing conversation. In Proceedings of HICSS
1999, p. 2023.
Fischer, C. (2007) Feedback on Household Electricity Consumption: a Tool for Saving energy? Ener-
gy Efficiency 1(1), 79 – 104.
Grevet, C., Mankoff, J. and Anderson S.D. (2010) Design and Evaluation of a Social Visualization at
encouraging sustainable behavior. IEEE. Proceedings of the 43rd
Hawaii International Conference on
System Sciences.
Haluza-DeLay, R. (2007) Developing a compassionate sense of place: environmental and social con-
scientization in environmental organisations. The University of Western Ontario (Canada).
Heiskanen, E., Hyysalo, S., Jalas, M., Juntunen, J., Kuusi, H., Lovio, R., Rinkinen, J. (2012): Local
Experimentation and Societal Learning for Sustainability Transitions - Does It Work in Practice? Con-
ference Paper IST 2012 - Navigating Theories and Challenging Realities; 08/2012
Lave, J. and Wenger, E. (1991) Situated Learning. Legitimate Peripheral Participation. Cambridge,
UK: Cambridge University Press.
Malone, T. & Lepper (1987). Making Learning Fun: A Taxonomy of Intrinsic Motivations for Learn-
ing. In Snow, R. & Farr, M. J. (Ed), Aptitude, Learning, and Instruction Volume 3: Conative and Af-
fective Process Analyses. Hillsdale, NJ
McGonigal, J. (2011). Reality is broken: Why games make us better and how they can change the
world.Penguin.
Sabadie, J. (2013) “Technological innovation, human capital and social change for sustainability. Les-
sons learnt from the Industrial Technologies Theme of the EU’s Research Framework Programme,”
Sci. Total Environ., vol. 481, no. 1, pp. 668–673, 2014
Schultz, P. W., Nolan, J. M., Cialdini, R. B., Goldstein, N. J., & Griskevicius, V. (2007) The construc-
tive, destructive and reconstructive power of social norms. Psychological Science, 18, 429-434.
Siero, F., Bakker, A., Dekker, G., & Van Den Burg, M. (1996). Changing organizational energy con-
sumption behavior through comparative feedback. Journal of Environmental Psychology, 16:235-246.
Vine, D., Buys L., Morris P. (2013) The effectiveness of Energy Feedback for Conservation and Peak
Demand: A Literature Review. Open Journal of Energy Efficiency, 2, 7-15.

“Feedback in energy demand reduction: Examining evidence and exploring opportunities” Edinburgh, July 2016Page 256
Welsch, H., & Kuhling, J. (2009) Determinants of pro-environmental consumption: The role of refer-
ence groups and routine behavior. Ecological Economics, 69, 166-176.
Wit, A. & Wilke, H. (1986). Effecten van gemeenschappelijke versus individuele lotsbepaling in co-
operatief keuzegedrag in drie soorten sociale dilemma’s (Effects of common versus individual … in
co-operative choice behavior in three types of social dilemmas). In A. van Knippenberg, M. Poppe, J.
Extra, G. Kok & E. Seydel, Eds, Fundamentele Sociale Psychologie, Vol. 2. Tilburg: Tilburg Univer-
sity Press, pp. 51–70.
“Feedback in energy demand reduction: Examining evidence and exploring opportunities” Edinburgh, July 2016Page 257
SESSION 6: Insights from Industry & Policy
Energy Efficiency Advice: A Toolkit for Engaging Consumers at Smart Meter In-
stallation Visits
Andrew Charlesworth and Mairi Budge, Smart Metering Programme, Department of Energy and
Climate Change, [email protected]
Abstract
This study developed and tested an energy efficiency advice intervention to be delivered, by installers,
at Smart Meter installation visits. The final advice approach included a range of print materials focus-
ing on different energy saving behaviours (including routine and purchasing behaviours), designed to
support installers in delivering tailored. We used an action research approach to develop the materials,
with input from consumer focus groups, depth interviews and a stakeholder workshop. They were
tested through a pilot of over 400 actual Smart Meter installations, following which depth interviews
were conducted with consumers and focus groups held with participating installers. The research iden-
tified a range of factors that can support advice provision, including the use of engaging evidence-
based hooks; myth-busting information; and guidance in energy know-how to ensure customers know
not just what to do, but how to do it. The pilot also had practical implications for the delivery of ad-
vice, including ensuring expectations are set in advance of installation visits, enabling installers to de-
liver advice through training and linking advice provision to use of the IHD to exploit synergies be-
tween feedback and advice. DECC will publish this research in full later in 2016.
Overview
Energy suppliers are required to roll out electricity and gas smart meters to homes and smaller busi-
nesses in Great Britain by 2020. At present, the Smart Meters Implementation Programme is in its
‘Foundation’ stage in which technical specifications and the communications infrastructure are being
put in place, and suppliers are developing their roll-out strategies and customer journeys. To support
the delivery of consumer benefits from the roll-out, the UK Government established a consumer en-
gagement strategy, which includes specific aims to support consumers (including those who are vul-
nerable, have low incomes, or have pre-payment meters) in using smart metering to manage their en-
ergy consumption. The Strategy envisages that these aims will be achieved, in part, through energy
saving behaviour change, facilitated by advice and guidance, on energy and energy reduction (by pa-
per, web, mobile, face-to-face or phone).
The Strategy also sets out how consumer engagement will be delivered, including requiring suppliers
to provide consumers with clear and accurate advice and guidance about the smart meter, In-Home-
Displays (devices providing real time feedback on consumption also provided at installation) and en-
ergy efficiency at the installation visit. Research with consumers who had received Smart Meters early
“Feedback in energy demand reduction: Examining evidence and exploring opportunities” Edinburgh, July 2016Page 258
in the roll-out, carried out as part of DECC’s Smart Meters Early Learning Project [1], identified the
potential for this advice to be optimised, through:
Tailoring to customers, so that it is salient
Providing consumers with specific actionable strategies, including ones that make use of feed-
back available from smart meter data, via the In-Home-Display (embedding use of feedback
with consumers)
Making links for consumers to wider energy efficiency advice and support
Considering the needs of vulnerable and priority consumers
Exploring the role of specific motivational devices (prompts/ free practical aids)
This study tested an approach to delivering advice designed to meet these objectives using an ‘action
research’ methodology with the advice delivery approach developed iteratively across four phases.
The first of these explored best practice for the content and delivery of advice via a small-scale evi-
dence review of key literature and a stakeholder workshop. Phase Two developed draft pilot advice,
informed by general public discussion groups and depth interviews with vulnerable customers. In
Phase Three, following installer training, the advice was piloted with over 400 customers across four
locations in installation visits. The final stage evaluated the piloted approach in follow-up research
with a wide range of customers (through follow-up interviews conducted between six and ten weeks
after installation) and installers, as well as a stakeholder workshop, and finalised the approach in light
of the findings. The project was innovative, using actual installation visits to pilot advice delivered by
installers, at an early stage of the GB Smart Meter roll-out.
The final advice approach included a range of print materials focusing on different energy saving be-
haviours, designed to support installers in delivering tailored advice. Behaviours covered by the mate-
rials ranged from low or zero-cost tips, to buyers guides for more efficient appliances and information
on energy efficiency measures. Installers were trained to use observations, along with some initial pri-
oritisation questions to identify the most relevant factsheets for householders at the beginning of the
visit. Following the installation and demonstration of the IHD, the installer would then return to the
advice and answer any questions from the householder.
Our approach to the materials was informed by the concept of energy ‘know how’[2] and materials
were developed that included actionable strategies for consumers to reduce their energy consumption
with. A range of motivational messages were tested, including comfort, financial savings, environ-
mental messages, and framing messages around social norms. We drew on previous work using visu-
alisations of heat loss to communicate energy consumption from heat and the impact of insulation to
consumers [3]. As advice will be delivered through smart meter installation visits, we also explored
the potential for synergies between advice and real time feedback (provided by the IHD), with behav-
ioural strategies that made use of feedback from the IHD included on the materials.
“Feedback in energy demand reduction: Examining evidence and exploring opportunities” Edinburgh, July 2016Page 259
Evidence from the pilot supported this, identifying the following key elements: an engaging evidence-
based hook (ideally, estimated financial savings from an independent source); myth-busting infor-
mation; and guidance in energy know-how to ensure customers know not just what to do, but how to
do it. Although a range of fact sheets were provided to consumers, the research also signalled the im-
portance of ensuring these were relevant. The most popular areas of advice for consumers were mes-
sages providing free and simple ways to save energy (through routine behaviours) and information
that could be provided in response to specific, unprompted, questions.
The pilot also had practical implications for the delivery of advice. Communicating to consumers in
advance that energy efficiency advice will form part of the installation visit can increase consumer
engagement. Training can provide installers with the skills and confidence to provide advice on a
range of measures and property types. Lastly, linking the demonstration of the IHD with energy effi-
ciency advice provides a opportunity for householders to gain motivation and skills for identifying
appropriate changes in their home.
Reflecting the current stage of the GB Smart Meter roll-out this study did not include a fully repre-
sentative group of consumers. Study participants were more likely to be ‘early adopters’ of Smart Me-
ters, a group who are potentially more engaged in their energy consumption. Energy suppliers are not
currently rolling out Smart Meters to all their customers, and those with pre-payment meters, specific
medical equipment needs, or where English is not their first language are not included in this study.
Lastly, follow-up interviews were carried out over Winter heating months, we anticipate that both ad-
vice in general, and specific recommendations may be more or less salient to consumers at different
points in the year. As the roll-out progresses there will be opportunities to assess the effectiveness of
different consumer engagement strategies with a wider range of customers, and over a greater period
of time following installation.
References
[1] Department of Energy and Climate Change, Smart Metering Early Learning Project, DECC
(2015). Available from: https://www.gov.uk/government/publications/smart-metering-early-learning-
project-and-small-scale-behaviour-trials
[2] Burchell, K. e. a., 2015. What is energy know-how, and how can it be shared and acquired?.
ECEEE Summer Study Proceedings, pp. 1979-1990.
[3] Pahl S, Goodhew J, Boomsma C and Sheppard SRJ (2016) The Role of Energy Visualization
in Addressing Energy Use: Insights from the eViz Project. Front. Psychol. 7:92. doi:
10.3389/fpsyg.2016.00092
“Feedback in energy demand reduction: Examining evidence and exploring opportunities” Edinburgh, July 2016Page 260
Improving participation in the energy market
Alexander Belsham Harris, Citizens Advice
Abstract
Consumer engagement in a well-functioning energy market is intended to work via consumers being
given the freedom to contract with any supplier, having easy access to information in order to
compare providers and marrying the two by acting in their self interest to periodically switch tariffs
and secure a better deal. In theory this arrangement should drive better outcomes, by ensuring that
energy suppliers compete against each other on price and non-price factors in order to win a greater
share of the market. The outcomes of this activity are intended to be positive for all: consumers
because they get more choice and a better service than a monolithic nationalised utility could ever
provide, and companies as they profit through innovation, and thus drive each other on to do better.
Yet, 18 years after the privatisation of the domestic market, the energy supply industry is struggling to
live up to these ideals. An ongoing Competition and Markets Authority (CMA) investigation found
that 56% of consumers said they had never switched energy supplier, almost a third reported that they
had never considered switching their gas or electricity provider and 5% were unaware that they could
change their gas or electricity supplier. Although switching rates 1 have increased slightly in recent
years this market context indicates that more 2 work is needed to encourage consumers to actively
engage with the energy market.
Counter to conventional economics, those who have exercised their market power and switched have
reaped benefits seemingly at a cost to inactive consumers, as price differentials between open-ended
and fixed term tariffs have risen sharply in recent years. Unlike other markets, the 3 nature of energy
means that price cuts are not easily perceived, and require positive action by individuals to realise,
adding a further layer of complexity to attempts at opening up the benefits of competition to all.
There has been no shortage of schemes to tackle this lack of engagement, including public information
campaigns and regulatory changes aimed at making switching easier. Despite this, clearly more work
is needed to encourage consumers to actively engage with the energy market.
Citizens Advice proposes that this is because the current approach of optimising information, process
and awareness-raising mechanisms are important and necessary, but may not be sufficient to reach the
non-engaged. Other factors, such as the nature of energy as a product and time constraints on people
must be better understood in order to develop appropriate remedies and increase engagement. The
process of switching supplier loses much of its allure in a market like energy which provides a
homogenous ‘necessity good’ and where, apart from cost and possibly customer service, there is no
discernible difference in product performance between suppliers.
The use of behavioural insights to understand the reality of the consumer experience and to inform the
design of appropriate remedies has grown in use by public bodies and regulators over the last 10
years. Remedies have tended to focus on particular ‘nudges’ such as altering wording, requiring
greater consistency on the type of information to be provided in key communications, new channels of
communication, incentives etc.

“Feedback in energy demand reduction: Examining evidence and exploring opportunities” Edinburgh, July 2016Page 261
In the short and medium term, Citizens Advice considers it necessary that a switching-led model for
the energy market should evolve in a way that at least recognises the behavioural reality outlined
above and adapts to it, to succeed in a way that has eluded policymakers until now.
This research comprised testing with over 1,000 consumers of four different behavioural insights-
based switching messages, and presents results on the comparative effect of those messages on
consumers’ perception of and willingness to engage in the energy market.
References
1) CMA Energy Market Investigation, July 2015
https://assets.digital.cabinet‐office.gov.uk/media/559fc933ed915d1592000050/EMI_provisional_findi
ngs_report.pdf
2) http://www.energy‐uk.org.uk/publication.html?task=file.download&id=5659
3) Citizens Advice analysis from July revealed that the average difference between suppliers’ cheapest
fixed deal and their standard tariffs now stands at £176, and that the gap between the two has risen by
a staggering 47% in just the last three years
“Feedback in energy demand reduction: Examining evidence and exploring opportunities” Edinburgh, July 2016Page 262
The surge of energy data: What does it mean for EDF Energy employees and
householders?
Christopher Weeks, EDF Energy and University of Bristol
Abstract
Over the last four years at EDF Energy, we have seen an interesting change that is going to revolu-
tionise the way we provide feedback about energy, namely, the rapid increase in the amount of data
we are now collecting. It is strange to say that four years ago the energy industry was data-starved, but
for most householders we only had two meter readings per year that were 6 to 12 months apart if we
were lucky. Now we have 10 second resolution electricity consumption data and gas readings every
30 minutes thanks to smart meters and CADs (consumer access devices) being installed, and 10 min
heating setpoint, indoor temperature, outdoor temperature, heating schedule and boiler usage data
thanks to smart thermostats. This gives us a total of 10,272 data points per customer per day. The
change has been rapid and long awaited, but what impact does it have on the way we provide feed-
back to EDF Energy employees and householders? In this extended abstract we first start by looking
at the core drivers for the rapid increase in data, we then move onto highlight what EDF Energy R&D
UK Centre has been developing to help maintain the best feedback for both employees and house-
holders and we highlight a number of the key learnings that we have achieved over the last 4 years as
we move to using real-time large scale datasets for the energy sector.
1. The data surge - What is driving the rapid data increase?
In just the past four years we have seen a huge increase in the overall data that the energy sector is
collecting from householders. Firstly, it is no secret that in the UK we are moving to a world of smart
meters with the mass rollout looking to be completed by 2020 and over 53 million gas and electricity
meters installed in domestic homes and small businesses (Ofgem 2013). However, one vital point of
the smart meter rollout that is sometime underestimated is the huge surge of data that will be generat-
ed from the smart meters rollout. This will be amplified by the deployment of CADs (customer access
devices) that enable the collection of 10-second electric meter readings and 30-minute gas meter read-
ings. This means that we are collecting 8,640 electric readings per day per customer, and 48 gas meter
readings per day per customer. At this resolution we can now start to look at disaggregation of total
energy consumption into separate appliances within the home. In conjunction, the datasets that we are
collecting can now be accessed in near real-time rather than looking at historical static datasets, ena-
bling us to develop real-time visualisations and algorithms, rather than doing retrospective data analy-
sis. In pushing to increase the level of detail achieved by disaggregation, with the aim of providing
energy use information at the level of the individual appliance, we require sub-second data; this will
soon become the standard level of data granularity.
“Feedback in energy demand reduction: Examining evidence and exploring opportunities” Edinburgh, July 2016Page 263
In building on top of the smart meter rollout, we have also seen an increase in the take up of smart
thermostats. Smart thermostats add a number of vital data streams including: heating setpoint tem-
perature, indoor temperature, householder’s heating schedule and boiler usage. Heating, ventilation
and cooling (HVAC) is the largest source of energy consumption in the residential sector (Lu et al.
2010), therefore we must understand these data streams if we are going to move towards a more sus-
tainable domestic energy sector. In a similar manner to smart meters, the smart thermostat data resolu-
tion is sub-hour at 10 - 30 minutes and can be accessed in near real-time. The smart thermostat pro-
vides a vital dataset to enable house modelling, but it also enables us to understand the way in which
householders heat their homes, and therefore allows us to start to model the householder’s heating be-
haviours.
The next dataset to add is external weather. This data can come from a householder’s own outdoor
weather modules or from the large number of public or open industrial weather stations that provide
reliable localised weather conditions. Together, these provide a clear overview of the external temper-
ature and weather conditions at the householder’s property. Connecting the external temperature with
the internal heating settings provided by the smart thermostats allows for advanced house thermal
modelling, and it also helps us to better understand the relationship between external temperature and
householders’ expected comfort. This final point is especially important given the rise in the level of
comfort householders expect. In 1970 the average UK household temperature was 12oC, and it has
risen to 17.6oC in 2011 (Palmer et al. 2013). These levels of comfort are replicated across Europe,
with Nordic countries having the highest average indoor temperatures in the EU (22oC in Swedish
houses), while Southern Europe has an average indoor temperature of 20oC (Kemna 2014).
Finally, as householders drive to make their households smarter we see an increase in sensors in the
home. These may be related to energy - for example thermostatic radiator valves - or linked to other
aspects of domestic life such as cameras, locks or safety devices. . These help build up a much richer
picture of how householders are using their homes, but also adds to the ever increasing amount of data
points collected. In focusing on space heating, there is large energy savings to be had by knowing
when individuals are in their homes or which room they are currently occupying, especially as space
heating makes up 66% of total domestic energy consumption (Department of Energy and Climate
Change 2014). However, we must understand the security and privacy implications as we move for-
ward into building a smart home that understands when your are at home and your behaviours in the
home (Komninos et al. 2014).
The surge in data has a large impact on the types and methods of providing feedback to both employ-
ees and householders. It must be noted that in this abstract we start with employees as this is the core
area that the authors have recently been working on, and it is also a research area that is often under
researched compared to feedback that is given to householders.
“Feedback in energy demand reduction: Examining evidence and exploring opportunities” Edinburgh, July 2016Page 264
2. The impact on employees
In the business environment data is changing the way that we are making decisions and we are seeing
a large number of companies using business intelligence to make better decisions about products, ser-
vices and their customers. Therefore, as we have a surge in data in the energy sector, especially in the
connected home market, it is critical that the feedback that we provide to employees helps them to
make better actionable decisions. In looking to achieve this we have built a platform called the virtual
data lab. The virtual data lab is a cloud based platform that draws together all the data streams high-
lighted in section 2, we transform and restructure the data, then perform different methods of analysis
before finally, converting the data into visualisations that are accessible to employees from across the
business. In the analysis there are four core areas of investigation: house modelling, householder mod-
elling, energy advice, and country wide data analysis and clustering. In providing feedback to em-
ployees there is a wide number of different stakeholders from researchers, marketers, engineers, senior
stakeholders and strategist. In developing a platform that provides feedback to a wide audience of
stakeholders we have learnt a lot from the challenges we have faced.
The first area of challenge was how to present data that would enable actionable decision making. To
solve this challenge there are two approaches, firstly you can take a inductive grounded research ap-
proach and build your knowledge up from the data, or alternatively you can take a more deductive
theory building approach where you develop the questions you wish to answer from the data. In both
these approaches we found that you end up with a chicken and egg situation, as you’re not sure if what
you find from the grounded approach is useful, or if you can answer your questions from the data in
the deductive approach. This challenge is also heightened in an environment where not everyone us-
ing your visualisations has a high level of data literacy. Thus, we have found it important to involve
employees in the analysis of the data and the development of the data visualisations. This method of
development is usually facilitated through workshops, user testing and hackathons. In taking this ap-
proach the feedback is the end result of a learning journey that helps build data literacy and helps
build data democracy, as individuals feel empowered with the tools and knowledge to convert the data
into their own feedback visualisations. Finally, as the employees build their own visualisations to suit
the problem they wish to solve or decisions they want to make, they can use either an inductive or de-
ductive approach to suit their needs.
3. The Impact on householders
There is already a large body of research on the best methods for giving energy consumption infor-
mation to householders (Darby 2006), therefore in this abstract we aren’t looking to define any new
methods of feedback. However, we would like to highlight the way we see feedback changing with
the increasing amount of data collected. The first area that is already moving forward is appliance dis-
aggregation (the ability to break down overall energy consumption into individual appliances). Appli-
ance disaggregation helps to provide a level of transparency around electric energy consumption, but
it has limited impact on space heating as disaggregation of gas consumption is mainly split between
heating, heating water and gas cooking. It also only provides more details to householders, which has
“Feedback in energy demand reduction: Examining evidence and exploring opportunities” Edinburgh, July 2016Page 265
shown to increase engagement (Chakravarty & Gupta 2013) but it can still be complex for household-
ers to understand. Therefore, in looking to engage householders further we have to look at what is the
next step for feedback.
We believe there is a need to build feedback methods that allow householders to naturally engage with
their energy consumption in a language and framework that they understand. With this in mind we
have been implementing a platform that can take natural language and convert it into answers for
householders, for example “what is my gas consumption last week?”, results in “your gas consump-
tion last week was 1,522.75 kWh”. In building these methods of feedback householders can start to
explore the data by posing their own questions and having natural responses to their questions. This
approach allows the householder to control the level of detail they wish to be presented in the feed-
back rather than the level of detail being specified for them.
The next step towards helping householders reduce their overall energy consumption is to understand
how we can use appliance disaggregation and natural engagement to develop householders’ energy
literacy. Without a good level of energy literacy householders cannot understand how to reduce their
overall energy consumption. It has also been highlighted that limited expert knowledge can be a barri-
er stopping householders installing energy efficiency measures (Weeks et al. 2015). We therefore
need to demonstrate that energy is not super-complex, we just need to find the right method of teach-
ing it. In other industries there are a number of examples of complex topics being taught to consumers
to help them understand what they are buying: data plans in telecoms, calories in the health sector and
drink-driving limits for the public health sector. In empowering householders with the right level of
energy literacy we need to make sure we highlight the factors that cause the biggest impact on their
overall energy consumption. For example, encouraging householders to install energy efficiency
measures has a much larger impact than small behavioural changes like turning lights off (Weeks et
al. 2014). Finally, in providing feedback to householders we need to understand how we can engage
the least engaged householders, as a number of householders don’t read their bills or letters that are
sent to them from their energy company. How do you provide feedback to householders in a way that
starts to engage them in their energy consumption? This is a highly challenging research area that
needs to be developed further.
4. Conclusions
In this extended abstract we have shown a number of the drivers that are causing an acceleration in
data collected from householders’ homes, we have shown how EDF Energy R&D UK Centre is im-
plementing a platform that allows employees to build their own feedback visualisations to understand
the data, and finally highlighted how we are investigating a method to develop householders energy
literacy through appliance disaggregation and natural engagement.
5. References
Chakravarty, P. & Gupta, A. (2013), ‘Impact of Energy Disaggregation on Consumer Behavior’, Be-
havior, Energy and Climate Change Conference (July), 13–14.
“Feedback in energy demand reduction: Examining evidence and exploring opportunities” Edinburgh, July 2016Page 266
Darby, S. (2006), ‘The Effectiveness of Feedback on Energy Consumption A Review For DEFRA of
the Literature on Metering, Billing and Direct Displays’, Environmental Change Institute University
of Oxford 22(April), 121.
Department of Energy and Climate Change (2014), ‘2013 UK Greenhouse Gas Emissions, Provisional
Figures and 2012 UK Greenhouse Gas Emissions , Final Figures by Fuel Type and End-User Statisti-
cal release’, (March).
Kemna, R. (2014), Average EU building heat load for HVAC equipment, Technical Report August.
Komninos, N., Philippou, E. & Pitsillides, A. (2014), ‘Survey in smart grid and smart home security:
Issues, challenges and countermeasures’, IEEE Communications Surveys and Tutorials 16(4), 1933–
1954.
Lu, J., Sookoor, T., Srinivasan, V., Gao, G., Holben, B., Stankovic, J., Field, E. & Whitehouse, K.
(2010), ‘The smart thermostat: Using Occupancy Sensors to Save Energy In Homes’, Proceedings of
the 8th ACM Conference on Embedded Networked Sensor Systems - SenSys ’10 55(June), 211.
Ofgem (2013), ‘Transition to smart meters’. Accessed: 20-06-2016. URL:
https://www.ofgem.gov.uk/gas/retail-market/metering/transition-smart-meters
Palmer, J., Cooper, I., Tillson, A.-A., Pope, P., Armitage, P., Hughes, M. & Godoy-Shimizu, D.
(2013), ‘United Kingdom housing energy fact file 2013’, gov.uk .
Weeks, C., Delalonde, C. & Preist, C. (2014), ‘Power law of engagement: Transferring disengaged
householders into retrofitting energy savers’, 2nd International Conference on ICT for Sustainability
(ICT4S 2014) .
Weeks, C., Delalonde, Charles & Preist, C. (2015), ‘Investigation into the slow adoption of retrofitting
- What are the barriers and drivers to retrofitting, and how can ICT help?’, 29th International Confer-
ence on Informatics for Environmental Protection (EnviroInfo 2015) Third International Conference
on ICT for Sustainability (ICT4S 2015) (EnviroInfo), 325–334.
“Feedback in energy demand reduction: Examining evidence and exploring opportunities” Edinburgh, July 2016Page 267
How is feedback on energy consumption currently being delivered to customers?
Scott Bryant (Analyst) & Steven Ashurst (Senior Analyst), Delta Energy & Environment (Edin-
burgh). Contact: [email protected]
Abstract
Most customers remain apathetic when it comes to the subject of energy, despite a sizeable proportion
of the population indicating that saving energy is a priority. From our research into the decentralised
energy sector Delta-ee is able to provide a clear overview of why and how feedback on energy con-
sumption is currently being delivered to customers. More specifically, with reference to its application
in existing commercial business activities, and how this might evolve over the coming years. Our on-
going direct customer research has highlighted what forms and formats of feedback the market is
looking for; accurate predictions on running cost savings, which are delivered via either written advice
or from real-time prompts through internet-enabled devices. Two innovative business models current-
ly incorporating feedback as a key component of the offering are tiko and OhmConnect. Each has
seen moderate success to date, based on different value drivers; the former is focusing on the provi-
sion of timely graphical feedback while the latter uses a gamified approach to reward customer partic-
ipation in demand response. Key challenges to increasing the use of feedback as a way to reduce ener-
gy consumption include the presentation of feedback in a convincing way to demonstrate tangible sav-
ings can be made, and determining the most appropriate types of incentives to get customers to take
action.
Overview
The energy system is undergoing a process of rapid and unprecedented change. As a consequence of
this so are energy markets – and particularly how energy related services and products are offered to,
used by, and paid for by end-users. Arguably, the opportunity has never been stronger to increase rev-
enues from energy related businesses and at the same time engage people with their energy usage.
However, the challenge ahead remains considerable, as most customers remain apathetic when it
comes to the subject of energy.
Delta-ee provides our clients with commercial insight and strategic recommendations across our wide
range core knowledge areas – all of which share a focus on distributed energy and low-carbon heat.
With this presentation we look to add to the debate of how energy demand is/will/can be reduced
through feedback, by sharing some of the key highlights from our recent research covering the domes-
tic sector, and from both the supply- and demand-side perspective.
The goal is to provide a clear overview, with reference to existing commercial business activities, of
why and how feedback on energy consumption is currently being delivered to customers, and how this
might evolve over the coming years. Specifically, we address three key related questions:
1. What are the current drivers for feedback?
2. How is feedback being deployed to engage the contemporary energy customer?
3. How is this approach to feedback deployment likely to evolve in the coming years?
We have addressed these questions through a combination of our Heat Insight Service (HIS), Con-
nected Home Service (CHS), and Energy Services Innovation (ESI) research services. Based on our
ongoing direct customer research, we have been able to establish the current key drivers for customers
to engage with the provision of consumption feedback. Subsequently, by looking at examples we have
“Feedback in energy demand reduction: Examining evidence and exploring opportunities” Edinburgh, July 2016Page 268
analysed as part of our ESI research, we explore in-detail two innovative business models currently
incorporating feedback as a key component of the offering: tiko and OhmConnect. More specifically,
we analyse the value drivers for these offerings. Finally, we examine the ongoing challenges to-date
experienced in the rollout of these business models, and how they are likely to develop in the future.
Current Drivers
So far, we find that in the majority of cases the principal supply-side drivers for feedback on energy
usage are to upsell related energy products and services (e.g. insulation), and to reduce end-user con-
sumption. The latter driver being a stepping stone to releasing additional value to the supplier through
mechanisms like demand response. As for customer drivers for feedback, we have used ongoing re-
search via an online panel of homeowners in Great Britain has allowed us to gain valuable insight into
what feedback would best be received by customers to encourage behavioural change.
During the 2015/16 financial year, out of the 901 private householders that Delta-ee surveyed and
asked the question: “how much of a priority will it be to you to reduce your energy costs in the com-
ing 12 months?”, over 60% stated it is either “quite a high priority” or a “very high priority”. Of
course there are a wide range of drivers for why customers would look to receive feedback on energy
their consumption, but for now it seems it is the simple economic argument which outweighs all other
options (emotional, societal, environmental, etc.). Over the last five years of researching why custom-
ers take energy-related decisions, we have routinely found this to be the case – e.g. “to reduce on-
going running costs” is consistently the strongest motivation behind people installing microgeneration
technology in their homes.
We have similarly found that over 60% of householders would be interested in receiving feedback on
their energy consumption, e.g. “to highlight how you could save on your energy bills”. There is far
less homogeneity in customer thinking regarding the form that feedback should take in order to en-
courage people to action the advice. We see that, at least for the ‘private homeowner’ segment of the
market (and we caution that this will not necessarily be representative of the entire domestic sector),
feedback in the form of “incentives – e.g. rewards for taking action” will be necessary to encourage
behavioural change among the majority of users (and we explain the case of one US company current-
ly active in the market with this strategy). The provision of feedback in the form of written advice
(e.g. on a fuel bill), and through real-time alerts/nudges/triggers (through an in home display or a mo-
bile phone app) also have strong appeal – to over 20% of the customers who are open to feedback –
further emphasising how varied the approach to feedback must be in order to maximise its efficacy.
Finally, regarding the nature of the data, the preference is again more obvious – almost two-thirds of
customers state that potential savings should be shown in pounds and pence so it “grabs their atten-
tion”. Around half this much of customers are looking for statistical feedback; how much energy and
the percentage of running costs could be saved by the measures suggested.
Current Deployment of Feedback
Tastes in the energy sector are evolving, with lots of talk about the dash for the provision of services
in the utility market (although in some markets it’s more like a slow, Sunday morning stroll). With
this shift away from the commoditisation of energy, towards a provision of services to customers,
comes an influx of new business model offerings from new and incumbent players. These business
models, typically driven by new start-ups, have attempted to engage with a traditionally disinterested
and unengaged end-consumers. Two firms who have recently been gaining traction in the energy
“Feedback in energy demand reduction: Examining evidence and exploring opportunities” Edinburgh, July 2016Page 269
services space, entrants from outside the energy sector, have adopted, customer-centric, demand re-
sponse feedback propositions:
tiko (Switzerland)
OhmConnect (US)
tiko is a spin-out of the telecommunications giant Swisscom, providing a means for low cost demand
response (DR) from in-home electrical heating systems with advanced analytics and a free remote
heating control app and control interface for customers. tiko provides direct, upfront feedback to pro-
spective customers about their energy consumption, and the potential energy savings and DR value
generated. This is achieved through the installation of a tiko smart-plug-control and monitoring sys-
tem (combined with a cloud-based app) which provides users with ongoing graphical feedback as to
the energy consumption of their electric heating system, and the ongoing efficiency and savings creat-
ed for them by the tiko system.
From the customer-side, they have the opportunity to override any tiko request for demand response
(i.e. a temporary shut-down of their system). However, the key point of value creation for tiko, is that
customers rarely do this, as the overall proposition from tiko is that they will never impact user com-
fort, all the while providing energy savings and DR revenue. Interestingly, the feedback mechanism
from tiko is a customer-pull setup, with customers having the option to never look at the feedback,
safe in the knowledge that tiko is ensuring their comfort and maximising their efficiency. This use of a
non-force-fed style of feedback to customers, and the subsequent relationship building that it facili-
tates, presents the potential for tiko to interpose itself between energy suppliers and customers, from
where it can upsell other smart services.
On the other side of the Atlantic, OhmConnect, an energy data analytics software start-up, has also
looked to capture value from the demand response market through the ongoing engagement of their
customers with feedback. More specifically, OhmConnect looks to bridge the valley of energy cus-
tomer disengagement, providing an entertaining and accessible platform for users to engage with their
energy consumption, all for free. Demand response is turned into a “game” for residential consumers,
with both manual and automated requests for participation in DR events, ‘OhmHours’, allowing users
to score points which can be used in OhmConnect community competitions (or eventually taken as
cash).
OhmConnect generates value from system operators by helping to shift or reduce residential load to
avoid the need for expensive peaker plants, passing on 80% of this revenue to its customers. Customer
participation allows the customer relationship to be effectively owned by OhmConnect, as they re-
quire customers to provide them with their utility customer accounts in order to access and analyse
smart meter data to formulate suitable demand response events. Not only has OhmConnect developed
a unique approach to access and aggregate residential DR capacity i.e. by engaging customers with
their energy consumption, but by effectively owning the customer relationship they have positioned
themselves to extend into other energy retail offerings in the future (at the expense of utilities).
tiko and OhmConnect highlight both the commercial opportunities for engaging customers with feed-
back, and the need for existing stakeholders in the energy sector to engage with feedback, else risk
being left behind by competitors and new entrants from both within and outside the energy market.
“Feedback in energy demand reduction: Examining evidence and exploring opportunities” Edinburgh, July 2016Page 270
The Evolution of Feedback in the Energy Market
Retail energy companies have traditionally dealt with customers at an account level, with relationship
management reserved for larger commercial and industrial clients. Customer data has inevitably been
poorer than in industries such as financial services, so client needs have often not been properly un-
derstood. It is therefore perhaps not surprising that attempts at upselling services have often had
mixed results. Smart meters are starting to improve matters by replacing demand usage profiles with
records of actual behaviour, and the research Delta-ee conducted with customers shows a latent level
of interest in options like real-time alerts. However, this is just the start, with the rise of IoT, cloud
services, advanced data analytics and the connected home all bringing opportunities for insight. The
age of the passive energy consumer is coming to an end, replaced by users who have learned they
have power in the energy services market and would now like to start using it.
Research from our Connected Homes Services shows how the accelerating deployment of connected
home devices such as smart thermostats will be a route to expand the provision of feedback within the
UK domestic heating market (already yearly installations number over two hundred thousand), but
that industry also faces a key challenge related to this. To date, ‘feedback’ is at best a secondary prop-
osition in most customer offerings. British Gas, for example, promotes the ‘Hive’ smart thermostat
(the UK market leading connected home product) based on the increased degree of control and flexi-
bility it affords customers – not on how much it can save them on their energy bills.
There are questions over how compelling telling people they can save ‘X percent’ on their annual fuel
bills is as a sales pitch, and if customers actually believe these claims. Industry typically cites a sav-
ings range of between 10%-30%, which is too wide to allow providers to confidently put a figure on
how much their products will save an ‘average’ customer. ‘Comfort’ is easier to guarantee and so has
emerged as they primary engagement model. For ‘energy saving’ to become a higher priority, provid-
ers will have to be able to give a more accurate estimation of the savings for energy customers – and
come up with the right ways of engaging users, through incentivisation in particular, to engage the
wider market on the concept of feedback.
“Feedback in energy demand reduction: Examining evidence and exploring opportunities” Edinburgh, July 2016Page 271
Energy-feedback services provided by utilities: Lessons learnt from the Empower-
ing project
*Stoyan Danov ª, Jordi Cipriano ª, Xavier Cipriano ª, Gerard Mor ª
ª Centre Internacional de Mètodes Numèrics en Enginyeria (CIMNE), Building Energy and Environ-
ment Group, C/ Rambla Sant Nebridi 22, 08222 Terrassa, Spain
* Corresponding and presenting author: [email protected]
Abstract
The Empowering project involved 6 utility companies and a team of university researchers, social sci-
entists, and energy experts for developing and providing consumption feedback services to utility cus-
tomers. The objective was to enable the utilities for delivering cost-effectively personalised infor-
mation to the end-users, empowering them for energy savings, and thus improving their satisfaction
with the utility. A range of services were developed within a centralised analytics system coupled to
local user visualisation tools at the utilities. The services were applied and tested over a population of
more than 344.000 household customers at four pilots in Austria, France, Italy and Spain. Empower-
ing demonstrated noticeable beneficial impact of the services on the users, improving both the energy
saving and customer satisfaction. Customer engagement showed to be a key issue for programme suc-
cess. The easy service access, the perceived usefulness of the information, intelligibility, and personal
motivation are the principal factors for engagement, but the legislative and regulatory frameworks
have also considerable impact. Metering data access, customer consent and regulated energy bill con-
tent are limiting factors for effective service provision. Some regulatory changes, simplification and
unification across European countries might be considered for wider adoption of the services in the
future.
Introduction
The Empowering project was led by the motivation to deliver effective and cost-efficient energy ser-
vices to residential consumers and targeted their offering through utility companies in order to take
advantage of the existing data from fiscal meters and the possibility to offer the services at large scale.
In a situation of extensive rolling-out of smart meters the relevance of this approach is currently in-
creasing. The project developed a range of informative services implemented as a personalised energy
reports, delivered either with the energy bill, or through online software tools offered by the utilities to
their customers in order to provide them with more insight and detail about their actual energy con-
sumption. The principal target was the improvement of the end-user energy efficiency and awareness
on basis of improved information, benefitting at the same time the utility with increased customer sat-
isfaction.
The action involved 6 utility companies from 4 European member states – Austria, France, Italy and
Spain, and the services were deployed over a population of 344.000 customers. Services were provid-
ed mainly to electricity consumers, but were offered also to gas consumers in France and to district
heating customers in Italy.
Empowering started over the current state-of-the-art and further developed a comprehensive modular
set of services implemented in a central cloud-based analytics engine supporting the local utility ser-
vice systems. The approach permits each utility to customise its own solution by configuring the de-
sired service modules from the analytics engine. The specific utility and customer requirements were
“Feedback in energy demand reduction: Examining evidence and exploring opportunities” Edinburgh, July 2016Page 272
envisaged and taken into consideration in the design of each pilot implementation, a process that ena-
bled considerable knowledge acquisition and sharing among partners.
The project succeeded to overcome the main technical barriers by developing a flexible analytics en-
gine seamlessly coupled to the utility systems and delivering through their back office of highly con-
figurable services, avoiding the necessity of especially skilled staff at the utilities. The developed free
open software solution is important result of the project and is currently maintained, promoted and
further-developed by CIMNE, the lead technology partner of the project (see BEE Data,
www.beegroup-cimne.com).
The present work reviews the results from more than 1 year of service operation and analyses the dif-
ferent factors influencing the success of the programmes. Special emphasis is placed on the im-
portance of customer engagement, pointing out some regulatory and policy measures that might help
for the widespread application of these services in the future.
Technological solution and services
The technological solution developed in Empowering is an open source data analytics engine ex-
changing data with the local utility energy-feedback tools through standard Application Programming
Interface (API) under high security and privacy standard. The services are implemented as software
modules in the cloud-based analytics engine which allows each utility to configure its own service so-
lution and use its own user interfaces for providing the feedback services.
The final collection of services resulted in a set of 42 service modules pertaining to following concep-
tual service groups:
Comparison with similar households
Comparisons with own previous consumption
Detailed consumption displaying
Personalised energy saving tips
Consumption-weather dependence
Consumption prediction
Alerts
The solution is inherently suited for the European market due to its flexible and adaptable concept ca-
pable to address different legislative and utility-specific requirements without major implementation
effort. The major customer’s privacy requirements are resolved by adopting largely the “privacy-by-
design” principle. This was achieved by accepting only strictly anonymised data and adopting treat-
ment procedures that do not permit individual customer to be recognised outside the utility, or cus-
tomers to be able to recognise those to which are compared to. In any case, only the necessary infor-
mation for the services is exchanged and is kept in the system only for the necessary time.
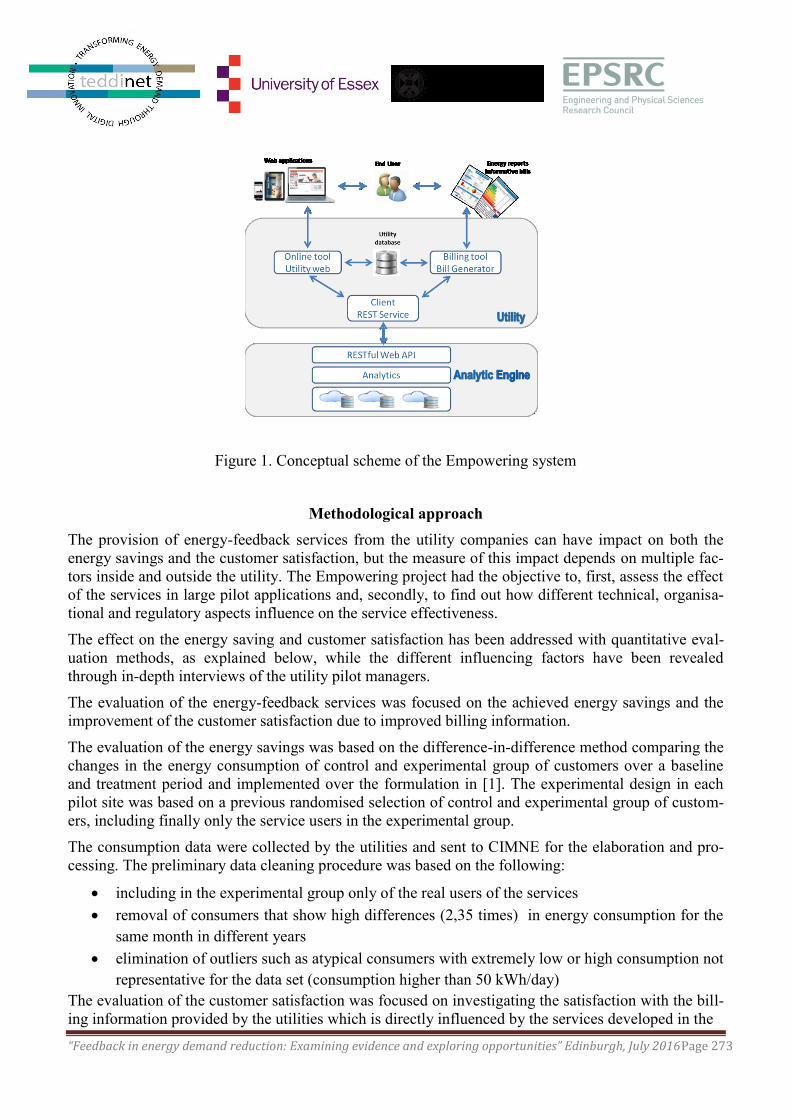
“Feedback in energy demand reduction: Examining evidence and exploring opportunities” Edinburgh, July 2016Page 273
Figure 1. Conceptual scheme of the Empowering system
Methodological approach
The provision of energy-feedback services from the utility companies can have impact on both the
energy savings and the customer satisfaction, but the measure of this impact depends on multiple fac-
tors inside and outside the utility. The Empowering project had the objective to, first, assess the effect
of the services in large pilot applications and, secondly, to find out how different technical, organisa-
tional and regulatory aspects influence on the service effectiveness.
The effect on the energy saving and customer satisfaction has been addressed with quantitative eval-
uation methods, as explained below, while the different influencing factors have been revealed
through in-depth interviews of the utility pilot managers.
The evaluation of the energy-feedback services was focused on the achieved energy savings and the
improvement of the customer satisfaction due to improved billing information.
The evaluation of the energy savings was based on the difference-in-difference method comparing the
changes in the energy consumption of control and experimental group of customers over a baseline
and treatment period and implemented over the formulation in [1]. The experimental design in each
pilot site was based on a previous randomised selection of control and experimental group of custom-
ers, including finally only the service users in the experimental group.
The consumption data were collected by the utilities and sent to CIMNE for the elaboration and pro-
cessing. The preliminary data cleaning procedure was based on the following:
including in the experimental group only of the real users of the services
removal of consumers that show high differences (2,35 times) in energy consumption for the
same month in different years
elimination of outliers such as atypical consumers with extremely low or high consumption not
representative for the data set (consumption higher than 50 kWh/day)
The evaluation of the customer satisfaction was focused on investigating the satisfaction with the bill-
ing information provided by the utilities which is directly influenced by the services developed in the
“Feedback in energy demand reduction: Examining evidence and exploring opportunities” Edinburgh, July 2016Page 274
project. The evaluation didn’t have as objective to assess the global satisfaction of the customers with
their utility company, as it is affected by a number of external factors such as energy prices, govern-
mental policies, taxes, etc., which are out of the project scope.
The evaluation, similarly to the SERVQUAL methodology [2], surveyed the perceptions and expecta-
tions of users regarding the services, establishing as an indicator of satisfaction the gap score between
them (Gap score=Perception-Expectation). The methodology allowed for evaluating quantitatively the
quality of the Empowering services and the changes of satisfaction by analysing the user perceptions
and the gap score before and after receiving the services.
The customer preferences about additional information and motivation for the service use were inves-
tigated through surveys, focus groups and customer interviews.
The influencing factors affecting the widespread service application were investigated by collecting
and analysing qualitatively the practical experiences of the utilities in implementing feedback services
together with the legal and regulatory context in the participating pilots. The information was collect-
ed during the project and through in-depth interviews with the pilot managers by the end of the action.
The interviews focussed on the experiences from the service implementation and operation and dis-
cussed, among other things, the following issues:
reasons for offering the services
technical, organisational, and legislative challenges
technical challenges
utility internal organisation structure challenges
legal and regulatory challenges
ways to increase customer participation
The main findings from the interviews were summarised and conclusions for further replications were
drawn.
Results
Energy savings
The energy savings have been evaluated over comparable experimental and control groups of custom-
ers. Where possible from the availability of additional user characteristics, the analysis has been done
separately for groups of customers with similarities in their energy use or service treatment. This was
done to minimise the possible selection bias that might arise from analysis of heterogeneous groups of
customers in overall evaluation, and provided also more insight into the results.
The evaluation demonstrated the achievement of energy savings in all of the pilot sites.
Electricity savings ranged between 3 and 21% among the different pilots and user groups
Gas consumption savings of about 4 % was achieved at the French pilot.
District heating energy savings ranged between 5 and 6% at the two sites of the Italian pilot.
The only user group among which the services couldn’t demonstrate positive impact was a sub-group
of electricity customers in the Italian pilot which was characterised with higher contract power with
reference to the standard usual contract for retailers (families) use in Italy. A slight increase of the en-
ergy consumption of about 1,8% during the service period was observed for that group.
The obtained results should be interpreted in the context of the differences in content and offering
mode across the pilots. In Austria and France the services were offered in opt-in mode requiring user
“Feedback in energy demand reduction: Examining evidence and exploring opportunities” Edinburgh, July 2016Page 275
registration. In Italy and Spain the services were offered in opt-out mode by sending energy reports to
the predefined experimental group. In Spain, additionally, an opt-in strategy was used for more inter-
ested users by offering online service access upon registering; this allowed for a comparison between
the effectiveness of both modes. The opt-out service consisting in energy report delivered to the whole
experimental group achieved 6% saving versus the 11% saving obtained by the customers who re-
ceived in addition also online treatment (opt-in). The more detailed analysis of the savings by the con-
sumption level of the users showed predominantly higher savings for the upper consumption segments
of customers in all pilots.
Customer satisfaction
The quantitative evaluation the impact over the customer satisfaction demonstrated the positive effect
of the treatment, with 67% of the whole amount of users involved in the program satisfied with the
services.
The particular aspects of improvement from the services with respect to the previous state which were
quantified in the evaluation on the average are:
20% improvement in the presence of additional information on energy consumption
29% improvement of suggestions and help on how to save energy
25% improvement in tools for understanding the energy consumption
17% improvement of availability of information at any time
The global increase of the satisfaction with the received information from the utilities increased on the
average about 20%.
Customer preferences for information
During the initial developing phase of the project an analysis of the customer preferences about the
type of information to be included in the services was performed. It consisted in local surveys based
on precursor services asking the customers to rank their preferences about the information they would
like to receive in addition to the bills. The options included different type of comparatives, tips and
predictions. A compilation of 964 utility customer surveys in Austria, France, Italy, Spain, and Den-
mark showed a ranking for the most valuable information for them:
Personalised energy saving tips (74% of the customers)
Comparisons with previous periods (69% of the customers)
Similar household comparisons (50% of the customers)
Motivation for service use
A sociological study performed at the French pilot in Grenoble [3] about the motivation for using the
Empowering services discovered the following types of motivations related to different user energy
profiles:
Economic (44%) – motivated only by economic reasons
Economic and ecologic (30%) – motivated by economic reasons but also happy to contribute
to emissions’ reduction
Energyphile (15%) – interested in technology, efficiency and control
Ecologic (11%) – motivated exclusively by ecological reasons
“Feedback in energy demand reduction: Examining evidence and exploring opportunities” Edinburgh, July 2016Page 276
Discussion of findings
The Empowering project demonstrated that energy-feedback services delivered by the utilities can
save energy among the users in all of the participating countries, and that the additional information,
in general, contributes to increasing the satisfaction with the utility. The amount of savings varied
considerably from one pilot to another, with savings between 3% and 21%, with the only exception of
a subgroup of users in Italy that increased their consumption with 1.8%.
The customer engagement with the services was identified as a key challenge for the overall success
of the programmes. The active service usage depends on factors, such as personal motivation of the
consumers for energy savings, perceived usefulness of the service, appearance and ease of use of the
service interfaces.
Motivation
The sociological study [3] revealed different motivations for usage of the Empowering services
among a representative sample of utility customers. It classified the users into 4 energy profiles (see
above), suggesting that each of them responds to different type of messages and keywords. For exam-
ple, users with economic rationale respond positively to simple messages and economic saving stimu-
lus, while users with energyphile rationale require more detailed explanations about how the results in
the services were obtained. Effective feedback services have to take into account the user’s energy
profile in order to provide effective and motivating communication.
Usefulness
The perceived usefulness of the services depends on how the feedback received helps to the user in
achieving his objectives. The extensive user surveys performed in the project provided some insight
into the question. Surveys indicate that 74% of the users need specific actionable advices personalised
to their particular situation. Comparisons with previous periods permitting the user to make causal
connection between his actions and the energy consumption are considered useful by 69% of the us-
ers. Sufficient consumption data resolution (daily, hourly) and timely feedback can increase the effect
of these comparatives for energy saving. Another type of comparatives is that with similar house-
holds, perceived as useful by 50% of the users. Similar household comparatives work on social norm
principles and might be stimulating for higher than average consumers, but can also lead to a “re-
bound effect” in lower than average consumers. Feedback from the users during the service operation
showed that comparatives with similar households might be irritating for some users, especially if
they have already applied some energy saving measures. The last suggests cautious application of
these comparatives and special attention to the selection of the customers’ similarity criteria.
User interfaces
The user interfaces for effective feedback services are important to assure the easy access to the ser-
vices and to maintain the user’s interest, thus making persisting the effect of the services. The project
tested both web-based tools and periodic energy reports in order to provide the services. The selection
of the service modality was influenced by the utility preferences, as well as by the national regulatory
restrictions.
The offering of web tools alone demonstrated not very effective, with overall usage between 2-5%.
For accessing the services, the customers had to subscribe in the web portal (opt-in), attracting only
very motivated customers. On the other hand, the energy reports delivered periodically to every cus-
tomer reached everybody (opt-out), but offered less possibilities for detailed information, showing
relatively lower effect on savings. The most effective way of service offering was the combination of
“Feedback in energy demand reduction: Examining evidence and exploring opportunities” Edinburgh, July 2016Page 277
periodic energy report with basic information combined with web-based tool providing more detailed
information for interested users. The Spanish pilot site offering both modalities of services permitted
clear comparison: users receiving only energy reports saved 6% of energy and those who in addition
accessed the web tool saved 11%.
External factors - regulation
The regulation in the different European member states regarding metering data access, customer con-
sent and regulated energy bill content had a strong implication in the service design and affected indi-
rectly the customer engagement. The impediments to collect and store frequent consumption data, the
tedious procedures for customer consent and the regulation obliging for excessive amount of some-
times “useless” for the user information within the energy bills led to a number of restrictions which
reduced the energy-saving potential of the services.
Conclusions and recommendations
The effective providing of energy-feedback services by the utilities depends on a complex combina-
tion of factors, some of which can be controlled by the service provider, and other which are external.
The national legislation and regulation regarding energy consumption data and customer data treat-
ment strongly influences the possibilities for service offering, the service content, and finally affects
the user engagement and the overall results of the energy-feedback programmes.
Some regulatory changes for facilitating the consumption data access, the management of the custom-
er consent for receiving the services and the adoption of measures permitting the offering of the ser-
vices by default (opt-out) to all utility customers will help for the wider and more effective adoption
of these services in the future.
References
[1] U.S. Department of Energy Smart Grid Investment Grant Technical Advisory – Group Guidance
Document #12. DOE’s Meta Analysis Framework, 2011.
[2] Parasuraman A., Zeithaml V. A., Berry L. L., Servqual, Journal of retailing, 64 (1), 12-40, 1988.
[3] Robin Cordella-Génin, Stéphane la Branche, “EMPOWERING”: De l’information energetique a la
sobriete?, Agence Locale de l’Energie et du Climat, Grenoble, France, 21 October, 2015.
“Feedback in energy demand reduction: Examining evidence and exploring opportunities” Edinburgh, July 2016Page 278
“Waiting for Data: Market Adaptations to Poor Smart Meter Policies in
America”
Michael E. Murray, Mission:data Coalition
Abstract
The worldwide installation of smart meters was supposed to bring a cornucopia of ubiquitous energy
feedback technologies that would significantly reduce building energy use in the U.S.. Unfortunately,
smart meters have, in practice, provided very little direct value to consumers. In America, over 60 mil-
lion smart meters are installed but only a few thousand have connected devices providing real-time
energy information. Based on the author’s experience as CEO of an energy feedback company in Sili-
con Valley, the following reasons have emerged for the dismal utilization rates of smart meters in the
U.S. First, the development of a technical standard for in-home device communication (ZigBee) was
not established before millions of smart meters were installed. Competing companies jockeyed for
position, causing numerous delays in the development and adoption of a Home Area Network com-
munications standard. Second, regulators shied away from technical matters, leaving industry to self-
organize in a vacuum of leadership, increasing market uncertainty. Third, legal and privacy matters
were an afterthought to the infrastructure upgrade, giving utilities the excuse to indefinitely postpone
the sharing of smart meter data for the sake of customer privacy. As a result, the potential for mass
energy savings via energy feedback technologies in America has not been realized, providing valuable
lessons for other governments considering advanced meters.
Overview
The installation of smart meters in America was supposed to bring forth a cornucopia of energy man-
agement and feedback technologies. Electric utilities proudly announced to regulators and the public
that smart meters would “empower consumers” with detailed information about their usage patterns,
allow consumers to cut their bills with time-of-use (TOU) pricing, and provide the Home Area Net-
work (HAN) for real-time communication between the smart meter and home appliances. Public utili-
ty commissions (PUCs) require utilities to publish detailed cost-benefit analyses of any proposed in-
vestment, and “customer empowerment” benefits figured heavily into utilities’ proposals for advanced
metering infrastructure (AMI; e.g., California PUC, 2012, p. 5). In order to pass cost-benefit tests re-
quired by PUCs, utilities needed a strong showing of benefits from feedback. One industry report
found that energy savings resulting from feedback could account for 33% to 66% of the operational
benefit of smart meters (Faruqui et al., 2011, p. 27). Unsurprisingly, utilities described feedback
mechanisms in optimistic terms in their AMI proposals.
In retrospect, however, very few of these feedback benefits to consumers actually materialized. De-
spite over 60 million smart meters installed across the U.S., tangible benefits to consumers have re-
mained elusive. Three main reasons are responsible for the underwhelming performance of smart me-
ters as feedback enablers: the fact that legal and privacy matters were not settled until years after AMI
deployment; a battle of competing communications standards for the HAN led to costly delays in ex-
changing AMI data with new technologies; and utility regulators’ aversion to complex but critical
“Feedback in energy demand reduction: Examining evidence and exploring opportunities” Edinburgh, July 2016Page 279
technical matters prolonged inaction. All three problems proved to be major barriers to lowering ener-
gy use, and they could have been avoided. Furthermore, feedback technologies were forced to adapt to
a challenging environment, dramatically limiting their features. The author hopes this analysis of the
U.S.’s poor record of fostering feedback technologies will provide valuable lessons to other govern-
ments considering smart meters.
The first reason for the prolonged delay of feedback technologies in America has to do with privacy.
Meter data was supposed to be accessible to consumers in two ways: real-time data sent to devices via
the HAN and so-called “backhauled” data in 15-minute or 60-minute intervals sent back to the utility
and made available on a web portal. In order to package data for effective feedback (such as with so-
cial norms), either the utility must conduct an analysis, or else third party companies must have access
in order to develop smartphone apps, home automation systems or other offerings incorporating ener-
gy data. The process by which third parties access AMI data is not resolved and is the subject of ongo-
ing regulatory proceedings in numerous states (e.g., Murray and Hawley, 2016).
That third party access was not addressed before AMI approval meant that feedback offerings from
companies other than utilities languished for years, according to first-hand accounts from dozens of
U.S. companies. Many companies, having heard AMI’s promises of rich data, knocked repeatedly on
the door of utilities inquiring about electronic access only to be told that signed, wet-ink signatures
from customers were required before releasing energy data to third parties (e.g., PG&E, 2007), a pro-
cess that can take four weeks. Eventually a CD-ROM would be mailed to the authorized party. The
clumsiness of the process, uncertain timing of receipt by the third party and wide variations in possi-
ble formats (PDF, CSV, Excel) meant that most business models for non-HAN energy feedback tech-
nologies were quickly thrown into the dustbin.
Privacy became a primary barrier to innovation in energy feedback when utilities and consumer advo-
cates expressed legitimate concerns about AMI data getting in the hands of “bad actors.” The easiest
way to eliminate privacy risks is not to share data with anyone – the default position of utilities. En-
trepreneurs countered that, if a customer assents to have his or her data shared with someone, the utili-
ty should offer a streamlined process for doing so. Legal debates are ongoing, even in cases when the
customer has clearly provided consent (see, e.g., Murray and Hawley, 2016). A key obstacle cited by
utilities is their legal liability in case of a third party breach of privacy laws. Time-consuming litiga-
tion in this area would test the resolve of even the most committed entrepreneurs: In California, it took
six years after AMI approval for the PUC to affirm customer rights to access personal usage data
(CPUC, 2011, p. 164). It would be another two years before the CPUC required the utilities to offer an
electronic system for data-sharing known as Green Button Connect My Data (CPUC, 2013), and it
would be another three years after that when the system would be operational. Today, entrepreneurs
still complain that the customer consent process is anything but frictionless, hindering uptake (CPUC,
2016). Even Texas, despite being the only state to delare that customers have ownership rights over
data generated by the meter (see Texas Public Utility Regulatory Act §39.107(b)), is plagued by cus-
tomer-consent friction, resulting in extremely low rates of data-sharing (SPEER, 2015). All of these
challenges could have been avoided by addressing key legal questions and mandating a streamlined
consent process for consumers prior to AMI installation.
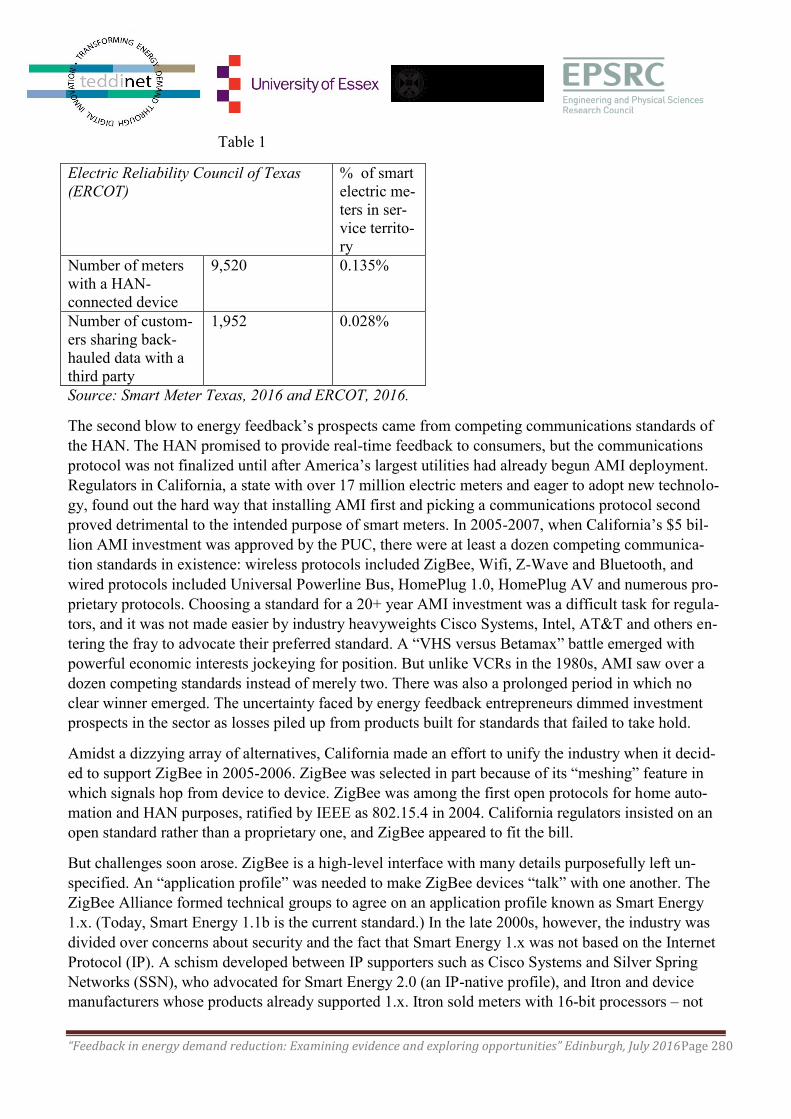
“Feedback in energy demand reduction: Examining evidence and exploring opportunities” Edinburgh, July 2016Page 280
Table 1
Electric Reliability Council of Texas
(ERCOT)
% of smart
electric me-
ters in ser-
vice territo-
ry
Number of meters
with a HAN-
connected device
9,520 0.135%
Number of custom-
ers sharing back-
hauled data with a
third party
1,952 0.028%
Source: Smart Meter Texas, 2016 and ERCOT, 2016.
The second blow to energy feedback’s prospects came from competing communications standards of
the HAN. The HAN promised to provide real-time feedback to consumers, but the communications
protocol was not finalized until after America’s largest utilities had already begun AMI deployment.
Regulators in California, a state with over 17 million electric meters and eager to adopt new technolo-
gy, found out the hard way that installing AMI first and picking a communications protocol second
proved detrimental to the intended purpose of smart meters. In 2005-2007, when California’s $5 bil-
lion AMI investment was approved by the PUC, there were at least a dozen competing communica-
tion standards in existence: wireless protocols included ZigBee, Wifi, Z-Wave and Bluetooth, and
wired protocols included Universal Powerline Bus, HomePlug 1.0, HomePlug AV and numerous pro-
prietary protocols. Choosing a standard for a 20+ year AMI investment was a difficult task for regula-
tors, and it was not made easier by industry heavyweights Cisco Systems, Intel, AT&T and others en-
tering the fray to advocate their preferred standard. A “VHS versus Betamax” battle emerged with
powerful economic interests jockeying for position. But unlike VCRs in the 1980s, AMI saw over a
dozen competing standards instead of merely two. There was also a prolonged period in which no
clear winner emerged. The uncertainty faced by energy feedback entrepreneurs dimmed investment
prospects in the sector as losses piled up from products built for standards that failed to take hold.
Amidst a dizzying array of alternatives, California made an effort to unify the industry when it decid-
ed to support ZigBee in 2005-2006. ZigBee was selected in part because of its “meshing” feature in
which signals hop from device to device. ZigBee was among the first open protocols for home auto-
mation and HAN purposes, ratified by IEEE as 802.15.4 in 2004. California regulators insisted on an
open standard rather than a proprietary one, and ZigBee appeared to fit the bill.
But challenges soon arose. ZigBee is a high-level interface with many details purposefully left un-
specified. An “application profile” was needed to make ZigBee devices “talk” with one another. The
ZigBee Alliance formed technical groups to agree on an application profile known as Smart Energy
1.x. (Today, Smart Energy 1.1b is the current standard.) In the late 2000s, however, the industry was
divided over concerns about security and the fact that Smart Energy 1.x was not based on the Internet
Protocol (IP). A schism developed between IP supporters such as Cisco Systems and Silver Spring
Networks (SSN), who advocated for Smart Energy 2.0 (an IP-native profile), and Itron and device
manufacturers whose products already supported 1.x. Itron sold meters with 16-bit processors – not
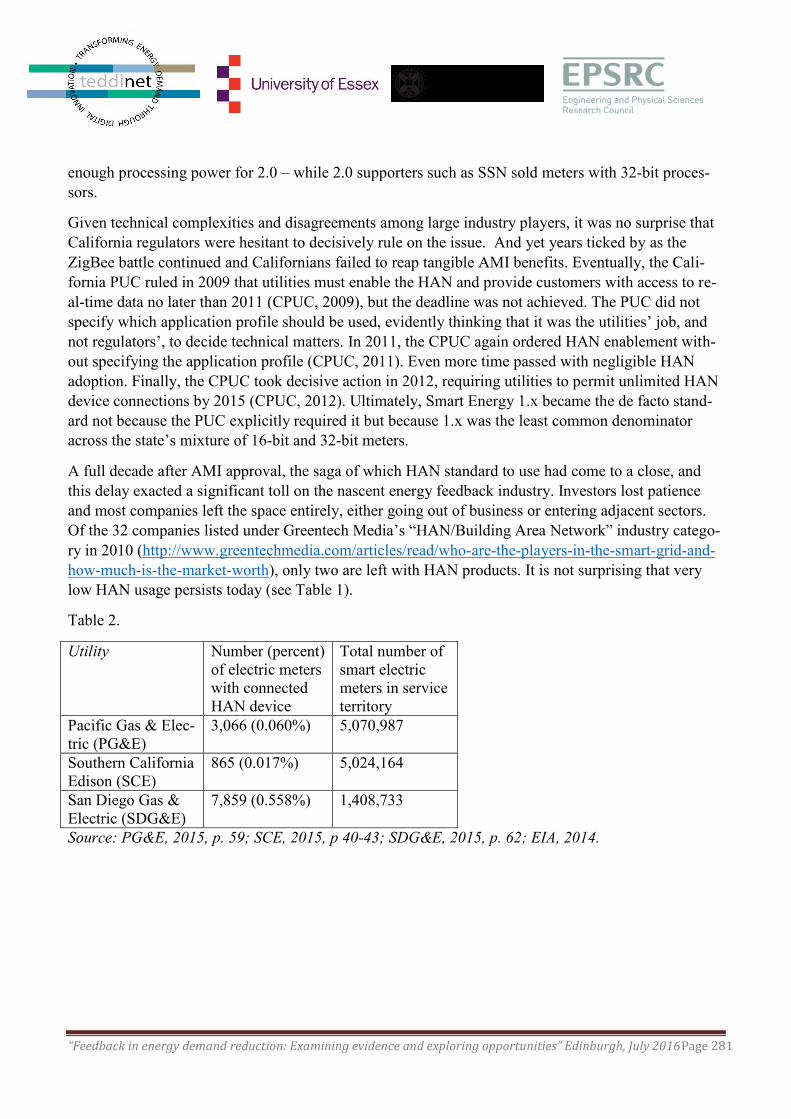
“Feedback in energy demand reduction: Examining evidence and exploring opportunities” Edinburgh, July 2016Page 281
enough processing power for 2.0 – while 2.0 supporters such as SSN sold meters with 32-bit proces-
sors.
Given technical complexities and disagreements among large industry players, it was no surprise that
California regulators were hesitant to decisively rule on the issue. And yet years ticked by as the
ZigBee battle continued and Californians failed to reap tangible AMI benefits. Eventually, the Cali-
fornia PUC ruled in 2009 that utilities must enable the HAN and provide customers with access to re-
al-time data no later than 2011 (CPUC, 2009), but the deadline was not achieved. The PUC did not
specify which application profile should be used, evidently thinking that it was the utilities’ job, and
not regulators’, to decide technical matters. In 2011, the CPUC again ordered HAN enablement with-
out specifying the application profile (CPUC, 2011). Even more time passed with negligible HAN
adoption. Finally, the CPUC took decisive action in 2012, requiring utilities to permit unlimited HAN
device connections by 2015 (CPUC, 2012). Ultimately, Smart Energy 1.x became the de facto stand-
ard not because the PUC explicitly required it but because 1.x was the least common denominator
across the state’s mixture of 16-bit and 32-bit meters.
A full decade after AMI approval, the saga of which HAN standard to use had come to a close, and
this delay exacted a significant toll on the nascent energy feedback industry. Investors lost patience
and most companies left the space entirely, either going out of business or entering adjacent sectors.
Of the 32 companies listed under Greentech Media’s “HAN/Building Area Network” industry catego-
ry in 2010 (http://www.greentechmedia.com/articles/read/who-are-the-players-in-the-smart-grid-and-
how-much-is-the-market-worth), only two are left with HAN products. It is not surprising that very
low HAN usage persists today (see Table 1).
Table 2.
Utility Number (percent)
of electric meters
with connected
HAN device
Total number of
smart electric
meters in service
territory
Pacific Gas & Elec-
tric (PG&E)
3,066 (0.060%) 5,070,987
Southern California
Edison (SCE)
865 (0.017%) 5,024,164
San Diego Gas &
Electric (SDG&E)
7,859 (0.558%) 1,408,733
Source: PG&E, 2015, p. 59; SCE, 2015, p 40-43; SDG&E, 2015, p. 62; EIA, 2014.
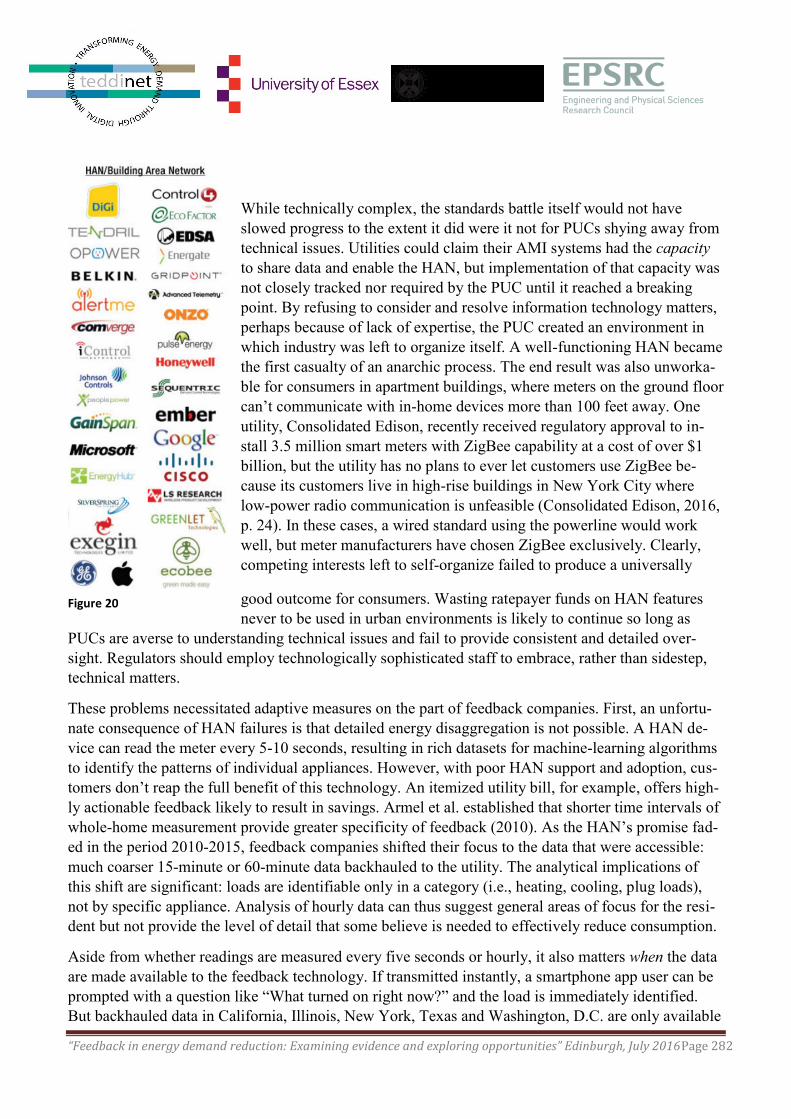
“Feedback in energy demand reduction: Examining evidence and exploring opportunities” Edinburgh, July 2016Page 282
While technically complex, the standards battle itself would not have
slowed progress to the extent it did were it not for PUCs shying away from
technical issues. Utilities could claim their AMI systems had the capacity
to share data and enable the HAN, but implementation of that capacity was
not closely tracked nor required by the PUC until it reached a breaking
point. By refusing to consider and resolve information technology matters,
perhaps because of lack of expertise, the PUC created an environment in
which industry was left to organize itself. A well-functioning HAN became
the first casualty of an anarchic process. The end result was also unworka-
ble for consumers in apartment buildings, where meters on the ground floor
can’t communicate with in-home devices more than 100 feet away. One
utility, Consolidated Edison, recently received regulatory approval to in-
stall 3.5 million smart meters with ZigBee capability at a cost of over $1
billion, but the utility has no plans to ever let customers use ZigBee be-
cause its customers live in high-rise buildings in New York City where
low-power radio communication is unfeasible (Consolidated Edison, 2016,
p. 24). In these cases, a wired standard using the powerline would work
well, but meter manufacturers have chosen ZigBee exclusively. Clearly,
competing interests left to self-organize failed to produce a universally
good outcome for consumers. Wasting ratepayer funds on HAN features
never to be used in urban environments is likely to continue so long as
PUCs are averse to understanding technical issues and fail to provide consistent and detailed over-
sight. Regulators should employ technologically sophisticated staff to embrace, rather than sidestep,
technical matters.
These problems necessitated adaptive measures on the part of feedback companies. First, an unfortu-
nate consequence of HAN failures is that detailed energy disaggregation is not possible. A HAN de-
vice can read the meter every 5-10 seconds, resulting in rich datasets for machine-learning algorithms
to identify the patterns of individual appliances. However, with poor HAN support and adoption, cus-
tomers don’t reap the full benefit of this technology. An itemized utility bill, for example, offers high-
ly actionable feedback likely to result in savings. Armel et al. established that shorter time intervals of
whole-home measurement provide greater specificity of feedback (2010). As the HAN’s promise fad-
ed in the period 2010-2015, feedback companies shifted their focus to the data that were accessible:
much coarser 15-minute or 60-minute data backhauled to the utility. The analytical implications of
this shift are significant: loads are identifiable only in a category (i.e., heating, cooling, plug loads),
not by specific appliance. Analysis of hourly data can thus suggest general areas of focus for the resi-
dent but not provide the level of detail that some believe is needed to effectively reduce consumption.
Aside from whether readings are measured every five seconds or hourly, it also matters when the data
are made available to the feedback technology. If transmitted instantly, a smartphone app user can be
prompted with a question like “What turned on right now?” and the load is immediately identified.
But backhauled data in California, Illinois, New York, Texas and Washington, D.C. are only available
Figure 20
“Feedback in energy demand reduction: Examining evidence and exploring opportunities” Edinburgh, July 2016Page 283
24-48 hours in arrears. As a result, feedback companies must plan for interaction models in which the
user is not assumed to have real-time access.
Feedback companies were also forced to adapt to the friction a customer faces when granting third
party access. When companies can’t cost-effectively access meter data via customer authorization,
they seek to avoid needing permission in the first place by becoming a contractor to the utility. Scale
is achieved with opt-out feedback via the utility. But in exchange for access to a large customer base,
the entrepreneur must serve the needs of the utility. Some utilities can increase earnings and please
regulators by achieving energy savings as calculated by complex evaluation, measurement and verifi-
cation protocols; significant revenues await companies that successfully deliver energy savings in the
manner utilities require. Complying with these rigid rules, rather focusing on engagement or custom-
er delight, narrows the breadth and creativity of services across the marketplace. Opower is a leading
example of a company that succeeded by serving utilities rather than consumers, essentially becoming
an IT contractor to utilities. Many companies in the period 2010-2015 began selling energy manage-
ment services to consumers or businesses only to run out of money and turn to the utility as a reliable
source of income. Of the 32 companies shown in Figure 1, 10 made such a transition.
Building energy use accounts for 40% of U.S. greenhouse gas emissions. The policy obstacles dis-
cussed must be addressed for a rich array of feedback technologies to reach consumers. Privacy con-
cerns over sharing AMI data, even with customer consent, continue to stifle the market. Allowing a
streamlined consent process and immediate data transmission is critical. Regulators must also take a
strong role in establishing standards and must not leave technical matters to the discretion of utilities.
In conclusion, other jurisdictions can learn from these mistakes to realize the benefits of AMI and en-
courage, rather than restrict, development of energy feedback technologies.
References
Armel, C., Gupta, A., Shrimali, G., Albert, A. (2013). Is disaggregation the holy grail of energy effi-
ciency? The case of electricity. Energy Policy, 52, 213-234. doi:10.1016/j.enpol.2012.08.062
Energy Information Administration. (2014). Advanced meters. Form EIA-861. Retrieved from
https://www.eia.gov/electricity/data/eia861/
California PUC. (Dec 7, 2009). Decision D.09-12-046. Retrieved from
http://docs.cpuc.ca.gov/PublishedDocs/WORD_PDF/FINAL_DECISION/111856.PDF
California PUC. (Jul 29, 2011). Decision D.11-07-056. Retrieved from
http://docs.cpuc.ca.gov/WORD_PDF/FINAL_DECISION/140369.pdf
California PUC. (Sep 27, 2012). Resolution E-4527. Retrieved from
http://docs.cpuc.ca.gov/PublishedDocs/Published/G000/M028/K949/28949960.PDF
California PUC. (Sep 19, 2013). Decision D.13-09-025. Retrieved from
http://docs.cpuc.ca.gov/PublishedDocs/Published/G000/M077/K191/77191980.PDF
California PUC. (Jun 9, 2016). Decision D.16-06-008. Retrieved from
http://docs.cpuc.ca.gov/PublishedDocs/Published/G000/M163/K294/163294060.PDF
“Feedback in energy demand reduction: Examining evidence and exploring opportunities” Edinburgh, July 2016Page 284
Consolidated Edison. (Jun 17, 2016). Advanced metering infrastructure panel rebuttal testimony. Case
nos. 16-E-0060, 16-G-0061 at New York Public Service Commission. Retrieved from
http://documents.dps.ny.gov/public/Common/ViewDoc.aspx?DocRefId=%7BE65A676C-D68D-
49D8-984E-0DD04310090D%7D
ERCOT Advanced Metering Working Group. (Jun 13, 2016). Monthly market report. Retrieved from
http://www.ercot.com/content/wcm/key_documents_lists/98308/AMWG_Monthly_Market_Reports_
and_Formats_06_13_16_v2.pptx
Faruqui, A., Mitarotonda, D., Wood, L., Cooper, A. and Schwartz, J. (2011). The costs and benefits of
smart meters for residential customers. Edison Foundation Institute for Electric Efficiency. Retrieved
from
https://www.smartgrid.gov/files/The_Costs_Benefits_Smart_Meters_for_Residential_Customers_201
107.pdf
Murray, M. and Hawley, J. (2016). Got Data? The value of energy data access to consumers. Mis-
sion:data Coalition. Retrieved from http://www.missiondata.org/s/Got-Data-value-of-energy-data-
access-to-consumers.pdf
Pacific Gas & Electric. (2007). Customer information service request. Retrieved from
https://www.pge.com/includes/docs/pdfs/mybusiness/energysavingsrebates/demandresponse/howtoap
ply/E79-1095%20-Third%20Party%20Authorization.pdf
Pacific Gas & Electric. (2015). Smart grid annual report. Retrieved from
https://www.pge.com/includes/docs/pdfs/myhome/edusafety/systemworks/electric/smartgridbenefits/
AnnualReport2015.pdf
San Diego Gas & Electric. (2015). Smart grid annual report. Retrieved from
https://www.sdge.com/sites/default/files/documents/1289993310/Smart%20Grid%20Deployment%20
Plan%202015%20Annual%20Report.pdf?nid=15796
Smart Meter Texas. (Jun 1, 2016). Third party statistics report. Retrieved from
http://www.ercot.com/content/wcm/key_documents_lists/98308/SMT_Third_Party_Statistics_Report
_Reporting_Period_June_1_2016_FINAL.docx
South-central Partnership for Energy Efficiency as a Resource. (2015). “Smart Energy Roadmap for
Texas.” Retrieved from https://eepartnership.org/program-areas/policy/intelligent-energy-
management/
Southern California Edison. (2015). Smart grid annual report. Retrieved from
http://www3.sce.com/sscc/law/dis/dbattach5e.nsf/0/FEE9E43E80B3D0F988257ED100752C9B/$FIL
E/R.08-12-
009%20Smart%20Grid%20OIR_Smart%20Grid%20Deployment%20Plan%20Update_2015.pdf

“Feedback in energy demand reduction: Examining evidence and exploring opportunities” Edinburgh, July 2016Page 285
NOTES

“Feedback in energy demand reduction: Examining evidence and exploring opportunities” Edinburgh, July 2016Page 286
Recommended