APEx 2005 Annual ConferenceDisney’s BoardWalk Inn, Florida
CO 2
Torger LienPresident & CEO, Nord Pool ASA

Kyoto protokollETS and EUA quota system

EUs Kyoto obligation
ETS sectorer
Other
Emissions 1990Emissions 1990
Kyoto gapKyoto gap
Emissions 2008-2012Emissions 2008-2012
Carbon credits
CERs (CDM) ERUs (JI)
Diff. reductions
ETS reductionsETS Reductions

Ways to close the Kyoto gap
Non-ETS measures (domestic)Own abatement
ETS
Residual:
Government purchases
Domestic policies & measures:• Taxes• Financial support• “command-and-control”• Negotiated agreements • Own abatement
Imports:• EU allowances (EUAs)• Credits from developing countries (CERs)• Credits from Russia/Ukraine ((ERUs)•“ Kyoto units” – Assigned amount units
Governments decide how to share the burden. Ultimately Kyoto commitment rests with governments

Allocation to individual installations
Kyoto AAUs (assigned amount units) Trinn 1
MetallKraft
VarmeMineraler Treforedling Trinn 3
Instal. 1 Instal. 2 Instal. 3 Instal. 4 Trinn 4
Husholdninger, Tjenesteyting,Mindre industri
ETS Transport Trinn 2

“Gap” ETS sector 2005-2007
EU 15
60
50
40
20
30
10
EU 1O (New)
CDM
BaU EU 25
Reductions ETS sector
Weather
Economical growth
Energy prices
Mil ton CO2

“Gap” ETS sector 2008-2012
EU 25
250
200
150
50
100
Reductions ETS sector
Demand
Import of credits
Import of credits:CDM/JI or
ETS-sector reductions
Competition over CDM/JI credits: Public fund, buyers outside Europe
Supply

Marginalcost powergeneration -Continental Europe
Coalprice
$64/ton
Carbon price
€16/ton
Gas price
$5.75/mmbtu
Carbon price€16/ton
Coal Gas

Coalprice, gasprice & carbonprice
30
25
20
10
15
5
Carbon price (€/tonn)
Gasprice/Coalprice
UK
May 2005E Continent
May 2004
E Continent
May 2005

Fuelcost, gas & coal
Development in fuel costs for coal and gas
20
22
24
26
28
30
32
34
2005
-02-
09
2005
-02-
16
2005
-02-
23
2005
-03-
02
2005
-03-
09
2005
-03-
16
2005
-03-
23
2005
-03-
30
2005
-04-
06
2005
-04-
13
2005
-04-
20
2005
-04-
27
2005
-05-
04
2005
-05-
11
2005
-05-
18
2005
-05-
25
€/M
Wh
Fuel cost gas efficiency 49%Fuel cost coal efficiency 47%

Trading EU Allowances at Nord Pool
To start in 2005 Forward contracts – physical delivered
• Ticker code: EUA (1 EUA = 1 tCO2)
• Min. lot: 1000 EUA• Starting with three contracts:
• EUADEC-05 (last trading day 1st Thursday in December 2005)• EUADEC-06 (last trading day 1st Thursday in December 2006)• EUADEC-07 (last trading day 1st Thursday in December 2007)
• Closing price set every day
Use existing infrastructure; PowerCLICK ETS, Clearing Desk Application, SECUR clearing system etc
Link to national registries for transition of EUA
EUA spot contract

EUA Prices
678910111213141516171819202122232425262728293031
31.01.05 28.02.0 31.03.05 30.04.0 31.05.05 30.06.0 31.07.05 31.08.05 30.09.0
EU
R/ t
CO
2
EUADEC-05Prices: CFI -DEC05
EUA Volumes Nord Pool and ECX
0
1000
2000
3000
4000
5000
6000
7000
6 7 8 9 10 11 12 13 14 15 16 17 18 19 20 21 22 23 24 25 26 27 28 29 30 31 32 33 34 35 36 37 38 39 40 4142 43 44 45 46 47 48 49 50 51 52 53
NP TOTAL
ECX TOTAL
NP Exch
ECX Exch
Accumulated :NordPool: 17.438 mln tCO2 ECX : 42.298 mln tCO2

Volumes comparedOpen interst
NP: 10249
ECX: 13174Volum Nord Pool vs ECX & EEX
0
100
200
300
400
500
600
700
800
900
1000
1100
1200
2.11.05 2.25.05 3.11.05 3.25.05 4.8.05 4.22.05 5.6.05 5.20.05 6.3.05 6.17.05 7.1.05 7.15.05 7.29.05 8.12.05 8.26.05 9.9.05 9.23.05 10.7.05
10
00
tC
O2
05001.0001.5002.0002.5003.0003.5004.0004.5005.0005.5006.0006.5007.0007.5008.0008.5009.0009.50010.00010.50011.00011.50012.00012.50013.00013.50014.00014.50015.00015.50016.00016.50017.00017.50018.00018.50019.00019.50020.00020.50021.00021.50022.00022.50023.00023.50024.00024.500
ECX ex EFPNP ex otcEEXNP ex otcEEXECX ex EFP
Source: NP, EEX, IPE

0%
100%Elastic consumption
Load variation and price structure
Fuel exchange
Hydropower
Bottlenecks
No thermal power
Carbon dioxide price impact on
electricity prices

Production cost avg. coal fired power generation
0
5
10
15
20
25
30
35
44 46 48 50 52 1 3 5 7 9 11 13 15 17 19 21 23
Uke
øre
/kW
h
Karbonkostnad
Brenselskostnad
OPEX
Marginal carboncost: 13,7 øre/kWh

CO2 cost impact – the European model
Today’s fuel pricesThe cost effect in Germany is higher than in the Nordic regionToday’s carbon dixoide price yield about 45% effect in the Nordic region
Definition:Price rise/cost escalation for coal
0 %
20 %
40 %
60 %
80 %
100 %
10 20 30 40 50 60
EUR/tonne
Nordel
Germany
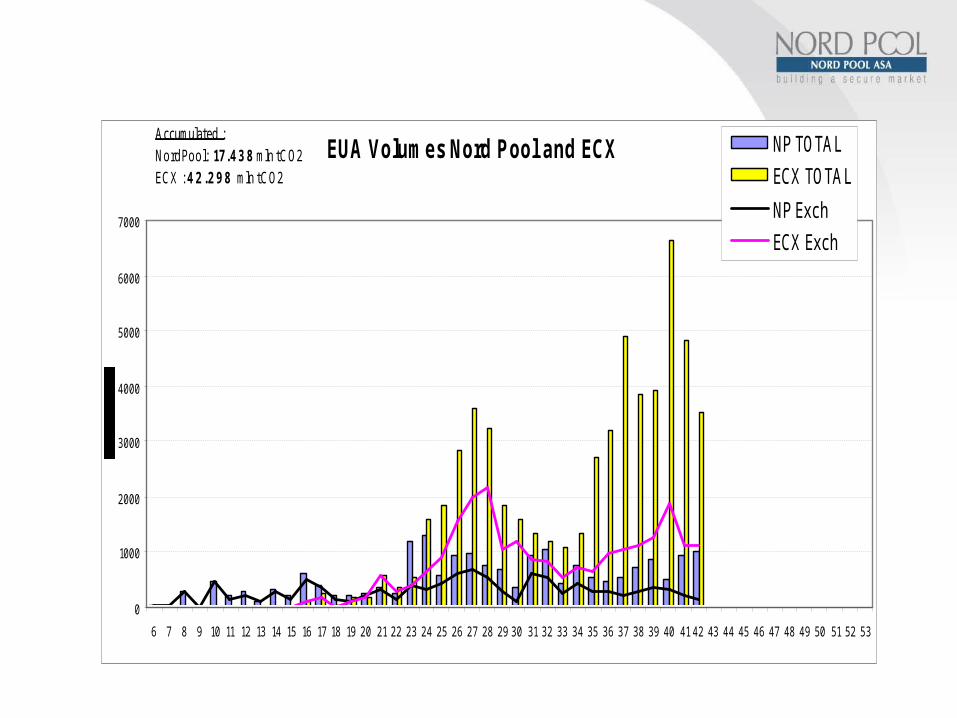
Actual forward and carbon dioxide prices, 2007
Strong correlation beetween forward and carbon dioxide prices• Even stronger correlation between Nord Pool and EEX power prices
0
5
10
15
20
25
30
35
February 05 March 05 April 05 May 05 June 05 July 05 August 05
EU
R/t
on
ne
25
27
29
31
33
35
37
39
41
43
45
EU
R/M
Wh
Carbon 2007 Germany 2007 Nordel

EUA/ETS sustainability
Higher power prices to household consumersGlobally competitive base industry will sufferEUA price formation fundamental or speculativeWill the consept reduce CO2 emissions globally2005-2007 is the test period. What will be the conditions for 2008-2012 period, and what will happen after 2012For how long will European poleticians be the frontiers on the account of european base industry flagging out…or will the rest of the world follow their brave initiative?

www.nordpool.com
For more information:
Recommended