APPENDIX A
WASTEWATER GENERATION FACTORS TECHNICAL MEMORANDUM

CITY OF MANTECA
WASTEWATER COLLECTION SYSTEM
2010 MASTER PLAN UPDATE
WASTEWATER GENERATION FACTORS
TECHNICAL MEMORANDUM
DRAFT
November 2010

CITY OF MANTECA
WASTEWATER COLLECTION SYSTEM
2010 MASTER PLAN UPDATE
WASTEWATER GENERATION FACTORS
TECHNICAL MEMORANDUM DRAFT
November 2010
Submitted to:
City of Manteca
Department of Public Works
1001 West Center Street
Manteca, CA 95337
Prepared by:
Nolte Associates, Inc.
1215 West Center Street, Suite 201
Manteca, CA 95337
(209) 239-9080 ▪ (209) 239-4166 (Fax)

Wastewater Generation Factors TM 1 MTB015906
November 2010 (Draft) n:\mtb015906\documents\ww generation factors tm\draft rev 1110.doc
CITY OF MANTECA
WASTEWATER COLLECTION SYSTEM
2010 MASTER PLAN UPDATE
WASTEWATER GENERATION FACTORS
TECHNICAL MEMORANDUM
DRAFT
November 2010
A 2010 update (2010 Master Plan) to the 2006 City of Manteca (City) Wastewater Collection
System Master Plan Update (2006 Master Plan Update) [1] is under preparation. Consistent with
previous documents, the 2010 Master Plan will propose the construction of three large diameter
trunk sewers and a series of lift stations/pump stations to collect wastewater from the north,
central, and south sections of the City for conveyance to an influent pump station located at the
Wastewater Quality Control Facility (WQCF).
The 2010 Master Plan will include modified wastewater generation factors for residential,
commercial, and industrial land uses based on upcoming water conservation legislation for
residential development and historical water use data from local businesses. The local business
parks evaluated in this technical memorandum include Big League Dreams (BLD) commercial
properties and Spreckels Park located in Manteca.
Previous Generation Factors
Current wastewater generation factors (WGFs) for residential and industrial land uses as
presented in the 2006 Master Plan Update are provided in Table 1. The current WGFs for
residential land use range from 530 gallons per day per acre (gpd/acre) for very low density
residential to 3,789 gpd/acre for high density residential. These residential WGFs equate to an
individual water use rate of approximately 70 gallons per capita per day (gpcd) and were based
on an analysis of flows at the WQCF in 2002-2003. The current WGF for both heavy and light
industrial land uses is 2,010 gpd/acre.

Wastewater Generation Factors TM 2 MTB015906
November 2010 (Draft) n:\mtb015906\documents\ww generation factors tm\draft rev 1110.doc
TABLE 1
CITY OF MANTECA
WASTEWATER COLLECTION SYSTEM MASTER PLAN UPDATE
PREVIOUS WASTEWATER GENERATION FACTORS
Land Use Designation
Population
Densitya,
persons/edub
Densityc,
edu/acre
Wastewater Generation Factor
gpcd gpd/edua gpd/acre
d
Very low density residential VLDR 3.68 Less than 2 72.0 265 530e
Low density residential LDR 3.68 2.1-8 72.0 265 1,338f
Medium density residential MDR
2.68 8.1-15 70.5 189 2,183g
High density residential HDR 2.68 15.1-25 70.5 189 3,789h
General commercial GC -- -- -- -- 1,120
Heavy industrial HI
-- -- -- -- 2,010
Light industrial LI
-- -- -- -- 2,010
a Based on February 2004 Wastewater Generation Factor TM [2] b edu = equivalent dwelling unit
c Based on the adopted 2003 General Plan [3] d Nonresidential generation factors based on the 1993 Master Plan [4]
e Generation factor based on 265 gpd/edu [2] and density of 2.00 dwelling units per acre f Generation factor based on 265 gpd/edu [2] and density of 5.05 dwelling units per acre g Generation factor based on 189 gpd/edu [2] and density of 11.55 dwelling units per acre h Generation factor based on 189 gpd/edu [2] and density of 20.05 dwelling units per acre
Methodology for Updated Generation Factors
The methodology to determine adjustments in WGFs for residential, commercial, and industrial
land uses is provided below.
Residential
California recently approved the 2010 California Green Building Standards Code (CALGreen
2010) which requires new buildings in California to become more efficient by mandating new
construction to meet minimum standards. CALGreen 2010 requires compliance effective
January 1, 2011, as Part 11 of California Code of Regulations (CCR) Title 24.
When addressing residential water use, CALGreen 2010 requires a 20 percent reduction in
indoor water use from the 2008 Title 24 baseline, through either prescriptive or performance
methods. The prescriptive method requires installation of ultra low fixtures for showerheads,
bathroom and kitchen faucets, and toilets. The performance method requires a demonstrated
20 percent reduction in baseline water use, with options for compliance left to the builder.
Historical flow rates of water fixtures and clothes washers over time are presented in Table 2.

Wastewater Generation Factors TM 3 MTB015906
November 2010 (Draft) n:\mtb015906\documents\ww generation factors tm\draft rev 1110.doc
TABLE 2
CITY OF MANTECA
WASTEWATER COLLECTION SYSTEM MASTER PLAN UPDATE
REQUIRED FLOW RATES OF FIXTURES AND APPLIANCES OVER TIME a
Year
Fixture/Appliance 1975 1980 1992 2008 2011d
Shower (gpmb) 3.5 2.5 2.5 2.5 2.0
Toilets (gpfc) 5.0 3.6 1.6 1.6 1.28
Faucets (gpm) 2.5 2.5 2.5 2.2 1.8
Clothes washers (gal/cu. ft.) 15.0 15.0 15.0 8.5 6.0e
a Water Use in the California Residential Home, January 2010 [5] b gpm = gallons per minute c gpf = gallons per foot d CALGreen 2010 fixture rates for prescriptive method of compliance, effective January 2011 e Regulated by CCR Title 20, Div 2, Ch 4, Article 4, Section 1605.3
Other legislation and water conservation programs include the 20x2020 Water Conservation
Plan, LEED, Senate Bill (SB) 407, and EPA WaterSense®
Program, each of which have similar
goals in water use reduction and efficiency to CALGreen.
The 20x2020 Water Conservation Plan (SB7 legislation) requires a statewide 20 percent per
capita reduction in urban water demands by 2020 while LEED has a prerequisite to reduce
indoor water usage 20 percent beyond 1992 standards. SB407 mandates retrofit of non-compliant
plumbing fixtures in pre-1994 homes. Beginning in January 2014, all building alterations or
improvements to single-family, multi-family, and commercial properties will require
non-compliant fixtures to be replaced for final permit approval by local building departments.
Starting in January 2017, a seller or transferor of a property must disclose to the purchaser the
requirement for replacing plumbing fixtures. Furthermore, beginning in January 2019, all
non-compliant plumbing fixtures in multi-family and commercial properties must be replaced.
The EPA WaterSense®
program also requires a 20 percent reduction in water use. New homes
may be labeled as EPA WaterSense®
if specific criteria are met and the home is built by a
WaterSense®
building partner.
With the new CALGreen legislation and other water conservation programs, indoor water use
(and wastewater flows) is expected to decrease significantly for new residential development.
Reduced indoor water use estimated from new water conservation legislation and programs is
provided in Table 3.
Wastewater Generation Factors TM 4 MTB015906
November 2010 (Draft) n:\mtb015906\documents\ww generation factors tm\draft rev 1110.doc
TABLE 3
CITY OF MANTECA
WASTEWATER COLLECTION SYSTEM MASTER PLAN UPDATE
WATER USE CONSIDERING NEW WATER CONSERVATION LEGISLATION AND PROGRAMS
Legislation/Program
Expected Indoor
Water Use, gpcd
CALGreen 2010 40.0a
EPA WaterSense® Program 39.5
b
American Water Works Association 43.5c
a Water Use in the California Residential Home, January 2010 [5] b Water-Efficient Single Family New Home Specification Supporting Statement,
May 2008 [6] c Water Conservation Measurement Metrics Guidance Report, January 2010 [7]
Adjusted residential WGFs based on the high-end of the range for projected water use are
presented in Table 4. The updated WGF for residential land uses ranges from 320 gpd/acre for
very low density residential to 2,337 gpd/acre for high density residential.
TABLE 4
CITY OF MANTECA
WASTEWATER COLLECTION SYSTEM MASTER PLAN UPDATE
PROPOSED FUTURE RESIDENTIAL WASTEWATER GENERATION FACTORS
Land Use Designation
Population
Densitya,
persons/edu
Densityb,
edu/acre
Wastewater Generation Factor
gpcdc gpd/edu gpd/acre
Very low density residential VLDR 3.68 2.00 43.5 160 320
Low density residential LDR 3.68 5.05 43.5 160 808
Medium density residential MDR
2.68 11.55 43.5 117 1,346
High density residential HDR 2.68 20.05 43.5 117 2,337
a Based on February 2004 Wastewater Generation Factor TM [2] b See Table 1 c Water Conservation Measurement Metrics Guidance Report, January 2010 [7]
These adjusted residential WGFs will be used for proposed residential areas. The previous
residential WGFs from the 2006 Master Plan Update will continue to be used for existing
residential areas. Although water use will begin to decrease for existing homes with the SB407
legislation beginning in 2014, the timing and magnitude of long-term reductions are unknown.
Commercial
WGFs for general commercial land uses presented in the 2006 Master Plan Update (Table 1)
were based on the 1993 Sewer System Master Plan (1993 Master Plan). These factors were
updated after reviewing historical water usage data from existing commercial developments at
Spreckels Park and BLD.
Wastewater Generation Factors TM 5 MTB015906
November 2010 (Draft) n:\mtb015906\documents\ww generation factors tm\draft rev 1110.doc
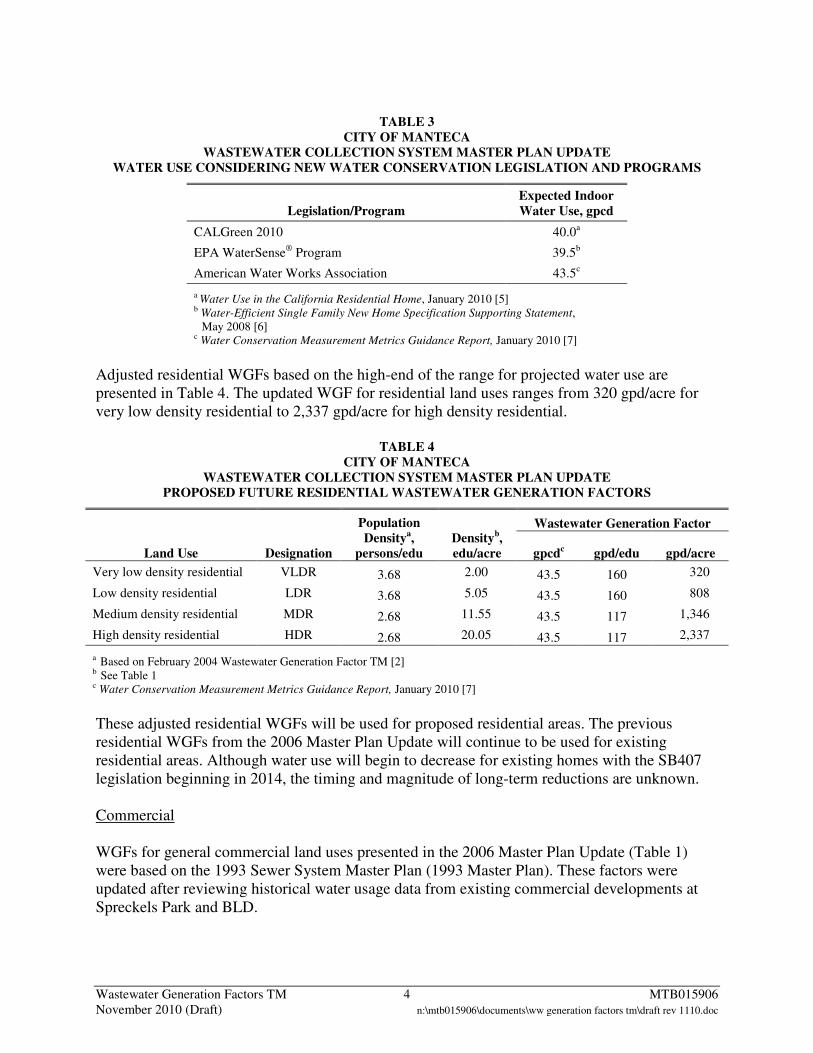
The BLD commercial properties are located northwest and adjacent to the intersection of State
Route (SR) 120 and Airport Way. Water usage was available for approximately 43.3 acres of
commercial businesses in BLD. Spreckels Park is comprised of approximately 313 acres of
commercial and industrial businesses located adjacent to and northwest of the SR 99 and SR 120
interchange. Water usage data were available for approximately 48.3 acres of industrial
businesses in Spreckels Park. Average wintertime (December to March) water usage for BLD
and Spreckels Park commercial properties over recent years is presented in Table 5. A detailed
analysis is available in Appendix A. Water usage data for the months of April to November were
excluded in the analysis to avoid including landscape irrigation in the WGF. Water usage data
varies greatly depending on the type of business. Retail and department stores tend to have low
water usage of 50 to 220 gpd/acre. Restaurants, grocery stores, and gas stations have
significantly greater water usage of 810 to 9,810 gpd/acre. The average WGF for commercial
land use in BLD and Spreckels Park combined is 750 gpd/acre. This WGF includes building and
parking areas and is representative of a gross WGF for general commercial land use.
TABLE 5
CITY OF MANTECA
WASTEWATER COLLECTION SYSTEM MASTER PLAN UPDATE
BIG LEAGUE DREAMS AND SPRECKELS PARK COMMERCIAL PROPERTIES
WATER USE AND WASTEWATER GENERATION FACTOR
Item Value
Range of average wastewater generation factor, gpd/acrea 50 – 9,810
Average wastewater generation factor, gpd/acrea 750
a Average water use from December to March
The average WGF value for the two commercial developments validates reduction of the general
commercial WGF. Consistent with the historical BLD and Spreckels Park water use data, a
general commercial WGF of 750 gpd/acre is recommended.
Industrial
WGFs for heavy and light industrial land uses presented in the 2006 Master Plan Update
(Table 1) were based on the City 1993 Master Plan. These factors were updated after reviewing
historical water usage data from existing industrial developments.
Water usage data were available for approximately 193 acres of industrial businesses in
Spreckels Park. Average wintertime (December to March) water usage for Spreckels Park over
recent years for industrial businesses is presented in Table 6. A detailed analysis of the water
usage data is available in Appendix B. Water usage data for the months of April to November
were excluded in the analysis to avoid including landscape irrigation in the WGF. The average
WGF for industrial land use in Spreckels Park is 193 gpd/acre. The 90th
percentile WGF is 600
gpd/acre.

Wastewater Generation Factors TM 6 MTB015906
November 2010 (Draft) n:\mtb015906\documents\ww generation factors tm\draft rev 1110.doc
TABLE 6
CITY OF MANTECA
WASTEWATER COLLECTION SYSTEM MASTER PLAN UPDATE
SPRECKELS PARK INDUSTRIAL WATER USE AND WASTEWATER GENERATION FACTOR
Item Value
Total average water use, gal/montha 1,054,000
Total average water use, gpd 34,700
Spreckels service area, acres 180
Average wastewater generation factor, gpd/acre 193
90th
Percentile wastewater generation factor, gpd/acre 600
a Average water use from December to March
The estimated 90th
percentile WGF value for the industrial developments in Spreckels Park
validates reduction of the light and heavy industrial WGFs. Consistent with the historical
Spreckels Park water use data, light and heavy industrial WGFs of 600 gpd/acre are
recommended.
Summary of Recommended Wastewater Generation Factors
Updated WGFs for residential and industrial land types are recommended for use in the
2010 Master Plan. The recommended WGFs and a comparison with the previous 2006 Master
Plan Update WGFs are presented in Table 7.

Wastewater Generation Factors TM 7 MTB015906
November 2010 (Draft) n:\mtb015906\documents\ww generation factors tm\draft rev 1110.doc
TABLE 7
CITY OF MANTECA
WASTEWATER COLLECTION SYSTEM MASTER PLAN UPDATE
SUMMARY OF PROPOSED WASTEWATER GENERATION FACTORS
Wastewater Generation Factor, gpd/acre
Land Use
2006 Master Plan
Update
Proposed for 2010
Master Plan Update
Existing Development
Very low density residential 530
530
Low density residential 1,338
1,338
Medium density residential 2,183
2,183
High density residential 3,789
3,789
General commercial 1,120 750
Heavy industrial 2,010 600
Light industrial 2,010 600
New Development
Very low density residential 530
320
Low density residential 1,338
808
Medium density residential 2,183
1,346
High density residential 3,789
2,337
General commercial 1,120 750
Heavy industrial 2,010 600
Light industrial 2,010 600
REFERENCES
[1] City of Manteca Wastewater Collection System Master Plan Update, prepared by Nolte
Associates, December 2006.
[2] City of Manteca Wastewater Collection System Master Plan Wastewater Generation
Factor Technical Memorandum, prepared by Nolte Associates, February 2004.
[3] City of Manteca General Plan 2023 Policy Document, adopted October 6, 2003.
[4] Sewer Master Plan for City of Manteca Public Facilities Implementation Plan, prepared
by Nolte Associates, December 1993.
[5] Water Use in the California Residential Home, prepared by ConSol, January 2010.
[6] Water-Efficient Single Family New Home Specification Supporting Statement, United
States Environmental Protection Agency – Water Sense, May 2008. <http://www.epa.gov/WaterSense/docs/home_suppstat508.pdf>

Wastewater Generation Factors TM 8 MTB015906
November 2010 (Draft) n:\mtb015906\documents\ww generation factors tm\draft rev 1110.doc
[7] Water Conservation Measurement Metrics Guidance Report, American Water Works
Association – Water Conservation Division, January 2010. <http://www.awwa.org/files/Publications/Streamlines/2010/030210/AWWA%20Metrics%20Guidance%20
Report%20Jan-22-2010%20Final%20_3_.pdf>

APPENDIX A
Big League Dreams and Spreckels Park Commercial Properties
Water Use and Wastewater Generation Factors

Land Average Water Average Water WGF
APN Business Address Use Land Use Description Acreage Dec Jan Feb Mar Dec Jan Feb Mar Use (gal/month) Use (gpd) (gpd/acre)
-- Big League Dreams Properties 2120 - 2420 DANIELS ST GC GENERAL COMMERCIAL 43.30 90,833 98,645 87,638 88,460 679,427 737,865 655,533 661,678 684,000 22,488 520
22120036 Food 4 Less 131 SPRECKELS AV GC GENERAL COMMERCIAL 5.31 26,419 23,801 22,688 21,564 197,615 178,031 169,708 161,296 176,662 5,808 1,090
22120027 Target 280 SPRECKELS AV GC GENERAL COMMERCIAL 11.75 9,155 8,567 8,245 7,932 68,479 64,079 61,673 59,329 63,390 2,084 180
22120069 Bank of the West 150 COMMERCE AV GC GENERAL COMMERCIAL 0.63 283 227 230 200 2,119 1,695 1,720 1,496 1,758 58 90
22120051 Holiday Inn Express 179 COMMERCE AV GC GENERAL COMMERCIAL 1.78 17,738 16,956 15,989 18,127 132,683 126,829 119,595 135,591 128,674 4,230 2,380
22120030 Staples 249 COMMERCE AV GC GENERAL COMMERCIAL 2.54 709 437 698 376 5,302 3,266 5,219 2,809 4,149 136 50
22120031 The Home Depot 250 COMMERCE AV GC GENERAL COMMERCIAL 12.78 8,977 11,135 13,389 11,401 67,148 83,290 100,150 85,279 83,967 2,761 220
22120057 TJ Maxx 277 COMMERCE AV GC GENERAL COMMERCIAL 4.79 1,548 1,362 1,270 1,230 11,579 10,188 9,500 9,200 10,117 333 70
22120032 IHOP 1150 E YOSEMITE AV GC GENERAL COMMERCIAL 0.86 12,786 12,900 12,779 11,124 95,636 96,492 95,587 83,208 92,731 3,049 3,540
22120016 Chevron 1234 E YOSEMITE AV GC GENERAL COMMERCIAL 1.06 29,663 28,911 28,202 26,089 221,882 216,255 210,951 195,146 211,058 6,939 6,550
22120043 AppleBees 1272 E YOSEMITE AV GC GENERAL COMMERCIAL 1.30 23,419 23,676 25,612 21,982 175,173 177,093 191,579 164,427 177,068 5,821 4,480
22120041 Jack in the Box 1310 E YOSEMITE AV GC GENERAL COMMERCIAL 0.86 6,903 5,221 6,176 6,390 51,633 39,056 46,194 47,797 46,170 1,518 1,770
22120053 Gas Depot 1330 E YOSEMITE AV GC GENERAL COMMERCIAL 1.11 3,385 3,362 7,528 6,793 25,320 25,145 56,312 50,814 39,398 1,295 1,170
22120067 Mimosa Spa and Salon 1360 E YOSEMITE AV GC GENERAL COMMERCIAL 0.71 7,057 6,007 4,767 4,650 52,784 44,930 35,655 34,782 42,038 1,382 1,940
22120063 In-N-Out 1490 E YOSEMITE AV GC GENERAL COMMERCIAL 0.99 14,010 16,006 14,128 12,496 104,795 119,725 105,677 93,470 105,917 3,482 3,500
22120061 Panda Express 1467 HULSEY WY GC GENERAL COMMERCIAL 0.67 34,142 24,950 24,308 23,934 255,382 186,626 181,824 179,026 200,715 6,599 9,810
22120060 Carl's Jr 1489 HULSEY WY GC GENERAL COMMERCIAL 1.15 3,238 4,364 3,916 3,566 24,220 32,643 29,292 26,674 28,207 927 810
91.59 2,097,000 69,000a Average water usage ranging from 1999 to 2010 for Spreckels Park businesses and from 2005 to 2010 for Big League Dreams businesses.
Average Wastewater Generation Factor 750 gpd/acre
Range of Wastewater Generation Factors 50 - 9810 gpd/acre
Median Wastewater Generation Factor 1,470 gpd/acre
Percentiles
Wastewater Generation Factor, 80 Percentile 3,540 gpd/acre
Wastewater Generation Factor, 90 Percentile 5,515 gpd/acre
Wastewater Generation Factor, 95 Percentile 7,365 gpd/acre
Water Usea (cu ft/month) Water Use
a (gal/month)
TABLE A-1
CITY OF MANTECA WASTEWATER COLLECTION SYSTEM
2010 MASTER PLAN UPDATE
BIG LEAGUE DREAMS AND SPRECKELS PARK COMMERCIAL WATER USE AND WASTEWATER GENERATION FACTORS
11/4/2010 N:\MTB015906\Excel\Spreckels Park Water Supply Summary.xls

APPENDIX B
Spreckels Park Industrial Water Use
and Wastewater Generation Factors

Land Acreage Average Water Average Water WGF
APN Business Address Use Land Use Description (acres) Dec Jan Feb Mar Dec Jan Feb Mar Use (gal/month) Use (gpd) (gpd/acre)
22125020 Sexton Chevrolet 321 SPRECKELS AV LI LIGHT INDUSTRIAL 6.96 0 160 300 110 0 1,197 2,244 823 1,066 35 5
22125005 Terrell Transportation 600 SPRECKELS AV HI HEAVY INDUSTRIAL 27.84 23,995 26,741 17,555 16,277 179,483 200,023 131,311 121,752 158,142 5,199 187
22121017 Millard Refrigerated Services 730 SPRECKELS AV HI HEAVY INDUSTRIAL 17.45 34,517 36,257 41,827 35,895 258,185 271,200 312,863 268,495 277,686 9,129 523
22125011 American Modular Systems 787 SPRECKELS AV LI LIGHT INDUSTRIAL 30.00 2,575 2,538 3,546 3,504 19,261 18,981 26,526 26,208 22,744 748 25
22121014 Global HVAC Distributors 900 SPRECKELS AV HI HEAVY INDUSTRIAL 13.54 3,614 1,100 3,264 10,103 27,035 8,228 24,417 75,569 33,812 1,112 82
22121002 Frito Lay 1190 SPRECKELS AV HI HEAVY INDUSTRIAL 7.54 1,161 1,330 1,423 978 8,684 9,948 10,647 7,318 9,149 301 40
22121027 Dance and Cheer Stars 1240 DUPONT CT HI HEAVY INDUSTRIAL 0.91 293 265 318 260 2,188 1,982 2,375 1,945 2,122 70 77
22121024 Rose Glass and Aluminum 1252 DUPONT CT HI HEAVY INDUSTRIAL 0.54 1,915 2,305 745 35 14,324 17,241 5,573 262 9,350 307 570
22121023 Fun and Game Rentals 1258 DUPONT CT HI HEAVY INDUSTRIAL 0.59 208 210 233 245 1,552 1,571 1,739 1,833 1,674 55 93
22121022 Unknown 1262 DUPONT CT HI HEAVY INDUSTRIAL 0.58 3,050 1,040 815 775 22,814 7,779 6,096 5,797 10,622 349 601
22121033 JA Clark Construction 1270 DUPONT CT HI HEAVY INDUSTRIAL 0.41 50 75 50 82 374 561 374 613 481 16 39
22121032 Elite Roofing 1274 DUPONT CT HI HEAVY INDUSTRIAL 0.34 93 78 90 73 692 580 673 542 622 20 58
22121031 Newberry Whell & Tires 1278 DUPONT CT HI HEAVY INDUSTRIAL 0.39 1,590 1,410 20 0 11,893 10,547 150 0 5,647 186 481
22121030 EMT Electric 1282 DUPONT CT HI HEAVY INDUSTRIAL 0.47 730 247 270 287 5,460 1,845 2,020 2,144 2,867 94 198
- Cool Roofing Systems 1286 DUPONT CT HI HEAVY INDUSTRIAL 0.47 523 660 493 605 3,915 4,937 3,684 4,525 4,265 140 295
22121028 E-M Manufacturing 1290 DUPONT CT HI HEAVY INDUSTRIAL 0.58 360 395 363 353 2,693 2,955 2,712 2,637 2,749 90 155
- Creative Design Interiors 1300 DUPONT CT HI HEAVY INDUSTRIAL 5.00 8,778 9,353 13,463 15,733 65,656 69,957 100,700 117,679 88,498 2,910 582
22121019 Dreyer's Grand Ice Cream 1351 DUPONT CT HI HEAVY INDUSTRIAL 12.03 56,108 21,962 21,564 22,912 419,688 164,276 161,299 171,382 229,161 7,534 626
22125017 Platt Electric Supply 550 COMMERCE CT HI HEAVY INDUSTRIAL 1.08 235 223 168 543 1,758 1,664 1,253 4,058 2,183 72 67
22126001 Multiple Small Businesses 560 COMMERCE CT HI HEAVY INDUSTRIAL 3.92 11,762 13,068 12,118 9,280 87,980 97,749 90,643 69,414 86,446 2,842 725
22125031 Ford Motor Co. Sacramento Parts Depot 1260 PHOENIX DR HI HEAVY INDUSTRIAL 31.59 3,590 3,096 3,056 3,080 26,853 23,160 22,861 23,038 23,978 788 25
22121005 L S Expediters , Revchem Plastics Inc 1205 MOFFAT BL HI HEAVY INDUSTRIAL 14.24 6,890 3,761 3,278 9,270 51,537 28,134 24,516 69,340 43,382 1,426 100
- Dr's Offices 1140 NORMAN DR LI LIGHT INDUSTRIAL 3.22 4,600 5,073 5,350 4,483 34,408 37,949 40,018 33,535 36,477 1,199 373
180 1,054,000 34,700a Average water usage ranging from 1999 to 2010.
Average Wastewater Generation Factor 193 gpd/acre
Range of Wastewater Generation Factors 5 - 725 gpd/acre
Percentiles
Wastewater Generation Factor, 80 Percentile 550 gpd/acre
Wastewater Generation Factor, 90 Percentile 600 gpd/acre
Wastewater Generation Factor, 95 Percentile 620 gpd/acre
Water Usea (cu ft/month) Water Use
a (gal/month)
TABLE B-1
CITY OF MANTECA WASTEWATER COLLECTION SYSTEM
2010 MASTER PLAN UPDATE
SPRECKELS PARK INDUSTRIAL WATER USE AND WASTEWATER GENERATION FACTORS
11/4/2010 N:\MTB015906\Excel\Spreckels Park Water Supply Summary.xls

APPENDIX B
CUMULATIVE FLOW ESTIMATES BY LINK FOR BUILDOUT CONDITIONS

SOUTH MANTECA TRUNK SEWER
33 AG-U 33 191.43 0 0
33 BIP-U 33 27.33 1,200 32,791
33 CMU-U 33 98.81 2,473 244,356
33 GC-D OS 1.71 750 1,285
33 GC-U 33, OS 79.27 750 59,452
33 HDR-U 33 18.72 2,337 43,753
33 LDR-D 33S, OS 61.54 1,338 82,340
33 LDR-U 33, OS 661.99 808 534,890
33 OS-U 33 415.02 0 0
33 VLDR-U 33 186.62 320 59,720
TOTAL FLOW, LINK 33 1,058,587 2.29 2,424,950
34A BIP-U 34A 44.66 1,200 53,592
34A CMU-U 34A 23.41 2,473 57,882
34A GC-U 34A 24.42 750 18,318
34A HDR-U 34A 2.13 2,337 4,977
TOTAL FLOW, LINK 34A 134,768 3.58 482,129
34B BIP-U 34B 178.00 1,200 213,601
34B LDR-U 34B 28.62 808 23,127
34B MDR-U 34B 48.99 1,346 65,944
34B OS-U 34B 13.93 0 0
34B VLDR-U 34B 9.39 320 3,003
1,058,587
134,768
TOTAL FLOW, LINK 34B 1,499,031 2.15 3,222,567
32 BIP-D 32S 1.51 1,200 1,810
32 GC-D 32N, 32S 88.14 750 66,103
32 GC-U 32N 1.28 750 959
32 HI-D 32N 148.96 1,000 148,962
32 HI-U 32N 26.07 1,000 26,065
32 LDR-D 32N 22.65 1,338 30,310
32 LI-D 32N, 32S 56.95 1,000 56,951
32 LI-U 32N, 32S 23.32 1,000 23,319
32 P-D 32N 4.42 400 1,767
TOTAL FLOW, LINK 32 356,247 3.03 1,079,727
WASTEWATER COLLECTION SYSTEM MASTER PLAN UPDATE
CITY OF MANTECA
APPENDIX B
LinkLand
Use
Sewer
Shed(s)
Use
Area
(ac)
Peaking
Factor
Link
PWWF
(gpd)
Flow from Link 33
Wastewater
Generation
Factor
(gpd/ac)
Link
ADWF
(gpd)
Cumm.
ADWF
(gpd)
CUMULATIVE FLOW ESTIMATES BY LINK FOR BUILDOUT CONDITIONS
Flow from Link 34A
N:\MTB015906\Excel\2010 Update\Final_2012\AppB_Flow Estimates.xlsx Appendix B-1

WASTEWATER COLLECTION SYSTEM MASTER PLAN UPDATE
CITY OF MANTECA
APPENDIX B
LinkLand
Use
Sewer
Shed(s)
Use
Area
(ac)
Peaking
Factor
Link
PWWF
(gpd)
Wastewater
Generation
Factor
(gpd/ac)
Link
ADWF
(gpd)
Cumm.
ADWF
(gpd)
CUMULATIVE FLOW ESTIMATES BY LINK FOR BUILDOUT CONDITIONS
32A LI-D 32A 1.00 1,000 1,000
32A LI-U 32A 56.17 1,000 56,166
32A P-D 32A 2.25 400 901
32A PQP-D 32A 8.97 425 3,812
356,247
TOTAL FLOW, LINK 32A 418,126 2.92 1,219,533
21 GC-U 21 6.27 750 4,704
21 HDR-U 21 25.70 2,337 60,061
21 HI-U 21 11.99 1,000 11,994
21 LDR-U 21 77.50 808 62,620
21 LI-U 21 2.14 1,000 2,139
21 MDR-U 21 41.20 1,346 55,455
21 PQP-U 21 7.68 425 3,263
21 P-U 21 1.70 400 680
TOTAL FLOW, LINK 21 200,916 3.39 680,741
20 CMU-U 20S 5.01 2,473 12,401
20 HDR-U 20N 15.33 2,337 35,832
20 LDR-D 20N 42.17 1,338 56,427
20 LDR-U 20N, 20S 185.69 808 150,039
20 MDR-U 20N 14.91 1,346 20,068
20 P-D 20N 9.51 400 3,803
20 PQP-D 20N 7.38 425 3,138
20 PQP-U 20N 8.01 425 3,402
20 P-U 20S 10.24 400 4,097
200,916
TOTAL FLOW, LINK 20 490,125 2.80 1,372,562
27N CMU-U 27N 42.60 2,473 105,350
27N GC-U 27N 108.20 750 81,150
27N HI-D 27N 0.00 1,000 0
27N HI-U 27N 28.50 1,000 28,500
27N PQP-D 27N 20.15 425 8,563
TOTAL FLOW, LINK 27N 223,563 3.33 744,224
36 AG-U 36N, 36S 472.65 0 0
36 BIP-U 36W 373.02 1,200 447,624
36 CMU-U 36N, 36W 185.59 2,473 458,967
36 HDR-U 36N 15.50 2,337 36,224
36 HI-U 36S 2.43 1,000 2,433
36 LDR-U 36W 61.90 808 50,015
36 MDR-U 36N 9.40 1,346 12,652
36 NC-U 36N 7.51 1,120 8,409
36 PQP-U 36N 6.79 425 2,884
36 P-U 36N 7.00 400 2,800
36 UR-U 36N, 36S 1,130.55 320 361,775
36 VLDR-U 36N 46.49 320 14,877
TOTAL FLOW, LINK 36 1,398,661 2.17 3,037,816
Flow from Link 32
Flow from Link 21
N:\MTB015906\Excel\2010 Update\Final_2012\AppB_Flow Estimates.xlsx Appendix B-2

WASTEWATER COLLECTION SYSTEM MASTER PLAN UPDATE
CITY OF MANTECA
APPENDIX B
LinkLand
Use
Sewer
Shed(s)
Use
Area
(ac)
Peaking
Factor
Link
PWWF
(gpd)
Wastewater
Generation
Factor
(gpd/ac)
Link
ADWF
(gpd)
Cumm.
ADWF
(gpd)
CUMULATIVE FLOW ESTIMATES BY LINK FOR BUILDOUT CONDITIONS
17 HDR-D 17 17.31 3,789 65,586
17 LDR-D 17 61.28 1,338 81,986
1,398,661
418,126
223,563
490,125
TOTAL FLOW, LINK 17 2,678,047 2.06 5,515,273
16 LDR-D 16 109.25 1,338 146,170
16 NC-U 16 2.33 1,120 2,612
16 P-D 16 50.62 400 20,248
2,678,047
TOTAL FLOW, LINK 16 2,847,077 2.06 5,855,673
16B CMU-U 16BN 88.65 2,473 219,230
16B LDR-D 16BN, 16BS 104.62 1,338 139,986
16B LDR-U 16BN 10.26 808 8,294
16B PQP-D 16BS 13.23 425 5,622
2,847,077
TOTAL FLOW, LINK 16B 3,220,210 2.05 6,611,707
25 HDR-U 25 20.30 2,337 47,441
25 LDR-D 25 0.00 1,338 0
25 LDR-U 25 276.30 808 223,250
25 MDR-U 25 19.90 1,346 26,785
25 P-U 25 17.80 400 7,120
TOTAL FLOW, LINK 25 304,597 3.14 955,697
27S BIP-U 27S 65.10 1,200 78,120
27S CMU-U 27S 41.40 2,473 102,382
27S HI-U 27S 273.02 1,000 273,025
27S OS-U 27S 7.60 0 0
27S PQP-U 27S 8.00 425 3,400
27S P-U 27S 30.50 400 12,200
304,597
TOTAL FLOW, LINK 27S 773,724 2.48 1,915,416
22S1 CMU-U 22S1 7.10 2,473 17,559
22S1 HDR-U 22S1 6.44 2,337 15,043
22S1 LDR-D 22S1 2.12 1,338 2,840
22S1 LDR-U 22S1 426.09 808 344,278
22S1 MDR-U 22S1 12.96 1,346 17,444
22S1 P-U 22S1 20.10 400 8,040
773,724
TOTAL FLOW, LINK 22S1 1,178,927 2.24 2,639,907
22S2 LDR-U 22S2 224.13 808 181,094
22S2 P-U 22S2 12.22 400 4,890
1,178,927
TOTAL FLOW, LINK 22S2 1,364,910 2.18 2,976,135
Flow from Link 22S1
Flow from Link 36
Flow from Link 32A
Flow from Link 27N
Flow from Link 20
Flow from Link 17
Flow from Link 16
Flow from Link 25
Flow from Link 27S
N:\MTB015906\Excel\2010 Update\Final_2012\AppB_Flow Estimates.xlsx Appendix B-3

WASTEWATER COLLECTION SYSTEM MASTER PLAN UPDATE
CITY OF MANTECA
APPENDIX B
LinkLand
Use
Sewer
Shed(s)
Use
Area
(ac)
Peaking
Factor
Link
PWWF
(gpd)
Wastewater
Generation
Factor
(gpd/ac)
Link
ADWF
(gpd)
Cumm.
ADWF
(gpd)
CUMULATIVE FLOW ESTIMATES BY LINK FOR BUILDOUT CONDITIONS
22 CMU-U 22N 19.58 2,473 48,420
22 GC-D 22N 3.56 750 2,671
22 GC-U 22N 64.90 750 48,678
22 LDR-D 22N, 22W 77.06 1,338 103,107
22 LDR-U 22N, 22W 518.63 808 419,050
22 P-U 22W 27.42 400 10,970
22 VLDR-D 22W 3.00 530 1,588
22 VLDR-U 22W 35.65 320 11,408
3,220,210
1,364,910
TOTAL FLOW, LINK 22 5,231,012 2.05 10,723,874
22A GC-D 22A 66.29 750 49,718
22A LDR-D 22A 27.69 1,338 37,052
22A P-D 22A 5.07 400 2,029
22A PQP-D 22A 18.02 425 7,659
5,231,012
TOTAL FLOW, LINK 22A 5,327,470 2.05 10,921,564
10S CMU-D 10S 1.92 2,473 4,747
10S CMU-U 10S 1.44 2,473 3,570
10S HDR-U 10S 4.07 2,337 9,509
10S LDR-D 10S 20.59 1,338 27,550
10S LDR-U 10S 267.52 808 216,155
10S MDR-D 10S 1.06 2,183 2,314
10S MDR-U 10S 7.21 1,346 9,709
10S P-U 10S 23.88 400 9,554
10S VLDR-D 10S 5.89 530 3,120
10S VLDR-U 10S 101.12 320 32,358
TOTAL FLOW, LINK 10S 318,584 3.11 990,024
10 GC-U 10N 50.68 750 38,007
5,327,470
318,584
TOTAL FLOW, LINK 10 5,684,061 2.05 11,652,456
9S AG-U 9S 19.56 0 0
9S LDR-D 9S 28.78 1,338 38,509
9S LDR-U 9S 159.14 808 128,585
9S P-U 9S 17.21 400 6,885
9S VLDR-D 9S 64.01 530 33,923
9S VLDR-U 9S 135.70 320 43,423
TOTAL FLOW, LINK 9S 251,325 3.26 819,283
Flow from Link 16B
Flow from Link 22S2
Flow from Link 22A
Flow from Link 10S
Flow from Link 22
N:\MTB015906\Excel\2010 Update\Final_2012\AppB_Flow Estimates.xlsx Appendix B-4

WASTEWATER COLLECTION SYSTEM MASTER PLAN UPDATE
CITY OF MANTECA
APPENDIX B
LinkLand
Use
Sewer
Shed(s)
Use
Area
(ac)
Peaking
Factor
Link
PWWF
(gpd)
Wastewater
Generation
Factor
(gpd/ac)
Link
ADWF
(gpd)
Cumm.
ADWF
(gpd)
CUMULATIVE FLOW ESTIMATES BY LINK FOR BUILDOUT CONDITIONS
9 GC-U 9N 2.43 750 1,822
9 LDR-D 9N 11.42 1,338 15,285
9 LDR-U 9N 91.03 808 73,553
9 MDR-U 9N 11.40 1,346 15,346
9 P-U 9N 9.90 400 3,961
5,684,061
251,325
TOTAL FLOW, LINK 9 6,045,354 2.05 12,393,044
8S AG-U 8S 37.04 0 0
8S LDR-D 8S 5.00 1,338 6,690
8S LDR-U 8S 77.29 808 62,453
8S PQP-U 8S 25.44 425 10,811
8S P-U 8S 4.78 400 1,914
8S VLDR-D 8S 18.10 530 9,594
8S VLDR-U 8S 51.35 320 16,432
TOTAL FLOW, LINK 8S 107,894 3.66 395,088
8 CMU-U 8N 8.96 2,473 22,159
8 GC-U 8N 29.95 750 22,466
8 LDR-D 8N 47.45 1,338 63,492
8 LDR-U 8N 0.39 808 314
8 P-D 8N 6.91 400 2,764
6,045,354
107,894
TOTAL FLOW, LINK 8 6,264,442 2.05 12,842,152
7 CMU-D 7N 10.08 2,473 24,925
7 GC-D 7N 3.45 750 2,587
7 GC-U 7N 23.45 750 17,591
7 LDR-D 7N 70.26 1,338 94,009
7 LDR-U 7S 152.09 808 122,890
7 NC-D 7N 1.35 1,120 1,510
7 P-D 7N 9.24 400 3,695
7 P-U 7S 5.66 400 2,263
6,264,442
TOTAL FLOW, LINK 7 6,533,911 2.05 13,394,545
6 AG-D 6S 4.99 0 0
6 AG-U 6S 54.88 0 0
6 LDR-D 6N 31.11 1,338 41,630
6 LDR-U 6N 1.64 808 1,323
6 MDR-D 6N 0.11 2,183 230
6 MDR-U 6N 17.41 1,346 23,431
6 P-D 6N 5.27 400 2,107
6 VLDR-U 6S 236.59 320 75,709
1,499,031
6,533,911
TOTAL FLOW, LINK 6 8,177,371 2.05 16,763,613
4 LI-D 4 3.75 1,000 3,750
4 LI-U 4 46.10 1,000 46,104
4 PQP-D 4 112.44 425 47,788
8,177,371
TOTAL FLOW, LINK 4 8,275,013 2.05 16,963,778
Flow from Link 6
Flow from Link 10
Flow from Link 9S
Flow from Link 9
Flow from Link 8S
Flow from Link 8
Flow from Link 34B
Flow from Link 7
N:\MTB015906\Excel\2010 Update\Final_2012\AppB_Flow Estimates.xlsx Appendix B-5

WASTEWATER COLLECTION SYSTEM MASTER PLAN UPDATE
CITY OF MANTECA
APPENDIX B
LinkLand
Use
Sewer
Shed(s)
Use
Area
(ac)
Peaking
Factor
Link
PWWF
(gpd)
Wastewater
Generation
Factor
(gpd/ac)
Link
ADWF
(gpd)
Cumm.
ADWF
(gpd)
CUMULATIVE FLOW ESTIMATES BY LINK FOR BUILDOUT CONDITIONS
3 CMU-U 3E 3.24 2,473 8,011
3 GC-D 3W 47.05 750 35,285
3 GC-U 3E, 3W 30.70 750 23,025
3 LDR-D 3E 54.35 1,338 72,723
3 MDR-D 3E 10.47 2,183 22,866
3 NC-U 3E 10.68 1,120 11,967
3 P-D 3E 5.07 400 2,028
3 PQP-U 3W 51.60 425 21,929
3 VLDR-D 3E 7.22 530 3,826
8,275,013
TOTAL FLOW, LINK 3 8,476,673 2.05 17,377,181
1 LI-D 1 4.27 1,000 4,270
1 LI-U 1 54.44 1,000 54,436
8,476,673
TOTAL FLOW, LINK 1 8,535,379 2.05 17,497,528
TOTAL ADWF, South Manteca Trunk Sewer (gpd) 8,535,379 2.05 17,497,528
Flow from Link 4
Flow from Link 3
N:\MTB015906\Excel\2010 Update\Final_2012\AppB_Flow Estimates.xlsx Appendix B-6

WASTEWATER COLLECTION SYSTEM MASTER PLAN UPDATE
CITY OF MANTECA
APPENDIX B
LinkLand
Use
Sewer
Shed(s)
Use
Area
(ac)
Peaking
Factor
Link
PWWF
(gpd)
Wastewater
Generation
Factor
(gpd/ac)
Link
ADWF
(gpd)
Cumm.
ADWF
(gpd)
CUMULATIVE FLOW ESTIMATES BY LINK FOR BUILDOUT CONDITIONS
CENTRAL MANTECA TRUNK SEWER
100 BIP-D 100 13.14 1,200 15,764
100 BIP-U 100 1.00 1,200 1,200
100 CMU-D 100 148.68 2,473 367,692
100 CMU-U 100 76.18 2,473 188,403
100 GC-D 100 158.60 750 118,947
100 GC-U 100 36.36 750 27,274
100 HDR-D 100 229.06 3,789 867,919
100 HDR-U 100 34.90 2,337 81,555
100 HI-D 100 8.77 1,000 8,771
100 LDR-D 100 1,876.28 1,338 2,510,460
100 LDR-U 100 155.29 808 125,473
100 LI-D 100 120.54 1,000 120,540
100 LI-U 100 7.91 1,000 7,911
100 MDR-D 100 164.88 2,183 359,923
100 MDR-U 100 55.91 1,346 75,261
100 NC-D 100 133.36 1,120 149,365
100 NC-U 100 13.09 1,120 14,663
100 P-D 100 271.44 400 108,576
100 PQP-D 100 335.67 425 142,659
100 P-U 100 8.61 400 3,443
100 VLDR-D 100 32.06 530 16,992
100 VLDR-U 100 6.76 320 2,165
TOTAL FLOW, LINK 100 5,314,955 2.05 10,895,915
93S1 CMU-U 93S1 50.46 2,473 124,780
93S1 GC-D 93S1 4.84 750 3,631
93S1 GC-U 93S1 10.06 750 7,542
93S1 LDR-D 93S1 14.40 1,338 19,262
93S1 LDR-U 93S1 6.81 808 5,504
93S1 LI-D 93S1 15.08 1,000 15,082
93S1 P-D 93S1 3.56 400 1,423
93S1 PQP-D 93S1 46.21 425 19,640
93S1 VLDR-D 93S1 10.98 530 5,819
TOTAL FLOW, LINK 93S1 202,681 3.38 685,767
53 LI-D 53 0.63 1,000 634
53 LI-U 53 34.60 1,000 34,601
5,314,955
202,681
3,206,509
314,518
618,054
TOTAL FLOW, LINK 53 9,691,952 2.05 19,868,502
TOTAL ADWF, Central Manteca Trunk Sewer (gpd)a 5,552,871 2.05 11,383,553
Flow from Link 100
Flow from Link 93S1
Flow from Link 66
Flow from Link 54
Flow from CPS
N:\MTB015906\Excel\2010 Update\Final_2012\AppB_Flow Estimates.xlsx Appendix B-7

WASTEWATER COLLECTION SYSTEM MASTER PLAN UPDATE
CITY OF MANTECA
APPENDIX B
LinkLand
Use
Sewer
Shed(s)
Use
Area
(ac)
Peaking
Factor
Link
PWWF
(gpd)
Wastewater
Generation
Factor
(gpd/ac)
Link
ADWF
(gpd)
Cumm.
ADWF
(gpd)
CUMULATIVE FLOW ESTIMATES BY LINK FOR BUILDOUT CONDITIONS
NORTH MANTECA TRUNK SEWER
81 AG-D 81 46.73 0 0
81 AG-U 81 414.53 0 0
81 GC-D 81 1.45 750 1,088
81 GC-U 81 1.75 750 1,310
81 LDR-D 81 86.74 1,338 116,058
81 LDR-U 81 330.66 808 267,173
81 NA-D 81 0.01 0 0
81 UR-D 81 14.95 530 7,922
81 UR-U 81 578.54 320 185,131
81 P-U 81 8.79 400 3,515
81 VLDR-D 81 25.44 530 13,485
81 VLDR-U 81 60.74 320 19,436
TOTAL FLOW, LINK 81 615,120 2.63 1,620,499
80 AG-D 80 12.54 0 0
80 AG-U 80 225.41 0 0
615,120
TOTAL FLOW, LINK 80 615,120 2.63 1,620,499
79 AG-D 79 51.96 0 0
79 AG-U 79 688.39 0 0
615,120
TOTAL FLOW, LINK 79 615,120 2.63 1,620,499
77 LDR-D 77 2.59 1,338 3,467
77 LDR-U 77 137.21 808 110,869
77 P-U 77 6.74 400 2,697
77 VLDR-D 77 55.30 530 29,311
77 VLDR-U 77 174.27 320 55,767
615,120
TOTAL FLOW, LINK 77 817,230 2.44 1,994,135
Flow from Link 81
Flow from Link 80
Flow from Link 79
N:\MTB015906\Excel\2010 Update\Final_2012\AppB_Flow Estimates.xlsx Appendix B-8
WASTEWATER COLLECTION SYSTEM MASTER PLAN UPDATE
CITY OF MANTECA
APPENDIX B
LinkLand
Use
Sewer
Shed(s)
Use
Area
(ac)
Peaking
Factor
Link
PWWF
(gpd)
Wastewater
Generation
Factor
(gpd/ac)
Link
ADWF
(gpd)
Cumm.
ADWF
(gpd)
CUMULATIVE FLOW ESTIMATES BY LINK FOR BUILDOUT CONDITIONS
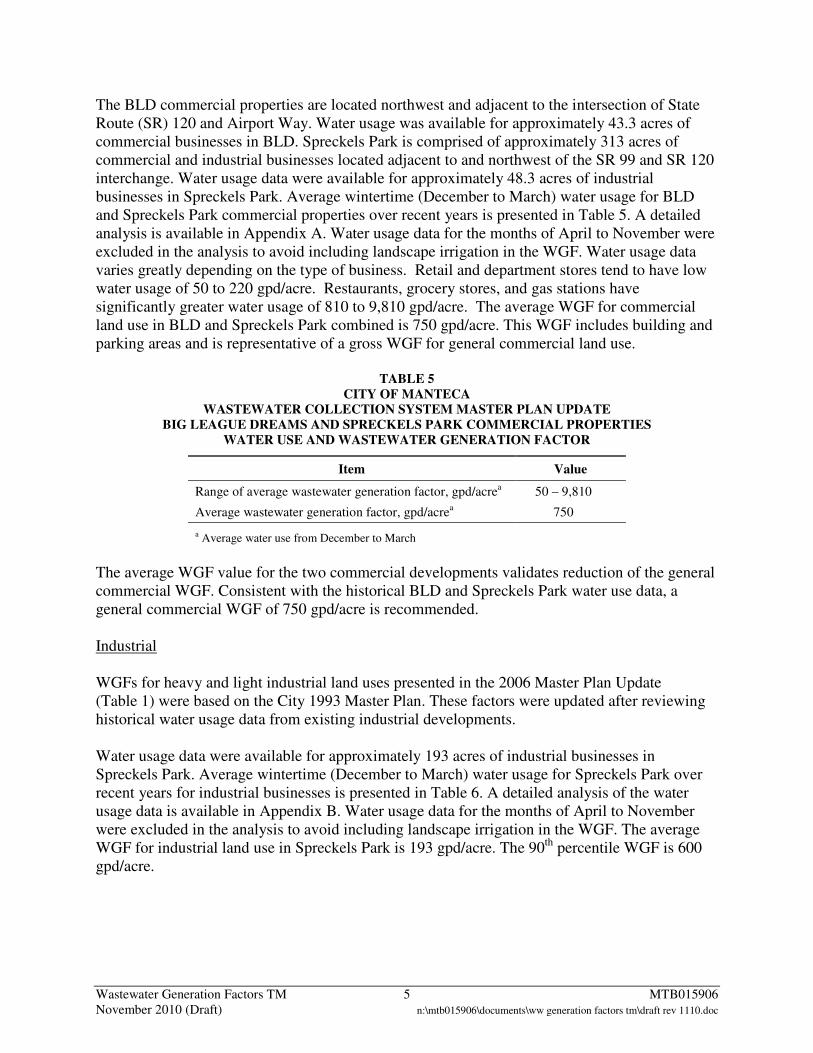
76 AG-D 76 22.45 0 0
76 AG-U 76 522.39 0 0
76 LDR-D 76 1.37 1,338 1,833
76 LDR-U 76 73.49 808 59,380
76 P-U 76 4.28 400 1,712
76 VLDR-D 76 23.90 530 12,669
76 VLDR-U 76 130.90 320 41,887
817,230
TOTAL FLOW, LINK 76 934,711 2.36 2,204,446
75 AG-D 75_North 28.83 0 0
75 AG-U 75_North 128.34 0 0
75 LDR-D 75_North, 75_South 5.24 1,338 7,017
75 LDR-U 75_North, 75_South 239.86 808 193,807
75 PQP-U 75_South 11.65 425 4,952
75 P-U 75_North, 75_South 17.75 400 7,099
75 VLDR-D 75_South 39.35 530 20,856
75 VLDR-U 75_South 8.88 320 2,841
934,711
TOTAL FLOW, LINK 75 1,171,283 2.24 2,626,206
74 AG-D 74 15.94 0 0
74 AG-U 74 775.23 0 0
74 CMU-U 74 9.50 2,473 23,487
74 GC-D 74 2.60 750 1,952
74 GC-U 74 28.44 750 21,331
74 LDR-D 74 74.80 1,338 100,087
74 P-D 74 6.63 400 2,652
74 PQP-D 74 11.56 425 4,911
1,171,283
TOTAL FLOW, LINK 74 1,325,703 2.19 2,904,752
Flow from Link 76
Flow from Link 77
Flow from Link 75
N:\MTB015906\Excel\2010 Update\Final_2012\AppB_Flow Estimates.xlsx Appendix B-9

WASTEWATER COLLECTION SYSTEM MASTER PLAN UPDATE
CITY OF MANTECA
APPENDIX B
LinkLand
Use
Sewer
Shed(s)
Use
Area
(ac)
Peaking
Factor
Link
PWWF
(gpd)
Wastewater
Generation
Factor
(gpd/ac)
Link
ADWF
(gpd)
Cumm.
ADWF
(gpd)
CUMULATIVE FLOW ESTIMATES BY LINK FOR BUILDOUT CONDITIONS
73 GC-D 73 14.16 750 10,620
73 GC-U 73 18.65 750 13,989
73 HDR-D 73 9.91 3,789 37,555
73 LDR-U 73 59.34 808 47,948
73 MDR-U 73 19.74 1,346 26,565
1,325,703
TOTAL FLOW, LINK 73 1,462,380 2.16 3,154,874
72 CMU-U 72 33.56 2,473 82,994
72 GC-D 72 5.10 750 3,822
72 PQP-D 72 13.40 425 5,696
72 PQP-U 72 141.61 425 60,184
72 P-U 72 5.43 400 2,173
72 VLDR-D 72 31.68 530 16,792
72 VLDR-U 72 10.75 320 3,439
1,462,380
TOTAL FLOW, LINK 72 1,637,480 2.13 3,480,688
70 CMU-D 70 7.00 2,473 17,302
70 CMU-U 70 12.72 2,473 31,460
70 LDR-D 70 9.44 1,338 12,626
70 LDR-U 70 90.16 808 72,853
70 OS-D 70 3.34 0 0
70 OS-U 70 13.15 0 0
70 P-D 70 10.74 400 4,294
70 PQP-D 70 24.68 425 10,491
70 P-U 70 1.00 400 399
1,637,480
TOTAL FLOW, LINK 70 1,786,905 2.11 3,763,397
69S2 AG-D 69S2_East 93.82 0 0
69S2 AG-U 69S2_East 534.47 0 0
TOTAL FLOW, LINK 69S2 0 4.05 0
69S1 AG-D 69S1_East 20.98 0 0
69S1 AG-U 69S1_East 741.60 0 0
69S1 LDR-D 69S1_Southwest 4.77 1,338 6,389
69S1 LDR-U 69S1_Southwest 152.82 808 123,482
0
TOTAL FLOW, LINK 69S1 129,871 3.59 466,563
69 LDR-U 69_West 135.50 808 109,482
69 P-U 69_East, 69_West 15.36 400 6,143
69 VLDR-D 69_West 9.98 530 5,289
69 VLDR-U 69_East 95.04 320 30,413
129,871
TOTAL FLOW, LINK 69 281,199 3.19 896,935
Flow from Link 74
Flow from Link 73
Flow from Link 72
Flow from Link 69S2
Flow from Link 69S1
N:\MTB015906\Excel\2010 Update\Final_2012\AppB_Flow Estimates.xlsx Appendix B-10

WASTEWATER COLLECTION SYSTEM MASTER PLAN UPDATE
CITY OF MANTECA
APPENDIX B
LinkLand
Use
Sewer
Shed(s)
Use
Area
(ac)
Peaking
Factor
Link
PWWF
(gpd)
Wastewater
Generation
Factor
(gpd/ac)
Link
ADWF
(gpd)
Cumm.
ADWF
(gpd)
CUMULATIVE FLOW ESTIMATES BY LINK FOR BUILDOUT CONDITIONS
68 CMU-D 68 3.05 2,473 7,543
68 CMU-U 68 16.58 2,473 41,003
68 LDR-D 68 54.71 1,338 73,196
68 LDR-U 68 19.93 808 16,105
68 MDR-D 68 2.18 2,183 4,763
68 OS-D 68 9.15 0 0
68 OS-U 68 2.13 0 0
68 P-D 68 14.23 400 5,691
1,786,905
281,199
TOTAL FLOW, LINK 68 2,216,404 2.07 4,596,295
67 HDR-U 67 15.19 2,337 35,491
67 LDR-D 67 21.95 1,338 29,362
67 LDR-U 67 44.55 808 36,000
67 MDR-D 67 18.58 2,183 40,571
67 MDR-U 67 6.39 1,346 8,600
67 NC-D 67 11.31 1,120 12,672
67 OS-D 67 2.83 0 0
67 P-D 67 5.59 400 2,235
67 P-U 67 4.20 400 1,681
2,216,404
TOTAL FLOW, LINK 67 2,383,018 2.07 4,925,765
66S4 AG-D 66S4 47.49 0 0
66S4 AG-U 66S4 344.95 0 0
TOTAL FLOW, LINK 66S4 0 4.05 0
66S3 AG-D 66S3_East 12.10 0 0
66S3 AG-U 66S3_East 162.67 0 0
66S3 HI-U 66S3_West 48.47 1,000 48,466
66S3 LI-U 66S3_West 114.45 1,000 114,449
0
TOTAL FLOW, LINK 66S3 162,915 3.49 569,201
66S2 HI-U 66S2_West 47.06 1,000 47,061
66S2 LDR-U 66S2_East 154.93 808 125,185
66S2 LI-U 66S2_West 225.26 1,000 225,261
162,915
TOTAL FLOW, LINK 66S2 560,422 2.70 1,514,265
66S1 LDR-U 66S1 135.53 808 109,506
66S1 PQP-U 66S1 14.73 425 6,262
66S1 P-U 66S1 4.83 400 1,932
560,422
TOTAL FLOW, LINK 66S1 678,122 2.57 1,739,554
Flow from Link 66S2
Flow from Link 70
Flow from Link 69
Flow from Link 68
Flow from Link 66S4
Flow from Link 66S3
N:\MTB015906\Excel\2010 Update\Final_2012\AppB_Flow Estimates.xlsx Appendix B-11

WASTEWATER COLLECTION SYSTEM MASTER PLAN UPDATE
CITY OF MANTECA
APPENDIX B
LinkLand
Use
Sewer
Shed(s)
Use
Area
(ac)
Peaking
Factor
Link
PWWF
(gpd)
Wastewater
Generation
Factor
(gpd/ac)
Link
ADWF
(gpd)
Cumm.
ADWF
(gpd)
CUMULATIVE FLOW ESTIMATES BY LINK FOR BUILDOUT CONDITIONS
66 LI-D 66 7.44 1,000 7,441
66 LI-U 66 137.93 1,000 137,928
2,383,018
678,122
TOTAL FLOW, LINK 66 3,206,509 2.05 6,583,861
CPS GC-U CPS_East 0.89 750 671
CPS HI-D CPS_West 6.84 1,000 6,838
CPS HI-U CPS_West 79.60 1,000 79,600
CPS LDR-D CPS_East 224.10 1,338 299,845
CPS LDR-U CPS_East 21.33 808 17,239
CPS LI-D CPS_West 4.27 1,000 4,270
CPS LI-U CPS_West 139.40 1,000 139,400
CPS MDR-U CPS_East 12.71 1,346 17,105
CPS NC-U CPS_East 3.09 1,120 3,457
CPS P-D CPS_East 20.40 400 8,158
CPS PQP-D CPS_East, CPS_West 97.58 425 41,472
TOTAL FLOW, CPS 618,054 2.63 1,626,116
56 HDR-U 56 10.48 2,337 24,491
56 LDR-D 56 2.74 1,338 3,663
56 LDR-U 56 174.00 808 140,588
56 NA-D 56 0.72 0 0
56 NC-U 56 19.46 1,120 21,794
56 PQP-D 56 5.54 425 2,353
56 PQP-U 56 0.83 425 354
56 P-U 56 14.21 400 5,685
TOTAL FLOW, LINK 56 198,928 3.39 675,066
54 GC-U 54 9.46 750 7,096
54 LDR-D 54 70.07 1,338 93,748
54 P-D 54 5.59 400 2,237
54 PQP-D 54 29.43 425 12,509
198,928
TOTAL FLOW, LINK 54 314,518 3.12 980,104
52 LDR-U 52 10.80 808 8,723
52 LI-D 52 23.75 1,000 23,751
52 LI-U 52 25.25 1,000 25,251
9,691,952
TOTAL FLOW, LINK 52 9,749,677 2.05 19,986,838
51 LI-D 51 4.08 1,000 4,084
51 PQP-D 51 163.28 425 69,394
9,749,677
TOTAL FLOW, LINK 51 9,823,155 2.05 20,137,468
TOTAL ADWF, North Manteca Trunk Sewer (gpd)b 4,270,284 2.05 8,755,750
TOTAL EXISTING AREA (ac) 25,185.96 TOTAL ADWF (gpd) 18,358,534 2.05 37,634,995
a Excludes flow from NMCS Sheds 66, 54, and CPS
b Excludes flow from CMCS Sheds 53, 93S1, and 100
Flow from Link 67
Flow from Link 66S1
Flow from Link 56
Flow from Link 53
Flow from Link 52
N:\MTB015906\Excel\2010 Update\Final_2012\AppB_Flow Estimates.xlsx Appendix B-12

APPENDIX C
SR-99 HYDRAULIC DESIGN OF LIFT STATION AND PUMP STATION ALTERNATIVES

Lift Station and Pump Station Alternatives
Length (ft) 5 4,120 4,120
Diameter (in) 18 18 12
CHW Value 130 130 130
From Inv. 8.92 8.92 8.92
To Inv. 29.50 24.50 24.50
Flow (gpm) 2,029 2,029 1,014
Veloctiy (ft/s) 2.6 2.6 2.9
hZ, Elevation Head (ft) 20.58 15.58 15.58
hV, Velocity Head (ft) 0.10 0.10 0.13
hF, Friction Head (ft) 0.01 5.34 10.67
Discharge Piping Friction Loss
Length (ft) 55 55 55
Diameter (in) 10 10 10
Flow (gpm) 1,014 1,014 1,014
Velocity (ft/s) 4.1 4.1 4.1
CHW Value 130 130 130
hF, Discharge Piping (ft) 0.35 0.35 0.35
Local Losses (Discharge Piping)
Lift Station Single Force Main Dual Force Main
Inlet 1 5.00 1.47 1.47 1.47
10'' 90-deg Ell 1 0.25 0.07 0.07 0.07
10'' Check Valve 1 2.20 0.64 0.64 0.64
10'' Plug Valve 1 0.30 0.09 0.09 0.09
10'' Tee, Inline 0 2.00 0.00 0.00 0.00
10'' Tee, Branch 2 2.00 1.17 1.17 1.17
Reducer 1 5.00 1.47 1.47 1.47
Total Local Head Loss at Fittings 4.91 4.91 4.91
Total Friction Loss at Discharge Piping (Hazen-Williams) 0.35 0.35 0.35
hL, Discharge Piping Loss (ft) 5.26 5.26 5.26
Total Head Loss Summary
hZ, Elevation Head 20.58 15.58 15.58
hV, Velocity Head 0.10 0.10 0.13
hF, Friction Head 0.01 5.34 10.67
hL, Discharge Piping Loss 5.26 5.26 5.26
Contingency 20% 20% 20%
Total Dynamic Head (TDH) 31.1 31.5 38.0
Station Configuration Triplex Triplex Triplex
Pump Design Flow (gpm) 1,014 1,014 1,014
Head Loss (ft)Lift Station
Alternative
Pump Station
Alternative
(Single Force Main)
Pump Station
Alternative
(Dual Force Main)
Local Head Loss (ft)
Discharge Piping
Parameter
Lift Station
Alternative
Fitting K-ValueQuantity
Pump Station Alternative
Single
Force Main
Dual
Force Main
Appendix C
SR-99 Hydraulic Design of Lift Station and Pump Station Alternatives
Lift Station
Alternative
Force Main
Parameter
Pump Station Alternative
Dual
Force Main
Single
Force Main
N:\MTB015906\Documents\sr 99 conveyance\tables.xlsx Appendix C-1

APPENDIX D
WOODWARD FORCE MAIN SYSTEM HEAD CURVES

590 GPM, 38 FT TDH
100 PSI MAX.
0
100
200
300
400
0 500 1,000 1,500 2,000 2,500 3,000 3,500 4,000 4,500 5,000
Hea
d (
ft)
Flow (gpm)
Woodward Force Main (Woodward Park) System CurvesExisting WPPS (Duplex) vs System Head (Exsiting WFM)
System Head (Existing WFM)
Existing (Duplex) Pump Curve (One
Pump Operating)
N:\MTB015906\Excel\2010 Update\Final_2012\201210 Force Mains.xlsx Appendix D, Curve D-1

1,900 GPM
100 PSI MAX.
0
100
200
300
400
0 500 1,000 1,500 2,000 2,500 3,000 3,500 4,000 4,500 5,000
Hea
d (
ft)
Flow (gpm)
Woodward Force Main (Woodward Park) System CurvesUpgraded WPPS (Duplex) vs System Head (Existing WFM); Peak Flows at 100 psi
System Head (Existing WFM)
Upgraded (Duplex) Pump Curve (One
Pump Operating)
N:\MTB015906\Excel\2010 Update\Final_2012\201210 Force Mains.xlsx Appendix D, Curve D-2

1,250 GPM, 30 FT TDH
0
50
100
150
200
0 500 1,000 1,500 2,000 2,500 3,000 3,500 4,000 4,500 5,000
Hea
d (
ft)
Flow (gpm)
Woodward Force Main (Tara Park) System CurvesExisting TPPS (Duplex) vs System Head (18-inch Force Main)
System Head (18-inch WFM)
Existing (Duplex) Pump Curve
(One Pump Operating)
N:\MTB015906\Excel\2010 Update\Final_2012\201210 Force Mains.xlsx Appendix D, Curve D-3
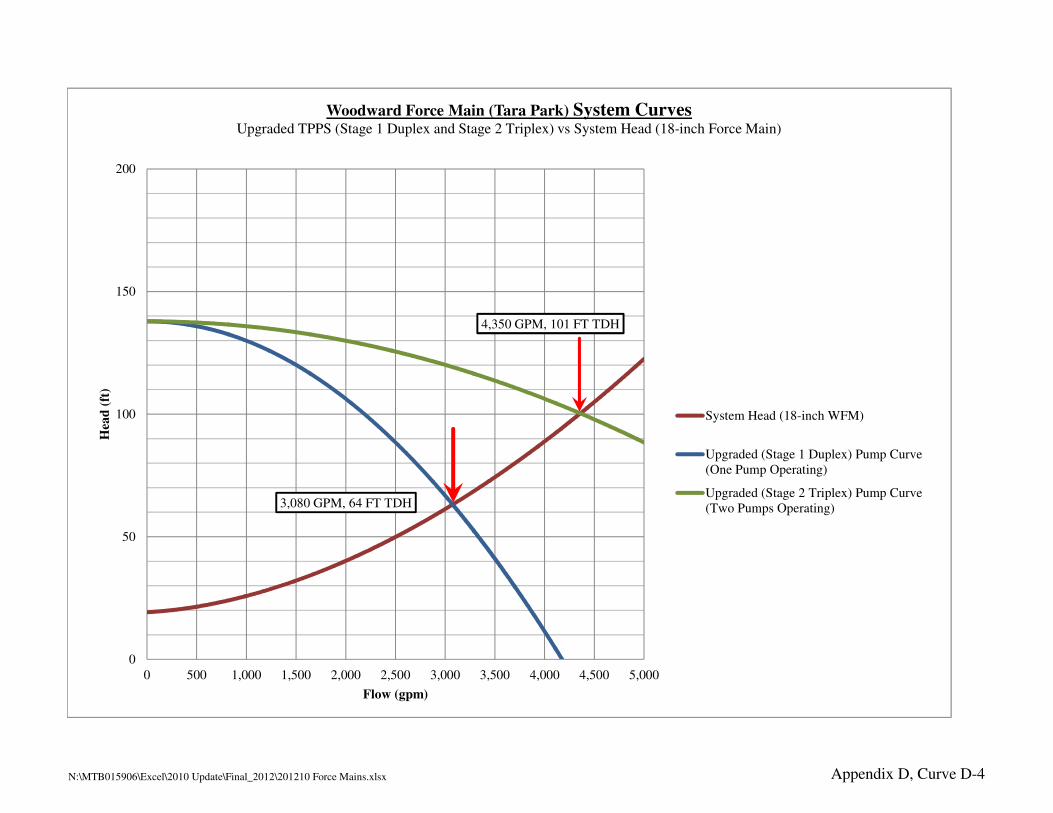
3,080 GPM, 64 FT TDH
4,350 GPM, 101 FT TDH
0
50
100
150
200
0 500 1,000 1,500 2,000 2,500 3,000 3,500 4,000 4,500 5,000
Hea
d (
ft)
Flow (gpm)
Woodward Force Main (Tara Park) System CurvesUpgraded TPPS (Stage 1 Duplex and Stage 2 Triplex) vs System Head (18-inch Force Main)
System Head (18-inch WFM)
Upgraded (Stage 1 Duplex) Pump Curve
(One Pump Operating)
Upgraded (Stage 2 Triplex) Pump Curve
(Two Pumps Operating)
N:\MTB015906\Excel\2010 Update\Final_2012\201210 Force Mains.xlsx Appendix D, Curve D-4

APPENDIX E
SOUTH MANTECA COLLECTION STRATEGY PHASED IMPROVEMENTS EXISTING FLOW AND
AVAILABLE CAPACITY FOR ADWF AND PWWF LOADING

1A Constructed 480 60 -3.92 -4.14 0.0005 35,223,022 2.05 17,181,962 1,704,650 15,477,312
1 Proposed 1,000 54 -3.70 -3.92 0.0002 18,425,839 2.05 8,988,214 1,704,650 7,283,563
2 Proposed 686 48 -3.44 -3.70 0.0004 17,665,820 2.05 8,617,473 1,700,381 6,917,092
3 Proposed 1,325 48 -2.95 -3.44 0.0004 17,450,155 2.05 8,512,270 1,700,381 6,811,890
4 Proposed 808 48 -2.67 -2.95 0.0004 16,892,057 2.05 8,240,027 1,563,653 6,676,374
5 Proposed 1,056 48 -2.31 -2.67 0.0003 16,754,385 2.05 8,172,870 1,512,115 6,660,755
6 Constructed 2,637 60 -1.23 -2.31 0.0004 28,856,576 2.05 14,076,379 1,512,115 12,564,263
7 Constructed 1,553 36 1.73 0.37 0.0009 12,424,826 2.05 6,060,858 1,384,524 4,676,334
8 Constructed 1,620 36 3.16 1.73 0.0009 12,430,577 2.05 6,063,664 1,257,799 4,805,865
8S Proposed 4,835 12 16.80 5.16 0.0024 1,104,318 3.01 366,852 16,284 350,568
9 Constructed 2,602 36 5.44 3.16 0.0009 12,368,349 2.05 6,033,307 1,175,259 4,858,048
9S Proposed 3,808 12 18.01 10.39 0.0020 1,006,804 3.09 325,507 72,432 253,075
10 Constructed 2,660 36 7.78 5.44 0.0009 12,424,826 2.05 6,060,858 1,087,542 4,973,316
10S Proposed 4,887 12 23.87 14.09 0.0020 1,006,849 3.09 325,525 37,731 287,795
14A Proposed 50 36 12.43 12.39 0.0008 11,917,474 2.05 5,813,351 (N/A) 5,813,351
16C Constructed 507 30 14.31 14.01 0.0006 6,302,979 2.05 3,068,150 697,540 2,370,610
16 Constructed 475 30 14.37 14.31 0.0001 2,912,179 2.19 1,329,789 697,540 632,249
17A Constructed 568 27 15.00 14.62 0.0007 5,060,424 2.06 2,450,721 531,122 1,919,599
17 Constructed 566 27 15.66 15.00 0.0012 6,680,870 2.05 3,254,228 531,122 2,723,106
18A Constructed 296 27 15.95 15.66 0.0010 6,123,820 2.06 2,979,725 383,549 2,596,176
18 Constructed 243 27 16.07 15.95 0.0005 4,347,672 2.08 2,089,603 383,549 1,706,054
19 Constructed 500 24 16.90 16.31 0.0012 4,909,119 2.07 2,374,634 71,932 2,302,702
20B Constructed 501 18 17.90 16.90 0.0020 2,964,652 2.18 1,358,614 63,369 1,295,245
20A Constructed 417 18 18.75 17.90 0.0020 2,995,946 2.18 1,375,764 63,369 1,312,394
20 Constructed 420 18 19.59 18.75 0.0020 2,967,615 2.18 1,360,239 63,369 1,296,870
21B Constructed 501 15 21.09 19.59 0.0030 2,232,900 2.35 950,685 0 950,685
21A Constructed 498 15 22.59 21.09 0.0030 2,239,616 2.35 954,457 0 954,457
21 Constructed 503 15 24.09 22.59 0.0030 2,228,457 2.35 948,190 0 948,190
22A Constructed 1,200 36 8.83 7.78 0.0009 12,463,593 2.05 6,079,770 1,049,812 5,029,959
22 Proposed 4,050 36 12.39 8.83 0.0009 12,492,136 2.05 6,093,695 953,354 5,140,341
22S Proposed 5,300 24 32.00 28.00 0.0008 3,926,039 2.10 1,871,926 2,840 1,869,087
22S1 Proposed 6,500 18 25.00 12.00 0.0020 2,967,615 2.18 1,360,239 2,840 1,357,399
22S2 Proposed 1,500 18 12.00 8.90 0.0021 3,016,670 2.17 1,387,104 2,840 1,384,264
25 Proposed 2,650 12 25.00 19.70 0.0020 1,006,540 3.09 325,397 0 325,397
30 Constructed 1,576 18 19.18 17.28 0.0012 2,304,047 2.33 990,657 311,617 679,041
31A Constructed 1,014 18 20.41 19.18 0.0012 2,311,139 2.32 994,643 311,617 683,027
31 Constructed 350 18 20.83 20.41 0.0012 2,298,705 2.33 987,655 311,617 676,038
32A Constructed 399 18 21.31 20.83 0.0012 2,301,584 2.33 989,273 311,617 677,656
32 Constructed 376 18 21.76 21.31 0.0012 2,295,646 2.33 985,936 305,904 680,033
33 Proposed 2,975 18 5.50 1.45 0.0014 2,448,367 2.28 1,071,732 83,625 988,107
a PWWF Capacity based on d/D = 0.80
b Peaking Factor corresponding to PWWF Capacity
c ADWF Capacity = PWWF / Peaking Factor
LinkUpstream
Invert
APPENDIX E
FLOW ESTIMATES FOR SOUTH MANTECA COLLECTION SYSTEM GRAVITY LINKS
EXISTING FLOW AND AVAILABLE CAPACITY FOR ADWF AND PWWF LOADING
Status
Cummulative ADWF (gpd)
ExistingAvailable
Capacity
Downstream
InvertSlope
Diameter
(in)
PWWF
Capacitya
ADWF
Capacityc
Peaking
Factorb
Length
(ft)
N:\MTB015906\Excel\2010 Update\Final_2012\201210 SMCS Phasing.xlsx Appendix E-1

APPENDIX F
SOUTH MANTECA COLLECTION STRATEGY PHASED IMPROVEMENTS TRIGGER FLOW CALCULATIONS

PROJECT: Upgrade WPPS Pumps, Stage 1 Upgrade
Remaing ADWF Capacity to Trigger Flow Available Flow to WPPS
PROJECT: Upgrade TPPS Pumps, Stage 1 Upgrade
Available Flow to TPPS
PROJECT: Upgrade TPPS Pumps, Stage 2 Upgrade
Remaing ADWF Capacity to Trigger Flow Available Flow to TPPS
PROJECT: Construct Links 1 - 5; Existing 12-inch WFM limiting component (pressure)
Remaing ADWF Capacity to Trigger Flow Available Flow to WPPS / 12-inch WFM
Buildout Flow (ADWF) from Pump Stations along 12" Force
Main (see Appendix D)351,968 gpd
TPPS Inflow
289,439 gpd
710,000 gpd
Trigger Flow (ADWF) 2,134,000 gpd
1,113,064 gpd
1,800,000 gpd
(248,406) gpd
Trigger Flow (PWWF)
Trigger Flow (ADWF) 1,232,000 gpd
Existing Flow (ADWF) to WPPS 843,148 gpd
388,852 gpd
TRIGGER FLOW CALCULATIONS
SOUTH MANTECA COLLECTION STRATEGY - PHASED IMPROVEMENTS
(581,148) gpd
668,968 gpdExisting ADWF to TPPS
Trigger Flow (PWWF)
Existing ADWF to TPPS
Trigger Flow (ADWF)
Description WPPS Inflow
Trigger Flow (PWWF) 2,736,000 gpd
APPENDIX F
4,435,000 gpd
Description WPPS Inflow
849,000 gpd
262,000 gpd
843,148 gpd
Trigger Flow (PWWF)
Trigger Flow (ADWF)
Existing ADWF to WPPS
Description
Existing Flow (ADWF) from Pump Stations along 12" Force
Main (see Appendix D)
Remaing ADWF Capacity to Trigger Flow
TPPS InflowDescription
668,968 gpd
N:\MTB015906\Excel\2010 Update\Final_2012\201210 SMCS Phasing.xlsx Appendix F-1

TRIGGER FLOW CALCULATIONS
SOUTH MANTECA COLLECTION STRATEGY - PHASED IMPROVEMENTS
APPENDIX F
PROJECT: Construct Links 1 - 5; Existing 18-inch WFM limiting component (velocity)
12-inch WFM Trigger Flow
Remaing ADWF Capacity to Trigger Flow Available Flow to TPPS / 18-inch WFMa
a Assumed that Sheds 1, 3, and 4 have reached buildout
PROJECT: Construct Link 27S (Force Main); Construct SMLS, Link 22S1, Link 22S2, and Link 22S
80% Full Flow Capacity of Link 18 (PWWF)
Corresponding ADWF Capacity of Link 18
Available Flow to Link 18
2,701,796 gpd
Description Link 18
5,563,000 gpd
Buildout ADWF in Link 18, Excluding Sheds Tributary to
ABPS
Remaing ADWF Capacity to Trigger Flow
2,306,911 gpd
351,968 gpd
394,000 gpd
9,136,000 gpdTrigger Flow (PWWF)
1,135,057 gpd
668,968 gpd
4,455,000 gpd
Maximum Flow in 12-inch WFM (ADWF)
Buildout Flow for Sheds 1, 3, and 4 (ADWF)
1,941,000 gpd
358,008 gpd
Buildout Flow for 12-inch WFM Lift Stations (ADWF)
Existing Flow (ADWF) to TPPS
Trigger Flow (ADWF)
Description TPPS Inflow
N:\MTB015906\Excel\2010 Update\Final_2012\201210 SMCS Phasing.xlsx Appendix F-2

APPENDIX G
DEVELOPMENT OF UNIT PIPE INSTALLATION COSTS

Excavation
($/lf)
Backfill
($/lf)
Compaction
($/lf)
EARTHWORK
SUBTOTAL
($/lf)
6-inch; 0-10 ft VCP 10.50 2.50 4.50 0.00 0.97 0.96 0.96 4.50 0 1.94 1.93 1.93 5.80 0.00 22.50 4.82 0.48 1.21 0.72 7.23 6 0 23 8 37
6-inch; 10-20 ft VCP 20.50 3.50 5.50 0.00 2.66 2.65 2.65 5.50 5.5 5.31 5.30 5.30 15.92 173.25 27.50 4.82 0.48 1.21 0.72 7.23 16 174 28 8 226
6-inch; 20-25 ft VCP 25.50 6.50 8.50 0.00 6.14 6.13 6.13 8.50 10.5 12.28 12.26 12.26 36.80 330.75 42.50 4.82 0.48 1.21 0.72 7.23 37 331 43 8 419
8-inch; 0-10 ft VCP 10.50 2.67 4.67 0.00 1.04 1.02 1.02 4.67 0 2.07 2.05 2.05 6.17 0.00 23.33 6.70 0.67 1.68 1.01 10.06 7 0 24 11 42
8-inch; 10-20 ft VCP 20.50 3.67 5.67 0.00 2.78 2.77 2.77 5.67 5.5 5.57 5.54 5.54 16.65 173.25 28.33 6.70 0.67 1.68 1.01 10.06 17 174 29 11 231
10-inch; 0-10 ft VCP 10.50 2.83 4.83 0.00 1.10 1.08 1.08 4.83 0 2.20 2.16 2.16 6.53 0.00 24.17 11.02 1.10 2.75 1.65 16.53 7 0 25 17 49
10-inch; 10-20 ft VCP 20.50 3.83 5.83 0.00 2.91 2.89 2.89 5.83 5.5 5.82 5.78 5.78 17.38 173.25 29.17 11.02 1.10 2.75 1.65 16.53 18 174 30 17 239
12-inch; 0-10 ft VCP 10.50 3.00 5.00 0.00 1.17 1.14 1.14 5.00 0 2.33 2.28 2.28 6.88 0.00 25.00 14.76 1.48 3.69 2.21 22.14 7 0 25 23 55
12-inch; 10-20 ft VCP 20.50 4.00 6.00 0.00 3.04 3.01 3.01 6.00 5.5 6.07 6.02 6.02 18.11 173.25 30.00 14.76 1.48 3.69 2.21 22.14 19 174 30 23 246
12-inch; 20-25 ft VCP 25.50 7.00 9.00 5.00 6.98 6.95 6.95 9.00 10.5 13.96 13.90 13.90 41.77 330.75 45.00 14.76 1.48 3.69 2.21 22.14 42 331 45 23 441
15-inch; 0-10 ft VCP 10.50 3.25 5.25 0.00 1.26 1.22 1.22 5.25 0 2.53 2.44 2.44 7.40 0.00 26.25 23.37 2.34 5.84 3.51 35.06 8 0 27 36 71
15-inch; 10-20 ft VCP 20.50 4.25 6.25 0.00 3.23 3.18 3.18 6.25 5.5 6.45 6.36 6.36 19.18 173.25 31.25 23.37 2.34 5.84 3.51 35.06 20 174 32 36 262
15-inch; 20-25 ft VCP 25.50 7.25 9.25 5.00 7.22 7.17 7.17 9.25 10.5 14.44 14.34 14.34 43.12 330.75 46.25 23.37 2.34 5.84 3.51 35.06 44 331 47 36 458
18-inch; 0-10 ft VCP 10.50 3.50 5.50 0.00 1.36 1.30 1.30 5.50 0 2.72 2.59 2.59 7.90 0.00 27.50 32.83 3.28 8.21 4.92 49.24 8 0 28 50 86
18-inch; 10-20 ft VCP 20.50 4.50 6.50 0.00 3.42 3.35 3.35 6.50 5.5 6.83 6.70 6.70 20.24 173.25 32.50 32.83 3.28 8.21 4.92 49.24 21 174 33 50 278
18-inch; 20-25 ft VCP 25.50 7.50 9.50 5.00 7.45 7.39 7.39 9.50 10.5 14.91 14.78 14.78 44.46 330.75 47.50 32.83 3.28 8.21 4.92 49.24 45 331 48 50 474
18-inch; 25-30 ft VCP 30.50 7.50 9.50 5.00 8.84 8.78 8.78 9.50 15.5 17.69 17.55 17.55 52.79 488.25 47.50 32.83 3.28 8.21 4.92 49.24 53 489 48 50 640
21-inch; 0-10 ft VCP 10.50 3.75 5.75 0.00 1.46 1.37 1.37 5.75 0 2.92 2.74 2.74 8.39 0.00 28.75 43.18 4.32 10.79 6.48 64.76 9 0 29 65 103
21-inch; 10-20 ft VCP 20.50 4.75 6.75 0.00 3.61 3.52 3.52 6.75 5.5 7.21 7.03 7.03 21.28 173.25 33.75 43.18 4.32 10.79 6.48 64.76 22 174 34 65 295
21-inch; 20-25 ft VCP 25.50 7.75 9.75 5.00 7.69 7.60 7.60 9.75 10.5 15.38 15.20 15.20 45.78 330.75 48.75 43.18 4.32 10.79 6.48 64.76 46 331 49 65 491
21-inch; 25-30 ft VCP 30.50 7.75 9.75 5.00 9.13 9.04 9.04 9.75 15.5 18.25 18.07 18.07 54.39 488.25 48.75 43.18 4.32 10.79 6.48 64.76 55 489 49 65 658
24-inch; 0-10 ft VCP 10.50 4.00 6.00 0.00 1.56 1.44 1.44 6.00 0 3.11 2.88 2.88 8.87 0.00 30.00 57.34 5.73 14.34 8.60 86.01 9 0 30 87 126
24-inch; 10-20 ft VCP 20.50 5.00 7.00 0.00 3.80 3.68 3.68 7.00 5.5 7.59 7.36 7.36 22.31 173.25 35.00 57.34 5.73 14.34 8.60 86.01 23 174 35 87 319
24-inch; 20-25 ft VCP 25.50 8.00 10.00 5.00 7.93 7.81 7.81 10.00 10.5 15.85 15.62 15.62 47.09 330.75 50.00 57.34 5.73 14.34 8.60 86.01 48 331 50 87 516
24-inch; 25-30 ft VCP 30.50 8.00 10.00 5.00 9.41 9.29 9.29 10.00 15.5 18.81 18.58 18.58 55.98 488.25 50.00 57.34 5.73 14.34 8.60 86.01 56 489 50 87 682
27-inch; 0-10 ft VCP 10.50 4.25 6.25 0.00 1.65 1.51 1.51 6.25 0 3.31 3.01 3.01 9.33 0.00 31.25 68.97 6.90 17.24 10.35 103.45 10 0 32 104 146
27-inch; 10-20 ft VCP 20.50 5.25 7.25 0.00 3.99 3.84 3.84 7.25 5.5 7.97 7.68 7.68 23.33 173.25 36.25 68.97 6.90 17.24 10.35 103.45 24 174 37 104 339
27-inch; 20-25 ft VCP 25.50 8.25 10.25 5.00 8.16 8.01 8.01 10.25 10.5 16.32 16.03 16.03 48.38 330.75 51.25 68.97 6.90 17.24 10.35 103.45 49 331 52 104 536
27-inch; 25-30 ft VCP 30.50 8.25 10.25 5.00 9.69 9.54 9.54 10.25 15.5 19.38 19.09 19.09 57.55 488.25 51.25 68.97 6.90 17.24 10.35 103.45 58 489 52 104 703
30-inch; 0-10 ft VCP 10.50 4.50 6.50 0.00 1.75 1.57 1.57 6.50 0 3.50 3.14 3.14 9.77 0.00 32.50 83.66 8.37 20.92 12.55 125.50 10 0 33 126 169
30-inch; 10-20 ft VCP 20.50 5.50 7.50 0.00 4.18 3.99 3.99 7.50 5.5 8.35 7.99 7.99 24.33 173.25 37.50 83.66 8.37 20.92 12.55 125.50 25 174 38 126 363
30-inch; 20-25 ft VCP 25.50 8.50 10.50 5.00 8.40 8.22 8.22 10.50 10.5 16.80 16.43 16.43 49.66 330.75 52.50 83.66 8.37 20.92 12.55 125.50 50 331 53 126 560
30-inch; 25-30 ft VCP 30.50 8.50 10.50 5.00 9.97 9.79 9.79 10.50 15.5 19.94 19.58 19.58 59.11 488.25 52.50 83.66 8.37 20.92 12.55 125.50 60 489 53 126 728
33-inch; 0-10 ft VCP 10.50 4.75 6.75 0.00 1.85 1.63 1.63 6.75 0 3.69 3.25 3.25 10.20 0.00 33.75 100.83 10.08 25.21 15.12 151.24 11 0 34 152 197
33-inch; 10-20 ft VCP 20.50 5.75 7.75 0.00 4.37 4.15 4.15 7.75 5.5 8.73 8.29 8.29 25.31 173.25 38.75 100.83 10.08 25.21 15.12 151.24 26 174 39 152 391
33-inch; 20-25 ft VCP 25.50 8.75 10.75 5.00 8.63 8.41 8.41 10.75 10.5 17.27 16.83 16.83 50.93 330.75 53.75 100.83 10.08 25.21 15.12 151.24 51 331 54 152 588
33-inch; 25-30 ft VCP 30.50 8.75 10.75 5.00 10.25 10.03 10.03 10.75 15.5 20.51 20.07 20.07 60.65 488.25 53.75 100.83 10.08 25.21 15.12 151.24 61 489 54 152 756
36-inch; 0-10 ft RCP II 10.50 5.00 7.00 0.00 1.94 1.68 1.68 7.00 0 3.89 3.37 3.37 10.62 0.00 35.00 273.00 27.30 68.25 40.95 409.50 11 0 35 410 456
36-inch; 10-20 ft RCP III 20.50 6.00 8.00 0.00 4.56 4.29 4.29 8.00 5.5 9.11 8.59 8.59 26.29 173.25 40.00 273.00 27.30 68.25 40.95 409.50 27 174 40 410 651
36-inch; 20-25 ft RCP IV 25.50 9.00 11.00 5.00 8.87 8.61 8.61 11.00 10.5 17.74 17.22 17.22 52.18 330.75 55.00 283.00 28.30 70.75 42.45 424.50 53 331 55 425 864
36-inch; 25-30 ft RCP IV 30.50 9.00 11.00 5.00 10.54 10.28 10.28 11.00 15.5 21.07 20.55 20.55 62.18 488.25 55.00 283.00 28.30 70.75 42.45 424.50 63 489 55 425 1,032
42-inch; 0-10 ft RCP II 10.50 5.50 7.50 0.00 2.14 1.78 1.78 7.50 0 4.28 3.57 3.57 11.41 0.00 37.50 294.00 29.40 73.50 44.10 441.00 12 0 38 441 491
42-inch; 10-20 ft RCP III 20.50 6.50 8.50 0.00 4.94 4.58 4.58 8.50 5.5 9.87 9.16 9.16 28.19 173.25 42.50 294.00 29.40 73.50 44.10 441.00 29 174 43 441 687
42-inch; 20-25 ft RCP IV 25.50 9.50 11.50 5.00 9.34 8.99 8.99 11.50 10.5 18.69 17.97 17.97 54.63 330.75 57.50 294.00 29.40 73.50 44.10 441.00 55 331 58 441 885
42-inch; 25-30 ft RCP IV 30.50 9.50 11.50 5.00 11.10 10.75 10.75 11.50 15.5 22.20 21.49 21.49 65.19 488.25 57.50 294.00 29.40 73.50 44.10 441.00 66 489 58 441 1,054
48-inch; 0-10 ft RCP II 10.50 6.00 8.00 0.00 2.33 1.87 1.87 8.00 0 4.67 3.74 3.74 12.14 0.00 40.00 299.00 29.90 74.75 44.85 448.50 13 0 40 449 502
48-inch; 10-20 ft RCP III 20.50 7.00 9.00 0.00 5.31 4.85 4.85 9.00 5.5 10.63 9.70 9.70 30.03 173.25 45.00 299.00 29.90 74.75 44.85 448.50 31 174 45 449 699
48-inch; 20-25 ft RCP IV 25.50 10.00 12.00 5.00 9.81 9.35 9.35 12.00 10.5 19.63 18.70 18.70 57.03 330.75 60.00 299.00 29.90 74.75 44.85 448.50 58 331 60 449 898
48-inch; 25-30 ft RCP IV 30.50 10.00 12.00 5.00 11.67 11.20 11.20 12.00 15.5 23.33 22.40 22.40 68.14 488.25 60.00 299.00 29.90 74.75 44.85 448.50 69 489 60 449 1,067
54-inch; 0-10 ft RCP II 10.50 6.50 8.50 0.00 2.53 1.94 1.94 8.50 0 5.06 3.88 3.88 12.81 0.00 42.50 315.00 31.50 78.75 47.25 472.50 13 0 43 473 529
54-inch; 10-20 ft RCP III 20.50 7.50 9.50 0.00 5.69 5.11 5.11 9.50 5.5 11.39 10.21 10.21 31.81 173.25 47.50 315.00 31.50 78.75 47.25 472.50 32 174 48 473 727
54-inch; 20-25 ft RCP IV 25.50 10.50 12.50 5.00 10.29 9.70 9.70 12.50 10.5 20.57 19.40 19.40 59.37 330.75 62.50 315.00 31.50 78.75 47.25 472.50 60 331 63 473 927
54-inch; 25-30 ft RCP IV 30.50 10.50 12.50 5.00 12.23 11.64 11.64 12.50 15.5 24.46 23.28 23.28 71.03 488.25 62.50 315.00 31.50 78.75 47.25 472.50 72 489 63 473 1,097
60-inch; 0-10 ft RCP II 10.50 7.00 9.00 0.00 2.72 2.00 2.00 9.00 0 5.44 3.99 3.99 13.42 0.00 45.00 335.00 33.50 83.75 50.25 502.50 14 0 45 503 562
60-inch; 10-20 ft RCP III 20.50 8.00 10.00 0.00 6.07 5.35 5.35 10.00 5.5 12.15 10.69 10.69 33.54 173.25 50.00 341.00 34.10 85.25 51.15 511.50 34 174 50 512 770
60-inch; 20-25 ft RCP IV 25.50 11.00 13.00 5.00 10.76 10.03 10.03 13.00 10.5 21.52 20.06 20.06 61.65 330.75 65.00 362.00 36.20 90.50 54.30 543.00 62 331 65 543 1,001
60-inch; 25-30 ft RCP IV 30.50 11.00 13.00 5.00 12.80 12.07 12.07 13.00 15.5 25.59 24.14 24.14 73.87 488.25 65.00 362.00 36.20 90.50 54.30 543.00 74 489 65 543 1,171
APPENDIX G
TOTAL (rounded)Piping and Installation Cost
DEVELOPMENT OF UNIT PIPE INSTALLATION COSTS
WASTEWATER COLLECTION SYSTEM 2012 MASTER PLAN UPDATE
CITY OF MANTECA
25% Install.
($/lf)
15%
Contractor
OH&P
($/lf)
PIPING AND
INSTALLATION
SUBTOTAL
($/lf)
Excavation Quantities (per unit length) Earthwork, Dewatering and Pavement Cost
Backfill
(cy)
Compaction
(cy)
Pavement
Removal &
Replacement
(sf)
Earthwork
10% Taxes
($/lf)
Description
(Diameter
and Depth)
Total Cost
($/lf)
Piping and
Installation
($/lf)
Pavement
Removal &
Replacement
($/lf)
Dewatering
($/lf)
Earthwork
($/lf)
Pavement
Removal &
Replacement
($/lf)
Dewatering
($/lf)
Depth for which
Surface Width
Applies (ft)
Surface
Width
(ft)
Trench
Width
(ft)
Assumed
Trench Depth
(ft)
Material
Pipe Base
Cost
($/lf)
Water
Depth
(vlf)
Excavation
(cy)
N:\MTB015906\Excel\2010 Update\Final_2012\AppG_Unit Pipe Costs.xlsx Appendix G-1

APPENDIX H
PUMP AND LIFT STATION CONSTRUCTION COST ESTIMATES

Mobilization and Demobilization LS 1 $80,000 $80,000
Subtotal-Mobilization $80,000
Grading, Excavation and Site Preparation
Subtotal-Grading, Site Preparation $100,000
Construct Wet Well
Excavation CY 290 $35 $10,141
Backfill CY 17 $30 $513
Wet well foundation and cover CY 13 $785 $10,236
Wet well (84" RCP) LF 34 $795 $27,030
Wet well access hatch EA 2 $4,405 $8,810
Waterproofing/Lining LS 1 $52,500 $52,500
Subtotal - Wet Well $109,231
Furnish and Install Pumps and Motors
Pump EA 2 $31,500 $63,000
Subtotal - Pumps $63,000
Site Electrical, Control Systems, and Lighting LS 1 $195,000 $195,000
Subtotal - Site Electrical and Controls $195,000
Install Site Piping and Appurtenances
Force main LF 100 $105 $10,500
Sewer (24" @ 20-30' depth) LF 25 $875 $21,875
10" Check valves EA 2 $3,700 $7,400
10" Gate valve EA 4 $2,600 $10,400
10" Magnetic flowmeter EA 1 $7,900 $7,900
4" Check valve EA 1 $525 $525
4" Drain pipe (PVC) LF 100 $50 $5,000
2" Foul air pipe (DIP) LF 10 $35 $350
4" Foul air pipe (DIP) LF 50 $50 $2,500
1" Drain pipe (PVC) LF 10 $50 $500
Pipe fittings and supports LS 1 $10,500 $10,500
2" Comb air valve EA 1 $2,900 $2,900
Vault ladders LF 24 $155 $3,720
Miscellaneous pipe fittings LS 1 $21,000 $21,000
Subtotal - Site Piping $105,070
Install Manholes and Ancillary Facilities
Manhole (48") EA 1 $5,700 $5,700
Traffic bollards EA 6 $420 $2,520
Concrete pads CY 17 $525 $9,042
Valve vault and 8' x 8' hatch EA 1 $36,400 $36,400
Flowmeter vault and 4' 6"x 6' hatch EA 1 $15,750 $15,750
Bypass vault and 4' 6" x 6' hatch EA 1 $15,750 $15,750
Subtotal - Manholes and Ancillary Facilities $85,162
Aggregate Base (Class 2) CY 150 $20 $3,000
Asphalt Concrete Paving TON 62 $95 $5,890
Gates and Fencing
Fencing LF 250 $35 $8,750
20-foot rolling gate EA 1 $4,200 $4,200
Subtotal - Gates and Fencing $52 $12,950
All Sheeting, Shoring and Bracing
Pump Station SF 748 $30 $22,431
Subtotal - Sheeting and Shoring $22,431
TOTAL (rounded) $780,000
APPENDIX H
WASTEWATER COLLECTION SYSTEM MASTER PLAN UPDATE
1.5 MGD PUMP STATION COST ESTIMATE
CITY OF MANTECA
ITEM UNITESTIMATED
QUANTITY
UNIT
PRICE
($)
ITEM
TOTAL
(rounded)
($)
N:\MTB015906\Excel\2010 Update\Final_2012\AppH_Pump Station Costs.xlsx Appendix H-1

Mobilization and Demobilization LS 1 $115,000 $115,000
Subtotal-Mobilization $115,000
Grading, Excavation and Site Preparation
Subtotal-Grading, Site Preparation $100,000
Construct Wet Well
Excavation CY 415 $35 $14,508
Backfill CY 26 $30 $780
Wet well foundation and cover CY 31 $785 $24,715
Wet well CY 103 $785 $80,593
Wet well access hatch EA 3 $4,405 $13,215
Waterproofing/Lining LS 1 $52,500 $52,500
Subtotal - Wet Well $186,312
Furnish and Install Pumps and Motors
Pump EA 3 $42,000 $126,000
Subtotal - Pumps $126,000
Site Electrical, Control Systems, and Lighting LS 1 $286,538 $286,538
Subtotal - Site Electrical and Controls $286,538
Install Site Piping and Appurtenances
Force main LF 100 $105 $10,500
Sewer (24" @ 20-30' depth) LF 25 $875 $21,875
10" Check valves EA 2 $3,700 $7,400
10" Gate valve EA 4 $2,600 $10,400
12" Magnetic flowmeter EA 1 $10,500 $10,500
4" Check valve EA 1 $525 $525
4" Drain pipe (PVC) LF 100 $50 $5,000
2" Foul air pipe (DIP) LF 10 $35 $350
4" Foul air pipe (DIP) LF 50 $50 $2,500
1" Drain pipe (PVC) LF 10 $50 $500
Pipe fittings and supports LS 1 $10,500 $10,500
2" Comb air valve EA 1 $2,900 $2,900
Vault ladders LF 24 $155 $3,720
Miscellaneous pipe fittings LS 1 $21,000 $21,000
Subtotal - Site Piping $107,670
Install Manholes and Ancillary Facilities
Manhole (48") EA 1 $5,700 $5,700
Traffic bollards EA 6 $420 $2,520
Concrete pads CY 34 $525 $17,967
Biofilter EA 1 $26,200 $26,200
Valve vault and 8' x 8' hatch EA 1 $36,400 $36,400
Flowmeter vault and 4' 6"x 6' hatch EA 1 $15,700 $15,700
Bypass vault and 4' 6" x 6' hatch EA 1 $15,700 $15,700
Subtotal - Manholes and Ancillary Facilities $120,187
Aggregate Base (Class 2) CY 135 $20 $2,700
Asphalt Concrete Paving TON 68 $95 $6,460
Gates and Fencing
Fencing LF 270 $35 $9,450
20-foot rolling gate EA 1 $4,200 $4,200
Subtotal - Gates and Fencing $51 $13,650
All Sheeting, Shoring and Bracing
Pump Station SF 2,728 $30 $81,840
Subtotal - Sheeting and Shoring $81,840
TOTAL (rounded) $1,145,000
CITY OF MANTECA
WASTEWATER COLLECTION SYSTEM MASTER PLAN UPDATE
2.0-4.0 MGD PUMP STATION COST ESTIMATE
APPENDIX H
ITEM UNITESTIMATED
QUANTITY
UNIT
PRICE
($)
ITEM
TOTAL
(rounded)
($)
N:\MTB015906\Excel\2010 Update\Final_2012\AppH_Pump Station Costs.xlsx Appendix H-2
Recommended