Application FilingsApplication Filingsandand
Examiner Production Examiner Production
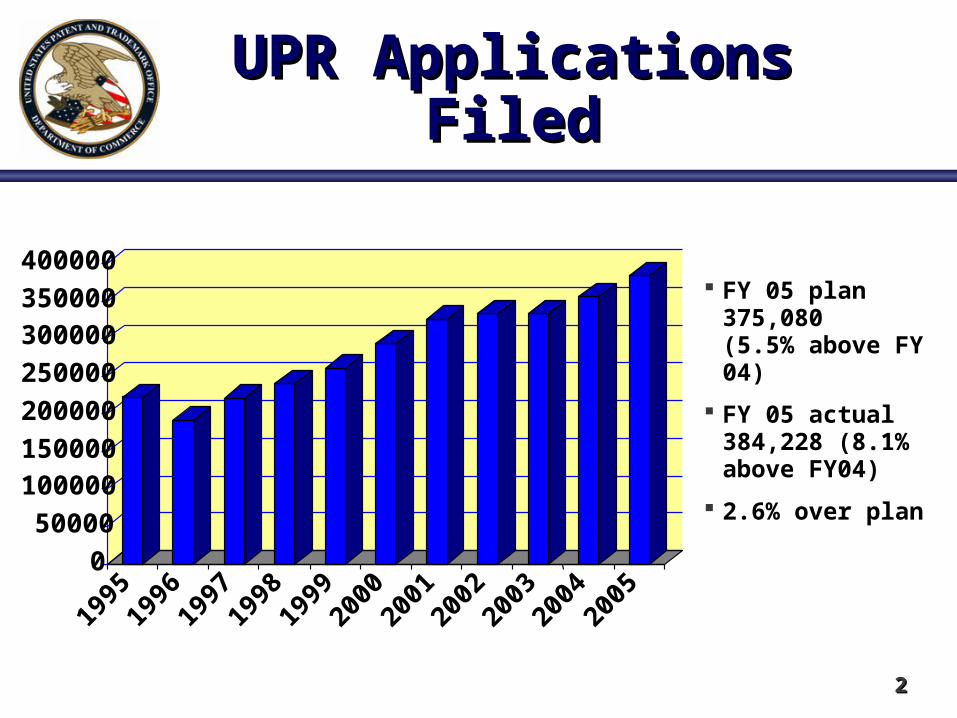
UPR Applications FiledUPR Applications Filed
0
50000
100000150000
200000
250000
300000350000
400000
1995
1996
1997
1998
1999
2000
2001
2002
2003
2004
2005
FY 05 plan 375,080 (5.5% above FY 04)
FY 05 actual 384,228 (8.1% above FY04)
2.6% over plan
22
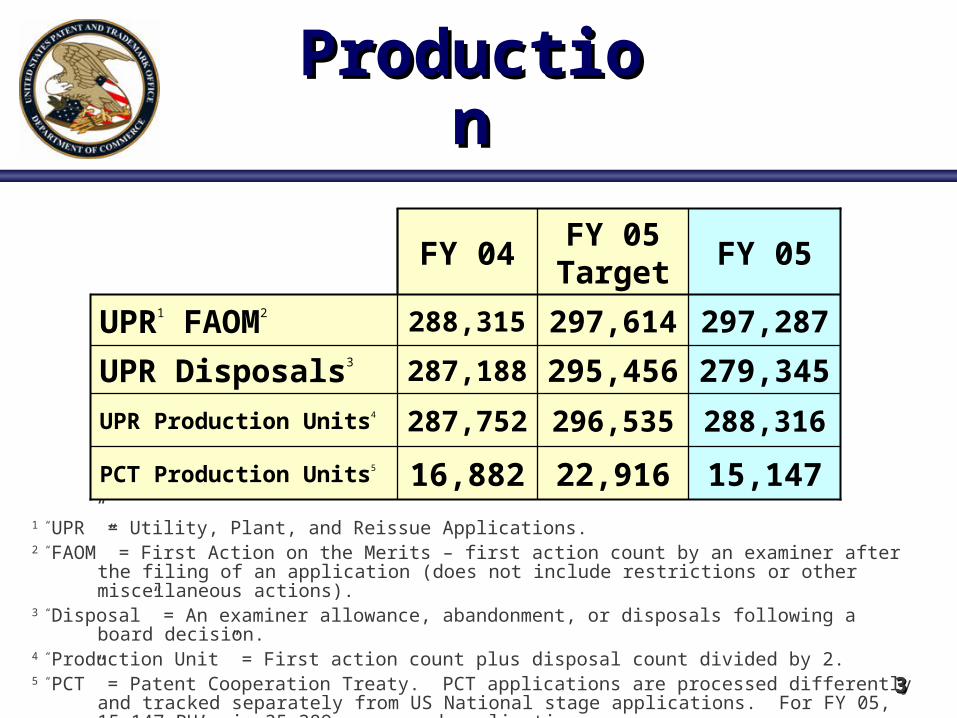
ProductionProduction
1 “UPR” = Utility, Plant, and Reissue Applications.2 “FAOM” = First Action on the Merits – first action count by an examiner after the filing of an application (does not include
restrictions or other miscellaneous actions).3 “Disposal” = An examiner allowance, abandonment, or disposals following a board decision.4 “Production Unit” = First action count plus disposal count divided by 2.5 “PCT” = Patent Cooperation Treaty. PCT applications are processed differently and tracked separately from US National stage
applications. For FY 05, 15,147 PU’s is 35,389 processed applications.
22,916
296,535
295,456
297,614
FY 05 Target
288,316287,752UPR Production Units4
15,147
279,345
297,287
FY 05
16,882PCT Production Units5
FY 04
288,315UPR1 FAOM2
287,188UPR Disposals3
33

. . . vs the Backlog . . . vs the Backlog
PENDENCYPENDENCY
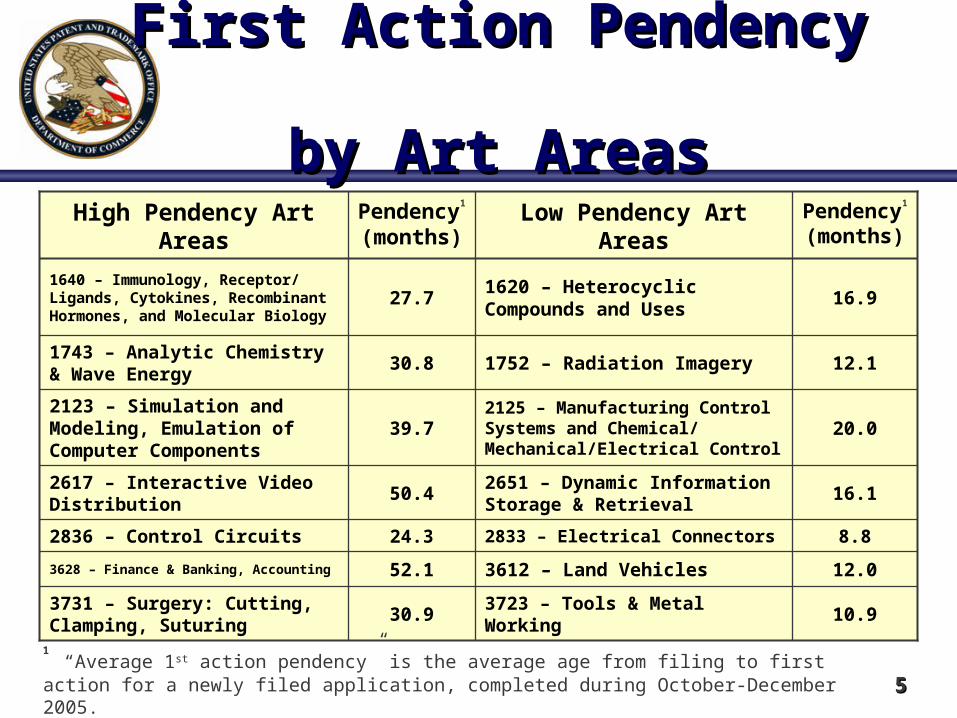
First Action Pendency First Action Pendency by Art Areasby Art Areas
30.9
52.1
24.3
50.4
39.7
30.8
27.7
Pendency1
(months)
3723 – Tools & Metal Working
3612 – Land Vehicles
2833 – Electrical Connectors
2651 – Dynamic Information Storage & Retrieval
2125 – Manufacturing Control Systems and Chemical/ Mechanical/Electrical Control
1752 – Radiation Imagery
1620 – Heterocyclic Compounds and Uses
Low Pendency Art Areas
10.9
12.0
8.8
16.1
20.0
12.1
16.9
Pendency1
(months)
3731 – Surgery: Cutting, Clamping, Suturing
3628 – Finance & Banking, Accounting
2836 – Control Circuits
2617 – Interactive Video Distribution
2123 – Simulation and Modeling, Emulation of Computer Components
1743 – Analytic Chemistry & Wave Energy
1640 – Immunology, Receptor/ Ligands, Cytokines, Recombinant Hormones, and Molecular Biology
High Pendency Art Areas
1 “Average 1st action pendency” is the average age from filing to first action for a newly filed application, completed during
October-December 2005. 55

Inventory by Art ExamplesInventory by Art Examples
38-47
25-130
22
111
46
34
38-51
Months of Inventory*
3742 – Thermal and Combustion Technology
3651 – Conveying
2831 – Electrical Conductors
2651, 2653 – Information Storage and Retrieval
2125 – Manufacturing Control Systems and Chemical/ Mechanical/Electrical Control
1734 – Adhesive Bonding and Coating Apparatus
1620 – Organic Chemistry
Low Inventory Art Areas
8
12
8
12
10
10
15
Months of Inventory*
3731 and 3737 – Medical Instruments, Diagnostic Equipment
3620 – Business Methods
2836 – Control Circuits
2611 – Interactive Video Distribution
2127 – Computer Task Management
1753 – Radiation Imagery
1614, 1615, and 1617 – Drugs, Bio-affecting and Body Treatment
High Inventory Art Areas
*The number of months it would take to reach a first action on the merits (e.g., an action addressing patentability issues) on a new application filed in July 2005 at today’s production rate. Today’s production rate means that there are no changes in production due to hiring, attrition, changes to examination processing or examination efficiencies, and that applications are taken up in the order of filing in the given art unit/area. Of course, USPTO is taking aggressive steps to ensure changes that will significantly lower the inventory rates in high-inventory art areas.
66
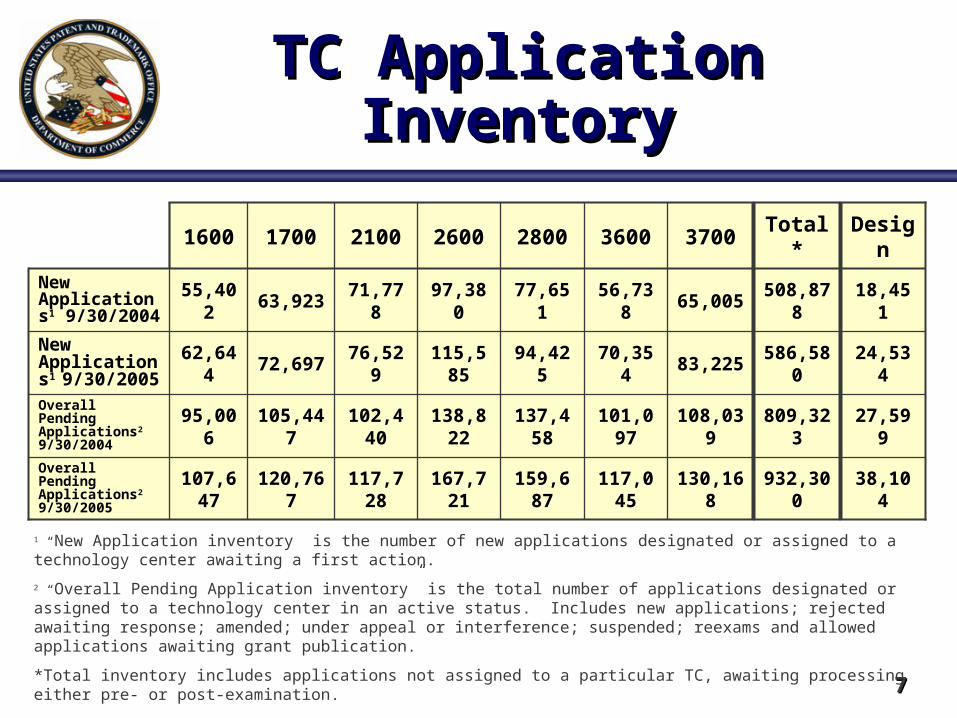
TC Application InventoryTC Application Inventory
1 “New Application inventory” is the number of new applications designated or assigned to a technology center awaiting a first action.
2 “Overall Pending Application inventory” is the total number of applications designated or assigned to a technology center in an active status. Includes new applications; rejected awaiting response; amended; under appeal or interference; suspended; reexams and allowed applications awaiting grant publication.
*Total inventory includes applications not assigned to a particular TC, awaiting processing either pre- or post-examination.
27,599809,323108,039101,097137,458138,822102,440105,44795,006Overall Pending Applications2
9/30/2004
18,451508,87865,00556,73877,65197,38071,77863,92355,402New Applications1 9/30/2004
38,104932,300130,168117,045159,687167,721117,728120,767107,647Overall Pending Applications2
9/30/2005
24,534586,58083,22570,35494,425115,58576,52972,69762,644New Applications1
9/30/2005
3700 Total* Design360028002600210017001600
77

Patent QualityPatent Quality(Shared Responsibility)(Shared Responsibility)

Quality of Products – FY 05Quality of Products – FY 05
*Compliance and error rates as measured by OPQA. *Compliance and error rates as measured by OPQA. 1Compliance is the percent of office actions reviewed and found to be free of any in-process examination deficiency (an error that has significant adverse impact on patent prosecution).
2Patent allowance error rate is the percent of allowed applications reviewed having at least one claim which is considered unpatentable on a basis for which a court would hold a patent invalid. “Allowance” occurs before a patent is issued, so these errors are caught before any patent is actually granted.
5.32%
82.0%
FY 04
Fiscal Year 2005
4.55%
86.2%
FY 05
4.0%
84.0%
FY 05 Target
1.6%6.43%4.94%4.43%2.25%3.56%6.46%4.88%Patent
Allowance Error Rate2*
94.3%86.6%84.4%90.9%84.7%88.1%82.9%81.7%
Patent In-Process
Examination Compliance
Rate1*
3700 Design2600 2800 3600210017001600
99

Re-WorkRe-Work

Technology Centers Technology Centers Rework* StatisticsRework* Statistics
* Rework first actions are those actions that are in a Continuing (CONs and CIPs), RCE, CPA or 129(a) applications (excludes Divisionals).
FY 2002 FY 2003 FY 2004 FY 2005TC
Summary% FAOM Rework
% FAOM Rework
% FAOM Rework
% FAOM Rework
1600 36.4% 39.7% 40.3% 42.4%1700 25.2% 26.9% 27.1% 28.0%2100 23.9% 24.0% 24.6% 28.2%2600 24.8% 24.2% 24.3% 25.4%2800 19.1% 22.0% 24.9% 24.1%3600 17.7% 21.2% 23.2% 28.5%3700 22.2% 25.1% 24.0% 28.1%
UPR 23.2% 25.3% 26.1% 28.3%
1111

Hiring and RetentionHiring and Retention

Hires and AttritionsHires and Attritions
1600 1700 2100 2600 2800 3600 3700 Corps Design
FY 04 Hires 75 35 115 116 31 26 45 443 15
FY 04 Attritions 30 26 58 82 58 43 39 336 4
FY 05 BOY Examiner Staff
417 440 563 658 742 422 439 3681 72
FY 05 Hiring 101 58 225 169 184 91 131 959 19
FY 05 Attrits 42 39 93 92 54 55 50 425 10
FY 06 Hiring Goal 75 35 256 256 178 100 100 1000 20
FY 06 hires (1/25/06) 30 19 75 62 40 22 21 269 0
FY05 Hires as a Percent of Examiner Staffing in the TC
24% 13% 40% 26% 25% 22% 30% 26% 26%
1313

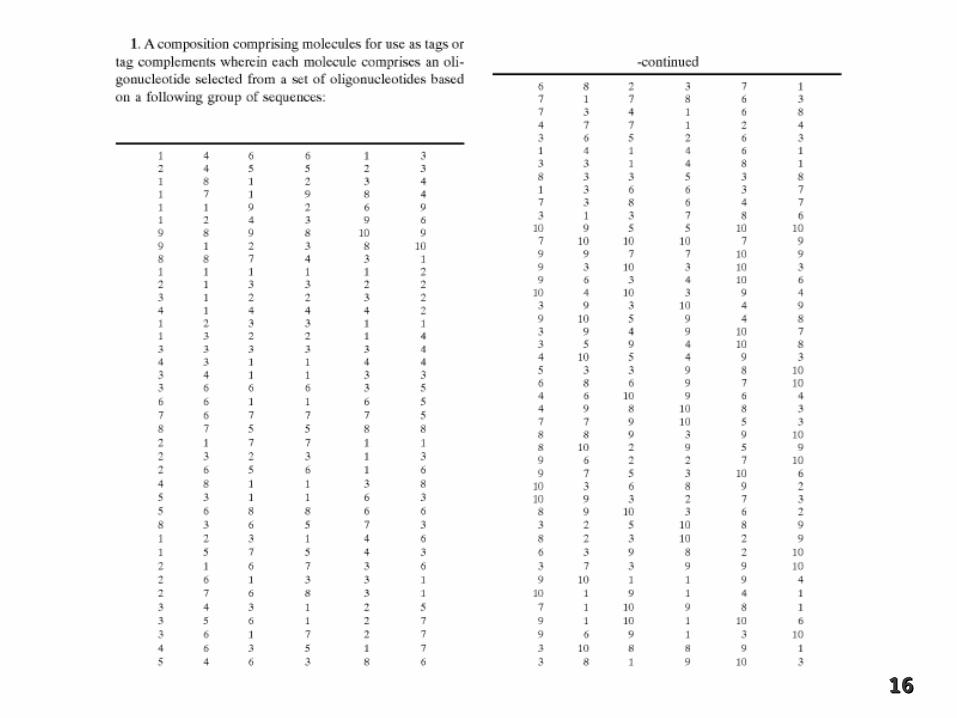
Markush PracticeMarkush Practice

1.1. A cell adhesion protein of formula (1), A cell adhesion protein of formula (1),
A-(B)-(C)-(D)A-(B)-(C)-(D)nn-E-E
or a pharmaceutically acceptable or a pharmaceutically acceptable derivative thereof , wherein . . .derivative thereof , wherein . . .
Markush PracticeMarkush Practice
1515
1616
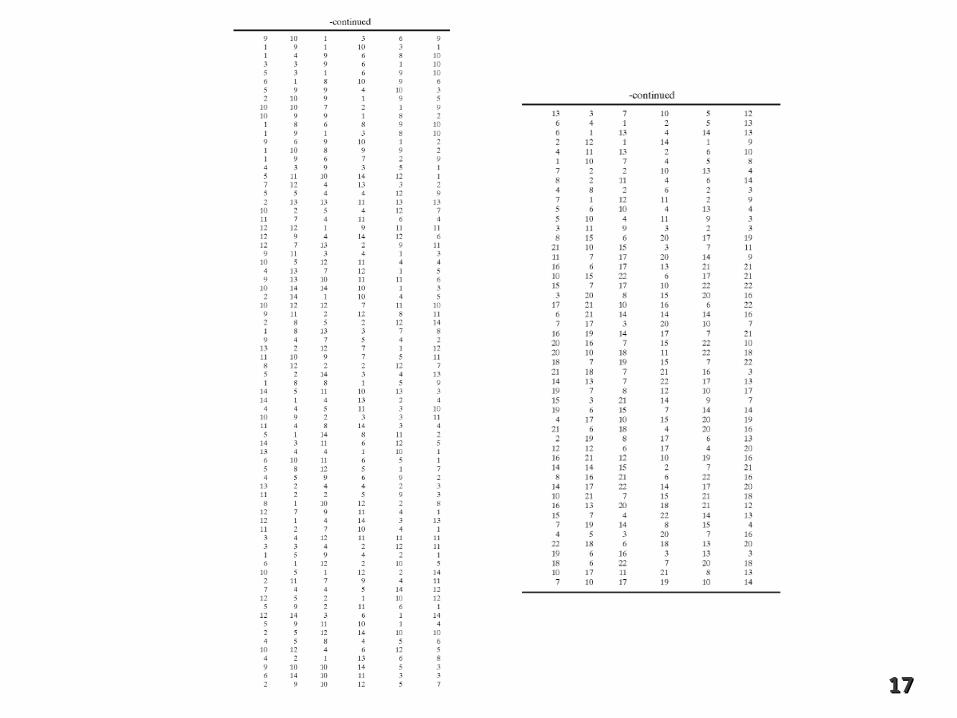
1717

1818
1919
2020

ProductionProduction
We Can Not Hire Our Way Out !!!We Can Not Hire Our Way Out !!!
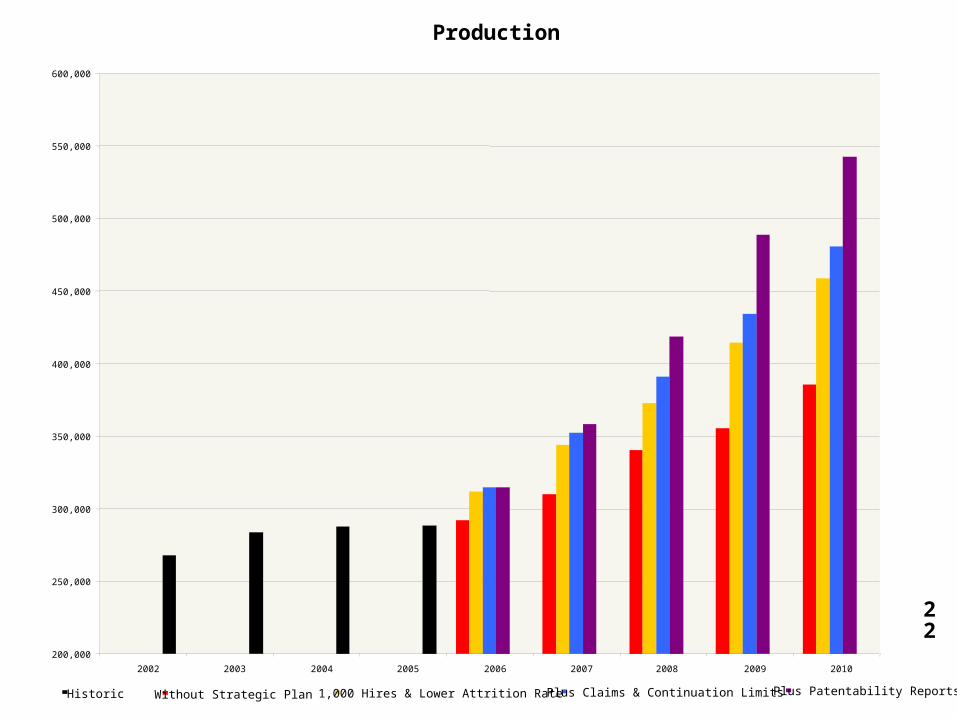
200,000
250,000
300,000
350,000
400,000
450,000
500,000
550,000
600,000
2002 2003 2004 2005 2006 2007 2008 2009 2010
Without Strategic Plan 1,000 Hires & Lower Attrition Rate Plus Claims & Continuation Limits Plus Patentability ReportsHistoric
Production
22

Contact InformationContact Information
John Doll
Commissioner for Patents
e-mail: [email protected]
Phone: 571 272 8250
2323
John Doll – Commissioner for PatentsJohn Doll – Commissioner for Patents
February 1, 2006February 1, 2006

Pendency ProjectionsPendency Projections
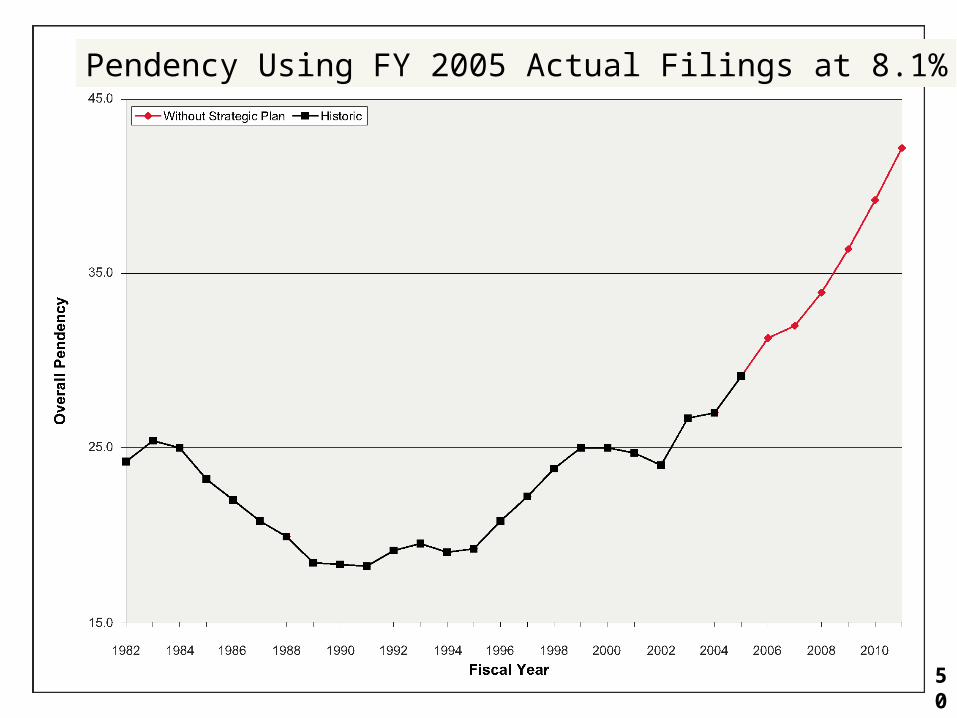
Pendency Using FY 2005 Actual Filings at 8.1%
50
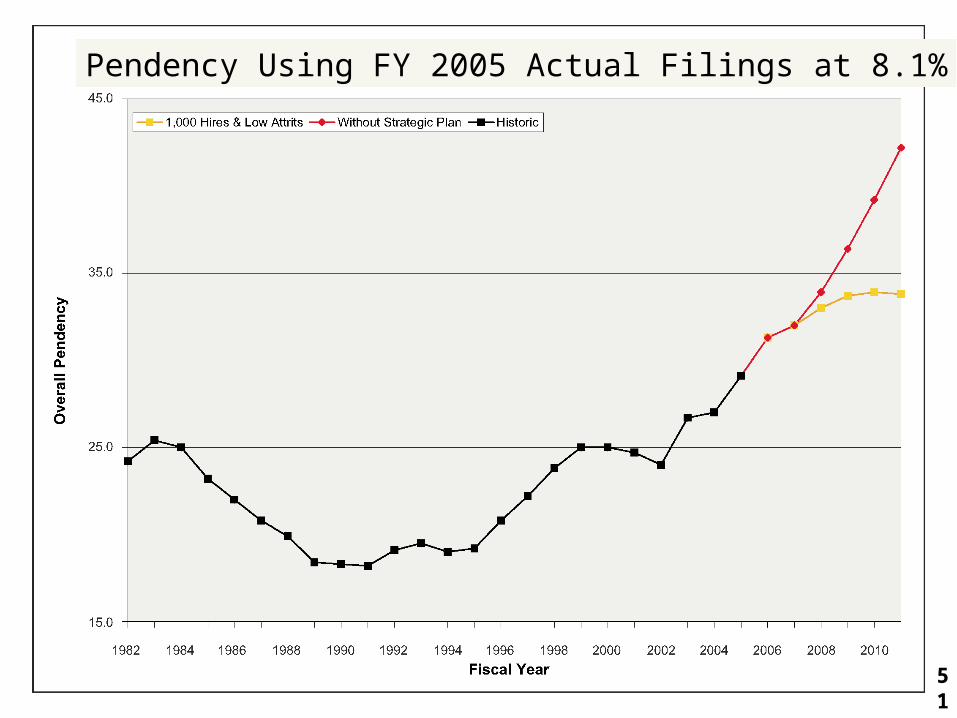
Pendency Using FY 2005 Actual Filings at 8.1%
51
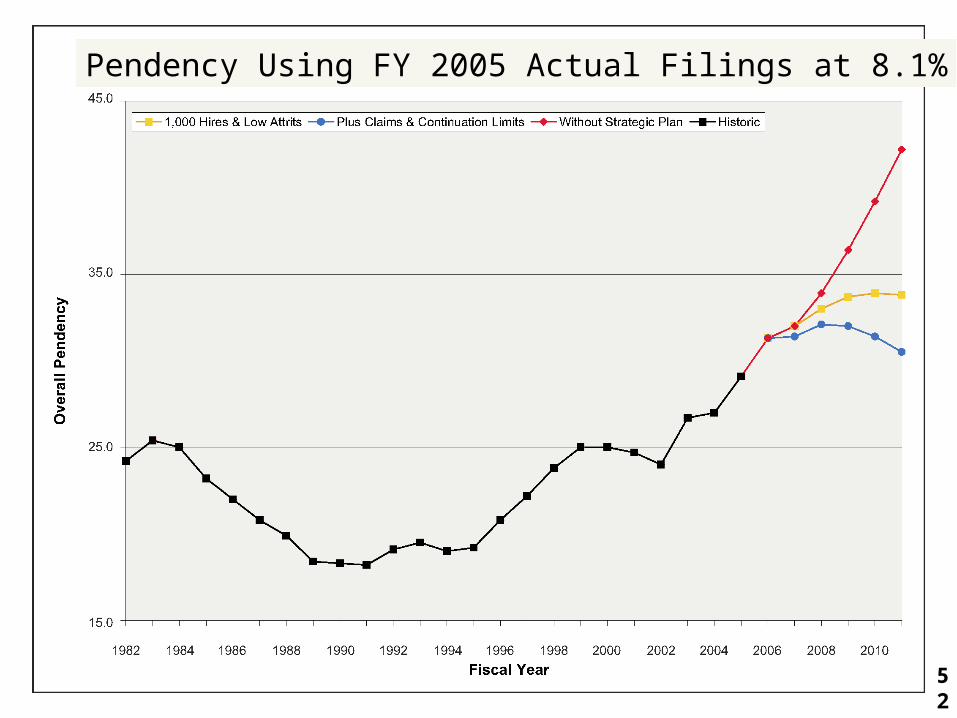
Pendency Using FY 2005 Actual Filings at 8.1%
52
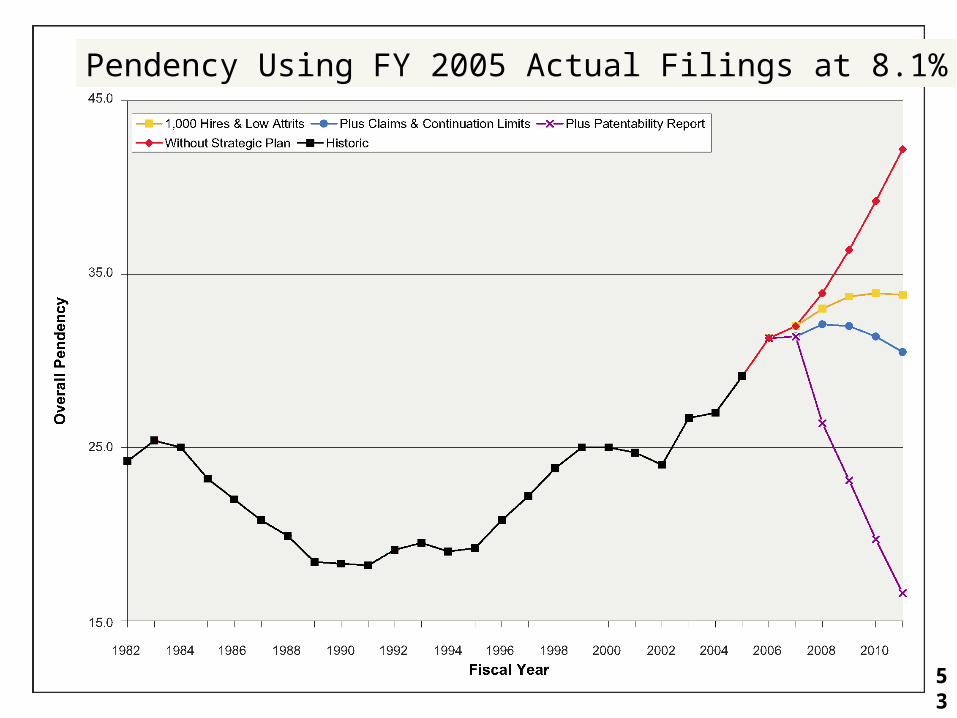
Pendency Using FY 2005 Actual Filings at 8.1%
53

Pendency Using FY 2005 Actual Filings at 8.1%
54

Stats and StuffStats and Stuff
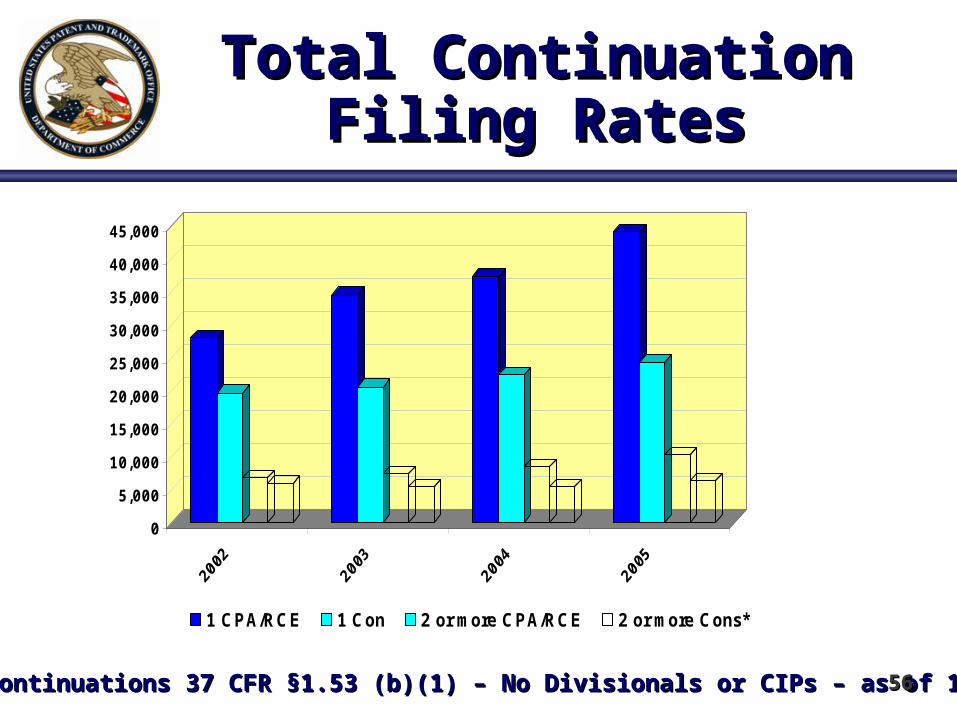
Total Continuation Filing RatesTotal Continuation Filing Rates
*Straight Continuations 37 CFR *Straight Continuations 37 CFR §§1.53 (b)(1) – No Divisionals or CIPs – as of 1/17/061.53 (b)(1) – No Divisionals or CIPs – as of 1/17/06
0
5,000
10,000
15,000
20,000
25,000
30,000
35,000
40,000
45,000
1 CPA/RCE 1 Con 2 or more CPA/RCE 2 or more Cons*
5656
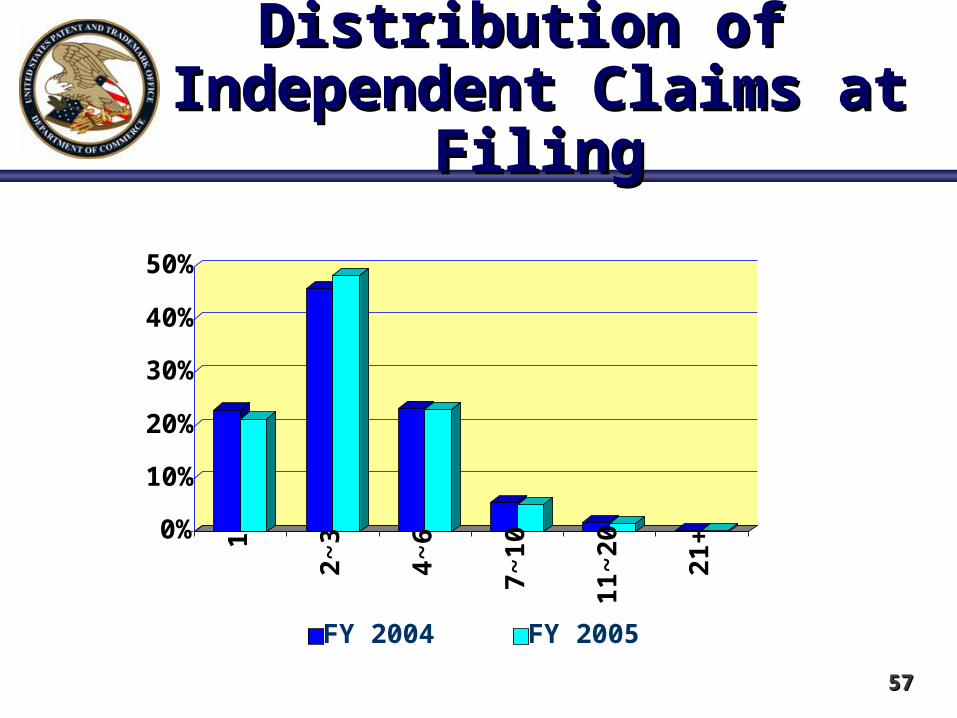
Distribution of Distribution of Independent Claims at FilingIndependent Claims at Filing
0%
10%
20%
30%
40%
50%1
2~3
4~6
7~10
11~2
0
21+
FY 2004 FY 2005
5757

Distribution of Distribution of Total Claims at FilingTotal Claims at Filing
0%
10%
20%
30%
40%1~
10
11~2
0
21~2
5
26~3
0
31~4
0
41~5
0
51~6
0
61~1
00
101+
FY 2004 FY 20055858

Total Claims at Filing and IssueTotal Claims at Filing and Issue
FY 1990 FY 1999 FY 20050
3,000,000
6,000,000
9,000,000
0
8
16
24
Claims Filed Claims Issued Average Claims Filed
5959

Distribution of the Number of Distribution of the Number of References Cited in ApplicationsReferences Cited in Applications
0
500
1,000
1,500
2,000
2,500
3,0003,500N
one
1~3
4~5
6~10
11~2
0
21~3
0
31~4
0
>40
Sampling done April-June 2005Sampling done April-June 2005
6060
Recommended
![[XLS]belshina.rubelshina.ru/price/price.xlsx · Web view26 190000. 2 1275000. 4 625000. 8 550000. 4. 14. 4 350000. 1 390000. 8 225000. 3 195000. 3. 3 155000. 8 150000. 4 80000. 6](https://img.pdfslide.net/doc/110x75/5b190c2d7f8b9a28258c4f70/xls-web-view26-190000-2-1275000-4-625000-8-550000-4-14-4-350000-1-390000.jpg)


![Diapositiva 1 · MOULD Reduction (ISO 21527-2:2008) US Wheat GIOTTO US Wheat Scourer EU Wheat EU Wheat GIOTTO Scourer [Units] 250000 200000 150000 100000 50000 CBT Reduction 75% (Neutron](https://img.pdfslide.net/doc/110x75/5f085fc57e708231d421b17f/diapositiva-1-mould-reduction-iso-21527-22008-us-wheat-giotto-us-wheat-scourer.jpg)