enriching the future
Investor Update
April 2015
Ralf ter Haar Chief Financial Officer
Gerard Tyler Group Treasurer
URENCO
Investor Update July 2015

2
These materials have been prepared by URENCO Limited
(“URENCO”). Any person or entity considering making any
investment based upon information contained in these materials
should ensure that they are properly, independently and
professionally advised. These materials were designed for use
by specific persons familiar with the business and affairs of
URENCO and its subsidiaries and should be considered only in
connection with other information, oral or written, provided by
URENCO (or any subsidiary) herewith. These materials are not
intended to provide the sole basis for evaluating, and should not
be considered as a recommendation with respect to, any
transaction or other matter.
The information in these materials, which does not purport to be
comprehensive, has been provided by URENCO and has not
been independently verified. While this information has been
prepared in good faith, no representation or warranty, express or
implied, is or will be made and no responsibility or liability is or
will be accepted by URENCO or any of the URENCO’s
subsidiaries or by any of their respective officers, employees or
agents in relation to the accuracy or completeness of these
materials or any other written or oral information made available
to any interested party or its advisers and any such liability is
expressly disclaimed.
Certain statements contained in these materials, including any
descriptions or statements regarding the possible future results
of operations, any statement preceded by, followed by or which
includes the words “believes”, “expects”, “intends”, “will”, “may”,
“anticipates”, or similar expressions, and other statements that
are not historical facts, are or may constitute “forward looking
statements”. Because such statements are inherently subject to
risks and uncertainties, actual results may differ materially from
those expressed or implied by such forward-looking statements.
Such risks and uncertainties include but are not limited to (a)
risks and uncertainties relating to the nuclear industry, consumer
demand, political and economic conditions and government
regulation and (b) such other risks and uncertainties as are
detailed herein. All written and oral forward-looking statements
attributable to URENCO are expressly qualified in their entirety
by the cautionary statements set forth in this paragraph, and
accordingly any person or entity reviewing these materials
should not rely on such forward-looking statements.
URENCO gives no undertaking to provide recipients of these
materials with access to any additional information or to update
these materials or any additional information, or to correct any
inaccuracies in it which may become apparent.
Disclaimer

3
• URENCO: our business
• Market Update
• 2014 Financial Highlights
• Appendix
Agenda

4
Strategic & Financial Highlights for 2014
Strategic Highlights
• Group enrichment capacity target of 18,000 tSW/a was achieved ahead of schedule
• URENCO has a leading position in the global enrichment market share
• EBITDA of €1,071 million was 10.6% higher than 2013
• Business model underpinned by long term contracts and order book beyond 2025
• Shareholder sale considerations continue
• Proposed bond issue to refinance debt and for corporate purposes

5
Update on Sale Process
• Process is governed by principles of Treaty of Almelo and government non-
proliferation policy
• Government and shareholder discussions continue
6
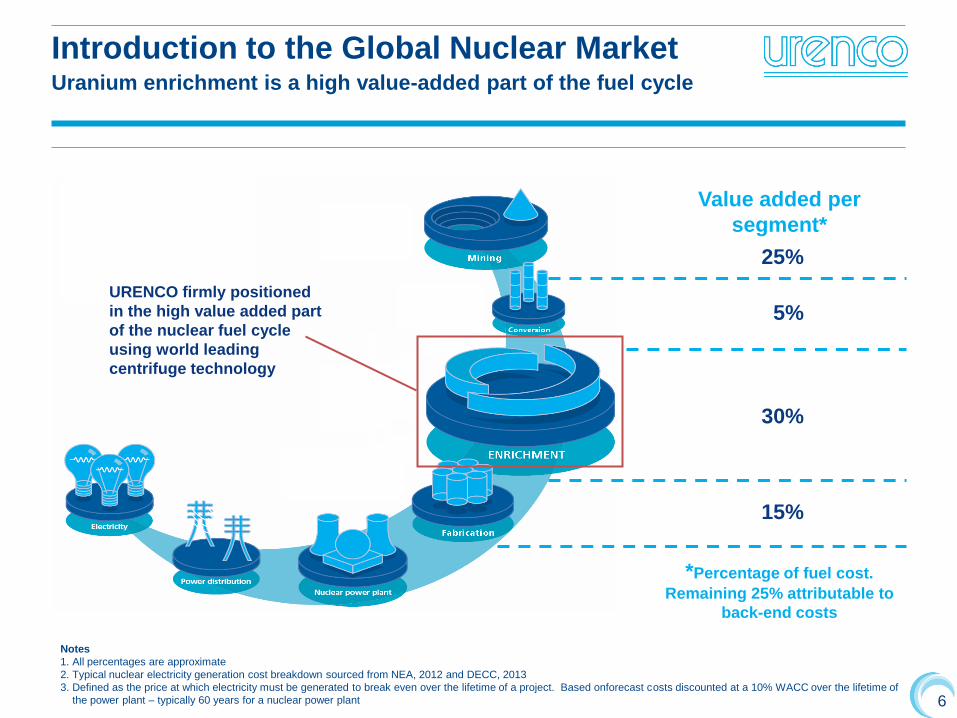
Notes
1. All percentages are approximate
2. Typical nuclear electricity generation cost breakdown sourced from NEA, 2012 and DECC, 2013
3. Defined as the price at which electricity must be generated to break even over the lifetime of a project. Based onforecast costs discounted at a 10% WACC over the lifetime of
the power plant – typically 60 years for a nuclear power plant
25%
Value added per
segment*
5%
30%
15%
URENCO firmly positioned
in the high value added part
of the nuclear fuel cycle
using world leading
centrifuge technology
*Percentage of fuel cost.
Remaining 25% attributable to
back-end costs
Introduction to the Global Nuclear Market Uranium enrichment is a high value-added part of the fuel cycle

7
Enrichment
Heating (UF6
transport
container)
UF6 (Pressure
reduction)
Compressor
Separation (in
centrifuge
cascades)
Compressor
Cooling box
(with transport
container with
enriched UF6)
Cooling box
(with transport
container with
depleted UF6)

8
URENCO USA
Our Global Reach
URENCO Operations and Customers
North America
45%
Rest of World*11%
Europe44%
URENCO UK
Total Revenue (€m) by Region
URENCO Netherlands
URENCO Germany 470 589 719 639 702
441471
658 678729348
242
224 198181
0
500
1,000
1,500
2,000
2010 2011 2012 2013 2014
By Region 2014
* Predominantly Asia

9
Enrichment Market and Technological Leader
URENCO Year End Capacity (tSW/a)
• Target of 18,000 tSW/a was
reached in 2014
• Highly regulated market requiring
technology and capital
• GE Hitachi announced in a July
2014 press release that it is to
delay the commercialisation of
Silex, its laser enrichment
technology solution
Source Urenco
Commentary
8,100
11,000
14,600
18,100
0
2,000
4,000
6,000
8,000
10,000
12,000
14,000
16,000
18,000
20,000
2005 2008 2011 2014
tSW
UD UNL UUK UUSA

10
• URENCO: our business
• Market Update
• 2014 Financial Highlights
• Appendix
Agenda

11
Strategic Review
• Key contributor to safe secure low carbon energy
• Continue to be the supplier of choice within the sector
• Strong global presence
• Focus on excellent customer service, quality and delivery to time
• Order book remains strong
Safety
We operate to the
highest standards of
safety, environmental
and security
requirements
Integrity
We conduct all our
relationships with
honesty, fairness and
respect
Flexibility
We respond to best meet
our customers’ needs by
flexibly deploying our
skills and capabilities
Development
We are committed to the
sustainable development
of our business by
continuously developing
our employees, services
and products
Profitability
We are committed to
making profits to secure
our future and reward
our shareholders and
employees

12
-80 -40 0 40 80 120 160
China
India
Korea
Russia
Middle East
United States
Japan
European Union
GW Additions Retirements Net change
Market Update Nuclear Power Overview
Source World Energy Outlook 2014: Nuclear power capacity additions and retirements by key region in the central scenario, 2014-2040

13
URENCO is a leader in the enrichment market with a unique market position and
commanding market share
• Current market dynamics are challenging but show good long-term promise
– Market has overhang from Japanese shutdown and has sustained pricing pressures
– Enrichment is a key process required for nuclear power operators
– Worldwide growth expected in civil nuclear power
– URENCO has a strong order book of long-term contracts, with higher prices set at
favourable world demand level
• URENCO market position has regulatory and structural protections
– Regulatory and technological barriers to entry limits the number of potential
enrichers
– Many customers tend to spread their business across several enrichment providers
and count URENCO Europe and LES (URENCO USA) as two suppliers
The Enrichment Market

14
• URENCO: our business
• Market Update
• 2014 Financial Highlights
• Appendix
Agenda

15
Financial Highlights for 2014
Financial Highlights
• Revenue of €1,612 million was 6.4% higher than in 2013
• Resulting EBITDA of €1,071 million was 10.6% higher than 2013
• Net income €405 million, 20.2% higher than in 2013 Phase II of capacity expansion
in the USA completed ahead of schedule and on budget
• Good progress achieved on Phase III construction in USA
• All customer deliveries were met on time and to a high standard

16
Cash Flow & Net Debt (€ million)
2,5752,717 2,774
979
146108
527
340
57
Actual 2013Net Debt
Operatingactivities
Incometaxes
Net interest Investingactivities
Dividends Actual 2014Net Debt
before FX
FX Actual 2014Net Debt

17
Capital Expenditure (€ million)
2014 Capital Expenditure
European Enrichment
Sites
16%
USA Enrichment
Site
55%
TMF29%
Total: €537m
• USA – site construction reaching
conclusion
• Tails Management Facility (TMF) under
construction at Capenhurst
• Once projects complete, lower run rate
capital expenditure

18
Debt Structure
0
100
200
300
400
500
600
700
800
2015 2016 2017 2018 2019 2020 2021 2022 2023 2024 2025
€M
illio
ns
onwards
Other 8%
USPP 10%
Bonds 66%
EIB 16%
Fixed 84%
Floating16%
USD 24%
EUR 76%
Debt maturity profile
Fixed: Floating mix Debt Issuer mix Currency mix
Key Credit Ratios:
• Funds Flow from Operations / Total Adjusted Debt (FFO/TAD) 2014: 20.8% 2013: 20.5%
• EBITDA Interest cover (times) 2014: 9.9x 2013: 9.4x

19
Liquidity and Financial Policies
• Liquidity
– €750m committed revolving credit facilities (RCFs) extended and now maturing H1 2017/19,
undrawn
– €175m of new RCF’s entered into during February 2015, maturing 2019/20
– No outstanding commercial paper
– Cash balance €522m at 31 December 2014, deposited with well rated banks
• Maintain strong investment-grade credit rating and healthy capital ratios in order to support long-
term business success
– Moody’s Baa1 (stable)
– S&P BBB+ (stable)
• Committed funding to meet requirements beyond 2015
• Financial Policy
– Dividend payments should not normally exceed earnings and be set lower to protect BBB+ /
Baa1 credit rating and only higher if ratings headroom exists
20
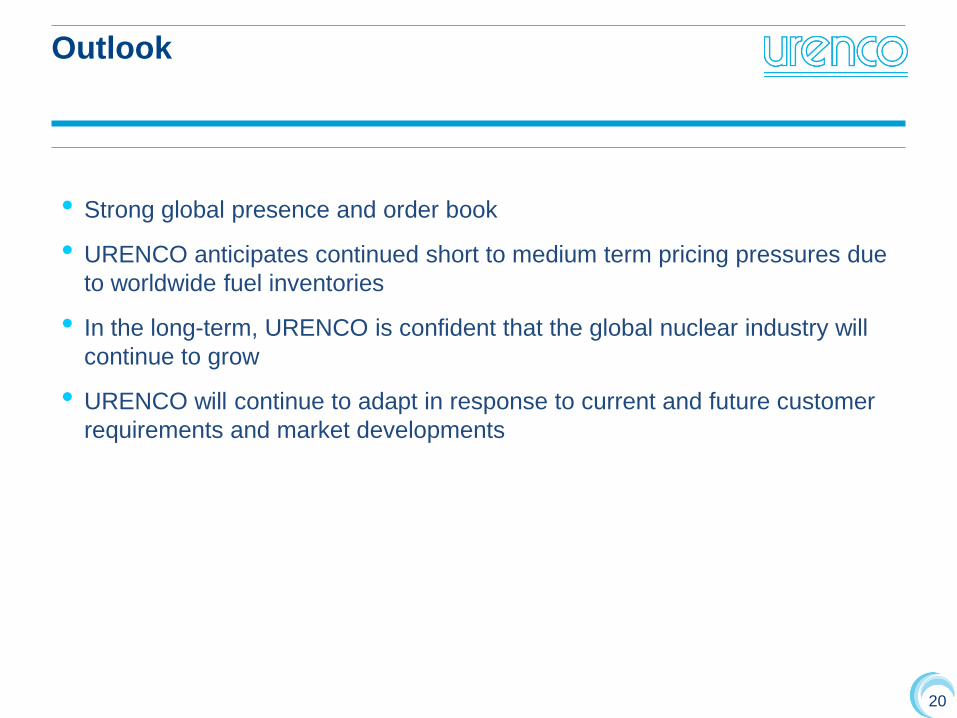
Outlook
• Strong global presence and order book
• URENCO anticipates continued short to medium term pricing pressures due
to worldwide fuel inventories
• In the long-term, URENCO is confident that the global nuclear industry will
continue to grow
• URENCO will continue to adapt in response to current and future customer
requirements and market developments

21
• URENCO: our business
• Market Update
• 2014 Financial Highlights
• Appendix
Agenda

22
Key Historical Financials
All in € MM 2010A 2011A 2012A 2013A 2014A
Revenue Split
Revenue 1,259 1,302 1,601 1,515 1,612
% Growth 12.7% 3.4% 23.0% (5.4%) 6.4%
EBITDA 809 785 1,013 968 1,071
% Margin 64.3% 60.2% 63.3% 63.9% 66.4%
EBIT 591 526 617 558 653
% Margin 46.9% 40.4% 38.5% 36.8% 40.5%
Net Income 387 359 400 337 405
Nuclear Liabilities 512 619 750 861 1,043
Net Financial Debt 2,371 2,604 2,469 2,575 2,774
Cash Generated from
Operations (pre-tax) 858 903 1,185 880 979
Capex (799) (752) (628) (587) (537)
Capacity (tSW/a) 13,000 14,600 16,900 17,600 18,100
Europe44%
US45%
RoW (mainly Asia)11%
Europe42%
US45%
RoW (mainly
Asia)
13%

23
Strong cash flow generation and robust financial profile
• Strong cash flow generation
• High margins supported by low relative cost
• Significant capex requirements in recent
years mainly driven by US capacity
expansion
• Reduced capex as expansion projects
complete by 2015
• After Tails Management Facility (“TMF”) is
completed lower capex requirements
• Potential for significant dividend distribution/
strong deleveraging trajectory
• Nuclear liabilities will require funding in medium
to long-term.
Source URENCO company disclosure and fillings
Capex
EBITDA margin
Cash Generated from Operations
24
Contacts
Gerard Tyler
Group Treasurer
+44 1753 660660
Jayne Hallett
Director of Corporate Communications
+44 1753 660660
URENCO Limited
Sefton Park
Stoke Poges
Bucks SL2 4JS
http://www.urenco.com
Recommended