April 2015 Sustainable Habitat Reducing Energy Consumption through
Evaluation, Efficiency, and Education
A thesis submitted in partial fulfillment of the requirements for the degree of Master of
Science (Natural Resources and Environment) at the University of Michigan
By
Geoffrey Burmeister
Jordan Fischer
Courtney Grosvenor
Travis Hlavaty
Brett Simon
Advisor: Scott Noesen
Client: Habitat for Humanity of Michigan

ii
Abstract Habitat for Humanity of Michigan (HFHM) seeks to improve energy efficiency and promote reduced energy consumption among Habitat homes through improved building science and education. Interviews with 21 HFH affiliates from around Michigan revealed best building and communication practices including installing Energy Star appliances, using LED lighting, and conducting partner family home walkthroughs. A survey of 115 Habitat families revealed attitudes on energy and the environment, experience in their home, and demographic trends. Electricity and natural gas consumption was analyzed for these homes and compared to energy consumption in similar non-Habitat homes from the US Energy Information Agency’s Residential Energy Consumption Survey.
In general, Habitat homeowners correctly assessed the relative energy efficiency of their homes. On average, Habitat homes consumed 25.86% less natural gas and 15.94% less electricity annually compared to demographically similar non-Habitat homes when controlling for home size, number of household members, and climate. Our models indicated significant drivers of household energy use, which led us to identify the following areas for intervention: nighttime thermostat settings, installing smart power strips, quantifying monetary losses associated with the use of secondary freezers and electric space heaters to discourage the purchase of excess appliances, and exploring gift-in-kind partnerships for energy-efficient window air conditioning units. Little relationship was found between attitudinal variables, such as the extent to which self-reported environmental concerns motivate behavior, and energy consumption. Fostering more frequent and extensive communication between HFHM affiliates and partner families is also encouraged based on feedback from both parties.
iii
Acknowledgements
Our team would like to acknowledge the assistance and guidance of individuals without
whom this project would not have succeeded. First, we would like to thank our client
sponsors Thom Phillips, Danielle Wilson, and Jessica Rick from Habitat for Humanity of
Michigan for their invaluable aid, guidance, and support from the beginning of the
project through its completion.
We would also like to thank Professors Michael Moore, Avik Basu, and John DeCicco, as
well as Dr. Grant Benson from the Institute of Social Research and individuals from the
Center for Statistical Consultation and Research who assisted with the methodology of
our survey design and data analysis. For their logistical support, we would also like to
thank Mike Lowry and Alan Levy from University of Michigan Information and
Infrastructure Assurance, Alexander Kanous from the Office of Research and Sponsored
Projects, and Jeffrey Keeler from the School of Natural Resources and Environment.
Next, we would like to thank the Habitat for Humanity representatives from affiliates
across the state, whose valuable contributions helped our team gather data and
understand Habitat's excellent building practices. They include: Michael Hyacinthe, Gail
Francis-Hollen, and Connie O'Toole from Kent County; Steve DeYoung and Matt
Zomerlei from Lakeshore; Tony Scott from Lansing; Michael McIntyre from Muskegon
County; Lani Laporte from Northwest Michigan; Emily Dekker-Fiala from Copper
Country; Erin Hudson and Nick Pamplone from Harbor; Lynne Punnett and Tim Raquet
from Lenawee County; Traci Odom and Dan Garan from Detroit; Ryan McCoon, Ashlee
Bartleson, Bailee Brandt, and Wendy Irvin from Grand Traverse; Rob Nissly and Gaby
Kuschmann from Huron Valley; Tom Tishler and Lorelene McLeary from Kalamazoo
Valley; Dave Behnke and Shelly Hendrick from Jackson; Emily Pelyak and Karan Bates-
Gasior from Macomb County; Matt Weckesser and Jennifer Chappel from Midland
County; Brian Greene from Montcalm County; Cindy Preston from Barry County;
Sharlayne Grawey from Cheboygan County; Juan Zuniga from Genesee County; Nancy
Pellegrini and Rob Kuehl from Menominee River; and M. David Graves from Monroe
County.
For helping our team collect energy consumption data for the homes in our survey, we
would like to thank Cherryland Electric Cooperative, Consumers Energy, Holland Board
of Public Works, Lansing Board of Water and Light, Michigan Gas Utilities, Semco
Energy, and Zeeland Board of Public Works.
Lastly, we'd like to thank the Hawkins Fellowship in Sustainability Science for their
gracious financial support, and our project advisor, Scott Noesen, for his helpful
guidance and feedback on our methods and his insight into Habitat for Humanity
operations.
iv
List of Figures
Figure 1: Participating HFH affiliate map ............................................................................................. 7
Figure 2: Motivations for saving energy ............................................................................................ 23
Figure 3: Barriers to saving energy ...................................................................................................... 24
Figure 4: Perceptions of environmental impact ............................................................................. 25
Figure 5: HFH educational interventions .......................................................................................... 25
Figure 6: Partner family experience .................................................................................................... 26
Figure 7: Partner family attitudes on home energy usage .......................................................... 28
Figure 8: Partner family home comfort .............................................................................................. 29
Figure 9: Internet and social media usage ........................................................................................ 29
Figure 10: Winter thermostat settings ............................................................................................... 36
Figure 11: Racial distribution of survey respondents .................................................................. 66
Figure 12: Number of years living in the home ............................................................................... 66
Figure 13: Age of the head of household ............................................................................................ 67
Figure 14: Number of household residents ...................................................................................... 67
Figure 15: Motivations for saving energy .......................................................................................... 68
Figure 16: Barriers to saving energy ................................................................................................... 68
Figure 17: Perceptions of environmental impact ........................................................................... 69
Figure 18: Environmental attitudes..................................................................................................... 69
Figure 19: HFH educational interventions ........................................................................................ 70
Figure 20: Partner family experience ................................................................................................. 70
Figure 21: Partner family home comfort ........................................................................................... 71
Figure 22: Partner family attitudes on home energy usage ....................................................... 71
Figure 23: Partner family perception of home energy efficiency ............................................. 71
Figure 24: Partner family perception of utility bill affordability .............................................. 72
Figure 25: Internet and social media usage ...................................................................................... 72
Figure 26: Winter thermostat settings ............................................................................................... 73
Figure 27: Presence of air conditioning ............................................................................................. 73
Figure 28: Refrigerator and freezer usage ........................................................................................ 74
Figure 29: TV and computer usage ...................................................................................................... 74
Figure 30: Other appliance and electronics usage ......................................................................... 75

v
List of Tables
Table 1: HFH survey natural gas consumption model effect sizes ...........................................34
Table 2: HFH electricity consumption model effect sizes ............................................................37
Table 3: RECS natural gas comparison model effect sizes ...........................................................40
Table 4: RECS natural gas comparison model effect sizes in percentage terms .................41
Table 5: RECS electricity comparison model effect sizes in percentage terms ...................43
Table 6: HFH survey natural gas consumption model ..................................................................76
Table 7: HFH survey electricity consumption model .....................................................................77
Table 8: RECS natural gas* comparison model results .................................................................78
Table 9: RECS electricity* comparison model results…………………………………………….......79
vi
Table of Contents
Abstract .................................................................................................. ii
Acknowledgements ..................................................................................... ii
List of Figures .......................................................................................... iv
List of Tables ............................................................................................ v
Introduction ............................................................................................. 1
Background ........................................................................................... 1
Objectives and Scope .................................................................................. 5
Methodology ............................................................................................. 6
Affiliate Interviews .................................................................................. 6
Partner Family Survey ............................................................................... 7
Survey Creation Process .......................................................................... 8
Survey Mailing Process ........................................................................... 8
Survey Questions .................................................................................. 9
Survey Error ........................................................................................ 9
Energy Consumption Data .........................................................................10
Utility Consumption Data .......................................................................10
Energy Consumption Data Error ................................................................11
Heating and Cooling Degree Days ..............................................................12
Building Characteristic Data ......................................................................12
Analysis Methodology ...............................................................................13
Challenges ..............................................................................................15
Communication Challenges ........................................................................15
Data Procurement Challenges ....................................................................15
Results ..................................................................................................17
Affiliate Interviews .................................................................................17
Partner Family Survey ..............................................................................19
Response Rate ....................................................................................19
Respondent Demographics ......................................................................19
Qualitative Results ...............................................................................19
Quantitative survey results .....................................................................21
Energy Consumption Analysis .....................................................................30
Partner Family Perception of Home Efficiency ..............................................30
vii
Environmental Views ............................................................................ 31
Interaction with Habitat for Humanity ....................................................... 31
Linear Regression Model Results ............................................................... 32
Habitat-Only Energy Consumption Models ...................................................... 33
Natural Gas ....................................................................................... 34
Electricity ......................................................................................... 36
Habitat and Non-Habitat Comparison Models ................................................ 39
Discussion and Recommendations .................................................................. 47
Key Recommendations ............................................................................. 47
Partner Family Survey........................................................................... 47
Internet Access and Connectivity ............................................................. 47
Thermostat Settings at Move-in ............................................................... 48
Individual Actions ................................................................................ 49
Whole Family Inclusion on Energy Saving Education ........................................ 49
Basements ........................................................................................ 49
Rehabbed Homes ................................................................................ 50
Windows and Doors .............................................................................. 50
Air Conditioning .................................................................................. 50
Improved Efficiency Over Time ................................................................ 51
Space Heaters .................................................................................... 51
Stand-alone Freezers ............................................................................ 51
Smart Power Strips .............................................................................. 51
Partner Families as First-Time Homeowners ................................................ 52
Small Affiliate Concerns ........................................................................ 52
Affiliate Mentoring .............................................................................. 53
Future SNRE Masters Projects .................................................................... 53
Long-term Effect of Habitat Homes Entering a Community ............................... 53
Solar Photovoltaics (PV) ........................................................................ 53
Improved Energy Consumption Data Collection ............................................. 54
Financial Case for Partner Families ........................................................... 54
Conclusion ........................................................................................... 54
APPENDIX A: HFH Affiliate Interview Questions .................................................. 56
APPENDIX B: HFH Partner Family Survey Questions ............................................. 58
APPENDIX C: Example Utility Customer Authorization Form ................................... 65

viii
APPENDIX D: HFH Partner Family Household Survey Results ...................................66
APPENDIX E: Energy Consumption Model Results .................................................76
APPENDIX F: List of Acronyms .......................................................................80
References .............................................................................................81
1
Introduction
Habitat for Humanity International (HFHI) is a non-profit organization that builds and
renovates safe, affordable housing for low-income families around the world through
local affiliate organizations. These affiliates sell homes to partner families at cost
through zero-interest mortgage loans (Habitat for Humanity, 2014). Habitat for
Humanity of Michigan (HFHM) is a State Support Organization (SSO) that works with
over 70 Habitat affiliate chapters in Michigan to improve building design, secure and
maintain funding, and interface with HFHI.
HFHM has made great strides in promoting energy efficiency for the houses that
affiliates in Michigan build and renovate. However, HFHM wanted to determine how
best to proceed to further reduce energy consumption in Habitat homes––thereby
improving the financial security of Habitat partner families as well as reducing
environmental impact. This project’s purpose was to measure actual household energy
consumption among Habitat households in Michigan, evaluate the performance of
Habitat affiliates’ energy efficiency efforts, and create recommendations for further
reducing energy consumption in Habitat homes through a combination of building
technology and education programs.
HFHM reaches a considerable target audience across the state. We hope that the
strategy our team designed will be relevant to all affiliate chapters in Michigan, and
perhaps the building industry more generally. As of 2012, Habitat for Humanity was the
sixth largest homebuilder in the United States (Habitat for Humanity 2012); thanks to
this industry clout, steps that Habitat affiliates take to improve their approach to
affordable housing can improve homeowners’ sustainability and livelihood at scale as
well as reverberate throughout the homebuilding community, providing a model for
other organizations devoted to affordable and sustainable housing.
Background
Although global energy poverty has been widely explored, energy poverty as it applies
to low-income housing in the United States has not. This presented a research gap that
we aimed to address through the course of our project. Energy expenditures comprise
a disproportionately high share of total expenses in low-income households. Many
families in the US, including Michigan, experience energy poverty, defined as devoting
at least 10% of total household income to energy expenditures (Roberts, 2008). In
comparison, higher-income households typically spend a much smaller proportion of
their income on energy needs, averaging between 3% and 4% (Eisenberg, 2010).
2
Energy poverty is as much related to income as to the older and less energy-efficient
housing infrastructure that low-income families generally inhabit. According to the
2009 Residential Energy Consumption Survey, average annual energy consumption per
square foot for heating and cooling among Michigan households above 150% of the
federal poverty level was approximately 40.72 MBtu/square foot, while average annual
energy consumption for these purposes among households at or below 150% of the
federal poverty level was approximately 66.37 Mbtu/square foot (U.S. Energy
Information Administration, 2009).
Energy inefficiency among low-income households has a wide range of negative
impacts. It increases the likelihood of financial and housing instability since families are
forced to make difficult allocation decisions with limited resources. Energy poverty also
leads to documented negative health impacts, particularly among children. Battacharya,
et al. (2002) observed a phenomenon known as the “heat or eat dilemma,” wherein as a
response to unusually cold weather, poorer families reduced their expenditures on food
by approximately the same amount that they increased their expenditures on energy.
On the other hand, higher income families increased both their food and fuel
expenditures when faced with the same situation. Additionally, investigators observed
that children from lower income families consumed an average of 197 fewer
calories/day during the winter than during the summer.
Furthermore, residential energy inefficiency has substantial environmental impacts.
Approximately 54% of Michigan’s electricity generation is fueled by coal (U.S. Energy
Information Administration, 2013) and nearly 90% of Michigan households are heated
with natural gas or propane (U.S. Energy Information Administration, 2009). Thus,
inefficient housing contributes significantly to greenhouse gas emissions and climate
disruption as well as emissions of other air pollutants including sulfur dioxide, nitrous
oxides, particulate matter, and mercury.
The incorporation of sustainability principles into building science to address these
challenges is fairly new, with the first green building programs launching in the early
1990s (EPA, 2012). Initially, “green” housing was aimed more affluent families with
higher levels of disposable income. However, sustainable building techniques have been
more recently applied to low-income housing in addition to upper-income housing and
commercial buildings (EPA, 2011).
Included in this movement is HFHM, who has identified energy efficiency as a way to
better serve partner families by improving the economic, social, and environmental
sustainability of the houses they build and renovate. As an example of HFHM’s success
3
in adopting sustainable practices, by 2013 all participating new and renovated Habitat
homes in Michigan achieved ENERGY STAR certification or equivalent. However, next
steps toward cost-effective energy efficiency and conservation remain unclear, as this is
relatively new territory in affordable housing.
One of the key strategies for further reducing energy consumption among Habitat
homes is to install cost-effective, durable energy efficiency improvements as part of the
building infrastructure. Existing retrofit programs show that reductions in energy
consumption of up to 50% are possible through certain energy efficiency measures, and
the costs of these measures are continually decreasing with improvements in building,
appliance, and equipment technology. However, these deep retrofit programs can still
be cost prohibitive and inappropriate in the affordable housing sector (Cluett and
Amann, 2014). Therefore, one element of HFHM’s strategy to further reduce energy
consumption in Habitat homes is to identify cost-effective efficiency improvements that
consistently deliver energy savings to partner families and pay for themselves relatively
quickly.
Still, at their core most environmental problems are human problems. Even with
technological gains that make cost-effective energy efficiency improvements more
accessible, energy consumption may not change substantially in the long run due to
continued consumption behaviors and the rebound effect, wherein the decreased cost
of energy through improved efficiency yields increased consumption (Owen, 2010). To
ensure the maximum amount of energy savings, steps to reduce consumption through
behavior change are needed alongside improvements in energy efficiency. Several
existing programs addressing behavior and education have been successful in reducing
household energy consumption (Allcott, 2011; Osbaldiston, 2011).
Since HFHM recognizes that energy consumption is determined as much by individual
and family conservation behaviors as by physical infrastructure, pairing families with
ENERGY STAR certified or equivalent homes is an important first step in a greater
trajectory aimed at fostering durable, pro-environmental, and sustainability habits. For
this reason, HFHM wishes to collaborate with partner families in defining and
understanding their role as environmental actors. This action is especially important as
families move into and adjust to their new homes, since contextual changes are some of
the best times to modify behavior (Verplanken et al., 2008). Based on survey and
interview data, we developed behavior change recommendations and messaging
strategies that encourage long-term energy conservation related to homeownership.
These materials may serve as a behavior-change model for Habitat affiliates in the state
as well as at the national level.
4
There has been a recent intellectual shift in the way experts think about and design
environmental education and behavior change programs. In the past, information about
and exposure to environmental problems was considered key to pro-environmental
behavior change. After years of psychological research, it is now accepted that the
relationship between information and action can be weak and uncertain (Osbaldiston
and Schott, 2011). Thus, experts have been experimenting with a wider range of
behavior change techniques (i.e. intention mapping, goal-setting, social norm
marketing, prompts, intrinsic motivation, etc.), often with greater and more durable
success than with information alone. However, no single strategy is sufficient for
change, and many social scientists now recognize the power in employing varying and
complementary methodological combinations (Abrahamse et al., 2005). Although
promising, few programs have been developed that incorporate more than two change
strategies and therefore little scientific evaluation has been done on which
combinations are the most effective and under what circumstances. Using literature in
this area, we explored some of these behavior change strategies in designing a home
energy consumption survey and recommending educational materials for Habitat
families.
Continued and regular interaction with Habitat partner families after move-in can have
positive effects beyond reducing energy consumption. As home systems become
increasingly complex (particularly for highly efficient homes), it can be difficult for first-
time homeowners to keep track of the maintenance necessary to ensure the proper
functionality and safety of infrastructure and equipment. For example, proper
ventilation was not traditionally a concern in older homes since the building envelope
was not tight and air could pass relatively freely through the home. Today, however,
highly efficient homes require complex ventilation systems to ensure proper airflow
through a tightly-sealed interior. If families are not equipped to maintain this
ventilation system, they risk serious indoor air quality issues, including excess mold
(Manuel, 2011). Thus, continuing interaction with families after move-in can help
families properly maintain the health and livability of their homes, as well as reduce
their monthly energy expenditures.

5
Objectives and Scope
The principle goal of our project involved meeting the requests of our client by
identifying low-income residential energy efficiency strategies that can be applied
within and beyond HFHM.
Our overall aim was to establish a plan to inform HFHM and Habitat affiliates in
Michigan as they move forward with energy efficiency and sustainability measures.
HFHM and many Michigan affiliates have already addressed “low-hanging fruit” in
terms of energy efficiency, but realize that there is room for improvement. Regrettably,
budgetary constraints among many affiliates make ambitious or sweeping overhauls
difficult. Thus, we wanted to assess the effectiveness of current efficiency
improvements and identify other viable measures Habitat could take to further increase
energy efficiency. Moreover, our project will help families living in Habitat’s finished
homes to continue saving energy, which not only provides an environmental
sustainability component, but also a social justice component as these measures will
help reduce energy costs for low-income families.
A secondary goal of this project was to develop our team’s professional and intellectual
skills. Through this project, we built collaborative teamwork skills and learned to
effectively interact with a large number of external stakeholders. Furthermore, our
group augmented our knowledge of energy efficiency measures for buildings, the
functioning of a multinational non-profit, and the development and evaluation of a
behavior change intervention package. This project also allowed us to engage in a long-
term consulting project, which aided in developing our computational and data analysis
skills, as well as methods for distilling complex concepts into digestible
recommendations for our client.
A third goal relates to the scalability of the project, specifically how strategies for
encouraging energy conservation among the lower-income residential sector can be
applied outside the operations of HFHM affiliates. Residential energy efficiency has the
potential to mitigate energy poverty and significantly reduce the environmental
damages associated with combustion of fossil fuels across many sectors and industries.
Therefore, our client and team identified promoting energy efficiency more broadly in
the lower-income sector as a key component of the project. The recommendations
provided are applicable not only to HFHM affiliates, but also can be applied by other
low-income housing developers in general.
6
Methodology
Many factors affect the ultimate energy use of a particular household: building
characteristics; appliances; heating, cooling, and ventilation systems; the number of
residents; the age and health of residents; how often residents are home; and energy
consumption behavior are just a few key determinants of total energy usage. These
drivers of energy consumption can be addressed via two components. The first
component is identification of the best technology available to reduce energy intensity
in a cost-effective manner. The second major component is to identify how Habitat
families’ behaviors, attitudes, and intentions affect their energy consumption, and how
educational outreach can be designed to influence these behaviors, attitudes, and
intentions in a positive manner and motivate families to conserve energy and properly
maintain their homes.
Affiliate Interviews
Before collecting information on Habitat households themselves, we conducted
qualitative interviews with construction managers, executive directors, and other key
stakeholders at participating Habitat affiliates. The goal of these interviews was to
better understand motivations behind sustainability, best practices in construction and
communication, and challenges faced when pursuing efficiency in homes. In addition to
data collection, these interviews helped inform our Habitat household survey and
establish trust between our research team and Michigan Habitat affiliates. It was made
clear that the point of our research was not to rank or scrutinize affiliate performance.
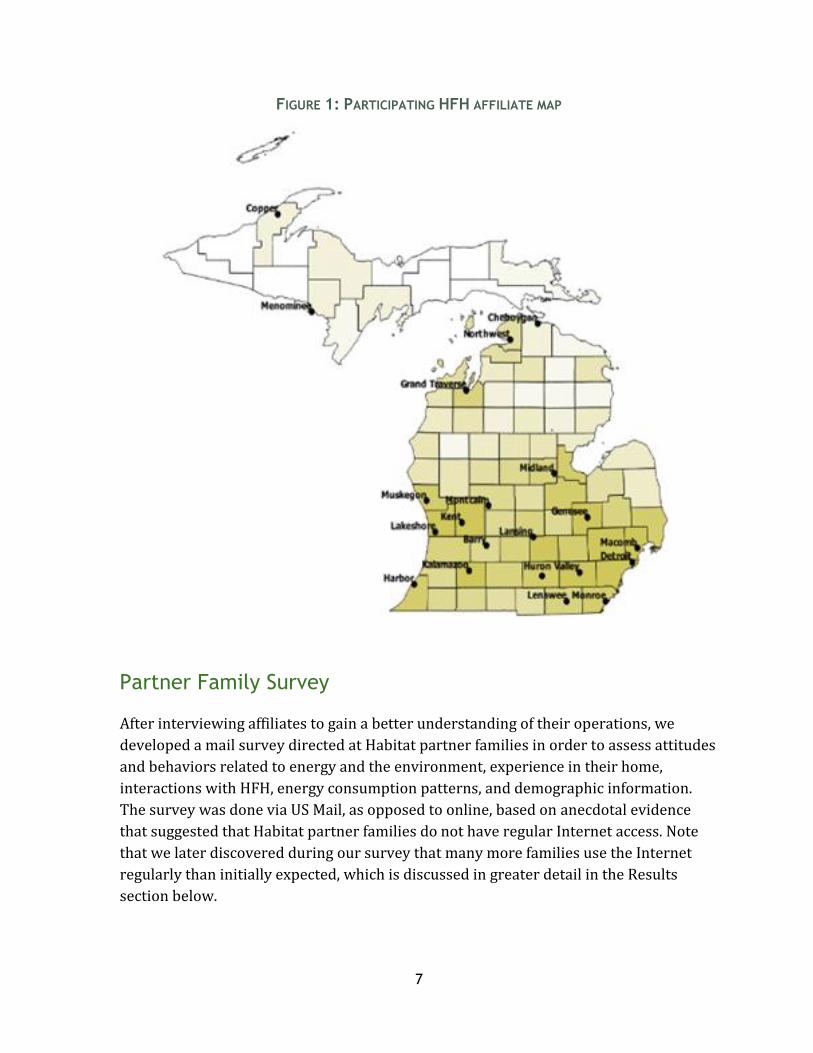
We targeted affiliates based on their size and relationship with HFHM. After HFHM
notified affiliates of the project, we arranged calls with representatives of 21 affiliates
between March and May of 2014. A map of these affiliates is shown in Figure 1 below.
Interviews lasted approximately 45 minutes and were semi-structured, with each team
member following a question guide while allowing for follow-up questions and free
discussion as needed. In most cases at least two members of the SNRE team were
present in order to ensure a balance of note taking and discussion. The interview
consisted of four sections: construction, systems, communication, and general
questions. An important component of the interview was asking which affiliates were
viewed as top performers in the state, in order to identify successful partners.
7
FIGURE 1: PARTICIPATING HFH AFFILIATE MAP
Partner Family Survey
After interviewing affiliates to gain a better understanding of their operations, we
developed a mail survey directed at Habitat partner families in order to assess attitudes
and behaviors related to energy and the environment, experience in their home,
interactions with HFH, energy consumption patterns, and demographic information.
The survey was done via US Mail, as opposed to online, based on anecdotal evidence
that suggested that Habitat partner families do not have regular Internet access. Note
that we later discovered during our survey that many more families use the Internet
regularly than initially expected, which is discussed in greater detail in the Results
section below.
8
Survey Creation Process
The survey was designed in consultation with a number of social research experts,
informed by a review of relevant literature (DeCicco, et al., 2013; Dillman, et al., 2009;
Schutt, 2001), and based partly on the type and style of questions asked within the EIA
2009 Residential Energy Consumption Survey (RECS). There were three primary
sections:
1. Attitudes on energy and the environment
2. Home experience and energy use
3. Demographics
We consulted with faculty members from the University of Michigan while designing
the survey: Dr. Avik Basu (SNRE), Dr. Grant Benson (Institute for Social Research), Dr.
John DeCicco (former SNRE faculty), and Dr. Michael Moore (SNRE).
Survey Mailing Process
There are over 70 Habitat affiliates in Michigan, each with varying levels of annual
home construction and renovation activity. Due to time and resource constraints, our
team was not able to sample households from every Habitat affiliate in Michigan.
Therefore, we used the same 21 affiliates who participated in qualitative interviews as
the source population for our survey sample. These 21 affiliates, including both urban
and rural affiliates, represented 67% of new builds and rehabilitations across the state
from 2009 through 2013. Of these 21 affiliates, 13 agreed to provide names and mailing
addresses for their partner families, three chose to mail out the surveys to their partner
families themselves due to concerns over privacy, and five did not respond to our
request. We asked that affiliates provide us with contact information for homes that had
been occupied for at least two years and were not heated with propane in order to
accurately compare natural gas consumption across homes.
Approximately three days before the physical surveys were distributed, a simple pre-
notice letter was sent out to the families, which introduced our team, informed families
about the goals of the project, and asked for their participation. We alerted families that
they would be receiving a survey in the mail and included a contact phone number and
e-mail address they could use to reach us with questions about the project or for
assistance filling out the survey. These pre-notice letters were personalized for partner
families that we contacted directly. For the three affiliates who sent out survey
materials themselves, letters were not personalized.
9
Three days after distribution of the pre-notice letters, our team sent out 490 survey
mailers that included a cover letter, survey booklet, stamped and self-addressed return
envelope, and customer authorization forms for the electric and natural gas utilities
that serviced their home. The mailer also included a $1 bill as an incentive to complete
the survey, since prepaid monetary incentives have been shown to significantly
increase response rates in mail surveys (Dillman, et al., 2009; Singer, 2012). The cover
letter reminded participants of the nature and goal of our project, thanked them for
their participation, described instructions for returning materials to our team, and
again provided contact information.
One week after distributing the survey materials, we mailed postcards to families for
whom we had contact information. These postcards thanked participants for their
assistance, reminded participants to complete and return their survey booklets and
customer authorization forms, and again provided contact information for questions.
For the three affiliates who did not share partner family contact information with our
team, no postcards were distributed.
Due to delays in approving the language used in the DTE Energy customer
authorization forms, survey materials were distributed in two batches. The first batch,
which included all homes not serviced by DTE Energy, was distributed in August 2014.
The second batch, which included all homes serviced by DTE Energy, was distributed in
October 2014.
Survey Questions
For the complete list of questions in the partner family survey, refer to Appendix B.
Survey Error
As with all surveys, ours was not free from error or bias. We achieved a 25.1% response
rate, indicating that 74.9% of the households who received a survey did not return it. In
our analysis, we assume that this 25.1% is a representative sample of the Habitat
partner family population in Michigan. However, it is possible that these 25.1% are not
representative of Habitat families.
Language barriers presented another potential source of error. Due to resource
constraints, only an English language version of our survey could be distributed to
10
partner families. If some partner families were uncomfortable responding to an English
language survey, their behaviors, attitudes, and energy use may not have been captured
in our results, potentially biasing the results in favor of English-speaking households.
Energy Consumption Data
In addition to the social research on how Habitat families use and conserve energy in
their homes, we also worked with partner families, HFH, and electric and natural gas
utility companies to collect actual energy consumption data for Habitat homes.
Utility Consumption Data
In order to collect electricity and natural gas consumption data for participating
households, our team used customer authorization forms which, when signed by
participating households, authorized our team to collect these data directly from
utilities. Forms were customized to each utility. For the two largest utilities, DTE Energy
and Consumers Energy, we modeled the customer authorization form based on an
authorization form that HFHM had used in a previous study. We then submitted these
forms to the legal departments at these utilities for edits and approval. For all other
utilities, we used the language that had been approved by Consumers Energy. A copy of
the customer authorization for used for Consumers Energy can be found in Appendix C.
Once we received signed authorization forms in the returned survey packets, we
submitted them to their respective utilities and requested two years’ worth of monthly
electric and/or natural gas consumption data from June 2012 through May 2014.
We identified the utilities that serviced each address using www.allconnect.com, which
allowed utility lookup by address in July 2014. However, as of April 2015, this tool is no
longer effective for most Michigan residential addresses. This tool was generally
effective for identifying the utilities that serviced each address at the time. However,
there were certain instances where it could not identify any electric or gas utility, in
which case we relied on qualitative information obtained from affiliate interviews to
estimate the utility that serviced their partner families’ homes. In the case that the
online tool returned multiple utilities for one address, we included forms from each
utility in the survey mailer and asked households to only complete and return forms for
the utilities that actually serviced their home.
We found that the homes represented in our survey were serviced by a total of nine
utilities: Cherryland Electric Cooperative, Consumers Energy, DTE Energy, Holland
11
Board of Public Works, Lansing Board of Water and Light, Michigan Gas Utilities,
Midwest Energy Cooperative, We Energies, and Zeeland Board of Public Works. Of these
utilities, our team was successful in collecting electricity and gas consumption data
from every utility except We Energies, despite repeated follow-up requests. Overall,
approximately 87% of households surveyed received electric and/or gas service from
the two largest investor-owned utilities in the state, Consumers Energy and DTE
Energy.
Collection of utility consumption data was the most time-consuming portion of this
project. One utility in particular, DTE Energy, had an extensive approval process both
for our customer authorization forms and for our data transfer, storage, and security
plan. The approval process for our customer authorization form took three months,
from July 2014 to October 2014. Due to this delay, we distributed household surveys in
two batches as previously discussed.
DTE Energy also required our team to complete a complex data security questionnaire
and a “terms and conditions” document that would eventually be rolled into a data
security agreement. Working with University of Michigan Information and Technology
Services and University of Michigan Office of Research and Sponsored Projects, we
prepared our responses to the questionnaire and negotiated a data security agreement.
This process took five months, from September 2014 through January 2015. Upon
completion of the data security agreement, our team forwarded the completed
customer authorization forms to DTE in February 2014 and received our requested
consumption data in the same month.
Energy Consumption Data Error
There are several potential sources of error in the energy consumption data we
collected from utilities. First, not all utilities included in our sample use smart meters,
and not all utilities are able to collect accurate meter readings every month for every
home. This means that some of the monthly energy consumption data collected were
estimated rather than based on an actual meter reading. For some utilities, it was not
made clear which data were estimated and which were based on actual meter readings.
To help overcome this obstacle, we grouped energy consumption across several months
or a full year for our analysis, instead of considering monthly energy use. This helped
ensure that the energy consumption data included a majority of actual meter readings.
Another source of error was the uncertainty in the dates for each billing period. Many
utilities’ billing periods do not correspond with the beginning and end of calendar
12
months. For example, the June 2012 billing period for one utility covers May 20 - June
19, while the June 2012 billing period for another utility covers June 5 - July 4. To
overcome these differences, we considered usage by season or over the course of the
entire year.
Heating and Cooling Degree Days
In order to account for energy consumption variations in different parts of the state due
to differing latitudes and weather conditions, we collected heating and cooling degree
days for areas around each affiliate included in the survey. A heating degree day (HDD)
or cooling degree day (CDD) is a measure of how hot or cold a day is, on average,
compared to a baseline indoor temperature (65 °F) in one day. For example, if a single
day has an average temperature of 55 °F, that day will accrue 10 HDD. Five days with
average temperatures of 55 °F each day will accrue 50 HDD in total. The equation used
to calculate HDD is:
HDD for X days = (65 - Avg. Temp) × X
We used the zip code of affiliates as the location for which to pull monthly HDD and
CDD data from www.degreedays.net, and made the assumption that homes built by that
affiliate would have a similar number of HDD and CDD. This assumption allowed us to
pull data for a few zip codes, rather than data for each individual home. We verified this
assumption by testing HDD data for two separate houses built by the same affiliate and
found an average difference of 27 HDD (or less than one degree difference per day
between the two locations) over 36 months.
Building Characteristics Data
Our team also collected information on the basic building characteristics for each home.
While the number of building characteristic variables that we could have collected is
practically endless - everything from home size to insulation values to directional
orientation - we had to balance the need for comprehensive data with the availability of
Habitat affiliates and their capacity to collect this information. Therefore, we only
collect a relatively limited amount of data, focusing predominantly on building
characteristics that were easily obtainable from build plans and that varied greatly
across different affiliates. These characteristics included square footage, whether or not
the home had a basement or crawlspace, number of bedrooms, type of build (new build,
gut rehab, non-gut rehab, recycle), and the Home Energy Rating System (HERS) score, if
available. For affiliates who did not respond to our request, we collected information on
13
the square footage of the home and number of bedrooms using property tax records
obtained through www.zillow.com and county clerk offices.
Analysis Methodology
Using data collected from household surveys and affiliate interviews, as well as
household building characteristics and energy consumption information, we performed
an evaluation of energy consumption across Habitat households using two methods.
First, we created multiple linear regression models explaining electricity and natural
gas consumption among Habitat homes using household characteristics. Second, we
compared energy consumption in Habitat homes with energy consumption in similar,
nationally-representative non-Habitat homes to determine how energy efficient Habitat
homes were compared with national averages. To do this, we used microdata from the
2009 Residential Energy Consumption Survey (RECS). The 2009 survey, conducted by
the Energy Information Administration (EIA), was the thirteenth since 1978 and
collected data from 12,083 households in housing units statistically selected to
represent the 113.6 million housing units that are occupied as a primary residence. We
specifically isolated homes that met the following characteristics:
● Single-family, detached;
● Owner-occupied;
● Less than 2,000 square feet of conditioned space;
● Heated with natural gas;
● Midwestern or Northeastern Climate Zone, specifically: Connecticut, Illinois,
Indiana, Massachusetts, Maine, Michigan, New Hampshire, New Jersey, New
York, Ohio, Pennsylvania, Rhode Island, Vermont, and Wisconsin
Electricity and natural gas usage data from RECS was collected directly from energy
suppliers and did not rely on household self-reports. Similarly, square footage in RECS
was measured directly by survey administrators and was not self-reported by
responding households. One weakness of using RECS data to compare with data from
our survey is the time difference: RECS data was collected during 2009 and represents
energy consumption during 2009, while our survey was administered during 2014 and
represents energy consumption during 2013. While we attempted to control for
differences in energy consumption between those years by including heating and
cooling degree days, it is possible that, for other reasons, energy consumption might
have been significantly different in 2009 than in 2013.
For all statistical confidence tests performed in our analysis, we used an alpha level of

14
0.1, indicating a 90% probability that the true population parameter was captured
within the confidence interval around the means, differences in means, differences in
proportions, or model coefficients identified in our results. This provides enough
confidence to reasonably avoid determining statistical significance in error while also
making the confidence interval narrow enough to make our findings operationally
practical.
15
Challenges
Throughout the project our team faced various challenges that complicated and delayed
project execution. In the most general sense these were related to communication and
data procurement.
Communication Challenges
Fortunately, our team experienced no difficulty communicating with HFHM and
challenges related to communication were limited to select affiliates and partner
families.
Most Michigan affiliates stay in close contact with the SSO and consider it to be a trusted
source of information. An email from HFHM to affiliates describing our project served
as a warm introduction that alleviated most of the challenges we anticipated around
making initial contact. That said, some communication was not as fluid as we would
have liked. However, problems were limited to a small subset of affiliates, and we
attribute this disconnect to a lack of resources and to employee turnover. In most cases
a phone call or additional email was all that was necessary to resolve issues.
Challenges communicating with partner families were largely driven by the sheer
number of households we attempted to sample. With additional time and resources it
would have been ideal to reach out to partner families individually, which possibly
would have allowed us to frame questions more appropriately and increase our
response rate with a more personal interaction. For affiliates who chose to keep family
contact information confidential, non-personalized surveys were sent out on our behalf.
This prevented the team from sending follow-up letters, resulting in lower response
rates and longer survey return times.
Data Procurement Challenges
From the standpoint of data procurement, we faced challenges, both internal and
external to Habitat for Humanity, primarily driven by incomplete information and
internal policies.
Because HFHM does not keep a centralized database of all projects, our team worked
with individual affiliates to procure data. Since the number of projects completed per
year varied drastically, reaching out to affiliates and consolidating data was very time
consuming and could have introduced errors stemming from data retrieval and entry.

16
While affiliates provided most of the necessary information, some data (square footage,
HERS, etc.) were unavailable. These homes were excluded from the statistical analysis,
which further limited our sample size. Another challenge associated with sampling and
data collection involved the variability in project type. In recent years there has been an
overwhelming increase in the number of retrofit projects versus new builds, and these
projects have different economics and construction profiles.
We also experienced challenges procuring data from DTE Energy, as previously
discussed in the Energy Consumption Data section. Serious project delays resulted from
working with DTE Energy, the largest energy utility in the state of Michigan. The
company not only took an exorbitant amount of time to approve our legal waivers but
also placed very strict requirements on our data transfer and storage protocols.
Together, the waiver approval and data management process for DTE Energy delayed
our project by three months.

17
Results
Affiliate Interviews
Within the “Construction” section of the affiliate interviews, we found that the number
of projects completed annually across all interviewed affiliates ranged from 1 to 20 with
an average of 5.7 projects. The cost of these projects varied from $65,000 to $160,000
with an average cost of $96,000. Project timelines varied greatly, but for new builds the
average project took 26 weeks, with some affiliates completing projects in as few as 12
weeks or as many as 52. The extent to which these projects were new builds versus
rehabilitations depended largely on specific funding opportunities (HUD Funding for
Kalamazoo) and blight levels (Macomb and Huron Valley). In total, about 40% of
projects were rehabs.
The majority of properties were acquired from private donors and state/local land
banks. Very few affiliates relied entirely on open-market purchases. Thus, most
affiliates did not have a specific neighborhood or region where they concentrated
projects. Despite this opportunistic approach, 43% of affiliates reported that many
home sales did not cover the cost of construction, often due to official appraisals that
undervalued the home. Several affiliates pointed to a lack of Energy Star 3.0 raters,
which meant homes were not being valued based on the advanced building science that
was incorporated into them.
When asked about the energy-efficient techniques that were currently being employed,
most affiliates focused on insulation, HVAC systems, and water heaters. Insulation
levels are specified by R-Value, a measure of insulation’s ability to resist heat traveling
through it. A higher the R-Value indicates better the thermal performance. On average,
R-values of 11, 22, 28 and 51 were estimated for below slab, below grade, above grade,
and attics, respectively.
Several affiliates have completed projects using insulated concrete forms (ICF). With
this type of construction, interlocking, modular units of rigid, thermal insulation are dry
stacked and filled with concrete. The individual blocks are stacked somewhat like
“Lego” blocks, creating the structural walls and floors. Although this type of
construction is extremely efficient, it is also quite costly so implementations were
largely driven by product donations and other incentives.
In order to determine the efficiency of Habitat homes, all projects are evaluated based
on the Home Energy Rating System (HERS). This is an industry standard and a
18
nationally recognized system for determining a home’s energy performance. To
calculate the HERS score, a certified rater completes an evaluation of the home and
compares the data to a modeled reference home. The resulting score is relative to the
size, shape, and type of building being evaluated. Some of the variables included in the
energy rating are exterior walls (above and below grade), floors, ceilings, windows and
doors, as well as HVAC systems, water heating systems, and thermostats. A standard
new home has a HERS score of 100, with a score of 70 being 30% more efficient than
this baseline. On average, affiliates reported HERS scores of 57 with the lowest being 45
and highest being 100. Most affiliates had a goal of further reducing these scores by 10-
20% in the coming years. When asked about energy-efficient approaches they would
like to explore in the future, affiliates tended to focus on renewable energy integration
and advanced heating systems.
The “Systems” portion of the interviews focused on specific appliances and systems
included in the homes. Although CFLs are the dominant form of lighting, almost half of
affiliates have used LEDs in some capacity. Refrigerators and stoves are always installed
through gift-in-kind donations from Whirlpool. A washer, dryer, and dishwasher are
often installed with costs rolled into the mortgage. In the majority of cases, appliances
are Energy Star rated.
In the “Communication” portion of the interview, we were primarily interested in how
affiliates interacted with partner families before and after they moved into the home.
Prior to move in, affiliates interacted with partner families during sweat equity hours,
financial and maintenance training, and walkthroughs. After move in, it is common for
some affiliates to have a family support partner who remains in contact with the family
for one year following move in. Some affiliates also send out regular newsletters. Most
affiliates identified this “post-move-in stage” as an area that could be significantly
improved upon. In the Recommendations section below, our team explores
opportunities to expand on the level of communication so as to improve energy
efficiency.
The final component of the interview consisted of general questions that did not fall
into any of the above categories. The first of these questions addressed key information
channels. According to interviews, affiliates relied on various sources for information
pertaining to energy efficient construction practices including magazines, webinars,
conferences, and other affiliates. Despite this diversity, most pointed to the SSO and,
specifically, Thom Phillips as a key channel. When asked to identify particularly
progressive affiliates in energy efficiency and sustainable building, an overwhelming
number of responses included Kalamazoo Valley, Kent County, and Grand Traverse
Region.
19
The final question in the survey asked affiliates to identify other financial or social
concerns. From a financial standpoint, affiliates focused on uncertainty around the
sources of project funding and low home appraisals. Some affiliates were even
exploring the prospect of charging interest in loans in order to fund operations. Social
concerns tended to gravitate towards whether or not affiliates were successfully
accomplishing their mission and preparing partner families for long-term success in
their homes.
Partner Family Survey
Response Rate
We sent out 490 surveys and received 115 completed surveys back. Additionally, 8
respondents returned their completed customer authorization forms, but did not return
a completed survey booklet. This yielded a 25.1% response rate. In general, response
rates were higher from families for whom the survey materials were personalized.
Respondent Demographics
Based on the demographics of survey respondents, we feel that the respondents
roughly represented the general HFH partner family population across the state of
Michigan. Of respondents, 64% of families listed a woman as the head of household,
10% were Hispanic or Latino, and 13% spoke languages other than English. Returned
surveys represented a diverse racial distribution, and families had lived in their homes
for a significant range of time. Results for respondent demographics can be found in
Appendix D, Figures 11-14.
Qualitative Results
Along with quantitative questions, the survey included four open-ended questions to
which respondents could write sentences to give us deeper understanding of their
home experiences and energy behaviors. The excerpts highlighted below are
representative of responses we received overall.
1. WHAT DO YOU LIKE MOST ABOUT YOUR HOME?
Habitat families loved talking about how much they liked their home. Some standout
20
language used included “mine, affordable, everything.” When considered together, these
answers suggest that people feel a sense of ownership of their home and that it is a
satisfactory home in a good place to live. Some quotes from the survey include:
● Knowing it is mine and I also helped build it. I feel secure and very proud in
my home. I love making it look good and in my own taste.
● I have more space than before and my house is an energy efficient and
affordable home.
● Everything! It is safe, nice, beautiful gardens, I like my home so much. It is so
comfortable!
2. WHAT DO YOU DISLIKE MOST ABOUT YOUR HOME?
Overall, people gave much more varied responses than in the previous question.
However, many homeowners expressed concerns about space, especially as related to
“basement, garage, and small.” Quotes from the survey reveal:
● No storage, no basement for kids to play.
● With 5 people and only one bathroom, the only thing I would change is
having another bathroom installed.
Amenities also seemed to be something people mentioned, with several responses
along the lines of:
● I would like central air. Other than that there is nothing I dislike.
It is important to note how often “nothing” was used in response to this question,
signaling that many families thought there was nothing they dislike about their home.
One person did a nice job summarizing this feeling by saying:
● There is nothing!!! My family loves our home.
3. WHAT DIFFICULTIES OR PROBLEMS DID YOU OR YOUR HOUSEHOLD HAVE
REDUCING ENERGY USAGE?
Problems with windows, doors, and family buy-in to energy saving practices were
frequently mentioned issues. People said:
● I try to do things but my family does not seem to follow my lead on saving
energy.
● Kids leaving lights on and doors open and having too many electronics
21
plugged in.
● No difficulties saving energy now that kids are gone.
These responses are significant because they signal a pathway for future energy
reduction that is driven by education and setting goals, versus infrastructure or
building practices.
4. DOES ANYONE IN YOUR HOUSEHOLD TAKE STEPS TO REDUCE ENERGY USAGE? IF
SO, WHAT ARE THEY?
Many people are reducing energy usage through turning off lights, turning down the
thermostat, and turning off the water whenever possible. Families mentioned:
● Use ceiling fans rather than A/C; Close drapes to keep out heat/cold; run
furnace @ lowest temp for comfort; turn down thermostat when gone 8 hrs
or more
● Turn off lights; use rain barrels; wrap water heater and pipes; use cf light
bulbs
Many people already understand the basics of saving energy, which signals that some
families might be ready, willing, and able to take on additional environmental
behaviors. Certainly some already are, for example:
● Lower the thermostat. Limit TV. Turn off lights when not in use. Compost.
(Composting takes more knowledge and skill than simply flipping a switch, but it
can considerably reduce the amount of waste coming from a home.)
Quantitative survey results
Capturing data from homes built before affiliates were actively aiming for energy
efficiency can show how effective improvements targeted specifically at energy
efficiency have been. Furthermore, energy efficiency in homes decreases over time due
to depreciation of the homes’ infrastructure and equipment. If two identical homes
were built five years apart, it is highly likely that the older home will be less efficient
today solely due to the wear and tear on the home itself. Therefore, capturing homes
with a somewhat wide range of ages can indicate how well energy efficiency
improvements installed by Habitat affiliates hold up over time.
Additionally, one valuable component of this project was the social research around
22
Habitat families’ technological competency, behavioral patterns, and understanding of
sustainability. This information provided measures for key independent variables that
we hypothesized would have an effect on household energy consumption. With
information about technological capabilities, green behaviors, environmental
knowledge and attitudes, and specific knowledge about energy-efficient features of
their home, educational materials and messaging can be strategically directed to have
meaningful and durable results. Given this information, it is possible to employ
pamphlets, smart phone applications, action interventions, and many other educational
strategies. We recommend that Habitat consider working with future SNRE Masters
Project teams to further develop some of these solutions.
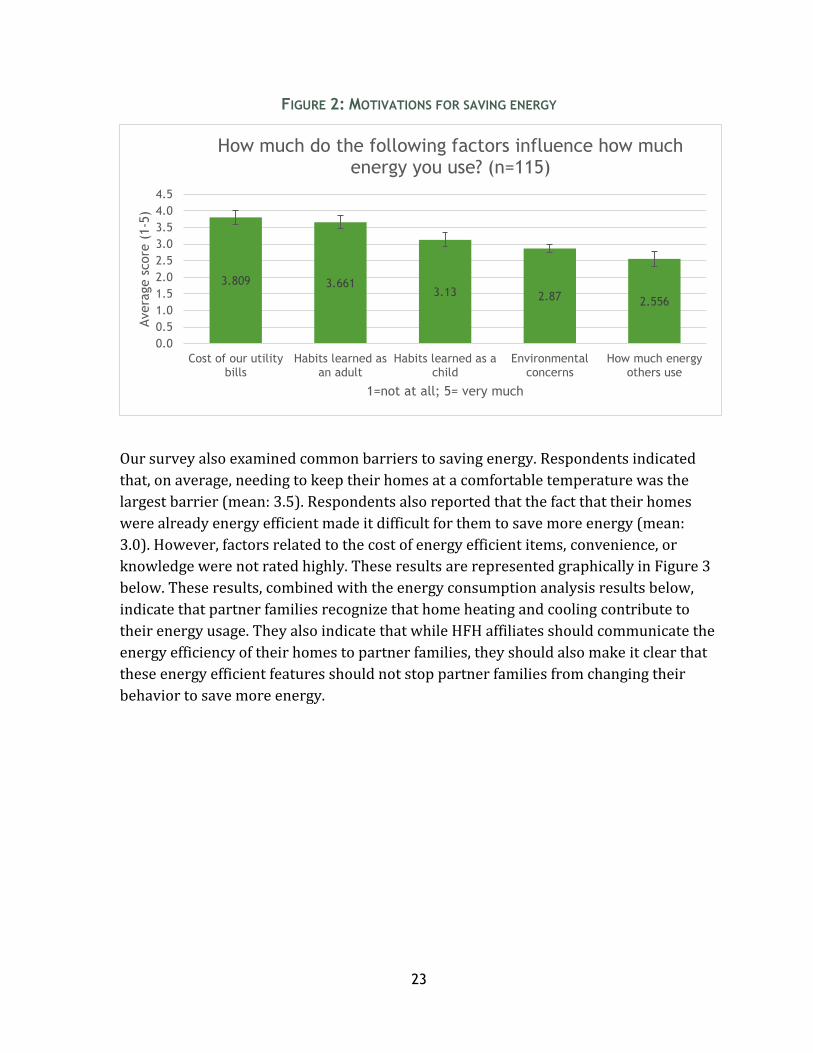
In trying to illustrate typical attitudes of HFH partner families, we calculated the
“average” responses for a number of survey questions. These responses uniformly
followed the 5-point Likert scale, with a score of 1 indicating a low level of agreement
or importance, and a score of 5 indicating a high level of agreement or importance. One
survey question, “What are the most important factors in conserving energy?” allowed
respondents to self-report what factors influence whether or not they make an effort to
conserve energy. Respondents reported that the “Cost” (mean: 3.8) and “Habits learned
as an adult” (mean: 3.7) were the two most important factors in whether families tried
to conserve energy, while “Amount [of energy] others use” (mean: 2.6) was self-
reported as being the least important. These results are represented graphically in
Figure 2 below. However, a meta-analysis of experimental studies on this type of
behavior suggest that social modeling (“How much energy others use”) has a greater
impact than cost on whether individuals try to conserve energy – when individuals feel
they are being compared to others, they will try to improve their behavior (Osbaldiston,
2011). This suggests that families’ conception of their own behaviors may not be truly
representative of their actual behavior.
23
FIGURE 2: MOTIVATIONS FOR SAVING ENERGY
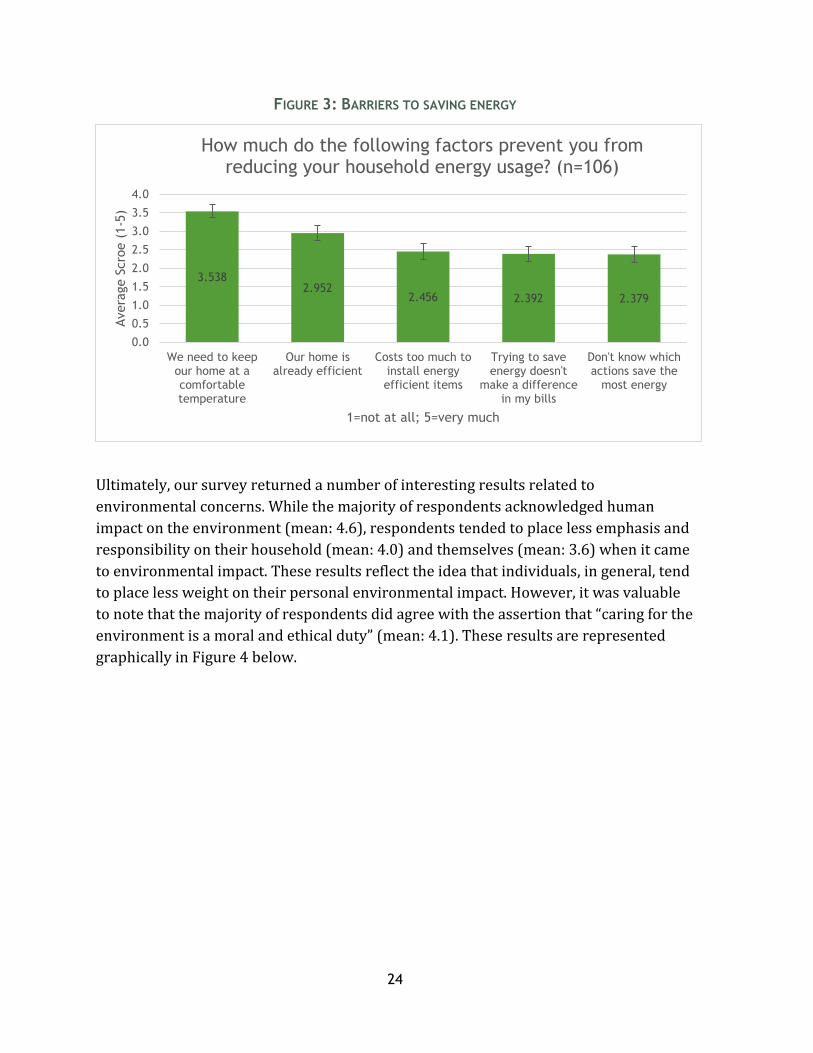
Our survey also examined common barriers to saving energy. Respondents indicated
that, on average, needing to keep their homes at a comfortable temperature was the
largest barrier (mean: 3.5). Respondents also reported that the fact that their homes
were already energy efficient made it difficult for them to save more energy (mean:
3.0). However, factors related to the cost of energy efficient items, convenience, or
knowledge were not rated highly. These results are represented graphically in Figure 3
below. These results, combined with the energy consumption analysis results below,
indicate that partner families recognize that home heating and cooling contribute to
their energy usage. They also indicate that while HFH affiliates should communicate the
energy efficiency of their homes to partner families, they should also make it clear that
these energy efficient features should not stop partner families from changing their
behavior to save more energy.
3.809 3.6613.13 2.87 2.556
0.0
0.5
1.0
1.5
2.0
2.5
3.0
3.5
4.0
4.5
Cost of our utilitybills
Habits learned asan adult
Habits learned as achild
Environmentalconcerns
How much energyothers use
Avera
ge s
core
(1-5
)
1=not at all; 5= very much
How much do the following factors influence how much energy you use? (n=115)
24
FIGURE 3: BARRIERS TO SAVING ENERGY
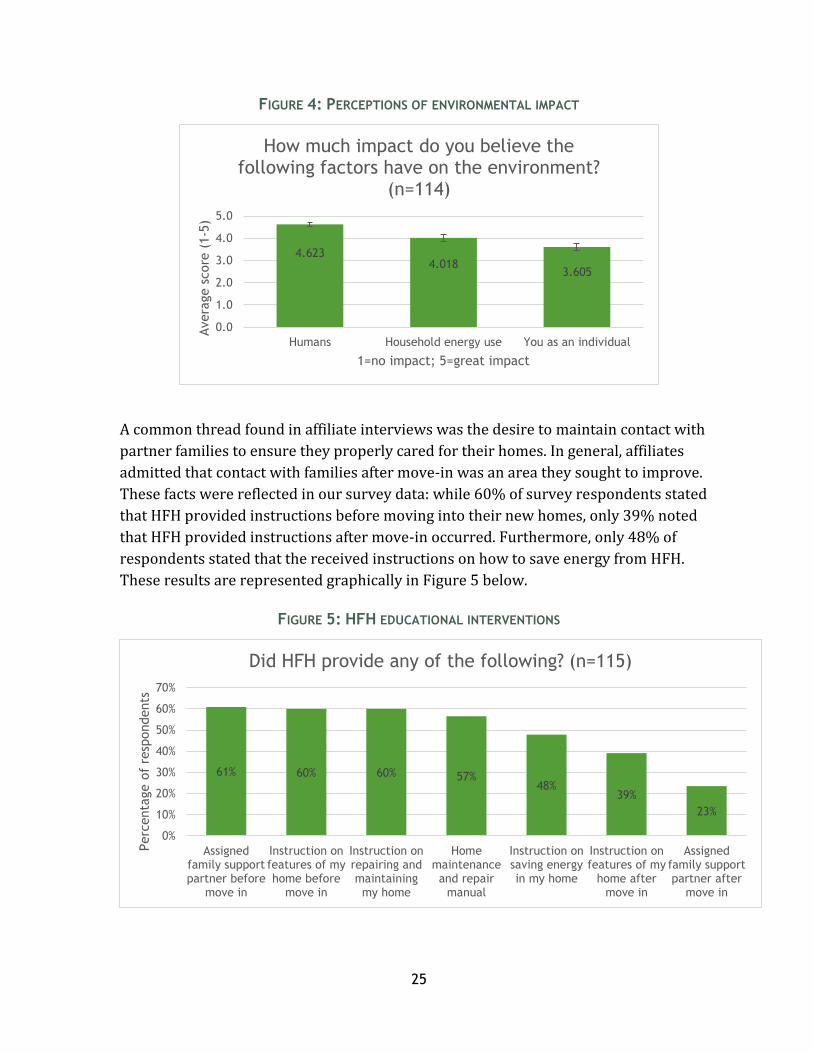
Ultimately, our survey returned a number of interesting results related to
environmental concerns. While the majority of respondents acknowledged human
impact on the environment (mean: 4.6), respondents tended to place less emphasis and
responsibility on their household (mean: 4.0) and themselves (mean: 3.6) when it came
to environmental impact. These results reflect the idea that individuals, in general, tend
to place less weight on their personal environmental impact. However, it was valuable
to note that the majority of respondents did agree with the assertion that “caring for the
environment is a moral and ethical duty” (mean: 4.1). These results are represented
graphically in Figure 4 below.
3.5382.952
2.456 2.392 2.379
0.0
0.5
1.0
1.5
2.0
2.5
3.0
3.5
4.0
We need to keepour home at acomfortabletemperature
Our home isalready efficient
Costs too much toinstall energyefficient items
Trying to saveenergy doesn't
make a differencein my bills
Don't know whichactions save the
most energy
Avera
ge S
cro
e (
1-5
)
1=not at all; 5=very much
How much do the following factors prevent you from reducing your household energy usage? (n=106)
25
FIGURE 4: PERCEPTIONS OF ENVIRONMENTAL IMPACT
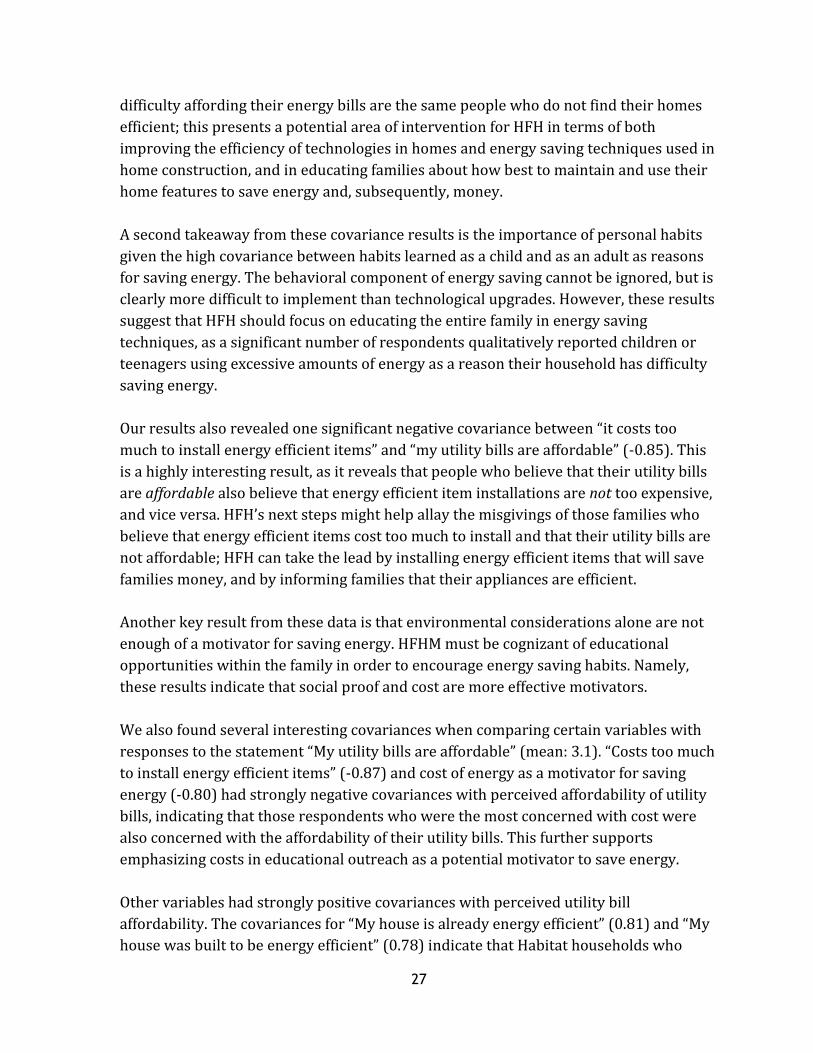
A common thread found in affiliate interviews was the desire to maintain contact with
partner families to ensure they properly cared for their homes. In general, affiliates
admitted that contact with families after move-in was an area they sought to improve.
These facts were reflected in our survey data: while 60% of survey respondents stated
that HFH provided instructions before moving into their new homes, only 39% noted
that HFH provided instructions after move-in occurred. Furthermore, only 48% of
respondents stated that the received instructions on how to save energy from HFH.
These results are represented graphically in Figure 5 below.
FIGURE 5: HFH EDUCATIONAL INTERVENTIONS
4.6234.018
3.605
0.0
1.0
2.0
3.0
4.0
5.0
Humans Household energy use You as an individual
Avera
ge s
core
(1-5
)
1=no impact; 5=great impact
How much impact do you believe the following factors have on the environment?
(n=114)
61% 60% 60% 57%48%
39%
23%
0%
10%
20%
30%
40%
50%
60%
70%
Assignedfamily supportpartner before
move in
Instruction onfeatures of myhome before
move in
Instruction onrepairing andmaintainingmy home
Homemaintenanceand repair
manual
Instruction onsaving energyin my home
Instruction onfeatures of my
home aftermove in
Assignedfamily supportpartner after
move in
Perc
enta
ge o
f re
spondents
Did HFH provide any of the following? (n=115)

26
Habitat partner families generally responded positively when asked about their
homeowner training experience with their affiliate. Partner families tended to agree
that they felt confident in their ability to make small repairs around their home (mean:
3.9) and that HFH prepared them to maintain their homes (mean: 3.8). However,
Habitat families tended to agree less that they remained in contact with a
representative from their Habitat affiliate, indicating a potential lack of communication
after partner families move into their homes. This reflects a common sentiment that we
heard during our affiliate interviews, in which many affiliates wished they could
improve their post-move-in communications with partner families. These results are
represented graphically in Figure 6 below.
FIGURE 6: PARTNER FAMILY EXPERIENCE
Our statistical analysis of the survey results included an examination of the covariance
among key variables. Variables with notably high covariance included responses to
“our home is already efficient” and “our energy bills are cheap” (0.87), “habits that I
learned as an adult” and “habits I learned as a child” as motivators for saving energy
(0.84), “our home is already efficient” and “my energy bills are affordable” (0.8), and
“people in my household do not care about saving energy” and “how much energy
others use” as challenges to saving energy (0.72).
These results reveal a few noteworthy points. First, people who tend to believe that
their homes are already energy efficient are more likely to believe that their energy bills
are cheap or affordable. This implies a link between the perception of energy efficiency
and tangible financial savings. However, results also show that some people who have
3.922 3.759 3.548 3.4142.974 2.871
0.00.51.01.52.02.53.03.54.04.5
I feel confidentin my ability to
make smallrepairs around
my home
HFH preparedme to maintain
my home
HFH taught mehow to use the
importantfeatures of my
home
I have a strongrelationship with
my neighborsand my
community
I stay in contactwith people who
work orvolunteer for
HFH
I have a strongrelationship with
other HFHfamilies in my
area
Avera
ge s
core
(1-5
)
1=strongly disagree; 5=strongly agree
Questions on partner family experience (n=115)
27
difficulty affording their energy bills are the same people who do not find their homes
efficient; this presents a potential area of intervention for HFH in terms of both
improving the efficiency of technologies in homes and energy saving techniques used in
home construction, and in educating families about how best to maintain and use their
home features to save energy and, subsequently, money.
A second takeaway from these covariance results is the importance of personal habits
given the high covariance between habits learned as a child and as an adult as reasons
for saving energy. The behavioral component of energy saving cannot be ignored, but is
clearly more difficult to implement than technological upgrades. However, these results
suggest that HFH should focus on educating the entire family in energy saving
techniques, as a significant number of respondents qualitatively reported children or
teenagers using excessive amounts of energy as a reason their household has difficulty
saving energy.
Our results also revealed one significant negative covariance between “it costs too
much to install energy efficient items” and “my utility bills are affordable” (-0.85). This
is a highly interesting result, as it reveals that people who believe that their utility bills
are affordable also believe that energy efficient item installations are not too expensive,
and vice versa. HFH’s next steps might help allay the misgivings of those families who
believe that energy efficient items cost too much to install and that their utility bills are
not affordable; HFH can take the lead by installing energy efficient items that will save
families money, and by informing families that their appliances are efficient.
Another key result from these data is that environmental considerations alone are not
enough of a motivator for saving energy. HFHM must be cognizant of educational
opportunities within the family in order to encourage energy saving habits. Namely,
these results indicate that social proof and cost are more effective motivators.
We also found several interesting covariances when comparing certain variables with
responses to the statement “My utility bills are affordable” (mean: 3.1). “Costs too much
to install energy efficient items” (-0.87) and cost of energy as a motivator for saving
energy (-0.80) had strongly negative covariances with perceived affordability of utility
bills, indicating that those respondents who were the most concerned with cost were
also concerned with the affordability of their utility bills. This further supports
emphasizing costs in educational outreach as a potential motivator to save energy.
Other variables had strongly positive covariances with perceived utility bill
affordability. The covariances for “My house is already energy efficient” (0.81) and “My
house was built to be energy efficient” (0.78) indicate that Habitat households who
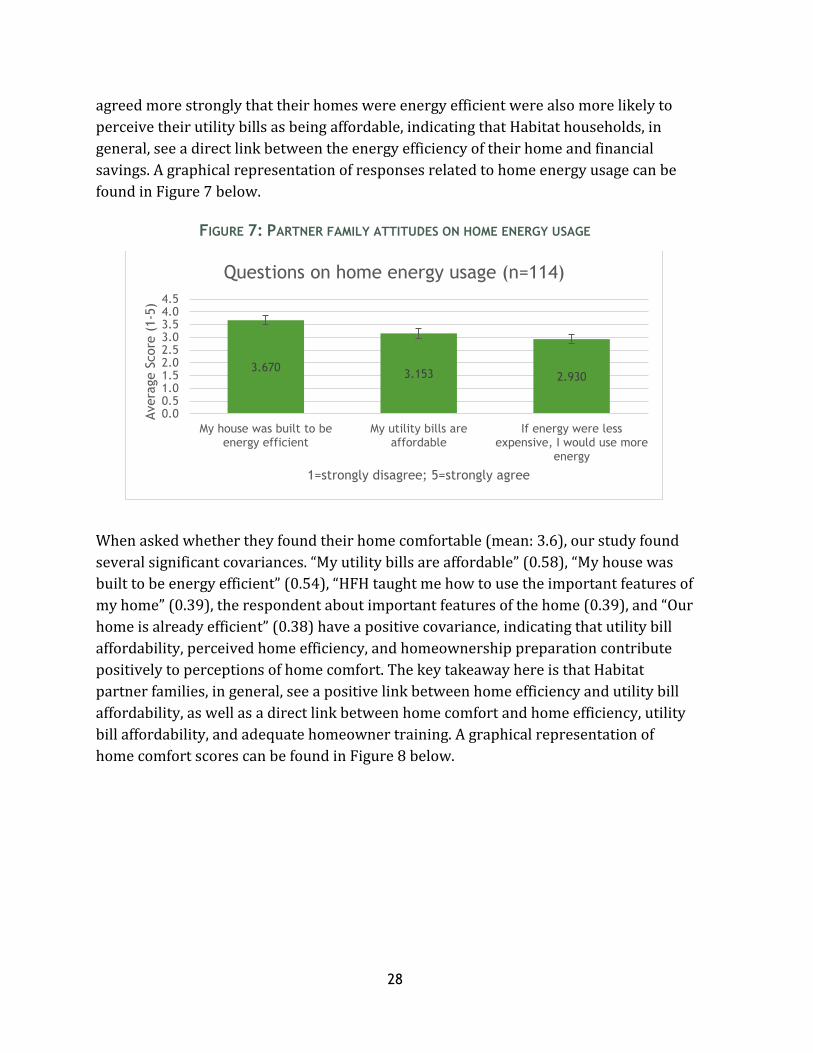
28
agreed more strongly that their homes were energy efficient were also more likely to
perceive their utility bills as being affordable, indicating that Habitat households, in
general, see a direct link between the energy efficiency of their home and financial
savings. A graphical representation of responses related to home energy usage can be
found in Figure 7 below.
FIGURE 7: PARTNER FAMILY ATTITUDES ON HOME ENERGY USAGE
When asked whether they found their home comfortable (mean: 3.6), our study found
several significant covariances. “My utility bills are affordable” (0.58), “My house was
built to be energy efficient” (0.54), “HFH taught me how to use the important features of
my home” (0.39), the respondent about important features of the home (0.39), and “Our
home is already efficient” (0.38) have a positive covariance, indicating that utility bill
affordability, perceived home efficiency, and homeownership preparation contribute
positively to perceptions of home comfort. The key takeaway here is that Habitat
partner families, in general, see a positive link between home efficiency and utility bill
affordability, as well as a direct link between home comfort and home efficiency, utility
bill affordability, and adequate homeowner training. A graphical representation of
home comfort scores can be found in Figure 8 below.
3.6703.153 2.930
0.00.51.01.52.02.53.03.54.04.5
My house was built to beenergy efficient
My utility bills areaffordable
If energy were lessexpensive, I would use more
energy
Avera
ge S
core
(1-5
)
1=strongly disagree; 5=strongly agree
Questions on home energy usage (n=114)

29
FIGURE 8: PARTNER FAMILY HOME COMFORT
Interestingly, many more HFH families reported regularly using the Internet, e-mail,
and social media than initially expected. For example, 83% of HFH families reported
using the Internet at least once per day. More detailed results for Internet and social
media usage can be found in Figure 9 below.
FIGURE 9: INTERNET AND SOCIAL MEDIA USAGE
Not comfortable3% Kind of comfortable
12%
Comfortable34%
Quite comfortable22%
Very comfortable29%
How comfortable are you and your family in your home? (n=114)
0%
10%
20%
30%
40%
50%
60%
Internet SmartphoneApplications
E-mail Skype, FaceTime,or Google Hangouts
Social Media(Facebook, Twitter,
etc.)
Perc
enta
ge o
f re
spondents
How often do you use each of the following? (n=115)
Never Less than once per week About once per week Every day More than one hour per day

30
Energy Consumption Analysis
Partner Family Perception of Home Efficiency
On average, our respondents’ perception of the energy efficiency of their homes
compared to other homes was relatively accurate. A Welch two-sample t-test using an
alpha level of 0.1 showed that those respondents who thought they used less energy
than their neighbors did in fact use between 0.02 and 0.16 hundred cubic feet (CCF) less
natural gas per square foot than other Habitat respondents. However, the difference in
means between those who thought they used more energy and those who did not was
not statistically significant. For the 27% of respondents who reported that they did not
know how much energy they used in comparison with their neighbors, they used
roughly the same amount of natural gas on average as the average of all other Habitat
respondents.
These results were similar for electricity usage. Those respondents who thought that
they used less energy than their neighbors used between 161 and 2,645 kWh less
electricity on average than other Habitat households. Those who reported using more
did tend to use between 289 and 5,745 kWh more, on average, than other Habitat
households. Those who reported that “they did not know” used about the same amount
of electricity, on average, as those who reported that they used about the same amount
of energy as their neighbors. This indicates that respondents tended to consider both
their natural gas and electricity usage when comparing their energy consumption with
their neighbors.
We also compared perceptions of energy efficiency with actual energy usage. Based on
a varimax rotation analysis to determine which Likert scale responses tended to
correlate strongly with one another, we created a composite score to represent each
respondent’s general perception of the energy efficiency of their home. We took the
average of the responses to the following prompts:
● Our home is already efficient
● My house was built to be energy efficient
The correlation between a composite score for how efficient each respondent thought
their home was with natural gas usage was -0.28, indicating that as homeowners’
perception of their home’s energy efficiency increased, natural gas usage tended to
decrease. However, the low strength of this correlation indicates that perhaps
homeowners’ perception of their home’s efficiency was not always an accurate

31
indicator of actual natural gas usage.
Additionally, the correlation between the composite energy efficiency perception score
and actual electricity usage was -0.05, which indicates a very weak relationship. This
suggests that while respondents tended to consider their electricity usage when
comparing themselves with their neighbors, they did not tend to consider electricity
usage when rating the overall energy efficiency of their home.
Environmental Views
Based on a varimax rotation analysis to determine which Likert scale responses tended
to correlate strongly with one another, we created a composite score to represent each
respondent’s general environmental sentiment by taking an average of their responses
for the following prompts:
● How much do the following factors influence the amount of energy you use –
Environmental concerns
● I go out of my way to protect the environment
● My actions affect the environment
● Caring for the environment is a moral and ethical duty
● I feel connected to the environment
The correlation between this composite score and actual natural gas usage was -0.13,
indicating that as respondents’ environmental sentiment increased, natural gas
consumption tended to slightly decrease. However, this variable was not significant in
the natural gas consumption model. Additionally, this correlation was much weaker
when considering electricity consumption (-0.08). These correlations and the lack of
significance in the energy consumption models indicate a relatively weak association
between self-reported environmental views and actual energy consumption.
Interaction with Habitat for Humanity
Households who stated that they received instructions on saving energy did tend to use
less natural gas per square foot than those who did not. We are 90% confident that
Habitat homes who reported receiving instructions on saving energy used between
0.01 and 0.15 CCF less natural gas per square foot on average than those who did not.
However, this variable was not significant when included in the natural gas
consumption model. Similarly, we are 90% confident that households who reported
32
receiving instructions on saving energy consumed between 213 and 2791 kWh less
electricity than households who did not. However, as with the natural gas model, this
variable was not significant in the electricity consumption model. This indicates that
homes who received instructions on saving energy tended use less energy. However, it
is not necessarily clear whether this relates to the effectiveness of the educational
intervention, or whether affiliates who specifically incorporate education on saving
energy are also more likely to install more energy efficient features in the homes they
build.
Other educational interventions did not indicate as strong of a difference in natural gas
or electricity consumption. The difference in means for both natural gas consumption
per square foot and electricity consumption was not statistically significant between
homes that stated that they received instructions before or after move-in and those
who did not. Similarly, the difference in means for energy consumption was not
significant for those who stated that they interacted with a family support partner
before or after move-in and those that did not. This indicates that of all the educational
interventions we queried, procedural instructions specifically on saving energy were
the most likely to be associated with actual energy savings in Habitat homes.
Linear Regression Model Results
To determine which factors household characteristics and behaviors had the greatest
effect on energy consumption and isolate key areas for intervention to reduce energy
usage, we produced a series of multiple linear regression models. For reference, results
for HFH partner family home heating, cooling, and appliance usage behavior can be
found in Appendix D.
First, we used data specifically for Habitat homes to model natural gas and electricity
consumption separately. Then, we combined the Habitat dataset with data on select
homes from the 2009 Residential Energy Consumption Survey (RECS) to create
separate natural gas and electricity consumption models that allowed us to compare
energy consumption in Habitat homes versus similar non-Habitat homes.
For each multiple linear regression model, we followed the same series of steps to
validate the model. First, we examined the F-statistic to determine whether at least one
independent variable included in the model had a statistically significant effect on the
energy consumption dependent variable. Using an alpha level of 0.1, we found that the
F-statistic for each model was significant.
33
Second, because each model included more than one independent variable, we
examined the Adjusted R Square to analyze how well the model explained overall
variation in the energy consumption dependent variable. Overall, some models did a
better job at explaining variation in the dependent variable than others. The meaning of
the Adjusted R Square for each model is discussed separately below.
Third, for each model, we examined the model residuals against each independent
variable to search for any signs that the model violated regression model assumptions.
Namely, we sought to verify that errors in each model were roughly normally
distributed with a mean of zero, that errors had a constant standard deviation for all
levels of the independent variables, and that the errors in the model were not
correlated. Therefore, we examined residual plots to ensure that the spread of the
residuals was roughly the same for all values of the independent variables and to verify
that there were not obvious signs of heteroskedasticity (where the variability of the
dependent variable is unequal across values of the independent variable) or
autocorrelation (where variability in the dependent variable follows a non-random
pattern). For each model described below, we did not find any obvious violations of
regression assumptions.
Finally, we examined the t-statistic for each independent variable included in the
models to determine whether each variable had a significant effect on the dependent
energy consumption variable. We used an alpha level of 0.1 to determine statistical
significance. We also build a 90% confidence interval around each coefficient to
estimate the possible effect size of each independent variable on the dependent
variable.
Habitat-Only Energy Consumption Models
We developed separate multiple linear regression models to explain natural gas and
electricity consumption in Habitat homes. For each model, we isolated energy usage by
season in order to determine key drivers of consumption during the highest usage
periods: winter for natural gas and summer for electricity. It also allowed us to compare
consumption across the rough age of construction among Habitat homes only to see if
energy consumption in older Habitat homes was different than that of new Habitat
homes.
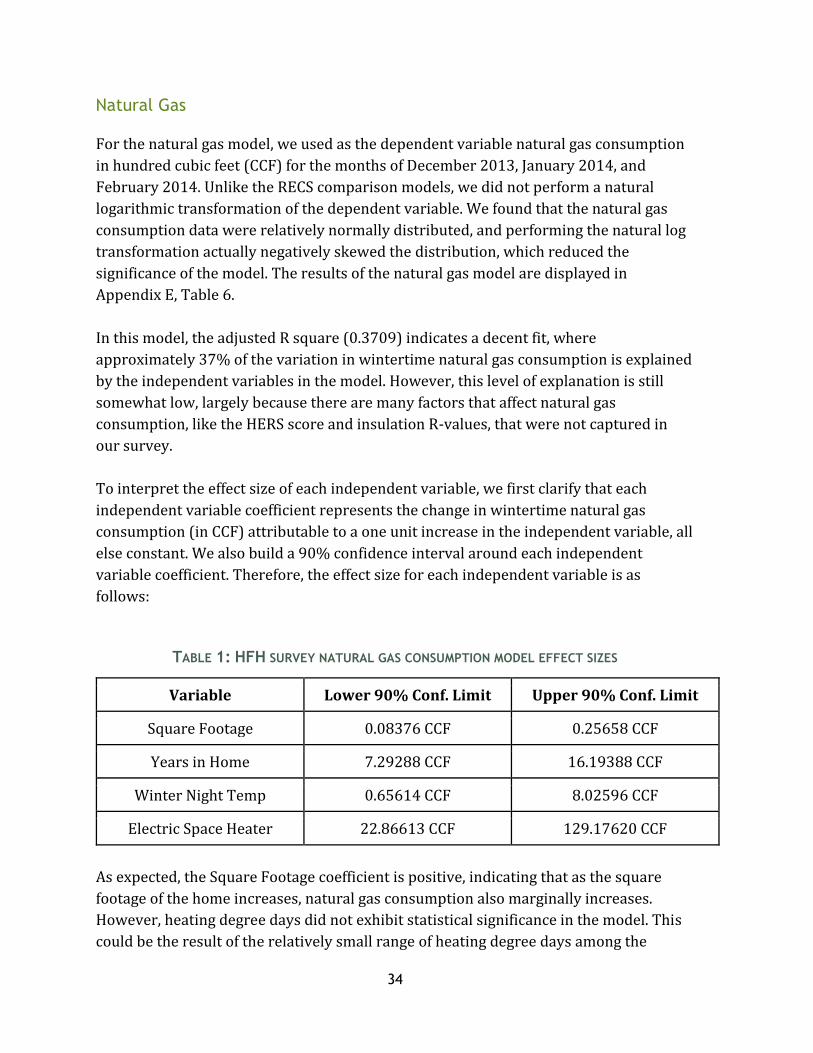
34
Natural Gas
For the natural gas model, we used as the dependent variable natural gas consumption
in hundred cubic feet (CCF) for the months of December 2013, January 2014, and
February 2014. Unlike the RECS comparison models, we did not perform a natural
logarithmic transformation of the dependent variable. We found that the natural gas
consumption data were relatively normally distributed, and performing the natural log
transformation actually negatively skewed the distribution, which reduced the
significance of the model. The results of the natural gas model are displayed in
Appendix E, Table 6.
In this model, the adjusted R square (0.3709) indicates a decent fit, where
approximately 37% of the variation in wintertime natural gas consumption is explained
by the independent variables in the model. However, this level of explanation is still
somewhat low, largely because there are many factors that affect natural gas
consumption, like the HERS score and insulation R-values, that were not captured in
our survey.
To interpret the effect size of each independent variable, we first clarify that each
independent variable coefficient represents the change in wintertime natural gas
consumption (in CCF) attributable to a one unit increase in the independent variable, all
else constant. We also build a 90% confidence interval around each independent
variable coefficient. Therefore, the effect size for each independent variable is as
follows:
TABLE 1: HFH SURVEY NATURAL GAS CONSUMPTION MODEL EFFECT SIZES
Variable Lower 90% Conf. Limit Upper 90% Conf. Limit
Square Footage 0.08376 CCF 0.25658 CCF
Years in Home 7.29288 CCF 16.19388 CCF
Winter Night Temp 0.65614 CCF 8.02596 CCF
Electric Space Heater 22.86613 CCF 129.17620 CCF
As expected, the Square Footage coefficient is positive, indicating that as the square
footage of the home increases, natural gas consumption also marginally increases.
However, heating degree days did not exhibit statistical significance in the model. This
could be the result of the relatively small range of heating degree days among the
35
Habitat homes included in our sample, or because our Habitat-only sample was
relatively small. We also did not find evidence that the number of household members
or having a basement or crawlspace had a significant effect on natural gas consumption.
This does not mean that we can conclude that the number of household members or the
inclusion of a basement or crawlspace does not have an effect on natural gas
consumption; it simply means that these variables were not found to be significant
when compared with other variables using a relatively small sample. However, it would
make sense that the number of household members would not have much of an effect
on natural gas consumption, since most gas usage is for space heating, which depends
much more on the size of the home than on the number of household members.
One interesting finding was that natural gas consumption tended to increase as the
number of years that the family had lived in the home increased. This indicates that
homes that were more recently completed by Habitat affiliates tended to consume less
natural gas, all else constant, than older Habitat homes. Unfortunately, it is not possible
to determine whether this effect is attributable to Habitat affiliates’ improvements over
time in making homes more energy efficient or simple deterioration in the energy
efficiency of homes over time. However, we can confidently say that there is not
evidence that Habitat affiliates’ experimentation with energy efficiency interventions
over time is hurting energy efficiency.
Actionable Findings
Our first actionable finding was that the winter nighttime thermostat setting had a
significant effect on natural gas consumption, more so than the daytime thermostat
setting. However, while we can confidently say that natural gas usage increases
significantly as the winter nighttime temperature setting increases, the effect size is not
terribly clear given the wide range in the confidence interval around the coefficient.
This effect size becomes clearer when leveraging observations from RECS alongside the
Habitat observations.
Thermostat settings are an especially critical recommendation given Habitat partner
families’ knowledge of the thermostats in their home. About 29% of survey respondents
either reported that their home did not have a programmable thermostat or that they
did not know whether their thermostat was programmable. Based on our affiliate
interviews in which nearly every affiliate self-reported that they installed
programmable thermostats in the homes that they build, we assume that many of the
respondents who stated that they did not have a programmable thermostat actually do
have a programmable thermostat, but perhaps do not know how to use the

36
programmable settings. Either way, these households are likely not taking full
advantage of the option to set their thermostats at lower temperatures when they are
away or sleeping. Average thermostat settings among HFH partner families are
represented graphically in Figure 10 below.
FIGURE 10: WINTER THERMOSTAT SETTINGS
Perhaps the most unexpected finding in the model was the effect of using an electric
space heater. We hypothesized that a potentially efficient use of an electric space heater
would be to keep the overall home at a slightly cooler temperature than desired while
using a space heater to only heat occupied rooms, thus offsetting natural gas
consumption with usage of a space heater. In this case, we would expect the coefficient
for the electric space heater variable to be negative. However, in the Habitat-only
model, we found that homes that used an electric space heater were actually likely to
use more natural gas, all else constant, than homes that did not. This indicates that these
homes are not using electric space heaters efficiently to offset natural gas usage, and
provides a point of intervention for Habitat affiliates. We found that about 22% of the
Habitat homes in the sample reported that they used electric space heaters and that
there was no evidence of a strong relationship between how long a family had lived in
their home and the likelihood of using an electric space heater.
Electricity
For the electricity consumption model for Habitat-only homes, we used electricity
consumption (in kilowatt hours, or kWh) during the months of June 2013 through
August 2013. We did not perform a natural logarithmic transformation of the
dependent variable because the electricity consumption data were roughly normally
70.06367.085 69.412
50.0
55.0
60.0
65.0
70.0
75.0
Daytime during thewinter when someone is
home
Daytime during thewinter when nobody is
home
Nighttime during thewinter
Degre
es
Fahre
nheit
At what temperature do you set your thermostat during the… (n=108)

37
distributed. Therefore, we interpret each independent variable coefficient as the change
in actual electricity consumption (in kWh) attributable to a one unit change in the
independent variable, all else constant. The results of this model are shown in Appendix
E, Table 7.
The adjusted R square indicates a decent level of fit for the model, where approximately
44% of the variation in the dependent variable is explained by the model parameters.
To determine the effect size for each independent variable, we built 90% confidence
intervals around each independent variable coefficients. These effect sizes are as
follows:
TABLE 2: HFH ELECTRICITY CONSUMPTION MODEL EFFECT SIZES
Variable Lower 90% Conf. Limit Upper 90% Conf. Limit
Time in Home 18.91036 kWh 120.212 kWh
TVs 183.7186 kWh 450.3546 kWh
CDD * Central AC 0.97041 kWh 2.41379 kWh
CDD * Window AC 0.945834 kWh 2.50176 kWh
Aquarium 490.3046 kWh 1556.209 kWh
Similar to the natural gas model, we found that as the number of years in the home
increased, electricity consumption also increased. Again, because we cannot isolate how
much of the increase in electricity consumption as the home ages is attributable to
improved energy efficiency interventions, like more efficient lighting and appliances,
versus simple deterioration of energy efficiency over time, we can only claim that
Habitat affiliates’ attempts to improve electricity conservation in homes are not having
a negative impact.
Many independent variables that we would expect to have had a significant effect on
electricity consumption did not exhibit significance in the Habitat-only model. This
includes the number of household members, the square footage of the home, and
presence of separate freezers, gaming systems, and dishwashers. This is likely
explained by three main factors. First, the sample size of the Habitat-only model is quite
small, which provides little power to isolate the effects of more than a few independent
variables. Second, the interquartile range for square footage and number of household
members is relatively narrow, providing little variation against which we could
examine differences in electricity consumption. Third, the Habitat-only model considers

38
summertime electricity usage as opposed to electricity consumption over an entire
year. This may amplify the effect of certain variables, like air conditioning, and crowd
out others, like separate freezers, since air conditioning is only likely to be used
significantly during summer months.
Surprisingly, we found that homes that had an aquarium were likely to consume much
more electricity than similar homes that did not. This may indicate a special
characteristic among Habitat homeowners, perhaps that those who are likely to own an
aquarium may be likely to own more than one, or are more likely to also perform
electricity-intensive activities like growing plants indoors. While it may be possible to
communicate the electricity costs associated with owning one or more aquariums to
Habitat partner families, we view this is a less promising area for intervention because
it would require Habitat partner families to significantly change behavior and give up
an important hobby rather than implementing a more convenient solution that
required a less drastic lifestyle change.
Actionable Findings
Unsurprisingly, we found that the number of TVs used in the home had a strong positive
effect on electricity consumption, although the effect size is somewhat unclear given the
wide range of the confidence interval around the coefficient. While it would be difficult
to convince Habitat households to stop using TVs altogether, it may be possible to help
households turn off their TVs more often when not in use. The average number of TVs
in Habitat homes was between 2.6 and 3.1.
To examine the effect of climate, we assumed that climate should only have a significant
effect on electricity consumption if air conditioning were installed in the home, since
fans use relatively little electricity. Therefore, we created an interaction variable to only
account for cooling degree days when either central or window air conditioning was
present in the home. Interestingly, the presence of both central and window air
conditioning were found to have a significant effect on electricity consumption. To
interpret these effect sizes, we use the example of a home in Lansing, Michigan. A home
near the Capital City Airport weather station experienced roughly 569 cooling degree
days from June through August 2013. Therefore, we would expect a home with central
air conditioning to have consumed between 552 and 1,373 kWh more than a similar
home that did not have air conditioning. A home with window air conditioning would
have consumed between 538 and 1,424 kWh more than a home without air
conditioning.
39
Because of the wide range of the confidence intervals around the coefficients for central
and window air conditioning, we could not determine whether there was a difference in
summertime electricity consumption between homes with central air conditioning or
homes with window air conditioning. However, this may indicate that instead of
installing expensive central air conditioning, it may be more cost-effective to consider
installing targeted window air conditioning units, particularly newer models that are
more energy efficient than older or less efficient models that Habitat households may
install on their own. We found that about 41% of the Habitat homes in the sample had
central air conditioning, while 26% of homes had window air conditioning. For the
homes that did not have central air conditioning, we found a positive correlation (0.32)
between the number of people in the home and the presence of window air
conditioning – that is, as the number of people in the home increased, the likelihood of
having window air conditioning tended to increase. A two-sample t test indicated that
we are 90% confident that the mean number of people was between 0.4 and 2.0 higher
in homes with window air conditioning than in homes with no air conditioning.
Habitat and Non-Habitat Comparison Models
In addition to analyzing energy consumption in Habitat homes, we also compared
consumption among Habitat homes to that of similar non-Habitat homes. As discussed
in the Methodology section above, we used microdata from the US EIA 2009 Residential
Energy Consumption Survey (RECS) to perform this comparison.
When the RECS data was combined with the Habitat data, we found that the data for
both natural gas and electricity consumption were positively skewed, so we used a
natural logarithmic transformation of each dependent variable to achieve a more
normal distribution. The natural logarithmic transformation of the dependent variable
also assisted with interpretability by making a one unit increase in the independent
variable equal to a (100 * independent variable coefficient) percentage change in the
dependent variable, as opposed to a one unit increase in the independent variable
representing an absolute change in the dependent variable.
Natural Gas
The combined natural gas model compares a year’s worth of natural gas usage (in CCF)
in Habitat homes (from year 2013) with that of similar RECS homes (from year 2009).
While it is not ideal to compare energy consumption from different time periods, we
feel confident in the model results given that we were able to control for climatic
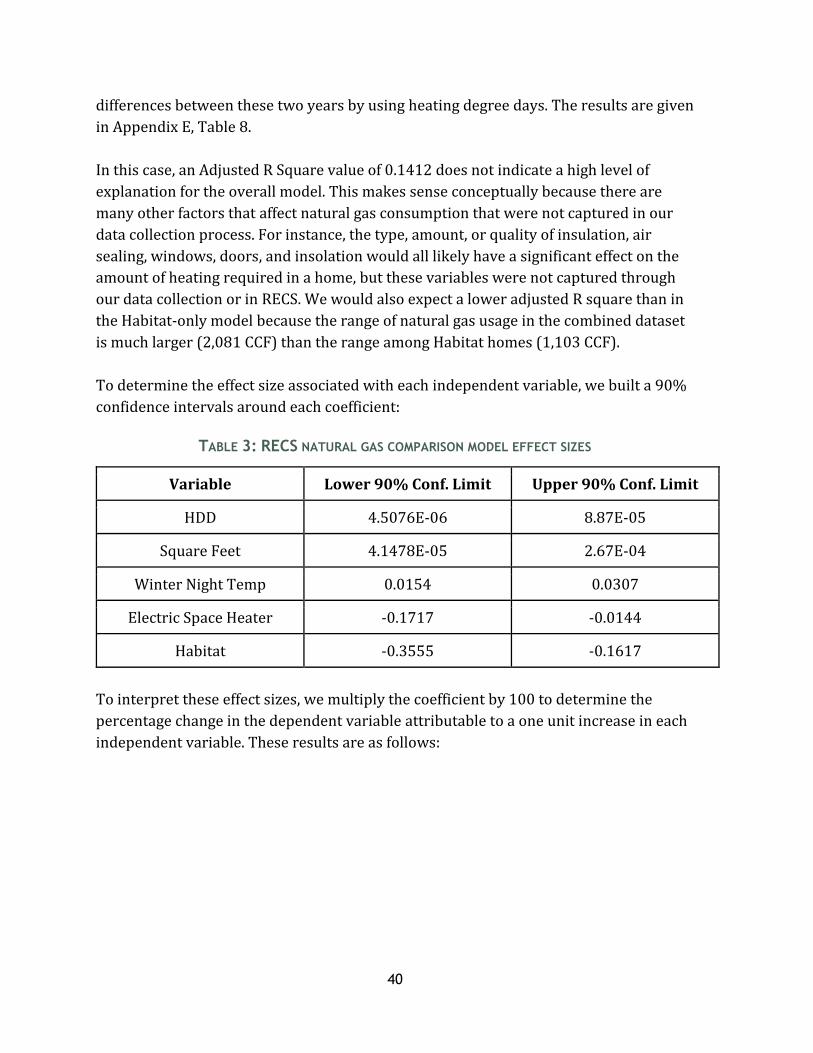
40
differences between these two years by using heating degree days. The results are given
in Appendix E, Table 8.
In this case, an Adjusted R Square value of 0.1412 does not indicate a high level of
explanation for the overall model. This makes sense conceptually because there are
many other factors that affect natural gas consumption that were not captured in our
data collection process. For instance, the type, amount, or quality of insulation, air
sealing, windows, doors, and insolation would all likely have a significant effect on the
amount of heating required in a home, but these variables were not captured through
our data collection or in RECS. We would also expect a lower adjusted R square than in
the Habitat-only model because the range of natural gas usage in the combined dataset
is much larger (2,081 CCF) than the range among Habitat homes (1,103 CCF).
To determine the effect size associated with each independent variable, we built a 90%
confidence intervals around each coefficient:
TABLE 3: RECS NATURAL GAS COMPARISON MODEL EFFECT SIZES
Variable Lower 90% Conf. Limit Upper 90% Conf. Limit
HDD 4.5076E-06 8.87E-05
Square Feet 4.1478E-05 2.67E-04
Winter Night Temp 0.0154 0.0307
Electric Space Heater -0.1717 -0.0144
Habitat -0.3555 -0.1617
To interpret these effect sizes, we multiply the coefficient by 100 to determine the
percentage change in the dependent variable attributable to a one unit increase in each
independent variable. These results are as follows:
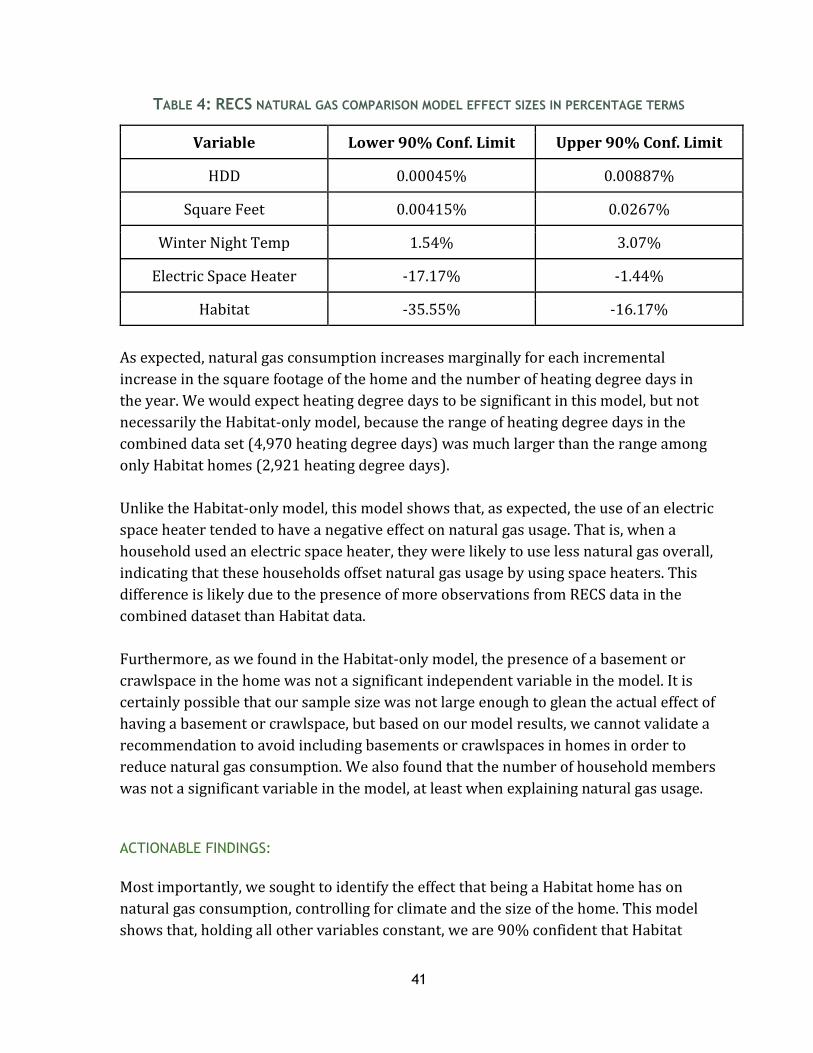
41
TABLE 4: RECS NATURAL GAS COMPARISON MODEL EFFECT SIZES IN PERCENTAGE TERMS
Variable Lower 90% Conf. Limit Upper 90% Conf. Limit
HDD 0.00045% 0.00887%
Square Feet 0.00415% 0.0267%
Winter Night Temp 1.54% 3.07%
Electric Space Heater -17.17% -1.44%
Habitat -35.55% -16.17%
As expected, natural gas consumption increases marginally for each incremental
increase in the square footage of the home and the number of heating degree days in
the year. We would expect heating degree days to be significant in this model, but not
necessarily the Habitat-only model, because the range of heating degree days in the
combined data set (4,970 heating degree days) was much larger than the range among
only Habitat homes (2,921 heating degree days).
Unlike the Habitat-only model, this model shows that, as expected, the use of an electric
space heater tended to have a negative effect on natural gas usage. That is, when a
household used an electric space heater, they were likely to use less natural gas overall,
indicating that these households offset natural gas usage by using space heaters. This
difference is likely due to the presence of more observations from RECS data in the
combined dataset than Habitat data.
Furthermore, as we found in the Habitat-only model, the presence of a basement or
crawlspace in the home was not a significant independent variable in the model. It is
certainly possible that our sample size was not large enough to glean the actual effect of
having a basement or crawlspace, but based on our model results, we cannot validate a
recommendation to avoid including basements or crawlspaces in homes in order to
reduce natural gas consumption. We also found that the number of household members
was not a significant variable in the model, at least when explaining natural gas usage.
ACTIONABLE FINDINGS:
Most importantly, we sought to identify the effect that being a Habitat home has on
natural gas consumption, controlling for climate and the size of the home. This model
shows that, holding all other variables constant, we are 90% confident that Habitat

42
homes, on average, consume between 16.17% and 35.55% less natural gas than similar
non-Habitat homes. This provides evidence that Habitat homes are significantly more
energy efficient in terms of natural gas consumption compared to non-Habitat homes,
and that the various energy efficiency interventions employed by affiliates around the
state are having a significant effect. However, it is important to keep in mind that
Habitat homes are significantly newer than non-Habitat homes. The median year built
for the RECS homes in the sample was 1955, while most of the Habitat homes in the
sample were built within the past 15 years. Including the year that the home was built
as an independent variable in the model in place of the Habitat dummy variable yields
similar results. It is thus possible that Habitat homes have simply experienced less
deterioration over time than the non-Habitat homes in the sample, and were not
actually constructed to be more energy efficient. While it would have been helpful to
compare natural gas usage in Habitat homes to that of other similar, newer homes,
these data were not available. However, given the results of our affiliate interviews, we
are reasonably confident that at least some of the energy efficiency improvements in
Habitat homes are directly leading to decreased natural gas consumption.
We also find that the winter nighttime thermostat setting has a strong effect on natural
gas consumption. Daytime winter thermostat settings were initially included in the
model, but did not have a significant effect. For each degree Fahrenheit increase in the
winter nighttime thermostat setting, we are 90% confident in a 1.54-3.07% increase in
natural gas consumption, all else constant. Additionally, we found through a two-
sample Welch’s comparison of means test that Habitat households, on average, set their
thermostats to higher temperatures at night during the winter than similar non-Habitat
homes. The mean winter nighttime thermostat setting for Habitat homes was 69.4
degree Fahrenheit, while the mean for non-Habitat homes was 67.0 degrees Fahrenheit.
We are 90% confident that Habitat homes’ winter nighttime thermostat settings are
between 1.4 degrees Fahrenheit and 3.4 degrees Fahrenheit higher than non-Habitat
homes.
Electricity
For the electricity model, we used as the dependent variable the natural logarithm of a
year’s worth of electricity consumption (in kWh) for Habitat homes (from year 2013)
and similar RECS homes (from year 2009). The results of this model can be found in
Appendix E, Table 9.
The adjusted R square indicates a decent level of fit where 47.61% of the variation in
the dependent variable is explained by the model. This adjusted R square is much

43
higher than that of the natural gas model. This is most likely the result of our data
including far more variables that would be likely to have an effect on electricity
consumption than natural gas consumption.
We also found that this model was far more robust than the electricity model we built
using only Habitat observations, in that a larger sample size allowed us to isolate the
effects of a larger number of independent variables. To determine the effect size of each
independent variable, we multiply the 90% confidence interval around each coefficient
by 100 to determine the percentage change in the dependent variable attributable to a
one unit change in each independent variable. These effect sizes are as follows:
TABLE 5: RECS ELECTRICITY COMPARISON MODEL EFFECT SIZES IN PERCENTAGE TERMS
Variable Lower 90% Conf. Limit Upper 90% Conf. Limit
Square Feet 0.0115% 0.0361%
Household Members 8.04% 8.63%
TVs 8.05% 14.45%
Separate Freezers 11.73% 26.67%
Printers 8.00% 24.06%
Gaming System 4.25% 21.47%
Dishwasher 2.75% 18.01%
Electric Space Heater 3.14% 20.73%
CDD * Central AC 0.0039% 0.0239%
Habitat -26.54% -5.35%
In this model, unlike the Habitat-only model, an increase in the number of household
members did increase electricity usage, all else constant. Conceptually, this makes
sense, since the presence of more people is most likely associated with increased
appliance, electronics, and lighting usage. Electricity usage also increases marginally
with an increase in the square footage of the home. This is most likely due to increased
lighting needs as the size of the home increases.
44
ACTIONABLE FINDINGS
Even after controlling for household characteristics and the presence of certain high-
consumption appliances, we found that Habitat homes, on average, used significantly
less electricity than non-Habitat homes, all other variables held constant. We are 90%
confident that being a Habitat home reduces electricity consumption by between 5.35%
and 26.54%. Based on our affiliate interviews, we found that Habitat affiliates tend to
have less control over the characteristics of the home that would affect electricity
consumption than those that would affect gas consumption. This is indicated by the
Habitat dummy variable having a smaller effect size for electricity consumption than
natural gas consumption. However, the electricity model provides evidence that the few
areas where Habitat can influence electricity consumption are leading to energy
savings. This includes installing energy efficient lighting, including a new refrigerator in
the home, and for some affiliates, including other energy efficient appliances like
washers, dryers, and dishwashers.
Interestingly, while we found no statistically significant effect of having window air
conditioning on electricity consumption, we did find a significant effect for central air
conditioning. The reason for this discrepancy between the Habitat model and the
comparison model is unclear. It is possible that examining only summertime electricity
usage in the Habitat model increases the importance of window air conditioning
relative to other variables more so than examining electricity usage over the entire
year. It is also possible that Habitat homeowners tend to have older, less energy
efficient window air conditioners than their non-Habitat counterparts.
To give an example of an interpretation of the CDD * Central AC interaction variable,
consider a home near the Capital Region Airport in Lansing, Michigan. The weather
station at Capital City Airport recorded 811 cooling degree days total during the year
2013. Multiplying 811 cooling degree days by the confidence interval around the
coefficient, we would be 90% confident that a home near Capital City Airport that has
central air conditioning would consume between 3.16% and 19.38% more electricity
during the year than the same home without central air conditioning.
When comparing air conditioning in Habitat homes with that in similar RECS homes, we
find that Habitat homes are much less likely than non-Habitat homes to have central air
conditioning. About 41% of Habitat homes in the sample had central air conditioning,
while 61% of the non-Habitat homes had central air conditioning. We are 90%
confident that between 10.30% and 30.00% fewer Habitat homes have central air
conditioning than non-Habitat homes. Interestingly, we found that the proportion of
Habitat homes with window air conditioning was very similar to the proportion of non-
45
Habitat homes with window air conditioning. About 26% of homes in each sample had
window air conditioning.
We also found statistically significant effects on electricity consumption for several
common household appliances and electronics. Those with the most verifiable effect
sizes are the number of separate freezers and the number of TVs used in the home.
Those with significant, but less precise effect sizes are whether or not a printer, gaming
system, dishwasher, or electric space heater are used in the home.
When comparing Habitat homes with similar RECS homes, we find that a similar
proportion of Habitat homes have one or more separate freezers as similar RECS
homes. The mean number of separate freezers among Habitat homes is 0.43, while the
mean among non-Habitat homes is 0.34. Using an alpha level of 0.1, this difference in
means is not statistically significant. Not surprisingly, the likelihood of owning at least
one extra freezer is positively correlated with the number of people in the home (0.42)
– that is, as the number of people increases, the likelihood of owning a separate freezer
increases.
The presence of at least one gaming system could be significant for several reasons.
First, gaming systems are likely to be left on even when not in use, consuming
significant “vampire” power. Second, when gaming systems are used, they are used in
combination with one or more televisions in the home, amplifying electricity
consumption. Third, the presence of a gaming system in the home is strongly correlated
with the presence of at least one child in the home. Among Habitat homes, about 68% of
respondents with children reported owning a gaming system, while only 26% of those
without children owned a gaming system. Based on qualitative survey responses, many
Habitat homeowners report having difficulty saving energy because their children are
not as careful in turning off lights and appliances. Whatever the reason, Habitat homes
were more likely to have at least one gaming system than non-Habitat households,
which makes sense given that Habitat homes are more likely to house children than
similar non-Habitat homes. About 54.95% of Habitat homes in the sample had at least
one gaming system, while about 34.69% of non-Habitat homes had at least one gaming
system. We are 90% confident that Habitat homes are between 10.4% and 30.2% more
likely than non-Habitat homes to use at least one gaming system.
Similarly, the number of printers used in the home could be significant for several
reasons. First, printers are likely to be left on all the time in standby mode, even when
not in use, which can consume significant vampire power. Second, a household owning
and using a printer in the first place may indicate a higher likelihood of working from a
home office than a household without a printer. In this case, someone may be home and
46
consuming electricity in other ways more often than a household where nobody works
from home. We found that Habitat homes are slightly less likely than non-Habitat
homes to use at least one printer. About 53.1% of Habitat homes in the sample had at
least one printer, while about 63.3% of non-Habitat homes had at least one printer. We
are 90% confident that Habitat homes are between 0.3% and 20.1% less likely than
non-Habitat homes to use at least one printer.
As for electric space heaters, a similar percentage of Habitat homes reported using
electric space heaters as non-habitat homes. About 22.1% of Habitat homes reported
using at least one electric space heater, while 24.5% of non-Habitat homes reported
doing so. The difference in these proportions was not statistically significant.

47
Discussion and Recommendations
Key Recommendations
Partner Family Survey
One of the key interests expressed by affiliates at the HOMES Green Building Summit in
January 2015 was the opportunity to access the survey online for distribution to other
current and future Habitat families. To this end, the SNRE partner family survey will be
prepared for online distribution to Habitat families and the complete survey
questionnaire will be available for Habitat affiliates to print and distribute as needed.
Internet Access and Connectivity
One surprising discovery from the partner family survey was the number of Habitat
families that report using the internet and social media at home. We recommend that
HFH affiliates leverage social media and email as a way to keep in touch with partner
families and create an online HFH community through which to share information
about activities, events, and home maintenance. A HFHM YouTube channel would be
one way that Habitat affiliates around the state could work together to create and share
basic home maintenance tutorial videos that could be passed on to partner families.
Videos such as, “How to change your air filters” or “How to install weather stripping”
could help families prepare for winter, complete basic maintenance, and otherwise stay
comfortable in their home. We believe that visual tutorials would be more successful in
helping families care for their home than a book-style manual that might be misplaced
or difficult to interpret.
Additionally, one method HFHM and affiliates could use to improve overall energy
efficiency of future projects would be to help new families set up an online bill-pay
account with their electric and gas utilities upon moving into the home. Instead of
trying to collect energy consumption information directly from utilities, which can be a
time- and resource-consuming process, families could opt to sign a waiver to share
their online utility accounts with their affiliate, giving the affiliate access to monitor and
compare historical energy consumption between homes. Keeping a waiver of this type
on file withaAffiliates would also serve to simplify future energy efficiency studies.
48
Thermostat Settings at Move-in
We have identified two ways that Habitat Affiliates can help families improve energy consumption by taking small actions when the family moves into the home. Based on the energy consumption analysis, one primary indicator of natural gas consumption was the family’s nighttime winter heat setting. While most homes are equipped with a programmable thermostat, we suspect that many families are unsure of how to program the thermostat, or when they initially program it, the nighttime temperature setting is unnecessarily high. We found evidence that Habitat families set their nighttime temperature settings significantly higher, on average, than non-Habitat families. Reducing thermostat settings through behavioral modifications will no doubt be difficult for partner families to adopt across the board. Instead, we recommend that, during the initial home walkthrough when families move into their homes, the HFHM affiliate representative use a double strategy of “social proof” (Allcott, 2011; Cialdini, 2001) and anchoring (Hammond, et al, 2006) for thermostat settings. Social proof has been leveraged by companies like OPOWER to show utility ratepayers how much electricity they use compared with other similar homes in their neighborhood, and has led to measurable reductions in electricity usage. Similarly, anchoring has also proven to be a common psychological heuristic, where initial impressions or estimates, however trivial, tend to anchor subsequent judgments. For instance, in countries that have an “opt-out” organ donation policy, where citizens must specifically request to be removed from the organ donation program, participation rates are orders of magnitude higher than in countries where organ donation participation is “opt-in” (Johnson and Goldstein, 2003). Specifically, after the representative provides instructions for the thermostat, he or she should tell the partner family at what temperature the “average family” sets their thermostat, and then set the thermostat for them at that moment. This will provide social proof that other similar households set their thermostat at a lower temperature, while also creating a default setting against which partner families will anchor their judgments on reasonable temperature settings. Finally, in future communications to partner families, affiliates can continue messaging to partner families what the “average” temperature settings are in similar homes. We also recommend that when teaching families about energy savings, Habitat Affiliates frame energy savings in terms of loss rather than gain (money lost due to energy efficiency compared to money saved with energy efficiency). Based on our research, environmental messaging is less effective in driving behavior change than money or societal pressures, and when considering money, framing equal financial risk in terms of losses rather than gains has a greater effect on human behavior (Kahneman and Tversky, 1984). When considering thermostat settings, it is therefore more effective to frame an increase in thermostat settings as a loss or cost rather than framing a reduction in thermostat settings as a gain or savings
49
Individual Actions
There are a number of actions that individual families could take that would likely help lower energy consumption within the home. Some of these might require some education on the part of Habitat Affiliates. One primary suggestion is to help families find ways to reduce hot water usage through behavior modifications (suggesting shorter showers, washing clothes in cold water, etc.). When implementing energy efficiency, it is important to be cognizant of the Jevons Paradox, also known as the Rebound Effect. This term refers to total energy usage increasing after energy efficiency techniques are implemented, as individuals perceive the extra efficiency as allowing for more consumption (Alcott, 2007). It is for this reason that technological innovations alone are insufficient to decrease energy consumption, and behavioral interventions are required as a necessary cornerstone.
Whole Family Inclusion on Energy Saving Education
Reducing energy usage can only be achieved if Habitat affiliates involve the partner families themselves in the conversation around energy savings. Along with talking about the purpose and methods of energy reduction, we suggest that affiliates provide training on home maintenance and energy saving for their partner families. Outreach was an area many affiliates admitted they could improve, and this is one area especially we see as a potential for tangible gains via interaction between the affiliate and partner families. Furthermore, the qualitative responses in our survey suggested that many partner families have difficulty saving energy because their children or teenagers do not turn off lights or electronics. Including the whole family in energy conservation training may help mitigate this problem.
Basements
Though it is currently HFHM’s policy to advise affiliates not to install basements, our study results found no statistically significant evidence that basements lead to more energy usage. This does not mean that we can conclusively state that basements have no effect on energy usage. Rather, based on our limited sample, the inclusion of a basement did not have a large enough effect size to be considered statistically significant when compared with other household characteristics. Furthermore, the qualitative responses on our survey revealed that families who currently have basements love them, and families who do not have basements often complain about lacking space for children to play and for storage. Therefore, given the general sentiment among Habitat families that basements are a desired characteristic of their homes, and the lack of evidence that excluding basements yields significant energy

50
savings, we suggest that HFHM reconsider their policy of recommending that affiliates avoid including basements if the primary reason for avoiding basements was to improve energy conservation.
Rehabbed Homes
Interestingly, we also found no significant difference in natural gas or electricity consumption between rehabbed homes and new builds. A difference was not apparent in either a comparison of means test or any of the linear regression models. Therefore, we cannot recommend one strategy over another in terms of energy consumption. Because rehabs may involve using less building material in total than new builds, there is potentially an argument to be made that the carbon intensity of the construction is smaller with rehabs than new builds, suggesting that affiliates should try to rehab homes whenever possible. However, this decision depends on the specific characteristics of the housing market in each affiliates’ service area. Those territories that have many recently foreclosed homes that are otherwise in decent condition are most suitable for rehabs, while territories without as much existing quality housing stock may still want to focus on new builds.
Windows and Doors
Doors and windows present key places where heat loss can occur within a home. Furthermore, qualitative evidence from our survey suggests that many Habitat families think their windows and doors are drafty and leaky. Therefore, we suggest that Habitat affiliates ensure the installation of durable, high-quality windows and doors, and that the construction manager of each affiliate closely oversee the installation of windows and doors in order to ensure proper technique and reduce risk of heat escaping.
Air Conditioning
HFHM has a long-term Climate Change Adaptation Strategy known as the Disaster Risk Reduction framework. With that in mind, HFHM should recognize that average temperatures in Michigan are likely to rise in the coming years, leading more partner families to install air conditioning units. Though it is not HFHM’s policy to install window unit AC, we found that 44% of partner families who did not have central AC installed window units themselves. In order to avoid partner families buying and installing cheaper and less efficient window AC units, we suggest that either HFHM look into the feasibility of changing their central air conditioning policy, or explore the possibility of lobbying HFHI to extend gift-in-kind partnerships for window units to Michigan and other temperate areas, as such policies are already in place in the southern US. Installing the best available technology will not only reduce energy costs,
51
but also reduce the likelihood that partner families will need to install a new unit on a regular basis in case of equipment failure.
Improved Efficiency over Time
Perhaps unsurprisingly, our quantitative analysis found that newer homes are more energy efficient. This is most likely the result of HFH affiliates’ improved building practices, including better insulation, use of CFL and LED lighting, and use of insulated concrete forms. While it is likely that some of this observed difference over time is the result of the deterioration of energy efficiency as homes age, our affiliate interviews revealed that HFH affiliates are using some of the best building practices for both new builds and retrofits, and continually work to learn new strategies and improve their current methodology. Our findings indicate that his experimentation is paying off in terms of average energy consumption.
Space Heaters
The statistical analysis revealed that space heaters possess a positive coefficient for both electric and natural gas usage, indicating that Habitat partner families, on average, are not using space heaters efficiently to selectively heat one room while keeping the rest of the house cooler. Therefore, a greater preponderance of space heaters implies a higher level of total energy usage in partner family homes. Overall, it is more energy efficient to simply raise the temperature of central heating, particularly in the small homes that Habitat affiliates build. Leveraging loss aversion, we recommend that HFH affiliates frame this consequence in terms of losses, rather than savings, when educating partner families about this result. Effectively, HFH affiliates should state using space heaters leads to financial losses and energy waste.
Stand-alone Freezers
In general, separate freezers correlated to much higher energy usage. For families of four or more, it is not recommended that HFH affiliates try to motivate them not to buy this extra freezer, as a larger family likely values the extra space and convenience and the extra energy usage is mild on a per capita basis. Instead, HFHM should focus on telling smaller families that they will lose money by buying a separate freezer.
Smart Power Strips
Smart Power Strips offer an appealing alternative for partner families to reduce energy usage. One of our study’s key findings was that houses with gaming systems tended to display significantly higher energy usage. We postulate that part of this result may
52
derive from individuals not turning off gaming systems and other television accessories, or leaving them in standby mode, which still drains power via “vampire loads” (NREL, 2013). To address this problem, we suggest that HFH affiliates either supply or encourage partner families to purchase Smart Power Strips. These devices are utilized to reduce energy usage by automatically turning off multiple appliances plugged into them when certain criterion is fulfilled. In particular, we recommend HFHM pursue Master-Controlled Power strips, which function by having a “master plug” into which the main appliance, usually the television, is plugged in. When the device plugged into the “master plug” is turned off, all the other appliances connected to the Smart Power Strip, like gaming systems, cable boxes, and stereos, are immediately turned off (NREL, 2013). This way, simply by a family member turning off the television, other devices will be turned off, offering a simple, yet effective, way of saving energy without requiring significant behavior change. Fortunately, these devices are relatively inexpensive, usually costing around $30. HFHM and HFHI could also work with companies like Schneider Electric and Belkin to secure master-controlled Smart Power Strips as gift-in-kind, and supply them to homeowners when they move into the house. This would help mitigate energy waste, especially in households with children, which were more likely to have gaming systems and, consequently, higher electricity usage.
Partner Families as First-Time Homeowners
During our affiliate interviews, most HFHM affiliates reported that the majority of their partner families are “first time homeowners.” HFHM should consider providing training on home maintenance and repairs that a landlord would have performed in rental housing.
For example, some affiliates mentioned that several of their partner families had never used a lawnmower before. This speaks to the necessity of proper instructions for partner families so that they can best maintain their home. As a result, affiliate outreach and education programs are of paramount importance.
Small Affiliate Concerns
During the affiliate interview phase of our project, smaller affiliates often expressed concerns regarding the implementation of recommendations, both from our project and HFHM in general. Barry County, in particular, expressed concerns about the ability to implement recommendations.
53
However, the strategies recommended in this report are relatively low-cost, and most interventions rely on education rather than advanced and expensive building techniques. This suggests that these strategies can be used by affiliates of all sizes, not just those who have building science experts in-house or benefit from strong budgets and high appraisal values. One of our project goals was to draft a scalable plan, and we believe our suggestions can and will be successfully implemented by HFH affiliates regardless of size.
Affiliate Mentoring
Building off the aforementioned concerns of smaller affiliates, partnerships and mentoring between affiliates is recommended. Under this schema, larger affiliates with more resources can work with smaller affiliates to share strategies, expertise, and perhaps even manpower for both new construction and rehabilitation projects. Knowledge sharing is already a key attribute within HFHM, as evidenced by events such as the annual HOMES Conference. Thus, mentoring provides the next step in the framework and will allow for best practices to be taught and utilized more extensively across HFHM.
Future SNRE Masters Projects
After our excellent experience working with HFHM and Michigan affiliates, our team confidently recommends that SNRE continue the partnership for future masters projects. We have identified a number of areas for further exploration.
Long-term Effect of Habitat Homes Entering a Community
Little research has been conducted on the long-term effect of Habitat homes entering a neighborhood. Anecdotal evidence from some of our affiliate interviews pointed to neighborhoods improving in social and economic outlooks after their arrival, as these newly constructed or renovated houses inspired those already living there to upgrade or take better care of their own homes. GIS analysis could form a key piece of this investigation, as it would all for geospatial analysis and comparisons of neighborhood change over time.
Solar Photovoltaics (PV)
During our affiliate interviews, a number of affiliates expressed interest in implementing solar PV. Regrettably, we did not have enough time to investigate this possibility during our study. However, future investigations could certainly research solar PV and determine whether it makes sense for HFHM.
54
Solar PV prices have dropped significantly in recent years, and federal tax credits, such as the Investment Tax Credit, can aid in the affordability of these systems. However, while solar systems are low-maintenance, monitoring and regular maintenance is key to ensure their proper functioning. Additionally, the Investment Tax Credit is set to expire at the end of 2016, which may significantly hurt the economics of installing solar PV. Community-owned solar PV systems is one area of potential interest. In this schema, residents in a community each buy into a locally sited solar farm, and each receive a portion of the power generated. This option may be more appealing than rooftop solar PV installed on individual homes because larger solar installations benefit from economies of scale and reduced installation costs on a per-watt basis. This may be an option worth investigating.
Improved Energy Consumption Data Collection
Though our study did collect a significant amount of energy consumption data, there is certainly room for improvement. Collecting more granular energy usage data, and comparing said data to similar non-Habitat homes, would lead to a more detailed and comprehensive analysis. Using a building energy analysis platform, such as the CleaRESULT platform, may form a useful cornerstone of this analysis.
Financial Case for Partner Families
Determining an ideal financial mix for families presents another area meriting investigation and study. Balancing both energy efficiency investments with mortgage and other bills would form useful result to help HFH affiliates identify the most cost-effective energy efficient building techniques and improve the financial stability of partner families. Additionally, a project team could examine creative financing approaches that affiliates could utilize to increase upfront investment in energy efficiency in the homes they build and renovate.
Conclusion
Although this project is primarily focused on HFHM, the findings could also be valuable
for affiliates throughout HFHI. As the largest of the 25 SSOs, HFHM is well positioned to
have a powerful bottom-up effect on HFHI. In general, SSOs tend to be much more
nimble, moving quickly and exploring new opportunities ranging from novel sources of
capital to advanced building technologies. The HOMES Green Building Summit in
January 2015 served as an opportunity to discuss preliminary findings of the study and
55
work with HFH affiliates on a broad level; this experience made it clear that HFHM
possesses the infrastructure, skill sets, desire, and drive to pursue energy efficiency
strategies comprising both technological and behavioral modifications.
Additionally, HFH is the sixth largest homebuilder in the United States. Actions Habitat
takes to improve the sustainability and energy efficiency of the homes it builds and
renovates will likely reverberate throughout the affordable housing community.
Therefore, while our deliverables are aimed specifically at affiliates and the SSO in
Michigan, we hope that our research will serve to enlighten other efforts to improve
sustainability in affordable housing outside of Habitat.
We also hope that these results can influence for-profit construction outside of HFH.
Generally speaking, for-profit builders tend to be less concerned about the efficiency of
their projects and more focused on the income they generate and the satisfaction of the
future homeowner. Considering this fact, it is not surprising that these individuals are
hesitant to implement new energy efficient technologies, particularly if the value of
those technologies is not adequately reflected in home appraisals. Not only can these
alternatives be more expensive but, since their reliability is often unknown, they are
considered an unnecessary risk yielding no benefit to the builder. HFH provides a
unique arena where these new technologies can be proven so builders feel more
confident using them and homeowners are more likely to specifically request them.
Ultimately, we hope that the results of our research inform practices that are
implemented to improve the sustainability and energy efficiency of affordable housing
in a cost-effective manner. While we hope to fulfill the needs of our direct client, we
hope that Habitat affiliates around Michigan, as well as other organizations that provide
affordable housing, can use the strategies we recommend to improve the quality of life
of the families they serve as well as limit negative environmental externalities
associated with fossil fuel combustion.
Finally, we hope that our research can help identify other potential areas for
improvement in terms of sustainability in affordable housing. Energy efficiency is but
one piece of the puzzle, and Habitat affiliates could likely benefit from research on
strategies to improve indoor air quality and health, ensure the sustainability of Habitat
building materials and supplies, and improve the efficiency of Habitat operations, to
name a few other key areas of potential improvement.
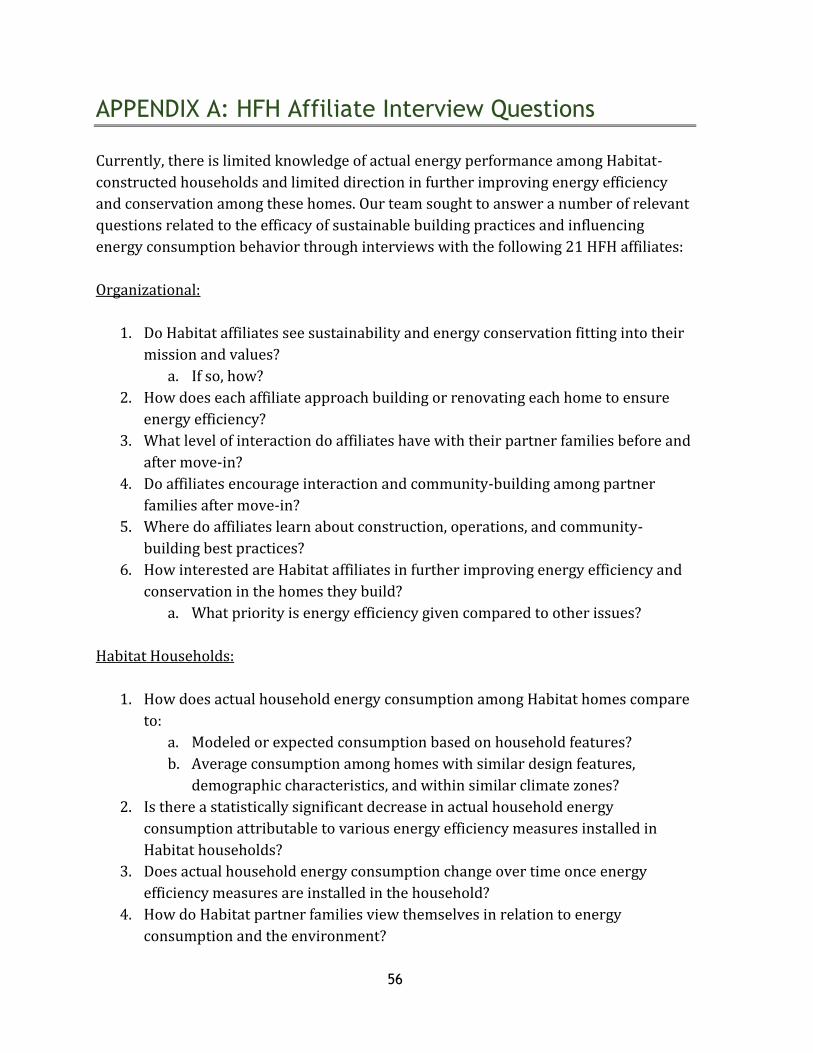
56
APPENDIX A: HFH Affiliate Interview Questions
Currently, there is limited knowledge of actual energy performance among Habitat-
constructed households and limited direction in further improving energy efficiency
and conservation among these homes. Our team sought to answer a number of relevant
questions related to the efficacy of sustainable building practices and influencing
energy consumption behavior through interviews with the following 21 HFH affiliates:
Organizational:
1. Do Habitat affiliates see sustainability and energy conservation fitting into their
mission and values?
a. If so, how?
2. How does each affiliate approach building or renovating each home to ensure
energy efficiency?
3. What level of interaction do affiliates have with their partner families before and
after move-in?
4. Do affiliates encourage interaction and community-building among partner
families after move-in?
5. Where do affiliates learn about construction, operations, and community-
building best practices?
6. How interested are Habitat affiliates in further improving energy efficiency and
conservation in the homes they build?
a. What priority is energy efficiency given compared to other issues?
Habitat Households:
1. How does actual household energy consumption among Habitat homes compare
to:
a. Modeled or expected consumption based on household features?
b. Average consumption among homes with similar design features,
demographic characteristics, and within similar climate zones?
2. Is there a statistically significant decrease in actual household energy
consumption attributable to various energy efficiency measures installed in
Habitat households?
3. Does actual household energy consumption change over time once energy
efficiency measures are installed in the household?
4. How do Habitat partner families view themselves in relation to energy
consumption and the environment?

57
5. How do individual and family consumption behaviors affect the actual energy
consumption of Habitat households?
a. Which behaviors have the highest impact?
b. Which educational and behavior-change interventions can be combined
in a context-appropriate way to achieve maximum energy consumption
reductions?
6. What is the observed average cost-effectiveness of existing energy-efficiency
measures in Habitat households?
7. What non-construction practices performed by Habitat affiliates, including
homeowner trainings and volunteer support, have a statistically significant
impact on household energy consumption?
8. Do Habitat partner families feel closely connected to their affiliates, their
neighbors, and other Habitat partner families?
9. Can social modeling, including utilizing descriptive and injunctive norms related
to energy consumption, be an effective strategy for encouraging energy
conservation among Habitat households?
Best Practices and Strategy:
1. Can new energy efficiency and renewable energy technology interventions
further reduce consumption in Habitat households in a cost-effective manner?
a. If so, which technologies are most appropriate?
2. Can strategies aimed at encouraging energy conservation, as opposed to
installing energy efficiency equipment, be pursued in a way that respects the
independence and autonomy of Habitat partner families?
3. What are the most effective educational and behavioral interventions for
reducing residential energy consumption?
4. Can strategies to improve energy efficiency and conservation also improve home
comfort and health?
5. Are there available funding sources for energy efficiency improvements that are
not currently being utilized by Habitat affiliates?
6. What kinds of administrative resources would be necessary to further improve
energy efficiency and conservation among Habitat households?
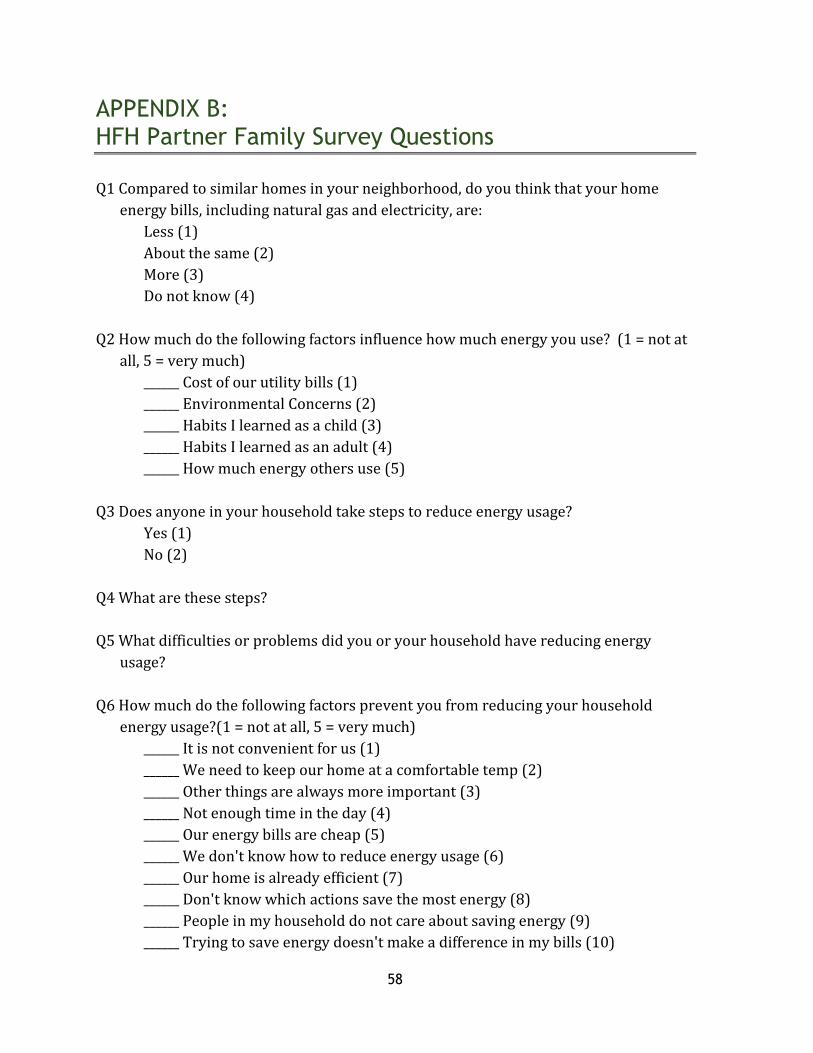
58
APPENDIX B: HFH Partner Family Survey Questions
Q1 Compared to similar homes in your neighborhood, do you think that your home
energy bills, including natural gas and electricity, are:
Less (1)
About the same (2)
More (3)
Do not know (4)
Q2 How much do the following factors influence how much energy you use? (1 = not at
all, 5 = very much)
______ Cost of our utility bills (1)
______ Environmental Concerns (2)
______ Habits I learned as a child (3)
______ Habits I learned as an adult (4)
______ How much energy others use (5)
Q3 Does anyone in your household take steps to reduce energy usage?
Yes (1)
No (2)
Q4 What are these steps?
Q5 What difficulties or problems did you or your household have reducing energy
usage?
Q6 How much do the following factors prevent you from reducing your household
energy usage?(1 = not at all, 5 = very much)
______ It is not convenient for us (1)
______ We need to keep our home at a comfortable temp (2)
______ Other things are always more important (3)
______ Not enough time in the day (4)
______ Our energy bills are cheap (5)
______ We don't know how to reduce energy usage (6)
______ Our home is already efficient (7)
______ Don't know which actions save the most energy (8)
______ People in my household do not care about saving energy (9)
______ Trying to save energy doesn't make a difference in my bills (10)
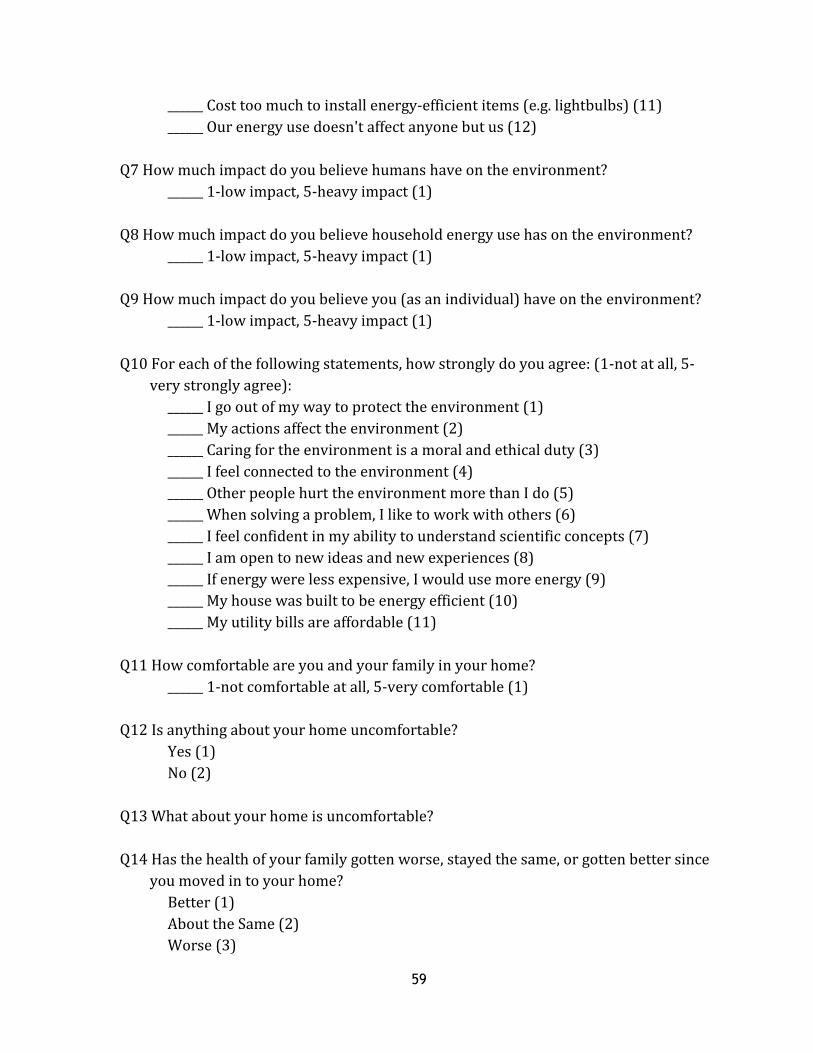
59
______ Cost too much to install energy-efficient items (e.g. lightbulbs) (11)
______ Our energy use doesn't affect anyone but us (12)
Q7 How much impact do you believe humans have on the environment?
______ 1-low impact, 5-heavy impact (1)
Q8 How much impact do you believe household energy use has on the environment?
______ 1-low impact, 5-heavy impact (1)
Q9 How much impact do you believe you (as an individual) have on the environment?
______ 1-low impact, 5-heavy impact (1)
Q10 For each of the following statements, how strongly do you agree: (1-not at all, 5-
very strongly agree):
______ I go out of my way to protect the environment (1)
______ My actions affect the environment (2)
______ Caring for the environment is a moral and ethical duty (3)
______ I feel connected to the environment (4)
______ Other people hurt the environment more than I do (5)
______ When solving a problem, I like to work with others (6)
______ I feel confident in my ability to understand scientific concepts (7)
______ I am open to new ideas and new experiences (8)
______ If energy were less expensive, I would use more energy (9)
______ My house was built to be energy efficient (10)
______ My utility bills are affordable (11)
Q11 How comfortable are you and your family in your home?
______ 1-not comfortable at all, 5-very comfortable (1)
Q12 Is anything about your home uncomfortable?
Yes (1)
No (2)
Q13 What about your home is uncomfortable?
Q14 Has the health of your family gotten worse, stayed the same, or gotten better since
you moved in to your home?
Better (1)
About the Same (2)
Worse (3)
60
Do not know (4)
Q15 What do you like most about your home?
Q16 What do you dislike most about your home?
Q17 For each of the following statements, check how strongly you agree (1-not at all, 5-
very strongly agree):
______ Habitat for Humanity prepared me to maintain my home (1)
______ HFH taught me how to use the important features of my home (2)
______ I feel confident in my ability to make small repairs around my home (3)
______ I have a strong relationship with my neighbors and my community (4)
______ I have a strong relationship with other HFH families in my area (5)
______ I stay in contact with people who work or volunteer for HFH (6)
Q18 Did Habitat for Humanity provide any of the the following? (Check all that apply)
Instruction on the features of my home before move in (1)
Instruction on the features of my home after move in (2)
Instruction on repairing and maintaining my home (3)
Instruction on saving energy in my home (4)
Home maintenance and repair manual (5)
Assigned family support partner BEFORE move in (6)
Assigned family support partner AFTER move in (7)
Q19 How often do you use each of the following (never, less than once per week, at least
once per week, every day, more than one hour a day):
Never (1) Less than
Once a
Week (2)
About Once
A Week (3)
Every day
(4)
More than
one hour a
day (5)
Internet (1)
Smart Phone
Applications
"Apps" (2)
Email (3)
Skype, FaceTime,
etc. (4)
Social Media like
Facebook,
Twitter, etc. (5)
61
Q20 Is the thermostat in your home programmable?
Yes (1)
No (2)
Do not know (3)
Q21 At what temperature does your household set your thermostat during the...
Answer in Degrees Fahrenheit (1)
Daytime during the winter when
someone is home (1)
Daytime during the winter when nobody
is home (2)
Nighttime during the winter (3)
Q22 Does your home have air-conditioning?
Yes (1)
No (2)
Q23 What kind of air-conditioning?
Central (1)
Window Units (2)
Q24 At what temperature does your household set your thermostat during the...
Answer in Degrees Fahrenheit (1)
Daytime during the summer when
someone is home (1)
Daytime during the summer when
nobody is home (2)
Nighttime during the summer (3)
Q44 How many window AC units do you use?
Q25 How many of each of the following types of refrigerators do you use in your home?
If none, please enter “0”.

62
Number of Refridgerators (1)
Half-size/compact/mini (1)
Full Size (2)
Stand-alone upright freezer (3)
Stand-alone chest freezer (4)
Q26 How many televisions does your household use? If none, please enter “0”.
Q27 How many times per week does your household use each of the following
appliances? If you don’t own or never use the appliance listed, please enter “0”.
Number of Uses per Week (1)
Stove/Oven (1)
Microwave/toaster (2)
Clothes Washer (3)
Clothes Dryer (4)
Dishwasher (12)
Coffee Maker (5)
Power Tools (6)
Portable Space Heater (7)
Window Air-Conditioning Unit (8)
Dehumidifier (9)
Sun Lamp (10)
Gaming Systems (11)
Q29 Does your household use any of the following items?
Cable Box (1)
DVR (2)
Stereo and speakers (3)
Computer (4)
Printer (5)
Internet Modem/router (6)
Electric space heater (7)
63
Aquarium with lamp (8)
Other major appliance (9)
Q45 How many computers?
Q46 What other major appliance?
Q30 How often do you unplug appliances and chargers after use?
Never (1)
Rarely (2)
Sometimes (3)
Often (4)
Very Often (5)
Q31 How often are the lights left on in unoccupied rooms?
Never (1)
Rarely (2)
Sometimes (3)
Often (4)
Very Often (5)
Q32 Does your household own a clothes washer?
Yes (1)
No (2)
Q33 How often is the hot water setting used?
Never (1)
Rarely (2)
Sometimes (3)
Often (4)
Very Often (5)
Q34 Does your household own a dishwasher?
Yes (1)
No (2)
Q35 How often do you use the “dry” setting?
Never (1)
Rarely (2)
Sometimes (3)

64
Often (4)
Very Often (5)
Q36 Demographic Info:
Answer (1)
How many people live in your household
(including yourself)? (1)
How old were you on your last birthday?
(2)
What is the age of the oldest resident
living in your household? (3)
What is the age of the youngest resident
living in your household? (4)
How long have you lived in your current
house? (5)
Q39 What is the gender of your head of household?
Female (1)
Male (2)
Q40 What is the race of your head of household?
American Indian or Alaskan Native (1)
Asian or Pacific Islander (2)
Black (3)
White (4)
Other (5)
Q47 Other (please specify):
Q41 Is your head of household Hispanic or Latino/Latina?
Yes (1)
No (2)
Q42 Does your household speak a language other than English at home?
Yes (1)
No (2)
Q43 What language(s)?

65
APPENDIX C: Example Utility Customer Authorization Form
Consumers Energy
Customer Authorization Form Customer Authorization, Release and Disclaimer Form
Date*
Service Customer Name*
Service Address* Service City* State* Zip Code*
Primary Phone*
Account Number
*Fields with an asterisk (*) are required.
The University of Michigan – School of Natural Resources & Environment or its affiliated researchers (“UM-
SNRE”) will be performing an energy consumption survey of homes owned by Habitat for Humanity partner
families (“Survey”) in order to assess the home energy performance of Habitat for Humanity affiliates. In order to
maximize the effectiveness of the Survey, Consumers Energy will provide to UM-SNRE a limited amount of your
historic energy consumption data (“Energy Consumption Data”). As consideration for the Survey, you shall sign
this form agreeing to all the terms and conditions listed below:
I certify that I am the owner or occupant (or the owner’s or occupant’s authorized representative) of the above
property, and I am authorized to approve the Survey. By my signature below, I provide Consumers Energy with
permission to share my Energy Consumption Data with UM-SNRE for purposes of the Survey.
DISCLAIMER AND LIMIT OF LIABILITY: I UNDERSTAND AND AGREE THAT CONSUMERS ENERGY DOES
NOT WARRANT IN ANY WAY THE SERVICES PROVIDED IN CONNECTION WITH THE SURVEY AND THAT
ALL SUCH SERVICES SHALL BE ACCEPTED “AS IS” WITH RESPECT TO CONSUMERS ENERGY. IN NO
EVENT WILL CONSUMERS ENERGY BE LIABLE, WHETHER IN CONTRACT, TORT (INCLUDING
NEGLIGENCE), STRICT LIABILITY, WARRANTY OR OTHERWISE FOR ANY DAMAGES WHATSOEVER,
INCLUDING BUT NOT LIMITED TO, DIRECT, SPECIAL, INCIDENTAL OR CONSEQUENTIAL DAMAGES,
CONNECTED WITH OR RESULTING FROM THE SURVEY.
I further acknowledge and understand that it is necessary for Consumers Energy to share my Energy
Consumption Data with UM-SNRE to facilitate the optimization of data collection in the Survey. Therefore, I
agree with the following:
_______ (Mark “X”) I hereby give Consumers Energy permission to share my Energy Consumption Data with
UM-SNRE for purposes of the Survey.
Accordingly, I hereby release, hold harmless and discharge Consumers Energy, its agents, officers, directors,
shareholders, employees, contractors, affiliates, successors in interest and assigns from and against any and all
claims of whatever nature arising in connection with or associated with the Survey or with the sharing of my
Energy Consumption Data.
Signature of Owner/Occupant/Representative: __________________________________________
Printed Name: ____________________________________
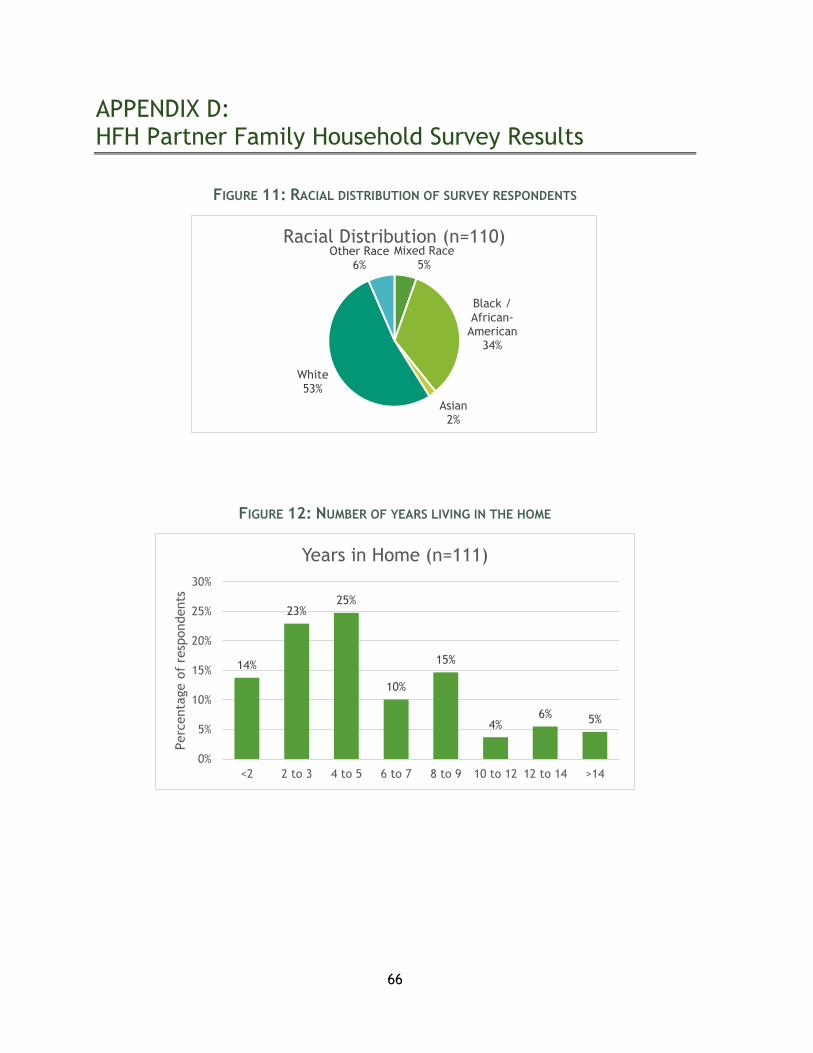
66
APPENDIX D: HFH Partner Family Household Survey Results
FIGURE 11: RACIAL DISTRIBUTION OF SURVEY RESPONDENTS
FIGURE 12: NUMBER OF YEARS LIVING IN THE HOME
Mixed Race5%
Black / African-
American34%
Asian2%
White53%
Other Race6%
Racial Distribution (n=110)
14%
23%25%
10%
15%
4%6% 5%
0%
5%
10%
15%
20%
25%
30%
<2 2 to 3 4 to 5 6 to 7 8 to 9 10 to 12 12 to 14 >14
Perc
enta
ge o
f re
spondents
Years in Home (n=111)
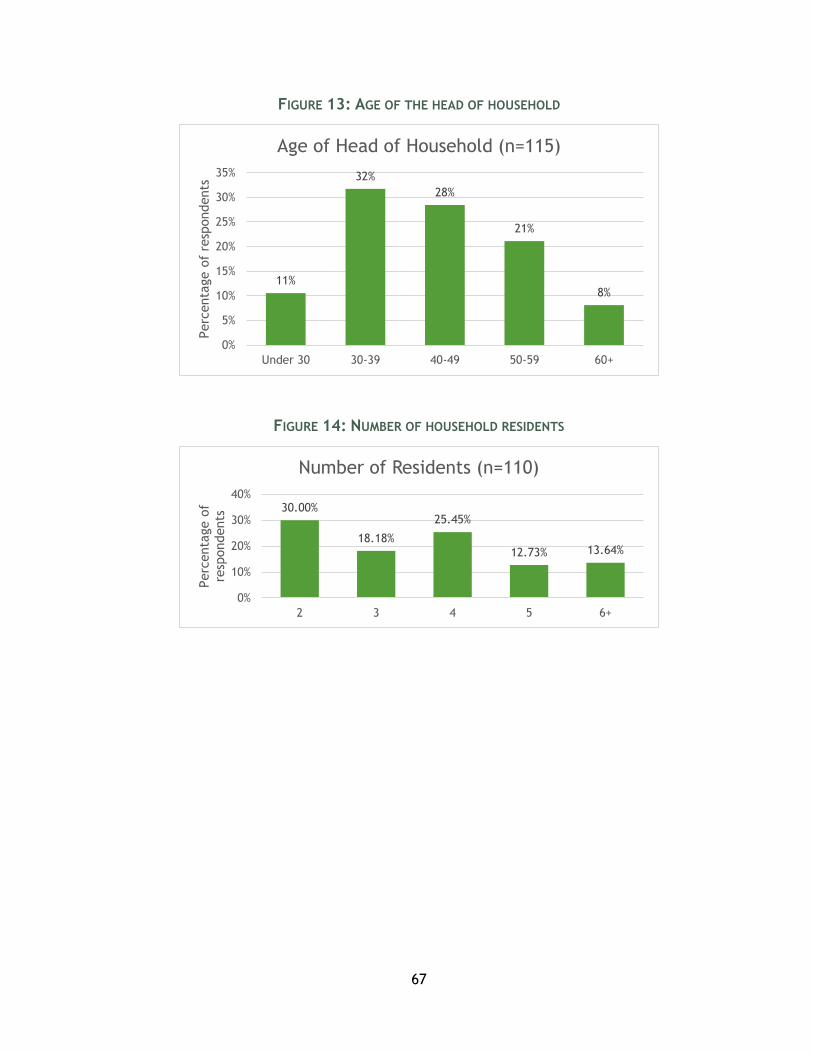
67
FIGURE 13: AGE OF THE HEAD OF HOUSEHOLD
FIGURE 14: NUMBER OF HOUSEHOLD RESIDENTS
11%
32%
28%
21%
8%
0%
5%
10%
15%
20%
25%
30%
35%
Under 30 30-39 40-49 50-59 60+
Perc
enta
ge o
f re
spondents
Age of Head of Household (n=115)
30.00%
18.18%
25.45%
12.73% 13.64%
0%
10%
20%
30%
40%
2 3 4 5 6+
Perc
enta
ge o
f re
spondents
Number of Residents (n=110)
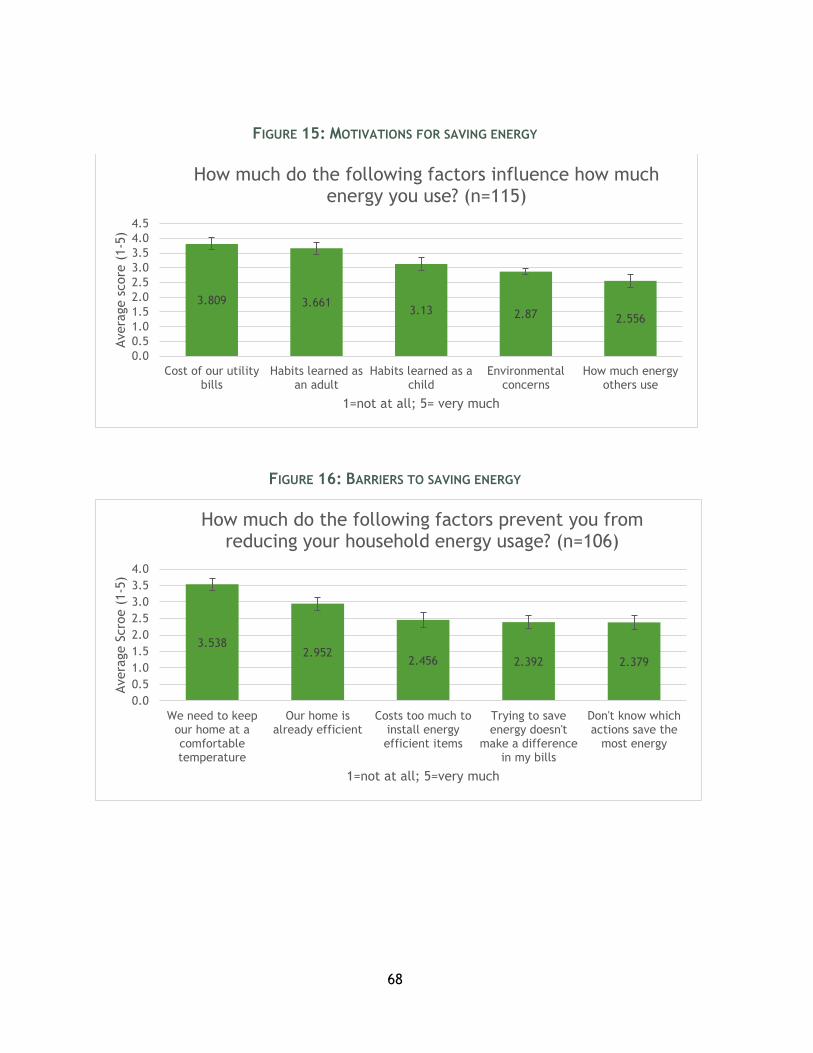
68
FIGURE 15: MOTIVATIONS FOR SAVING ENERGY
FIGURE 16: BARRIERS TO SAVING ENERGY
3.809 3.6613.13 2.87 2.556
0.0
0.5
1.0
1.5
2.0
2.5
3.0
3.5
4.0
4.5
Cost of our utilitybills
Habits learned asan adult
Habits learned as achild
Environmentalconcerns
How much energyothers use
Avera
ge s
core
(1-5
)
1=not at all; 5= very much
How much do the following factors influence how much energy you use? (n=115)
3.5382.952
2.456 2.392 2.379
0.0
0.5
1.0
1.5
2.0
2.5
3.0
3.5
4.0
We need to keepour home at acomfortabletemperature
Our home isalready efficient
Costs too much toinstall energyefficient items
Trying to saveenergy doesn't
make a differencein my bills
Don't know whichactions save the
most energy
Avera
ge S
cro
e (
1-5
)
1=not at all; 5=very much
How much do the following factors prevent you from reducing your household energy usage? (n=106)
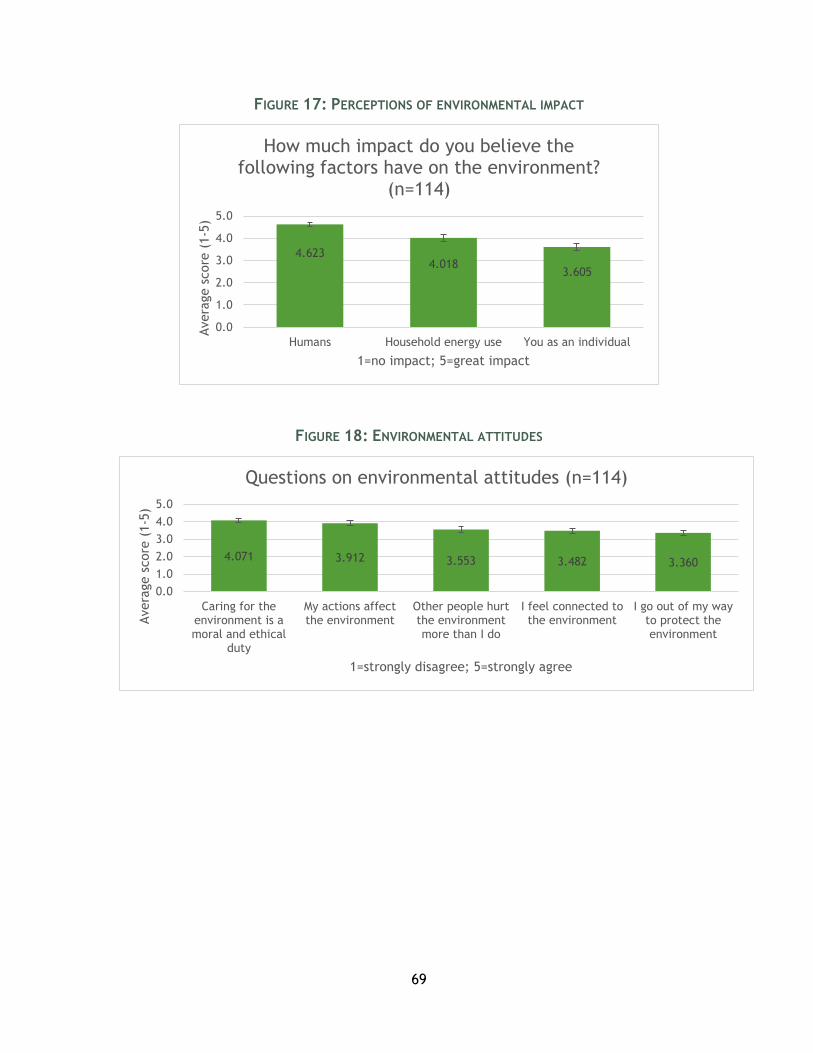
69
FIGURE 17: PERCEPTIONS OF ENVIRONMENTAL IMPACT
FIGURE 18: ENVIRONMENTAL ATTITUDES
4.6234.018
3.605
0.0
1.0
2.0
3.0
4.0
5.0
Humans Household energy use You as an individual
Avera
ge s
core
(1-5
)
1=no impact; 5=great impact
How much impact do you believe the following factors have on the environment?
(n=114)
4.071 3.912 3.553 3.482 3.360
0.0
1.0
2.0
3.0
4.0
5.0
Caring for theenvironment is amoral and ethical
duty
My actions affectthe environment
Other people hurtthe environmentmore than I do
I feel connected tothe environment
I go out of my wayto protect theenvironment
Avera
ge s
core
(1-5
)
1=strongly disagree; 5=strongly agree
Questions on environmental attitudes (n=114)
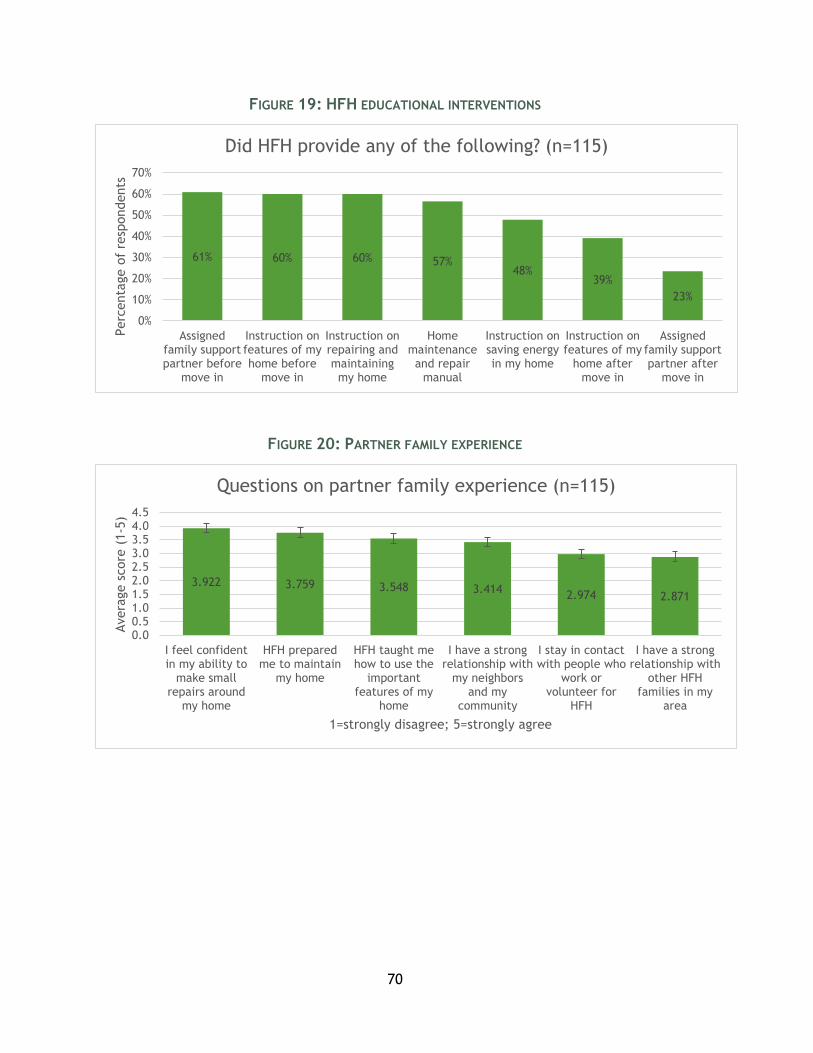
70
FIGURE 19: HFH EDUCATIONAL INTERVENTIONS
FIGURE 20: PARTNER FAMILY EXPERIENCE
61% 60% 60% 57%48%
39%
23%
0%
10%
20%
30%
40%
50%
60%
70%
Assignedfamily supportpartner before
move in
Instruction onfeatures of myhome before
move in
Instruction onrepairing andmaintainingmy home
Homemaintenanceand repair
manual
Instruction onsaving energyin my home
Instruction onfeatures of my
home aftermove in
Assignedfamily supportpartner after
move in
Perc
enta
ge o
f re
spondents
Did HFH provide any of the following? (n=115)
3.922 3.759 3.548 3.4142.974 2.871
0.00.51.01.52.02.53.03.54.04.5
I feel confidentin my ability to
make smallrepairs around
my home
HFH preparedme to maintain
my home
HFH taught mehow to use the
importantfeatures of my
home
I have a strongrelationship with
my neighborsand my
community
I stay in contactwith people who
work orvolunteer for
HFH
I have a strongrelationship with
other HFHfamilies in my
area
Avera
ge s
core
(1-5
)
1=strongly disagree; 5=strongly agree
Questions on partner family experience (n=115)
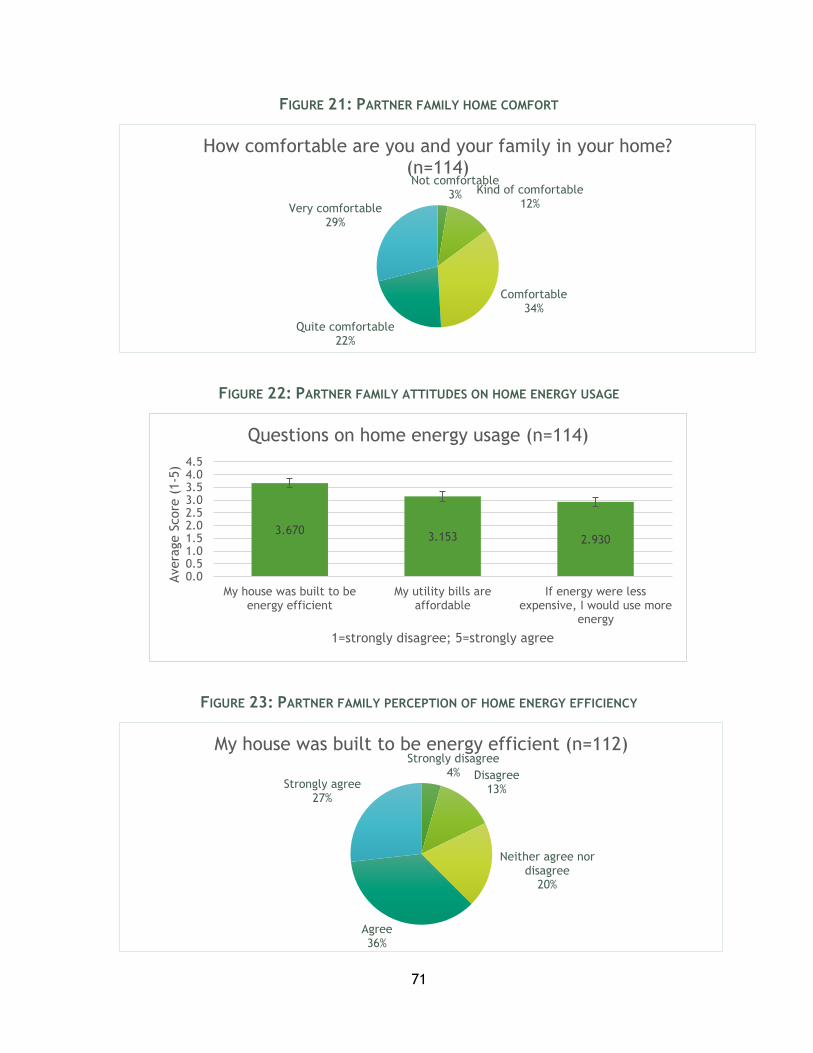
71
FIGURE 21: PARTNER FAMILY HOME COMFORT
FIGURE 22: PARTNER FAMILY ATTITUDES ON HOME ENERGY USAGE
FIGURE 23: PARTNER FAMILY PERCEPTION OF HOME ENERGY EFFICIENCY
Not comfortable3% Kind of comfortable
12%
Comfortable34%
Quite comfortable22%
Very comfortable29%
How comfortable are you and your family in your home? (n=114)
3.6703.153 2.930
0.00.51.01.52.02.53.03.54.04.5
My house was built to beenergy efficient
My utility bills areaffordable
If energy were lessexpensive, I would use more
energy
Avera
ge S
core
(1-5
)
1=strongly disagree; 5=strongly agree
Questions on home energy usage (n=114)
Strongly disagree4% Disagree
13%
Neither agree nor disagree
20%
Agree36%
Strongly agree27%
My house was built to be energy efficient (n=112)
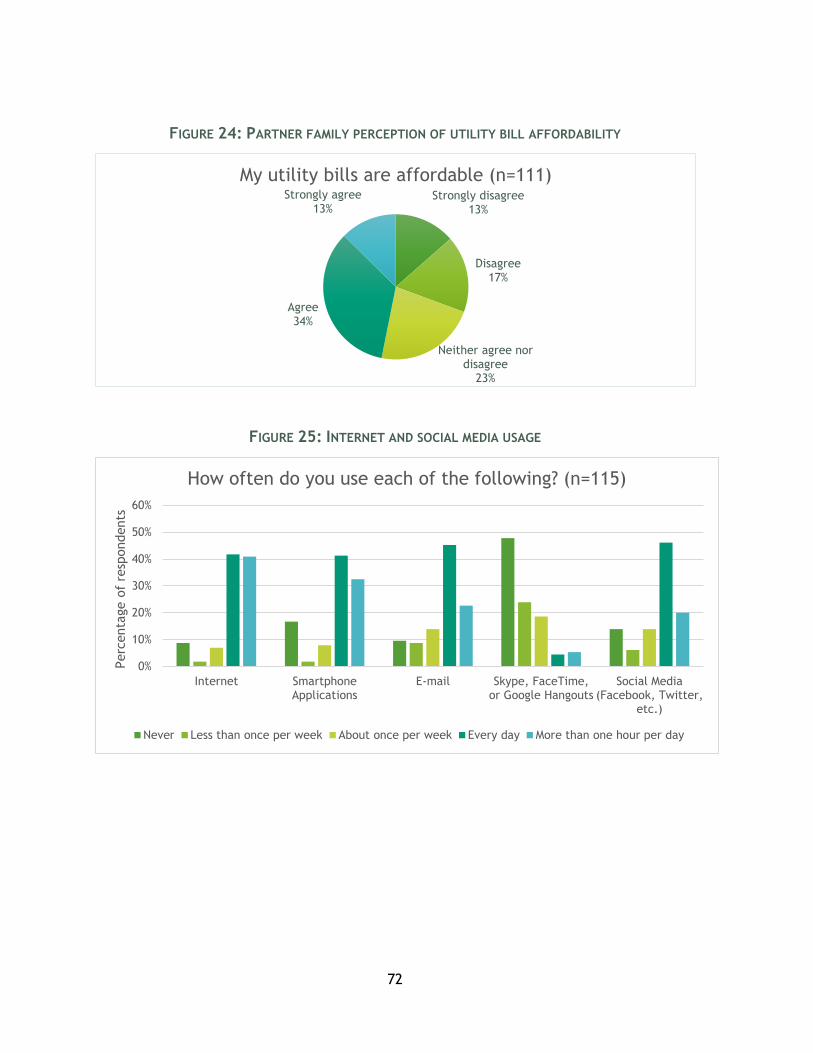
72
FIGURE 24: PARTNER FAMILY PERCEPTION OF UTILITY BILL AFFORDABILITY
FIGURE 25: INTERNET AND SOCIAL MEDIA USAGE
Strongly disagree13%
Disagree17%
Neither agree nor disagree
23%
Agree34%
Strongly agree13%
My utility bills are affordable (n=111)
0%
10%
20%
30%
40%
50%
60%
Internet SmartphoneApplications
E-mail Skype, FaceTime,or Google Hangouts
Social Media(Facebook, Twitter,
etc.)
Perc
enta
ge o
f re
spondents
How often do you use each of the following? (n=115)
Never Less than once per week About once per week Every day More than one hour per day
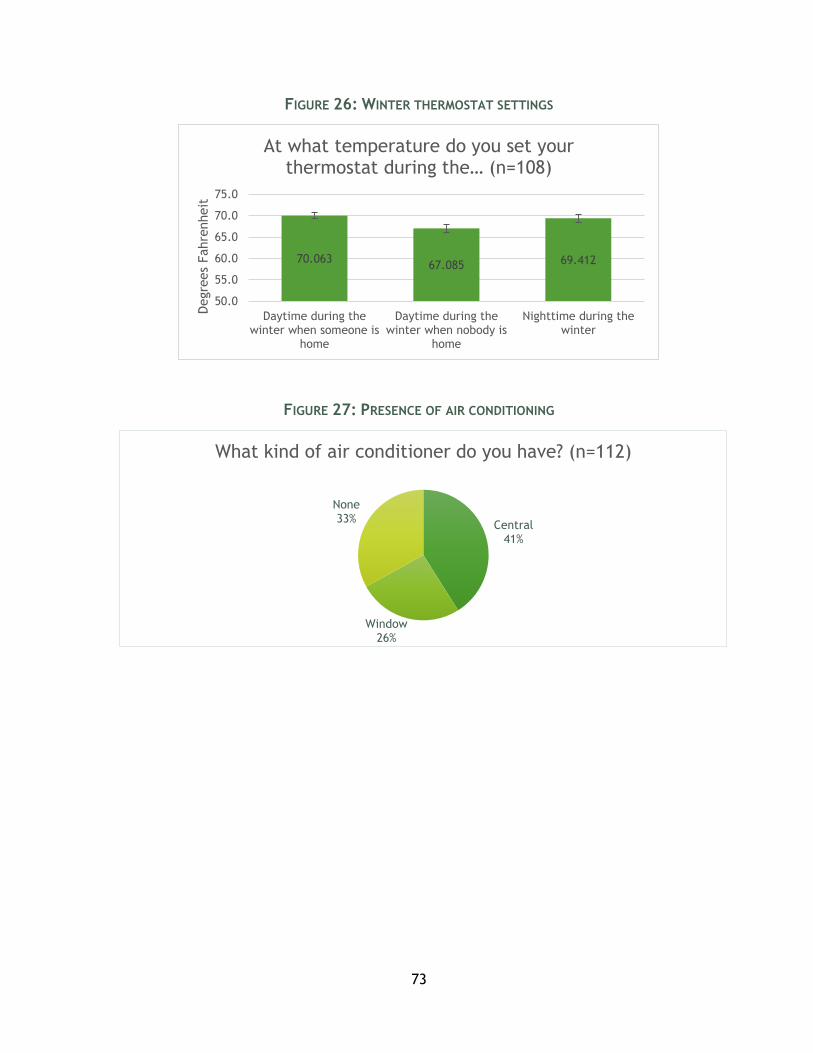
73
FIGURE 26: WINTER THERMOSTAT SETTINGS
FIGURE 27: PRESENCE OF AIR CONDITIONING
70.06367.085 69.412
50.0
55.0
60.0
65.0
70.0
75.0
Daytime during thewinter when someone is
home
Daytime during thewinter when nobody is
home
Nighttime during thewinter
Degre
es
Fahre
nheit
At what temperature do you set your thermostat during the… (n=108)
Central41%
Window26%
None33%
What kind of air conditioner do you have? (n=112)
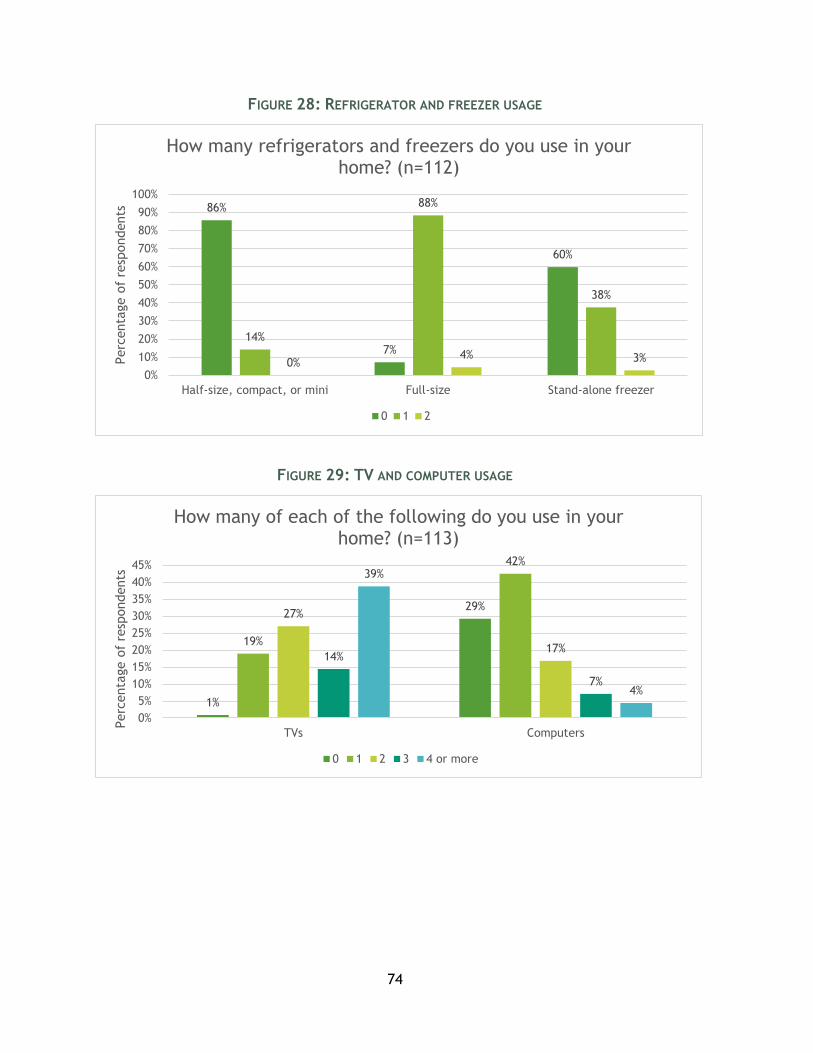
74
FIGURE 28: REFRIGERATOR AND FREEZER USAGE
FIGURE 29: TV AND COMPUTER USAGE
86%
7%
60%
14%
88%
38%
0%4% 3%
0%
10%
20%
30%
40%
50%
60%
70%
80%
90%
100%
Half-size, compact, or mini Full-size Stand-alone freezer
Perc
enta
ge o
f re
spondents
How many refrigerators and freezers do you use in your home? (n=112)
0 1 2
1%
29%
19%
42%
27%
17%14%
7%
39%
4%
0%
5%
10%
15%
20%
25%
30%
35%
40%
45%
TVs Computers
Perc
enta
ge o
f re
spondents
How many of each of the following do you use in your home? (n=113)
0 1 2 3 4 or more
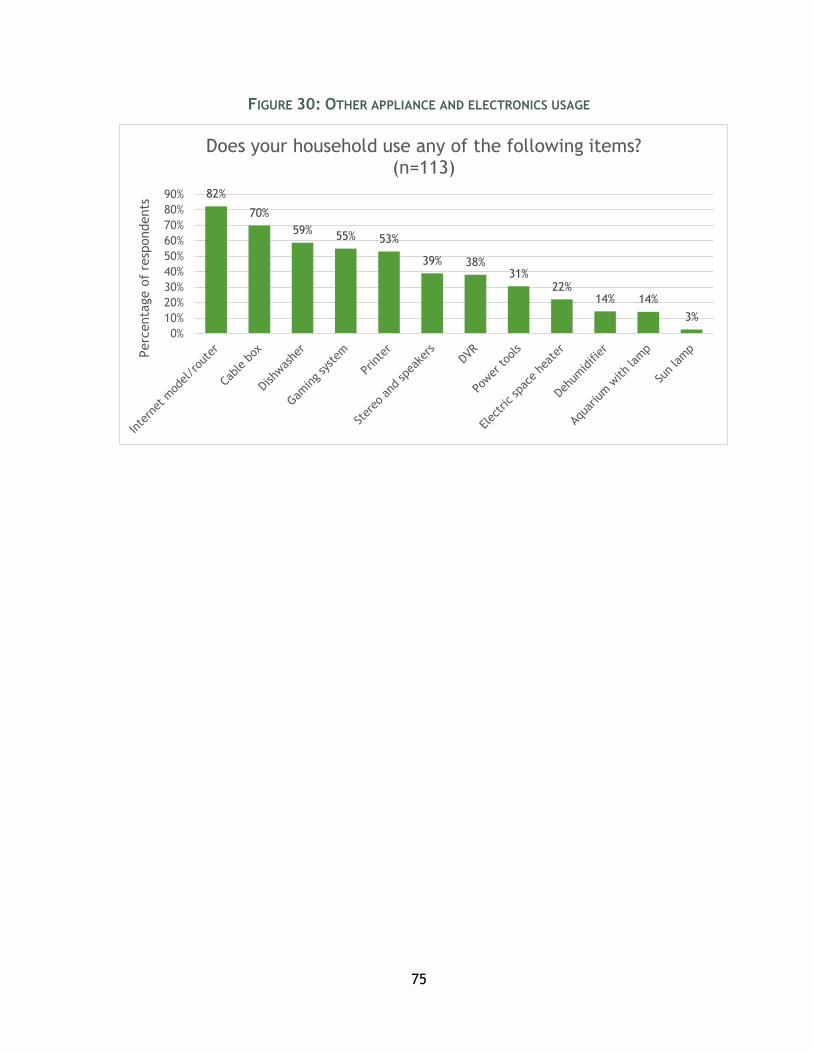
75
FIGURE 30: OTHER APPLIANCE AND ELECTRONICS USAGE
82%
70%
59%55% 53%
39% 38%31%
22%14% 14%
3%
0%
10%
20%
30%
40%
50%
60%
70%
80%
90%
Perc
enta
ge o
f re
spondents
Does your household use any of the following items? (n=113)
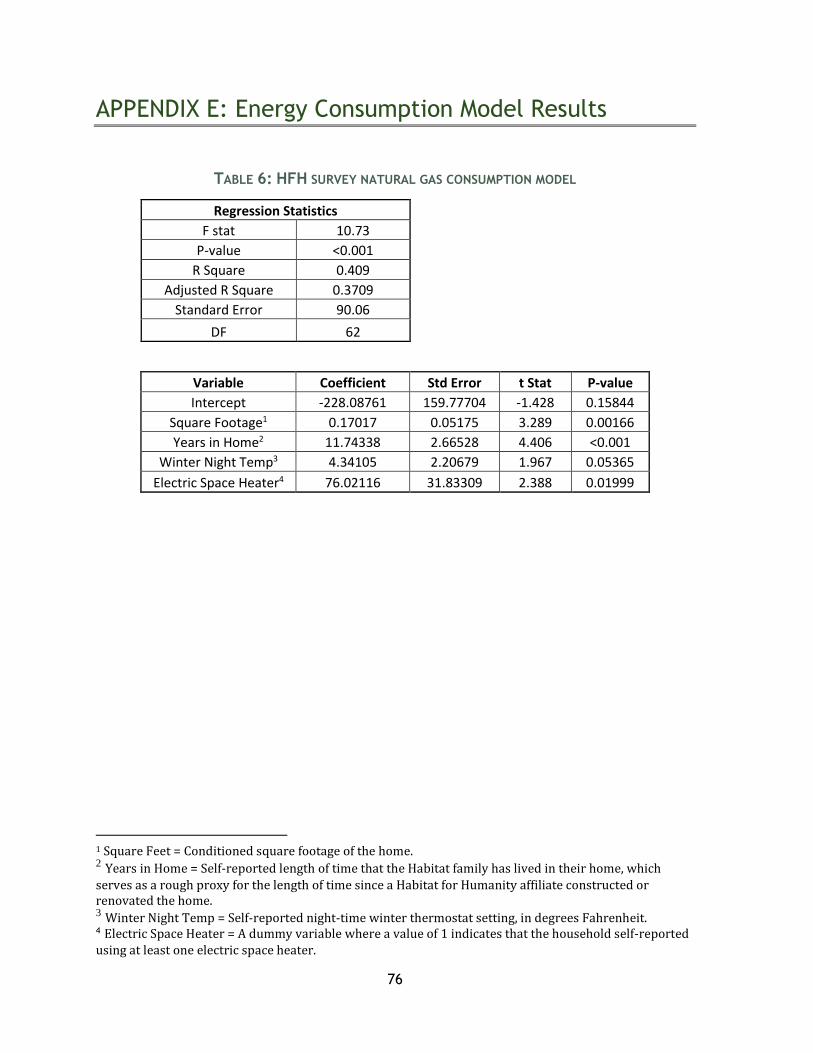
76
APPENDIX E: Energy Consumption Model Results
TABLE 6: HFH SURVEY NATURAL GAS CONSUMPTION MODEL
Regression Statistics
F stat 10.73
P-value <0.001
R Square 0.409
Adjusted R Square 0.3709
Standard Error 90.06
DF 62
Variable Coefficient Std Error t Stat P-value
Intercept -228.08761 159.77704 -1.428 0.15844
Square Footage1 0.17017 0.05175 3.289 0.00166
Years in Home2 11.74338 2.66528 4.406 <0.001
Winter Night Temp3 4.34105 2.20679 1.967 0.05365
Electric Space Heater4 76.02116 31.83309 2.388 0.01999
1 Square Feet = Conditioned square footage of the home. 2 Years in Home = Self-reported length of time that the Habitat family has lived in their home, which
serves as a rough proxy for the length of time since a Habitat for Humanity affiliate constructed or renovated the home. 3 Winter Night Temp = Self-reported night-time winter thermostat setting, in degrees Fahrenheit. 4 Electric Space Heater = A dummy variable where a value of 1 indicates that the household self-reported using at least one electric space heater.
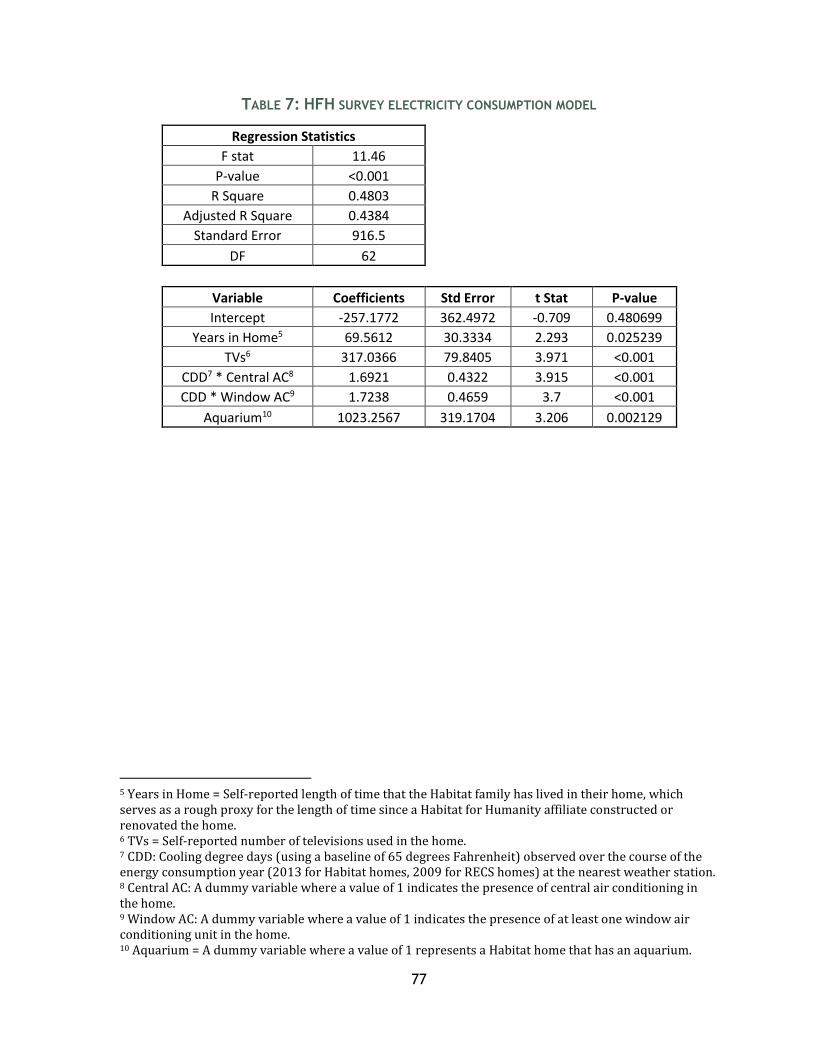
77
TABLE 7: HFH SURVEY ELECTRICITY CONSUMPTION MODEL
Regression Statistics
F stat 11.46
P-value <0.001
R Square 0.4803
Adjusted R Square 0.4384
Standard Error 916.5
DF 62
Variable Coefficients Std Error t Stat P-value
Intercept -257.1772 362.4972 -0.709 0.480699
Years in Home5 69.5612 30.3334 2.293 0.025239
TVs6 317.0366 79.8405 3.971 <0.001
CDD7 * Central AC8 1.6921 0.4322 3.915 <0.001
CDD * Window AC9 1.7238 0.4659 3.7 <0.001
Aquarium10 1023.2567 319.1704 3.206 0.002129
5 Years in Home = Self-reported length of time that the Habitat family has lived in their home, which serves as a rough proxy for the length of time since a Habitat for Humanity affiliate constructed or renovated the home. 6 TVs = Self-reported number of televisions used in the home. 7 CDD: Cooling degree days (using a baseline of 65 degrees Fahrenheit) observed over the course of the energy consumption year (2013 for Habitat homes, 2009 for RECS homes) at the nearest weather station. 8 Central AC: A dummy variable where a value of 1 indicates the presence of central air conditioning in the home. 9 Window AC: A dummy variable where a value of 1 indicates the presence of at least one window air conditioning unit in the home. 10 Aquarium = A dummy variable where a value of 1 represents a Habitat home that has an aquarium.
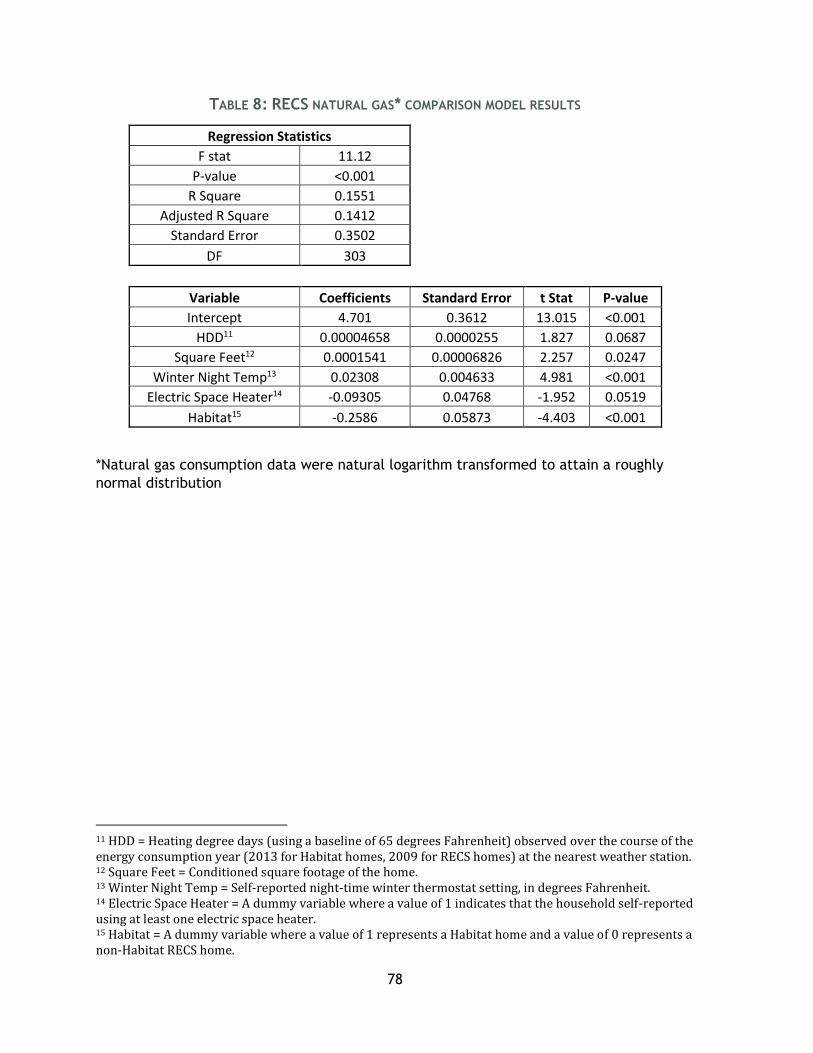
78
TABLE 8: RECS NATURAL GAS* COMPARISON MODEL RESULTS
Regression Statistics
F stat 11.12
P-value <0.001
R Square 0.1551
Adjusted R Square 0.1412
Standard Error 0.3502
DF 303
Variable Coefficients Standard Error t Stat P-value
Intercept 4.701 0.3612 13.015 <0.001
HDD11 0.00004658 0.0000255 1.827 0.0687
Square Feet12 0.0001541 0.00006826 2.257 0.0247
Winter Night Temp13 0.02308 0.004633 4.981 <0.001
Electric Space Heater14 -0.09305 0.04768 -1.952 0.0519
Habitat15 -0.2586 0.05873 -4.403 <0.001
*Natural gas consumption data were natural logarithm transformed to attain a roughly
normal distribution
11 HDD = Heating degree days (using a baseline of 65 degrees Fahrenheit) observed over the course of the energy consumption year (2013 for Habitat homes, 2009 for RECS homes) at the nearest weather station. 12 Square Feet = Conditioned square footage of the home. 13 Winter Night Temp = Self-reported night-time winter thermostat setting, in degrees Fahrenheit. 14 Electric Space Heater = A dummy variable where a value of 1 indicates that the household self-reported using at least one electric space heater. 15 Habitat = A dummy variable where a value of 1 represents a Habitat home and a value of 0 represents a non-Habitat RECS home.
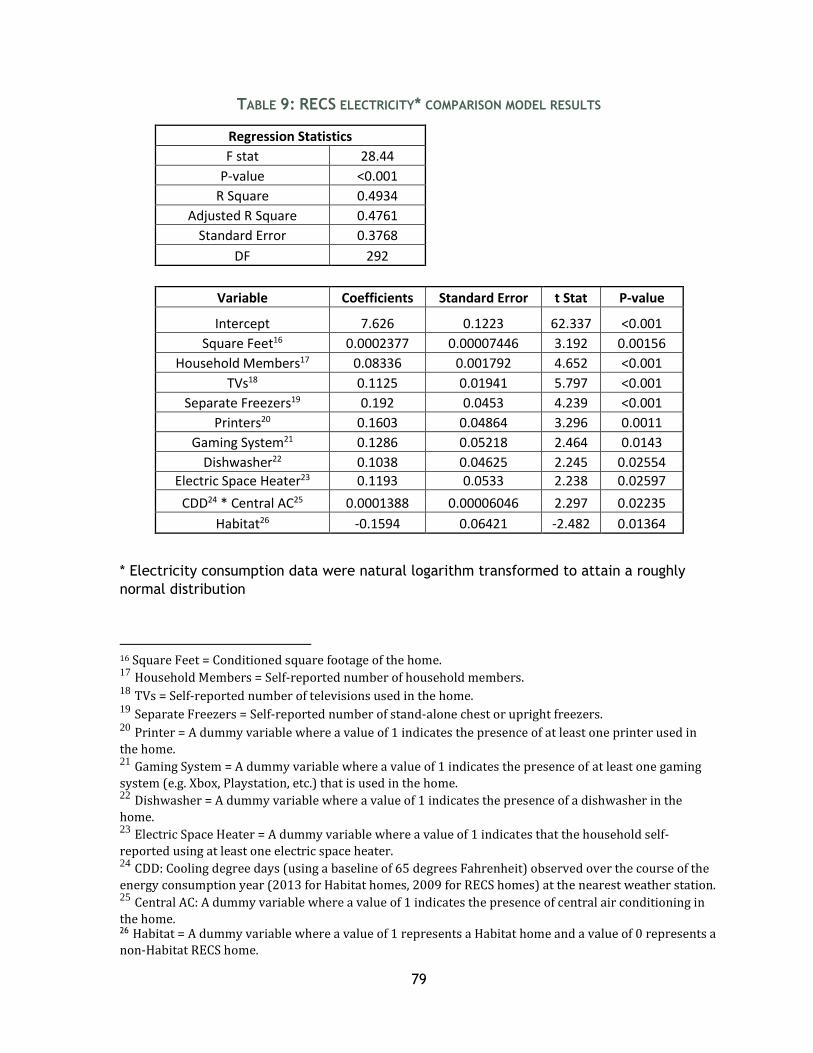
79
TABLE 9: RECS ELECTRICITY* COMPARISON MODEL RESULTS
Regression Statistics
F stat 28.44
P-value <0.001
R Square 0.4934
Adjusted R Square 0.4761
Standard Error 0.3768
DF 292
Variable Coefficients Standard Error t Stat P-value
Intercept 7.626 0.1223 62.337 <0.001
Square Feet16 0.0002377 0.00007446 3.192 0.00156
Household Members17 0.08336 0.001792 4.652 <0.001
TVs18 0.1125 0.01941 5.797 <0.001
Separate Freezers19 0.192 0.0453 4.239 <0.001
Printers20 0.1603 0.04864 3.296 0.0011
Gaming System21 0.1286 0.05218 2.464 0.0143
Dishwasher22 0.1038 0.04625 2.245 0.02554
Electric Space Heater23 0.1193 0.0533 2.238 0.02597
CDD24 * Central AC25 0.0001388 0.00006046 2.297 0.02235
Habitat26 -0.1594 0.06421 -2.482 0.01364
* Electricity consumption data were natural logarithm transformed to attain a roughly
normal distribution
16 Square Feet = Conditioned square footage of the home. 17 Household Members = Self-reported number of household members. 18 TVs = Self-reported number of televisions used in the home. 19 Separate Freezers = Self-reported number of stand-alone chest or upright freezers. 20 Printer = A dummy variable where a value of 1 indicates the presence of at least one printer used in
the home. 21 Gaming System = A dummy variable where a value of 1 indicates the presence of at least one gaming
system (e.g. Xbox, Playstation, etc.) that is used in the home. 22 Dishwasher = A dummy variable where a value of 1 indicates the presence of a dishwasher in the
home. 23 Electric Space Heater = A dummy variable where a value of 1 indicates that the household self-
reported using at least one electric space heater. 24 CDD: Cooling degree days (using a baseline of 65 degrees Fahrenheit) observed over the course of the
energy consumption year (2013 for Habitat homes, 2009 for RECS homes) at the nearest weather station. 25 Central AC: A dummy variable where a value of 1 indicates the presence of central air conditioning in
the home. 26 Habitat = A dummy variable where a value of 1 represents a Habitat home and a value of 0 represents a non-Habitat RECS home.
80
APPENDIX F: List of Acronyms
HERS: Home Energy Rating System
HFH: Habitat for Humanity
HFHI: Habitat for Humanity International
HFHM: Habitat for Humanity of Michigan
SNRE: University of Michigan School of Natural Resources and Environment
SSO: State Support Organization
EIA: Energy Information Administration
RECS: Residential Energy Consumption Survey

81
References
Abrahamase, J. et al. 2005. A review of intervention studies aimed at household energy
conservation. Journal of Environmental Psychology 25: pgs. 273-276, 281-283.
Alcott, B. (2007). “Jevons’ paradox.” Ecological Economics 54 (1): 9–21.
Allcott, H (2011). Social norms and energy conservation. Journal of Public Economics 95: 1082-
1095.
Bhattacharya, J., et al. (2003). Heat or eat? Cold-weather shocks and nutrition in poor families.
American Journal of Public Health 93(7), pp. 1149-1154.
Cialdini, R. (2001). Influence: Science and Practice (4th ed.). Boston: Allyn & Bacon
Cluett, C., and Amann, J. (2014, March). Residential deep energy retrofits. American Council for an
Energy Efficient Economy. Accessed on April 20, 2014. Retrieved from:
http://www.aceee.org/node/3078?id=5187
DeCicco, J., et al. (2013). University of Michigan Energy Survey: Results from October 2013
Sample. University of Michigan Energy Institute and Institute for Social Research.
Dillman, D. (1978). Mail and telephone surveys: The Total Design Method. New York: John Wiley
& Sons.
Dillman, D.A., Smyth, J.D., and Christian, L.M. (2009). Internet, mail, and mixed-mode surveys: The
tailored design method. Hoboken, NJ: John Wiley & Sons, Inc.
Eisenberg, J. (2010, March). Weatherization Assistance Program technical memorandum background data and statistics. Oak Ridge National Laboratory. Accessed on February 7, 2014.
Retrieved from: http://weatherization.ornl.gov/pdfs/ORNL_TM-2010-66.pdf
Johnson, E., and Goldstein, D. (2003). Do defaults save lives? Science 302: 1338-1339.
Habitat for Humanity (2012, May 18). Habitat for Humanity is the sixth-largest U.S.
homebuilder for the second year according to annual survey. Habitat for Humanity,
International. Accessed on April 20, 2014. Retrieved from: http://www.habitat.org/newsroom/
National Renewable Energy Laboratory (NREL). (2013). Saving Energy Through Advanced
Power Strips. National Renewable Energy Laboratory. Accessed on March 26, 2014. Retrieved
from: http://www.nrel.gov/docs/fy14osti/60461.pdf

82
Habitat for Humanity (2014). About Habitat for Humanity. Habitat for Humanity, International. Accessed on February 26, 2014. Retrieved from: http://www.habitat.org/how/about_us.aspx
Kahneman, D., and Tversky, A. (1984). Choices, values, and frames. American Psychologist 39
(4): 341-350.
Osbaldiston, R. and Schott, J.P. (2011). Environmental sustainability and behavioral science:
Meta-analysis of proenvironemental behavior experiments. Environment and Behavior 44: 257-
299.
Owen, D. (2010, December 20). The efficiency dilemma. The New Yorker. Accessed on April 20, 2014. Retrieved from: http://www.davidowen.net/files/the-efficiency-dilemma.pdf
Roberts, S. (2008). Energy, equity, and the future of the fuel poor. Energy Policy 26, pp. 4471-
4474.
Singer, E. (2012 Oct. 3-4). The use and effects of incentives in surveys. Presentation to the
National Science Foundation.
Schutt, R.K. (2001). Investigating the Social World: The Process and Practice of Research (3rd ed.).
Thousand Oaks, CA: Sage.
U.S. Energy Information Administration (2009). 2009 RECS Survey Data. Residential Energy Consumption Survey (RECS). Accessed on February 26, 2014. Retrieved from:
http://www.eia.gov/consumption/residential/data/2009/
U.S. Energy Information Administration (2013, November). Michigan Net Electricity Generation
by Source, Nov. 2013. Michigan State Profile and Energy Estimates. Accessed on February 26,
2013. Retrieved from: http://www.eia.gov/state/?sid=MI#tabs-4
U.S. Environmental Protection Agency (2011). Energy Efficiency in Affordable Housing.
U.S. Environmental Protection Agency. Accessed on April 18, 2015. Retrieved from:
http://www.epa.gov/statelocalclimate/documents/pdf/affordable_housing.pdf
U.S. Environmental Protection Agency (2012, December 19). Green Building | Basic Information.
U.S. Environmental Protection Agency. Accessed on April 22, 2014. Retrieved from:.
http://www.epa.gov/greenbuilding/pubs/about.htm
Verplanken, B. et al. (2008). Context change and travel mode choice: Combining the habit
discontinuity and self-activation hypothesis. Journal of Environmental Psychology 28, pp. 121-
127
Recommended