© 2013 QoSient, LLC
PCR - A New Flow Metric Producer Consumer Ratio
Carter Bullard QoSient, LLC [email protected]
FloCon 2014 January 13-16, 2014 Charleston, South Carolina May 21, 2013
John Gerth Stanford University [email protected]
© 2013 QoSient, LLC ���2
Problem Statement•Data Exfiltration is a serious problem
• Cyber Espionage is primary issue in US Cyber warfare • APT1 identifies nation state orchestration and exploitation • Represents for some, THE worst case scenario
•Detection can be challenging • Novel transport strategies can really make it hard • Behavioral threshold based systems easily subverted • Some involve internal data consolidation, with physical extraction
•For many, the problem is not Data Loss • Unknowingly, many infrastructure are used as stepping stones
facilitating the transport of data. • Implicating them as co-conspirators. • Liability and reputation impacts are very damaging
© 2013 QoSient, LLC ���3
Exfiltration Methods•Data Exfiltration can be a complex and protracted event
• “Night Dragon” APT active ~4 years. • APT1 identifies nation state orchestration and exploitation
•Majority of the nodes involved are transport nodes, not sources •Use of overt and covert channels is common
• IP Multicasting for extra work group exfiltration (overt) • Non-IP LAN based data exchange for consolidation and exfiltration • Browser based covert channels - DNS prefetching , Java scripting • DNS tunneling, HTTP tunneling, XXX tunneling • Piggyback transporting - NTPv3, VoIP, ICMP, SIP
•Insider exfiltration generally uses physical media • Normally involves data consolidation to a set of extraction nodes, to
facilitate physical removal of the data.
© 2013 QoSient, LLC
Exfiltration Detection
•Data Loss Protection strategies fall short • Exfiltration is not exclusively a data loss problem
• Many impacted by exfiltration exploits are just stepping stones
• For these sites, content based detection fails, as its not their data.
• Distributed exploitation frameworks, such as “mesh - in - mesh - out” fabrics, make load based identification very difficult.
•Bell-La Padula type formal methods may provide some help • Detect transformation from normal node to an exfiltration node • Need new metrics
•Propose that exfiltration is a shift in producer / consumer roles •Better methods to describe producer / consumers will really help •Early detection involves identifying leading indicators
���4
© 2013 QoSient, LLC
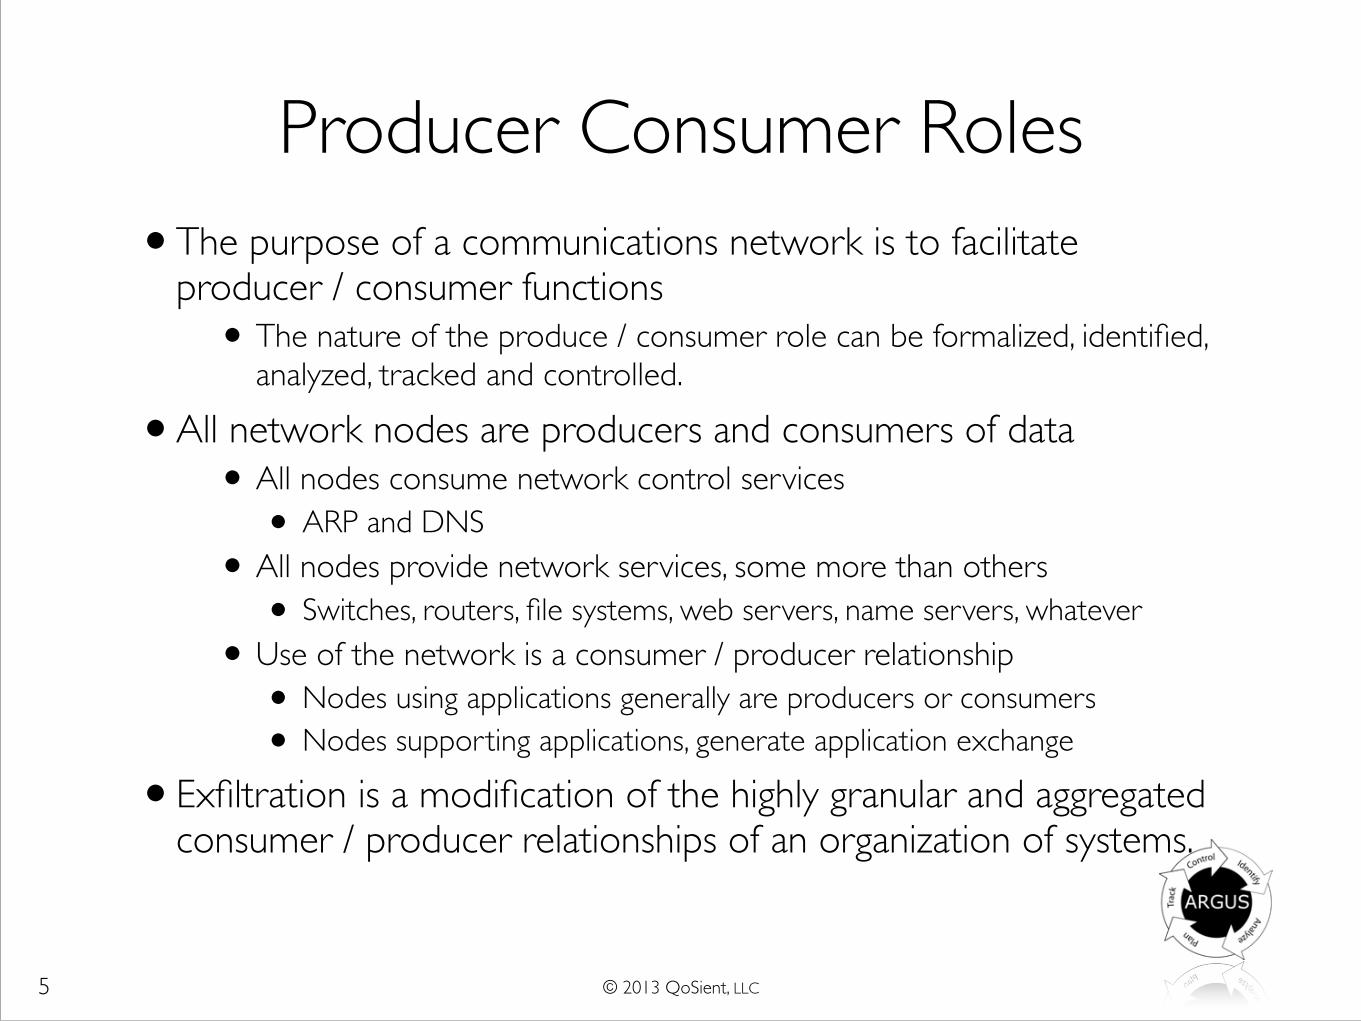
Producer Consumer Roles•The purpose of a communications network is to facilitate
producer / consumer functions • The nature of the produce / consumer role can be formalized, identified,
analyzed, tracked and controlled.
•All network nodes are producers and consumers of data • All nodes consume network control services
• ARP and DNS • All nodes provide network services, some more than others
• Switches, routers, file systems, web servers, name servers, whatever • Use of the network is a consumer / producer relationship
• Nodes using applications generally are producers or consumers • Nodes supporting applications, generate application exchange
•Exfiltration is a modification of the highly granular and aggregated consumer / producer relationships of an organization of systems.
���5
© 2013 QoSient, LLC
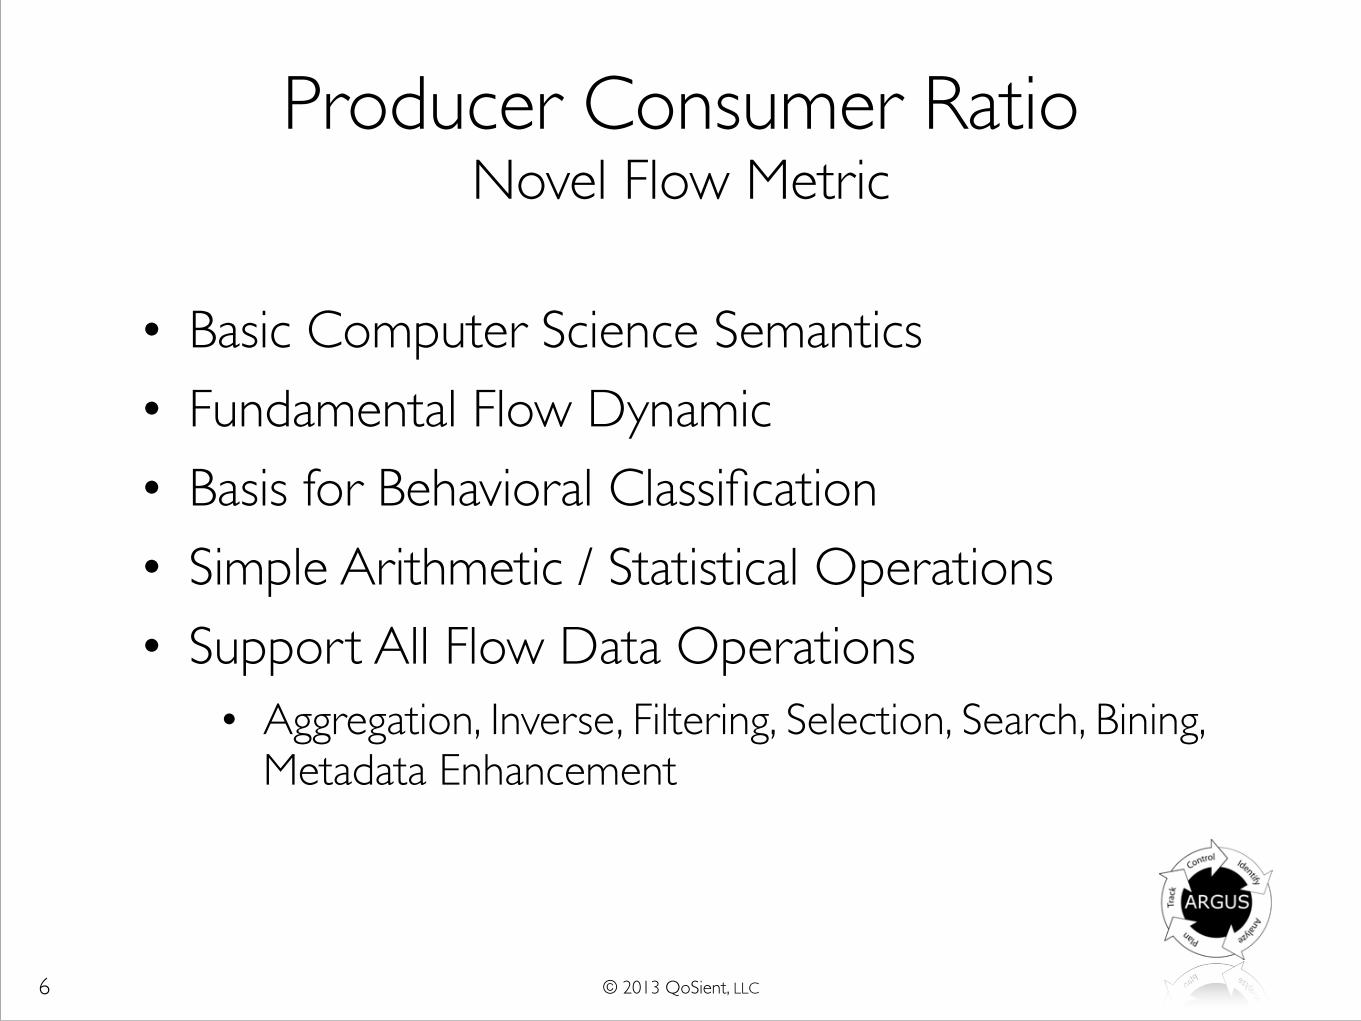
Producer Consumer Ratio Novel Flow Metric
• Basic Computer Science Semantics • Fundamental Flow Dynamic • Basis for Behavioral Classification • Simple Arithmetic / Statistical Operations • Support All Flow Data Operations
• Aggregation, Inverse, Filtering, Selection, Search, Bining, Metadata Enhancement
���6
© 2013 QoSient, LLC
Producer Consumer Ratio Definition
���7
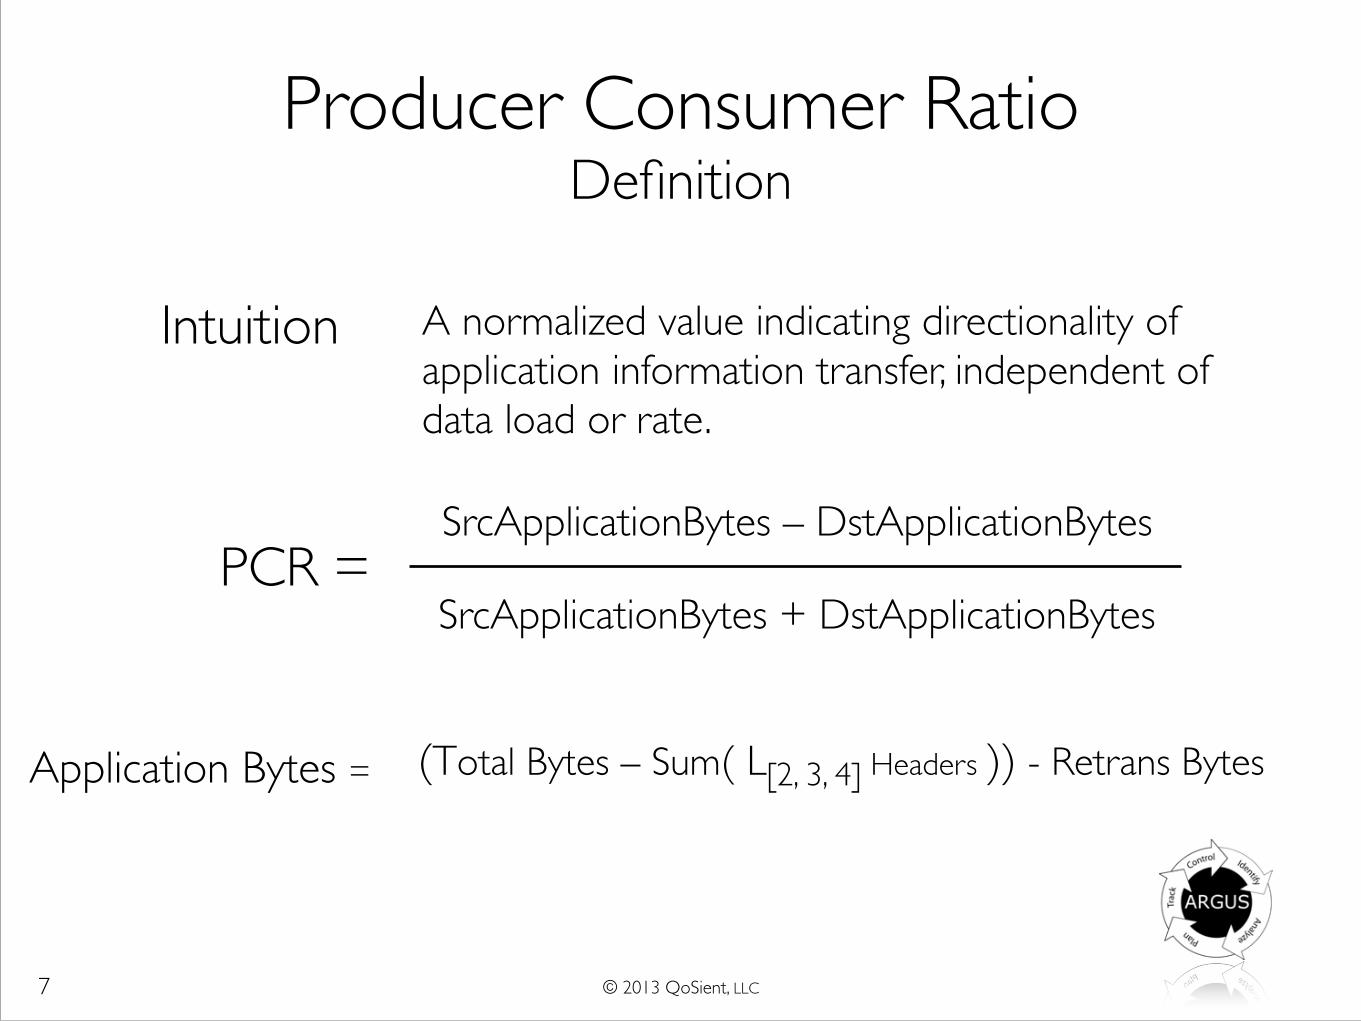
PCR = SrcApplicationBytes ⎼ DstApplicationBytes
SrcApplicationBytes + DstApplicationBytes
A normalized value indicating directionality of application information transfer, independent of data load or rate.
Intuition
Application Bytes = (Total Bytes ⎼ Sum( L[2, 3, 4] Headers )) - Retrans Bytes
© 2013 QoSient, LLC
Producer Consumer Ratio Properties
���8
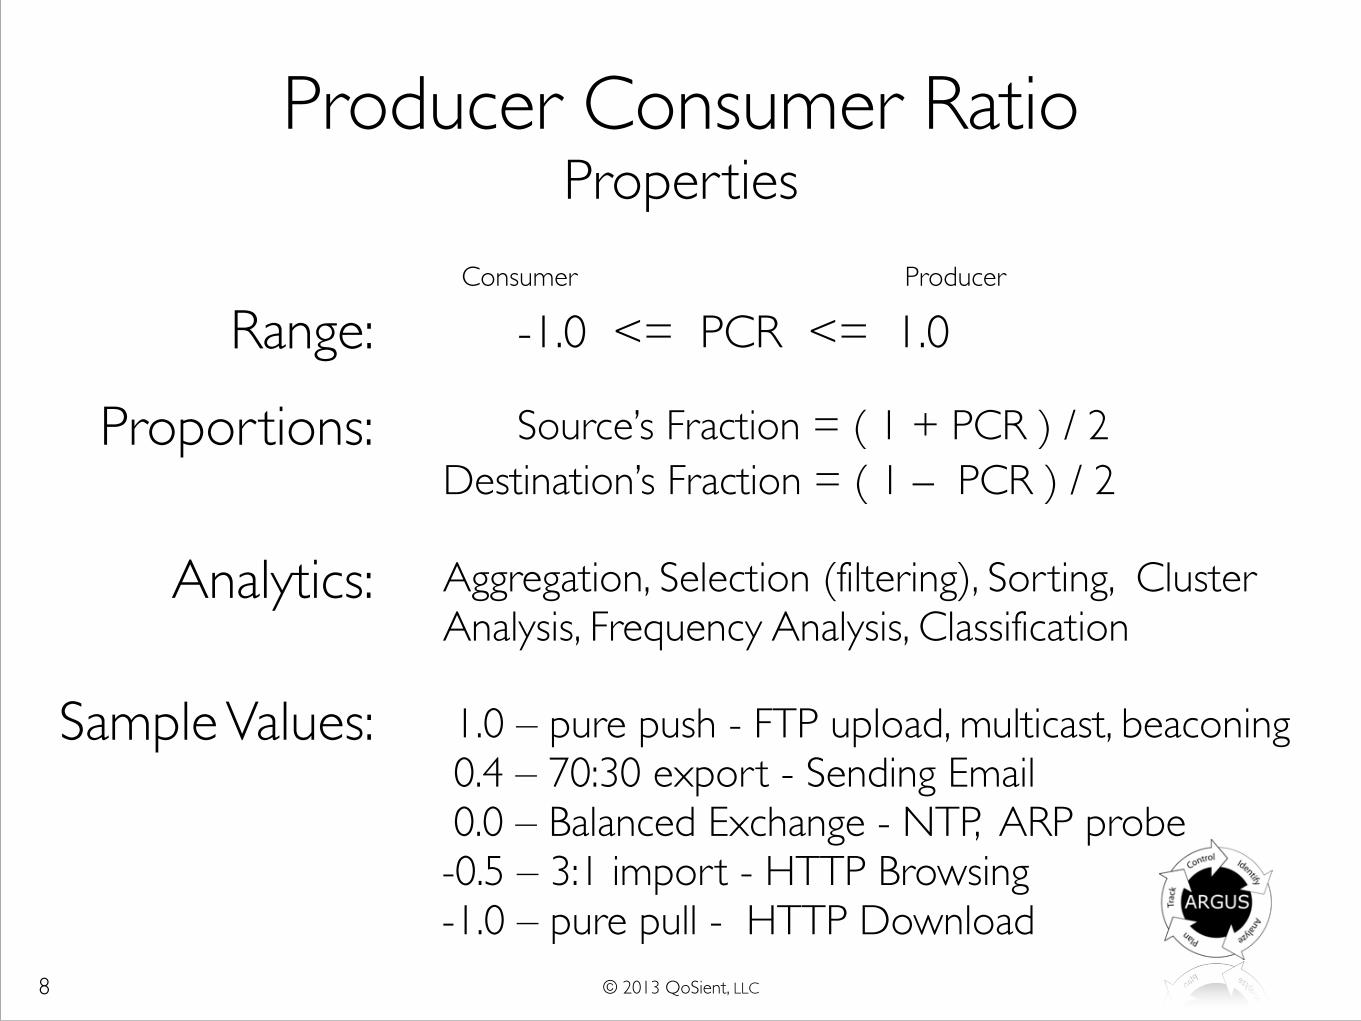
-1.0 <= PCR <= 1.0Range:
Proportions: Source’s Fraction = ( 1 + PCR ) / 2Destination’s Fraction = ( 1 ⎼ PCR ) / 2
Sample Values: 1.0 – pure push - FTP upload, multicast, beaconing 0.4 – 70:30 export - Sending Email 0.0 – Balanced Exchange - NTP, ARP probe -0.5 – 3:1 import - HTTP Browsing -1.0 – pure pull - HTTP Download
Consumer Producer
Analytics: Aggregation, Selection (filtering), Sorting, Cluster Analysis, Frequency Analysis, Classification
© 2013 QoSient, LLC ���9
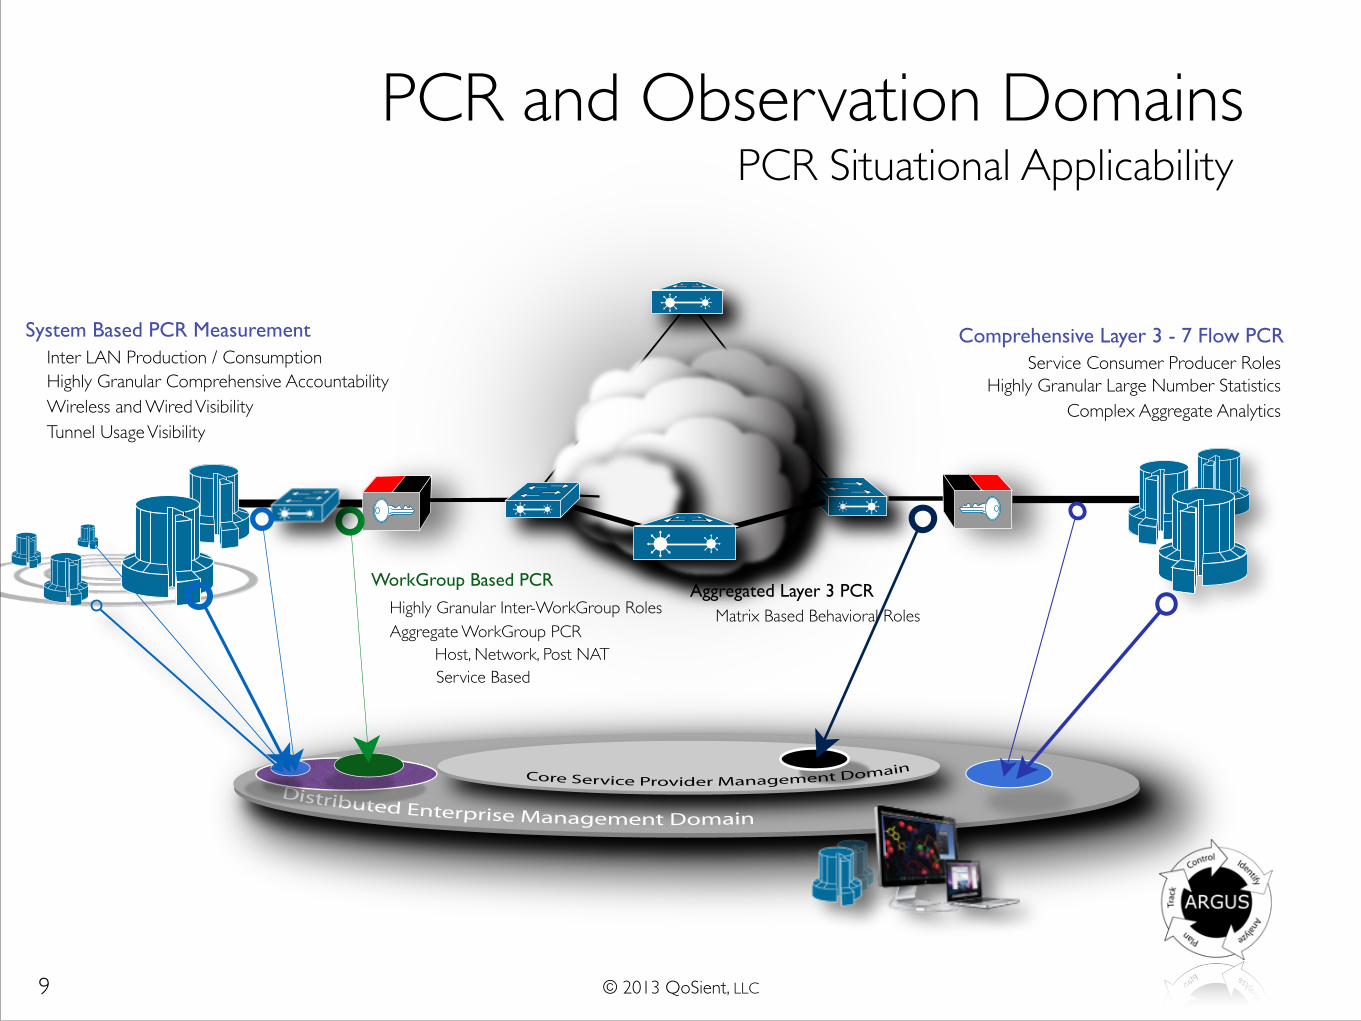
Distributed Enterprise Management Domain
Core Service Provider Management Domain
PCR and Observation Domains
WorkGroup Based PCR
Comprehensive Layer 3 - 7 Flow PCR
Aggregated Layer 3 PCR
System Based PCR Measurement
Highly Granular Comprehensive AccountabilityInter LAN Production / Consumption
Highly Granular Inter-WorkGroup RolesAggregate WorkGroup PCR
Service Consumer Producer RolesHighly Granular Large Number Statistics
Complex Aggregate Analytics
Matrix Based Behavioral Roles
PCR Situational Applicability
Wireless and Wired VisibilityTunnel Usage Visibility
Host, Network, Post NATService Based

© 2013 QoSient, LLC
Results
���10
© 2013 QoSient, LLC ���11
1E+04
1E+06
1E+08
1E+10
1E+12
2013
-02-05
2013
-03-05
2013
-05-07
2013
-06-13
2013
-08-02
2013
-08-30
2013
-09-27
2013
-11-18
2013
-12-16
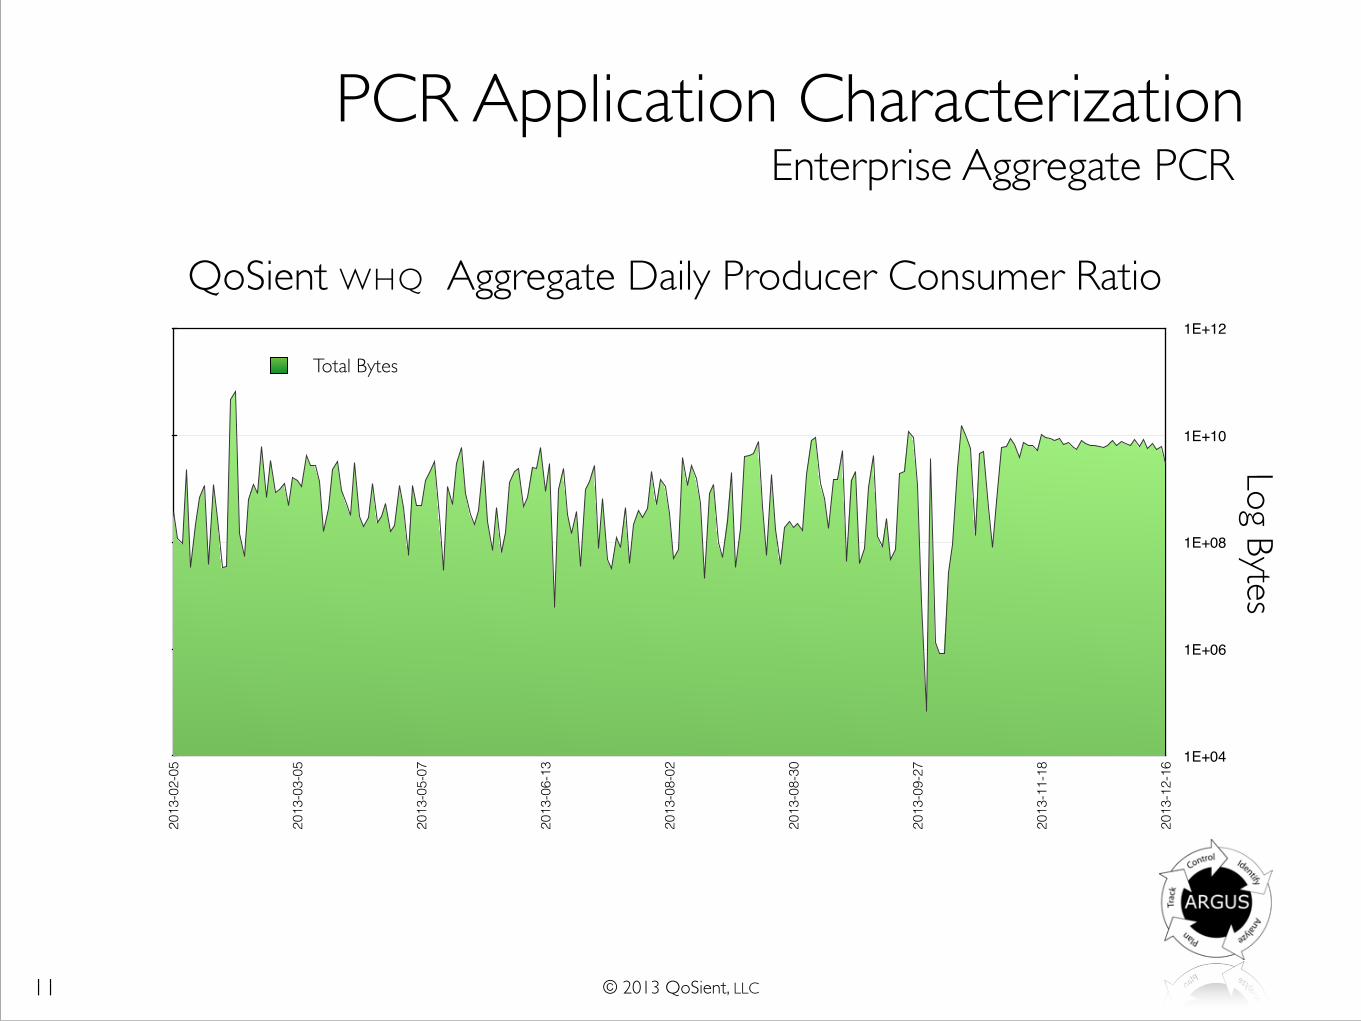
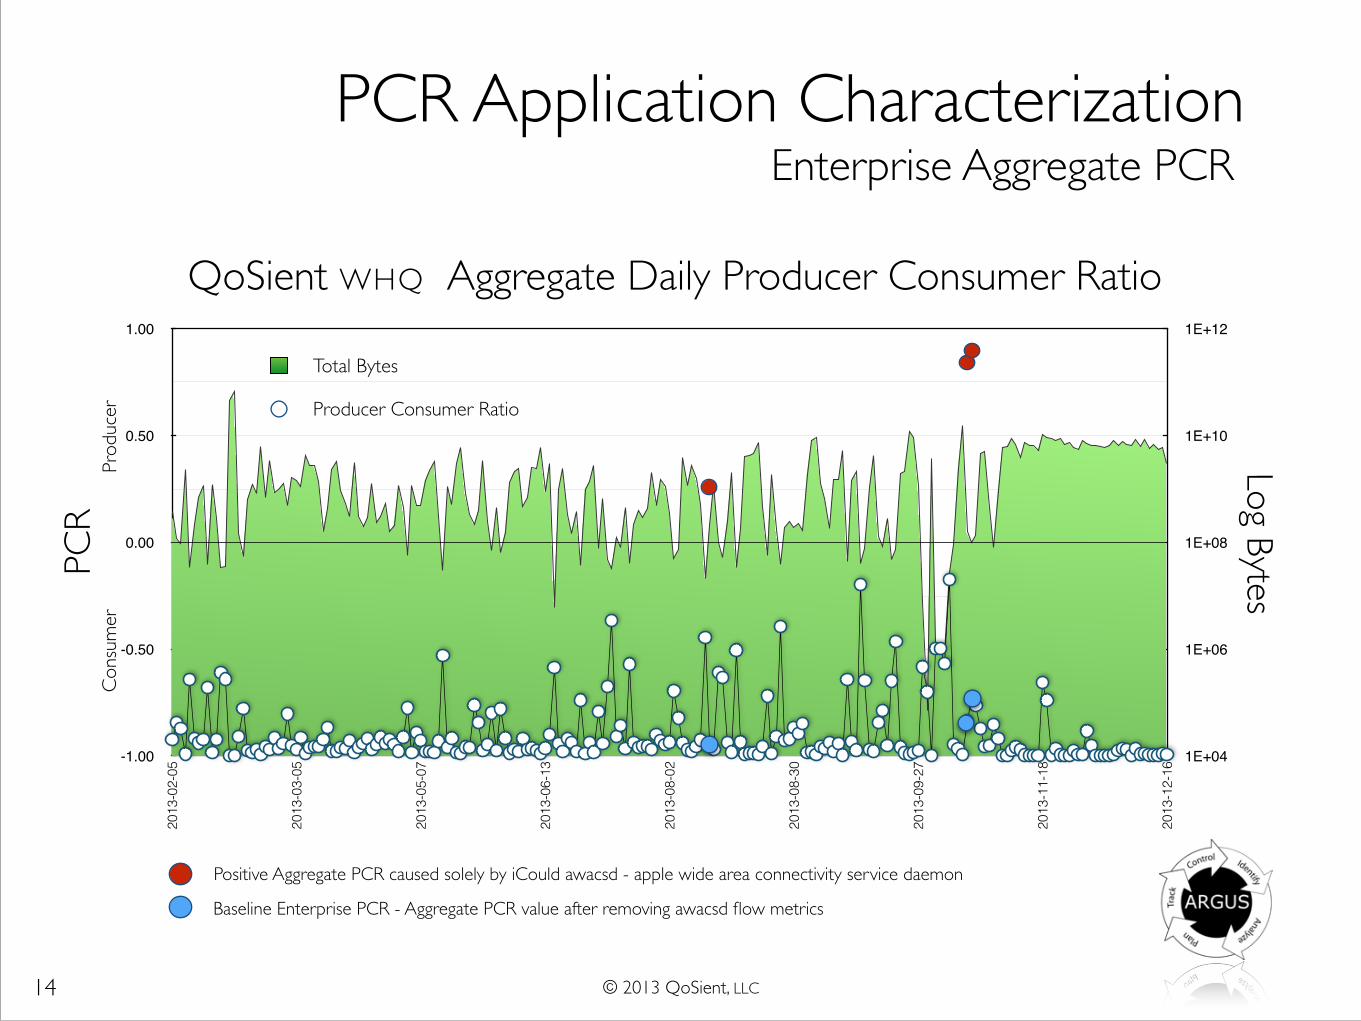
PCR Application CharacterizationEnterprise Aggregate PCR
QoSient WHQ Aggregate Daily Producer Consumer Ratio
Log Bytes
Total Bytes
1E+12
1E+10
1E+08
1E+06
1E+04
© 2013 QoSient, LLC ���12
1E+04
1E+06
1E+08
1E+10
1E+12
-1.00
-0.50
0.00
0.50
1.00
2013
-02-05
2013
-03-05
2013
-05-07
2013
-06-13
2013
-08-02
2013
-08-30
2013
-09-27
2013
-11-18
2013
-12-16
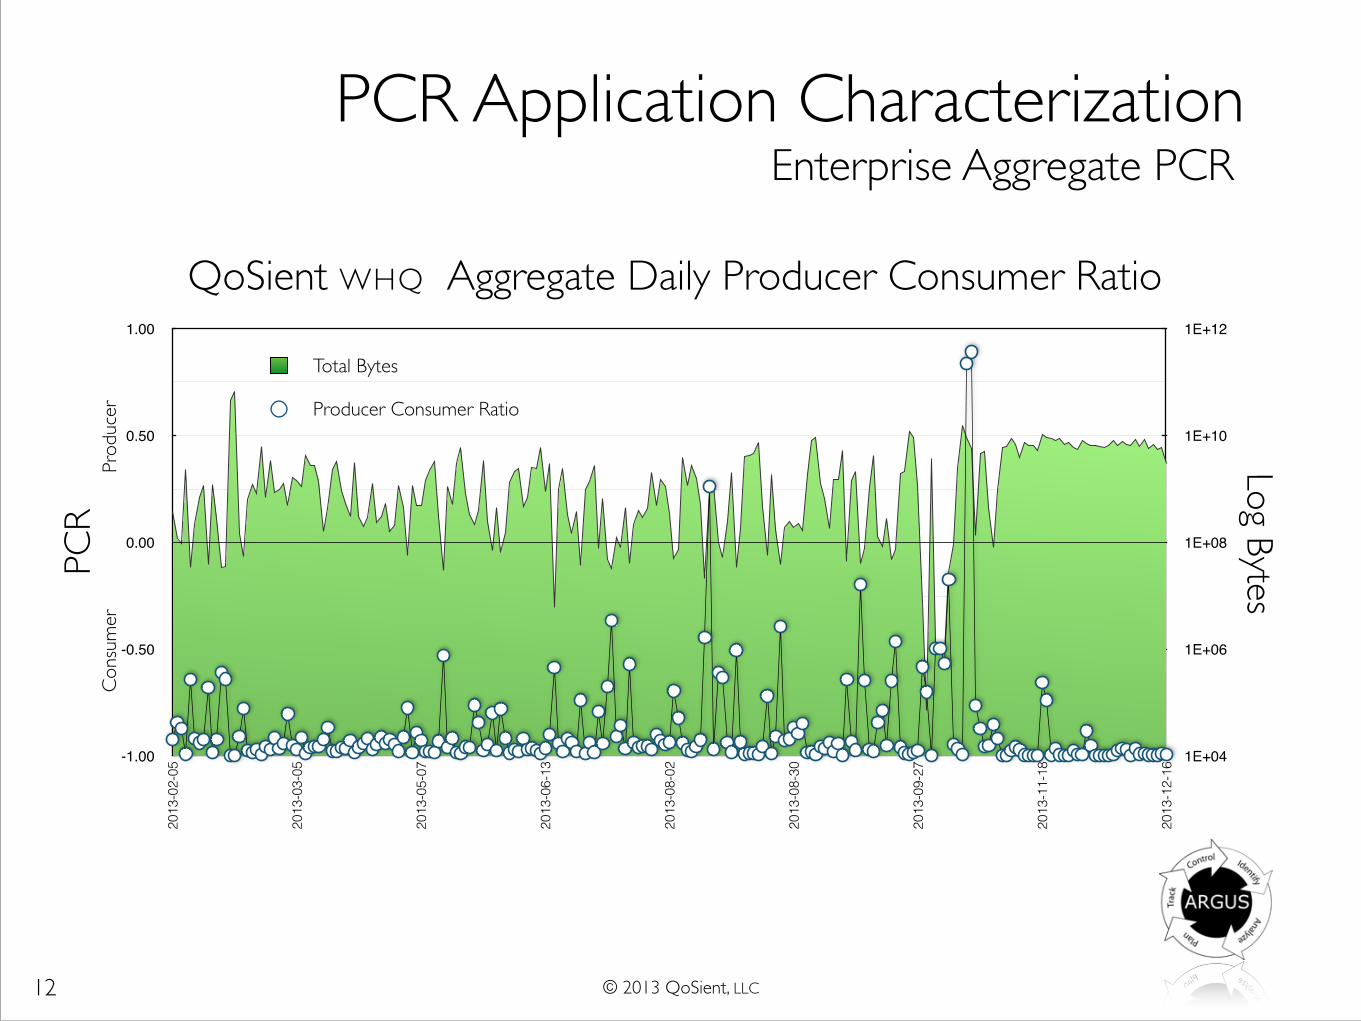
PCR Application CharacterizationEnterprise Aggregate PCR
PCR
QoSient WHQ Aggregate Daily Producer Consumer Ratio
Log Bytes
Producer Consumer Ratio
Total Bytes
Cons
umer
Prod
ucer
© 2013 QoSient, LLC ���13
1E+04
1E+06
1E+08
1E+10
1E+12
-1.00
-0.50
0.00
0.50
1.00
2013
-02-05
2013
-03-05
2013
-05-07
2013
-06-13
2013
-08-02
2013
-08-30
2013
-09-27
2013
-11-18
2013
-12-16
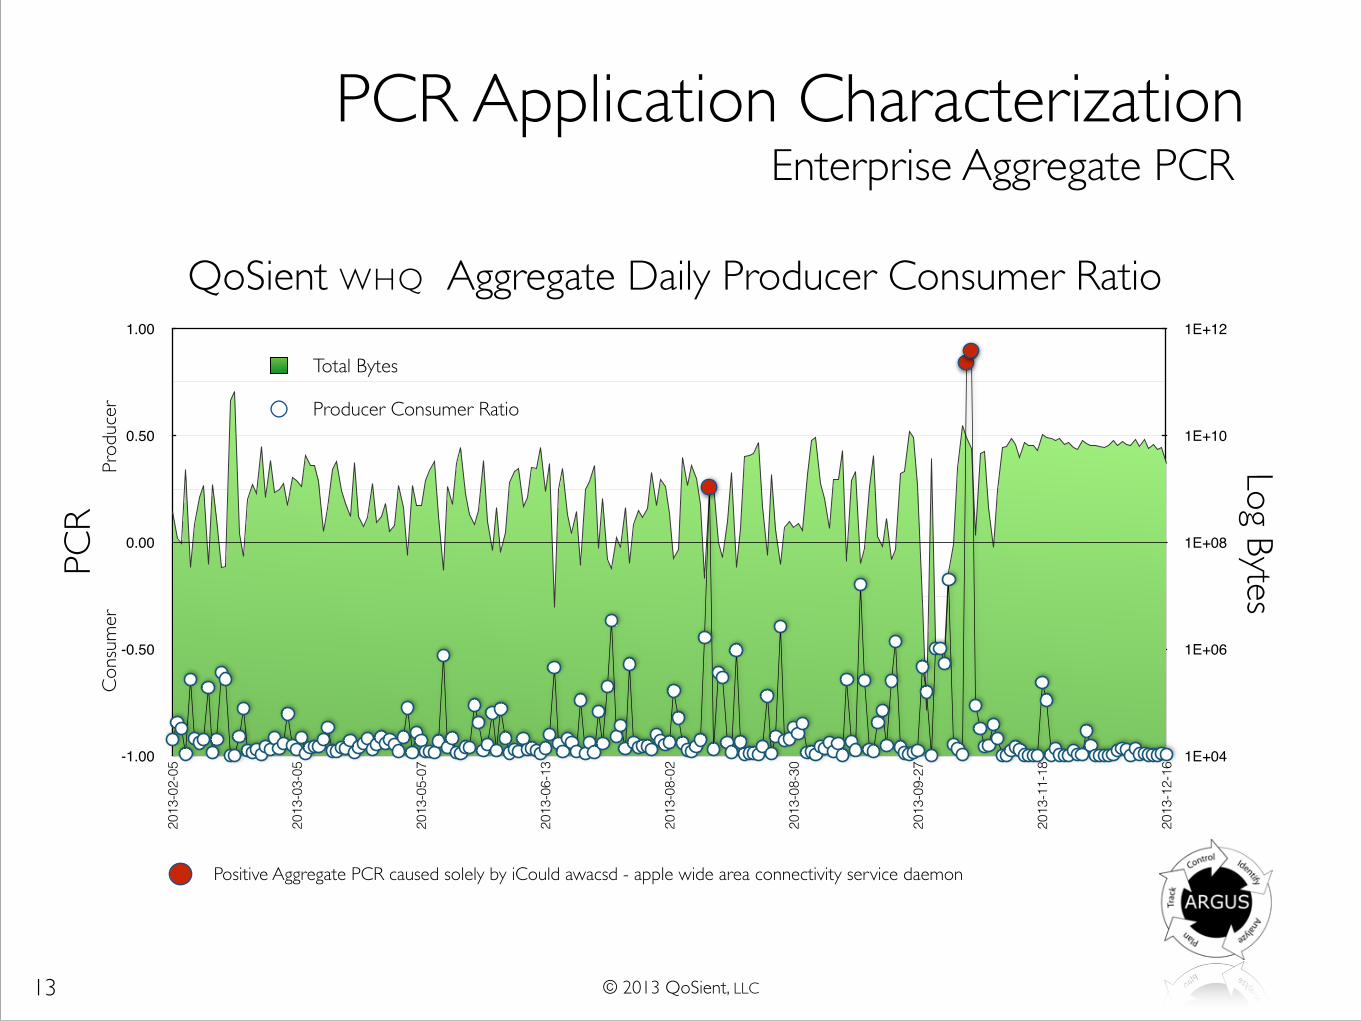
PCR Application CharacterizationEnterprise Aggregate PCR
QoSient WHQ Aggregate Daily Producer Consumer Ratio
Log Bytes
Positive Aggregate PCR caused solely by iCould awacsd - apple wide area connectivity service daemon
Total Bytes
PCR
Producer Consumer Ratio
Cons
umer
Prod
ucer
© 2013 QoSient, LLC ���14
1E+04
1E+06
1E+08
1E+10
1E+12
-1.00
-0.50
0.00
0.50
1.00
2013
-02-05
2013
-03-05
2013
-05-07
2013
-06-13
2013
-08-02
2013
-08-30
2013
-09-27
2013
-11-18
2013
-12-16
PCR Application CharacterizationEnterprise Aggregate PCR
QoSient WHQ Aggregate Daily Producer Consumer Ratio
Log Bytes
Baseline Enterprise PCR - Aggregate PCR value after removing awacsd flow metrics
Total Bytes
PCR
Cons
umer
Prod
ucer Producer Consumer Ratio
Positive Aggregate PCR caused solely by iCould awacsd - apple wide area connectivity service daemon
© 2013 QoSient, LLC ���15
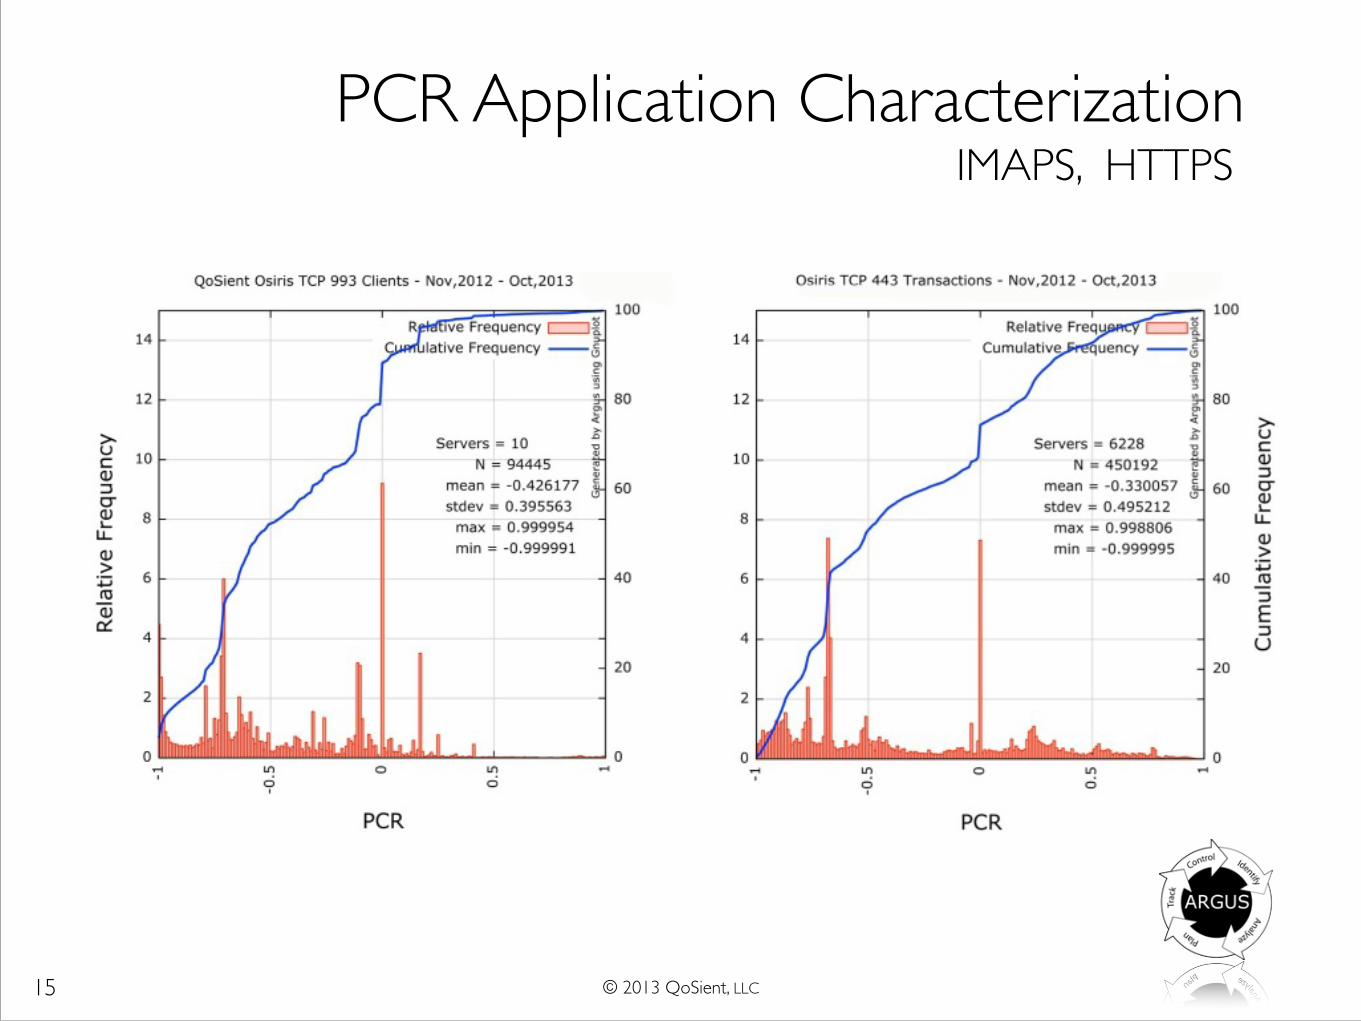
PCR Application CharacterizationIMAPS, HTTPS
© 2013 QoSient, LLC ���16
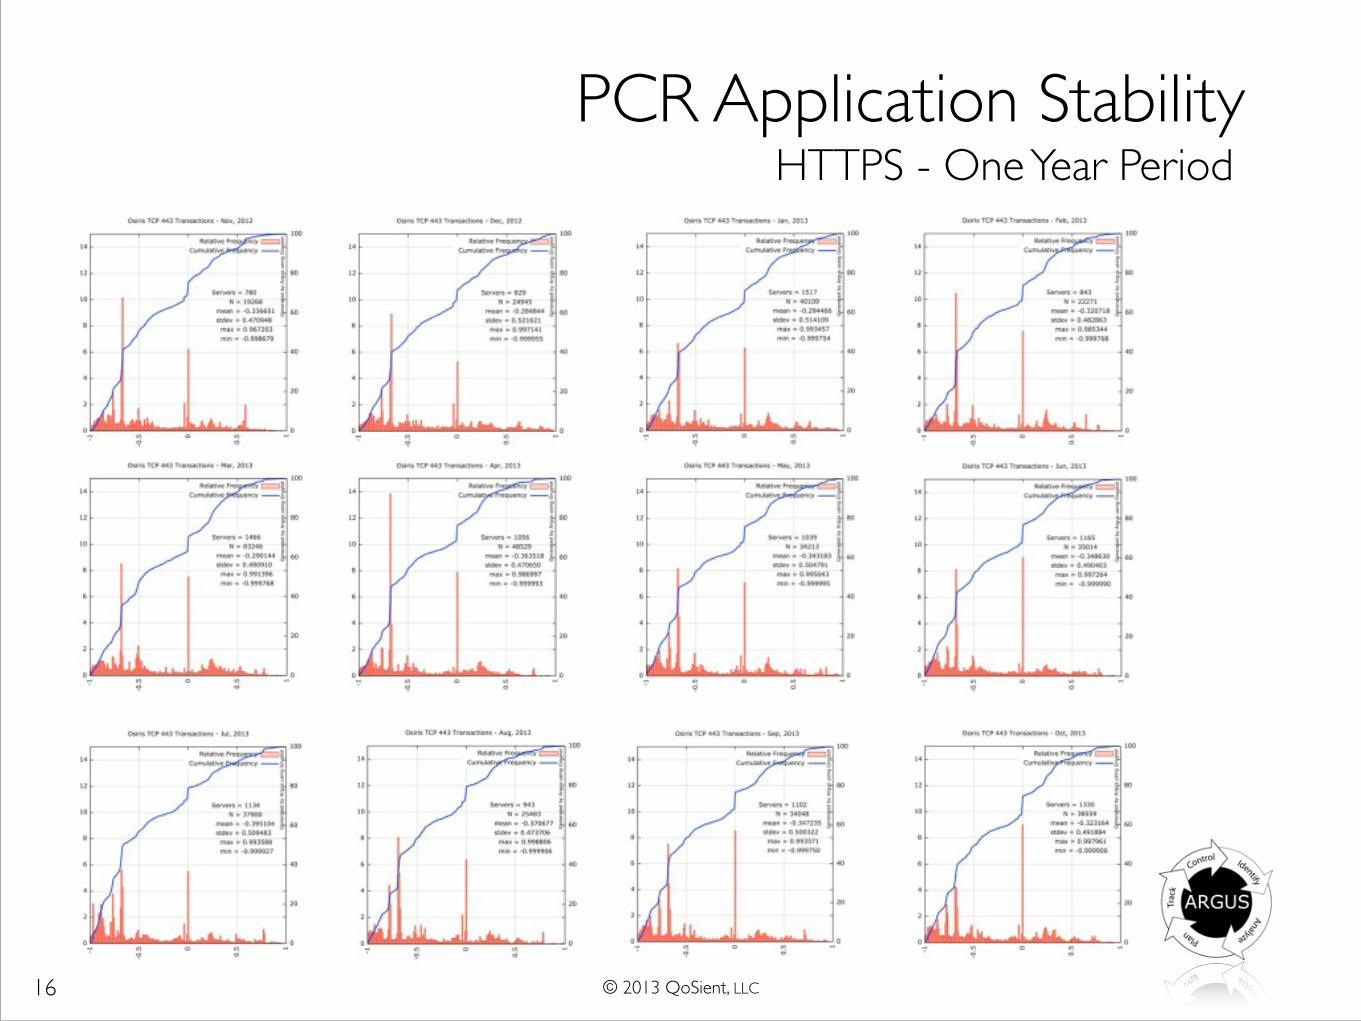
PCR Application StabilityHTTPS - One Year Period
© 2013 QoSient, LLC ���17
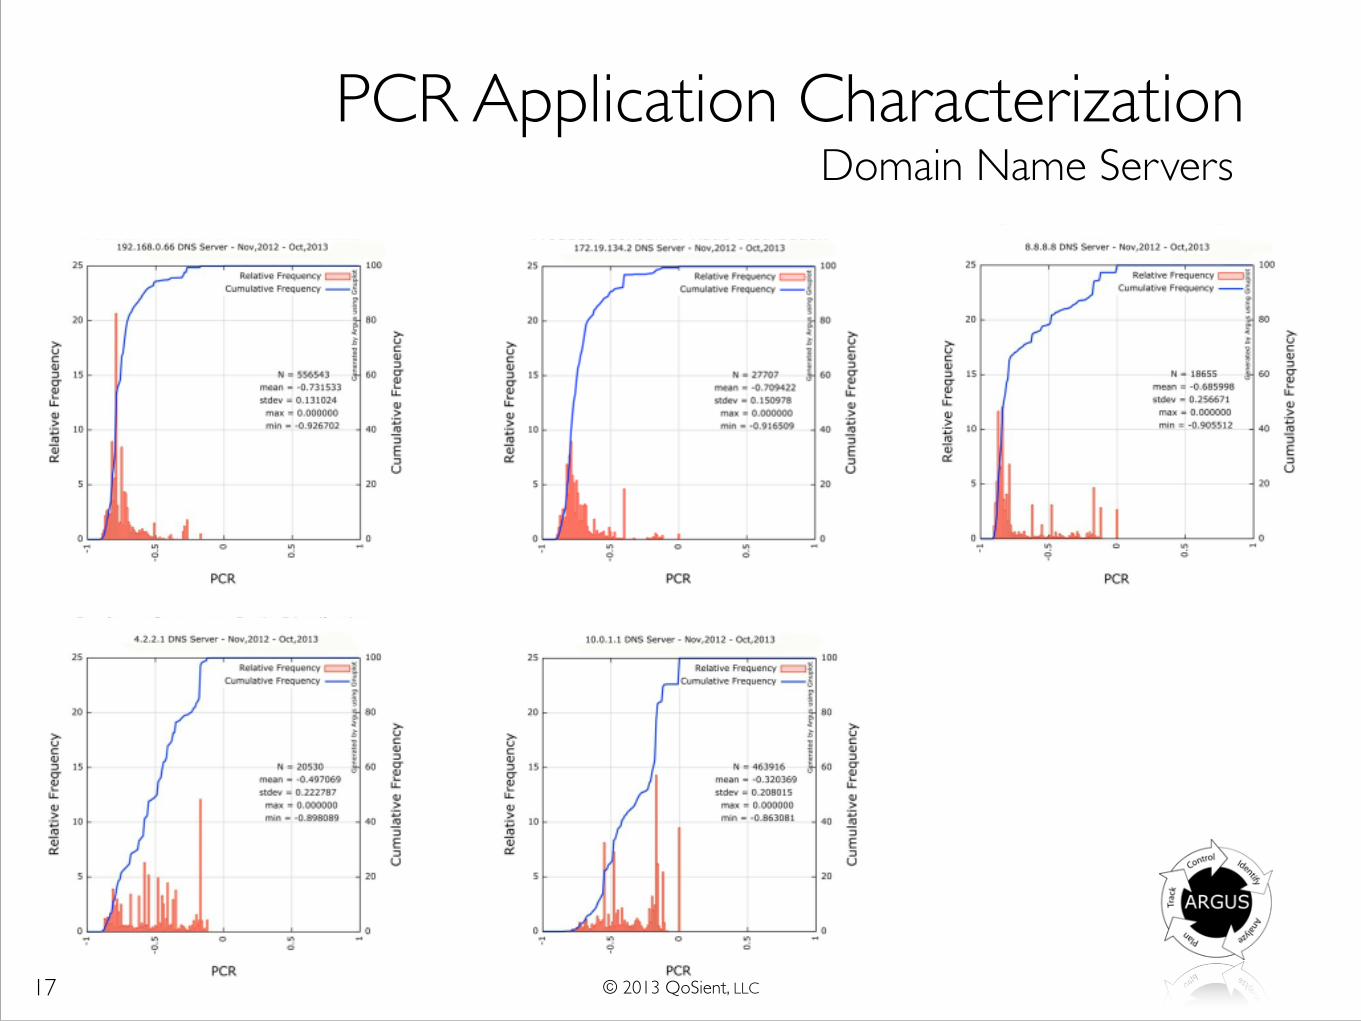
PCR Application CharacterizationDomain Name Servers
© 2013 QoSient, LLC ���18
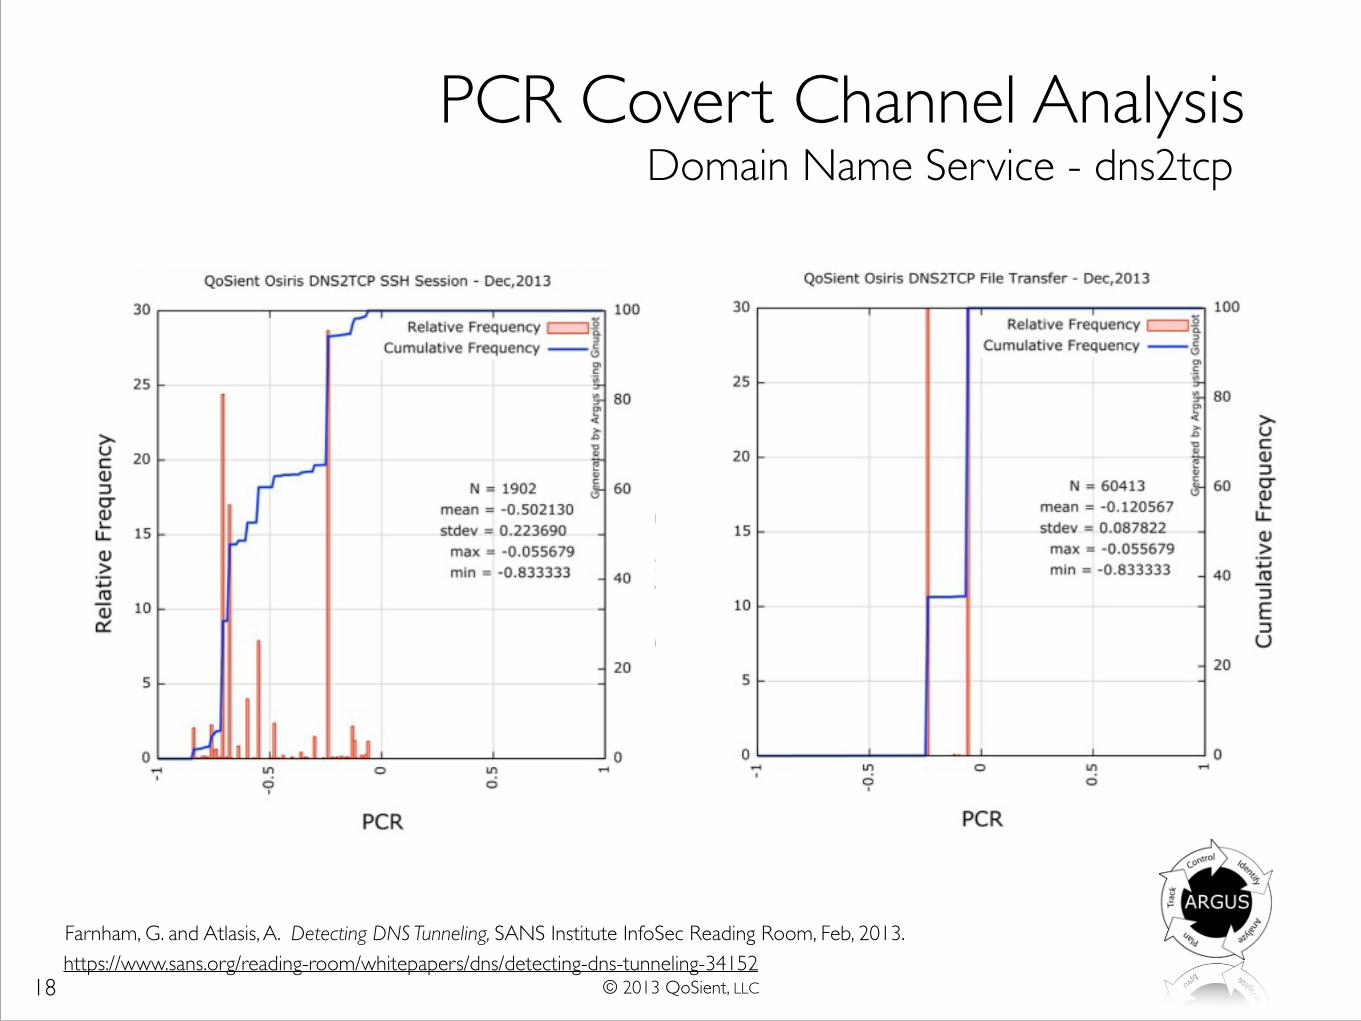
PCR Covert Channel AnalysisDomain Name Service - dns2tcp
https://www.sans.org/reading-room/whitepapers/dns/detecting-dns-tunneling-34152Farnham, G. and Atlasis, A. Detecting DNS Tunneling, SANS Institute InfoSec Reading Room, Feb, 2013.

© 2013 QoSient, LLC
Supporting Slides
���19
© 2013 QoSient, LLC ���20
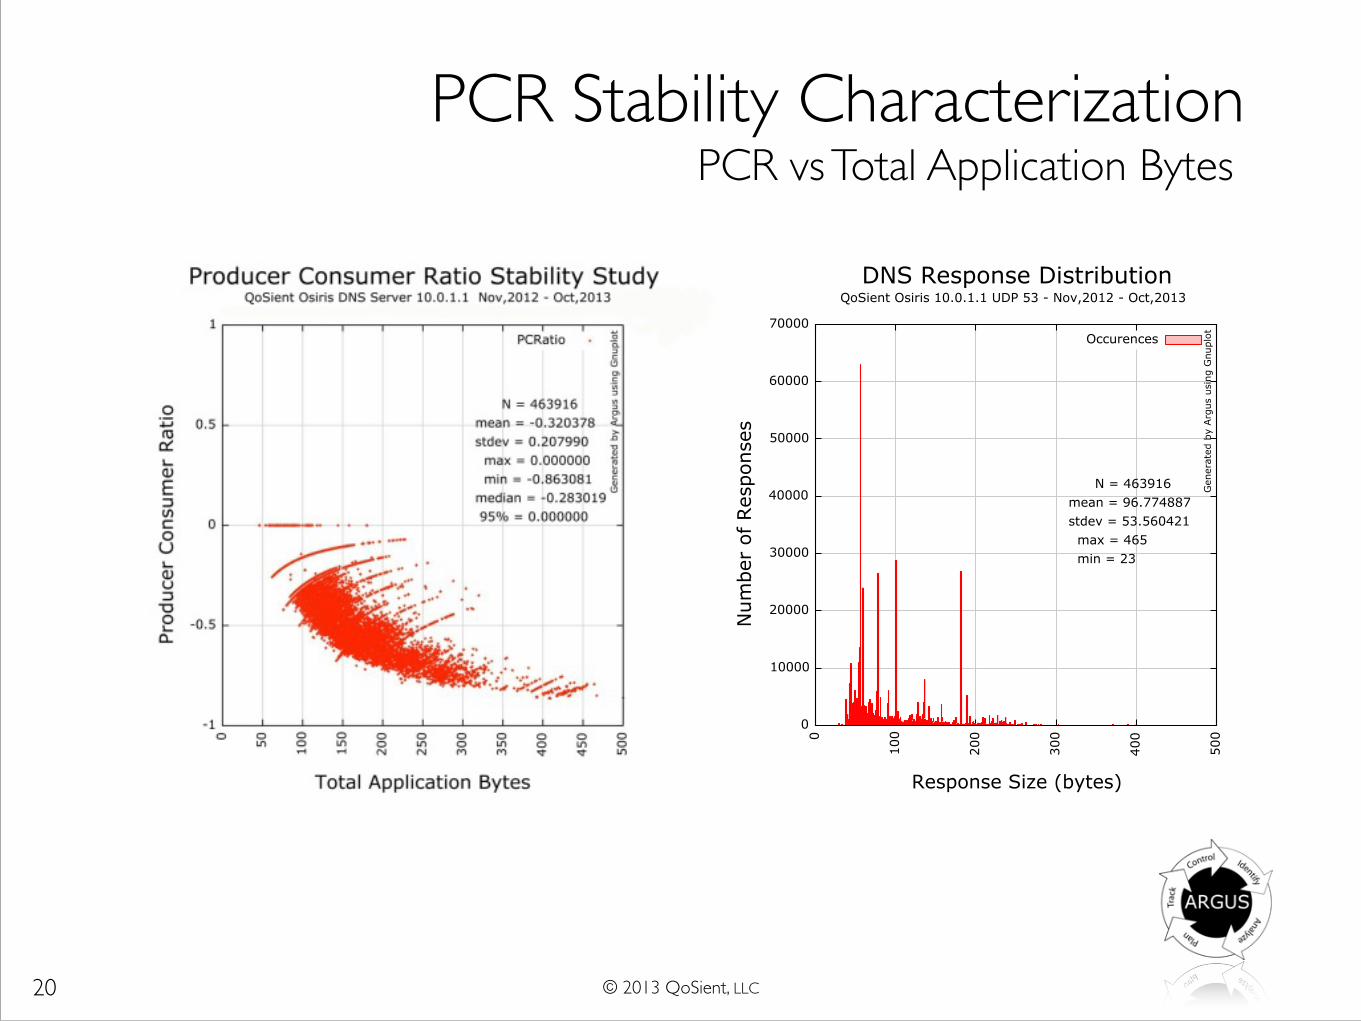
PCR Stability CharacterizationPCR vs Total Application Bytes
Recommended