Ashmore Group plc
9 February 2017
www.ashmoregroup.com
Results for six months ending 31 December 2016

R: 0
G: 41
B: 91
R: 0
G: 174
B: 226
R: 152
G: 152
B: 156
R: 93
G: 92
B: 97
R: 225
G: 160
B: 15
R: 48
G: 144
B: 197
R: 160
G: 1
B: 46
R: 92
G: 146
B: 51
R: 176
G: 194
B: 6
R: 96
G: 187
B: 163
R: 200
G: 98
B: 27
R: 0
G: 127
B: 114
• Emerging Markets outperforming
Blended debt benchmark -1.5% over 6m to 31 Dec 2016, 10yr US Treasury -7.5%
Momentum briefly interrupted by US election, but quickly recovered
Investor sentiment continues to improve
• Strong investment performance
> 90% AuM outperforming over 1 year
> 80% AuM outperforming over 3 years and 5 years
• Robust business model delivering strong financial performance
Good revenue growth (+24%) reflecting performance and stronger US dollar
Continued focus on operating efficiency
Adjusted EBITDA margin increased from 63% to 66%
Interim dividend maintained at 4.55p
Overview
2
R: 0
G: 41
B: 91
R: 0
G: 174
B: 226
R: 152
G: 152
B: 156
R: 93
G: 92
B: 97
R: 225
G: 160
B: 15
R: 48
G: 144
B: 197
R: 160
G: 1
B: 46
R: 92
G: 146
B: 51
R: 176
G: 194
B: 6
R: 96
G: 187
B: 163
R: 200
G: 98
B: 27
R: 0
G: 127
B: 114
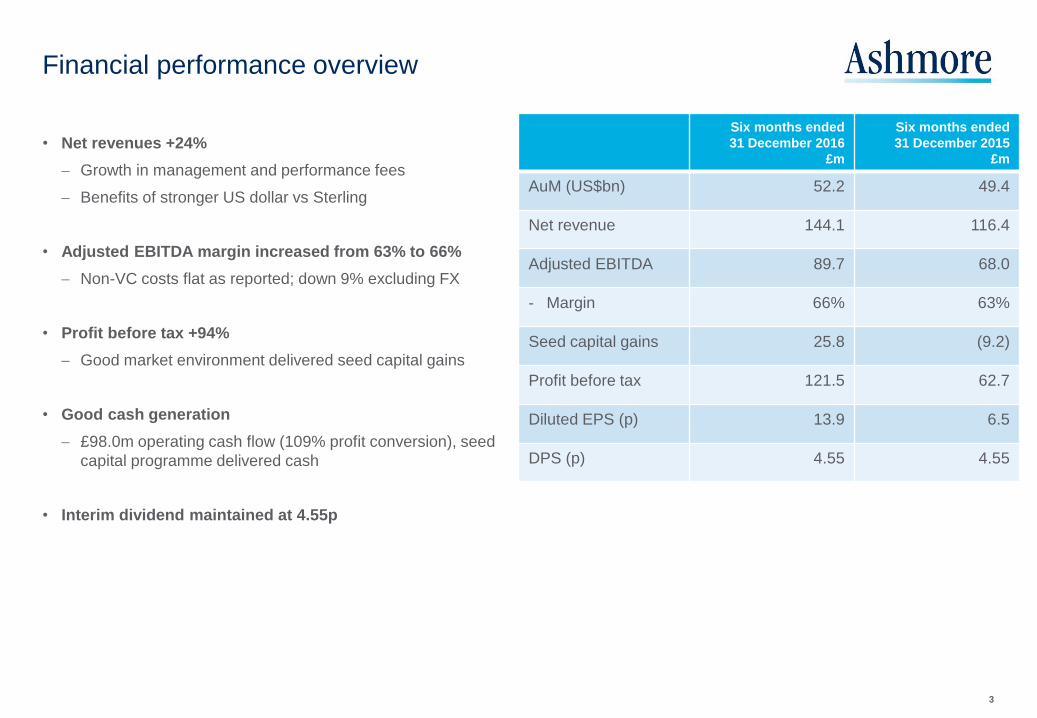
• Net revenues +24%
Growth in management and performance fees
Benefits of stronger US dollar vs Sterling
• Adjusted EBITDA margin increased from 63% to 66%
Non-VC costs flat as reported; down 9% excluding FX
• Profit before tax +94%
Good market environment delivered seed capital gains
• Good cash generation
£98.0m operating cash flow (109% profit conversion), seed
capital programme delivered cash
• Interim dividend maintained at 4.55p
Financial performance overview
3
Six months ended
31 December 2016
£m
Six months ended
31 December 2015
£m
AuM (US$bn) 52.2 49.4
Net revenue 144.1 116.4
Adjusted EBITDA 89.7 68.0
- Margin 66% 63%
Seed capital gains 25.8 (9.2)
Profit before tax 121.5 62.7
Diluted EPS (p) 13.9 6.5
DPS (p) 4.55 4.55

R: 0
G: 41
B: 91
R: 0
G: 174
B: 226
R: 152
G: 152
B: 156
R: 93
G: 92
B: 97
R: 225
G: 160
B: 15
R: 48
G: 144
B: 197
R: 160
G: 1
B: 46
R: 92
G: 146
B: 51
R: 176
G: 194
B: 6
R: 96
G: 187
B: 163
R: 200
G: 98
B: 27
R: 0
G: 127
B: 114
• Gross subscriptions US$5.5 billion, 10% of opening
AuM (H1 2015/16: US$3.4 billion, 6%)
• Gross redemptions US$6.2 billion, 12% of opening
AuM (H1 2015/16: US$9.1 billion, 15%)
• Net outflow US$0.7 billion (H1 2015/16: US$5.7 billion)
Affected by redemptions after US election
• Investment performance +US$0.3 billion
Broad-based further improvement in relative
performance
• Average AuM US$53.3 billion (H1 2015/16: US$53.6
billion)
AuM development (US$bn)
Assets under management
4
Momentum recovered following US election result
52.6 52.2
AuM at 30 Jun2016
Subscriptions Redemptions +ve perf -ve perf AuM at 31 Dec2016
External Local Corporate Blended Equities Alternatives Multi-asset Overlay/liquidity
5.5 (6.2)
0.6 (0.3)
(6.0)
(5.0)
(4.0)
(3.0)
(2.0)
(1.0)
0.0
1.0
2.0
3.0
4.0
Q1'16 Q2'16 Q3'16 Q4'16 Q1'17 Q2'17
Subscriptions Redemptions Net flows

R: 0
G: 41
B: 91
R: 0
G: 174
B: 226
R: 152
G: 152
B: 156
R: 93
G: 92
B: 97
R: 225
G: 160
B: 15
R: 48
G: 144
B: 197
R: 160
G: 1
B: 46
R: 92
G: 146
B: 51
R: 176
G: 194
B: 6
R: 96
G: 187
B: 163
R: 200
G: 98
B: 27
R: 0
G: 127
B: 114
• Allocations are underweight
Typical institutional target is mid-single digits (5-7%), some are as
low as 1-2%
Retail investors in a similar position (e.g. 2-5% allocation)
Short pause in flow momentum after US election, but client activity
levels increasing
• Consolidated US operations into NY global operating hub
Specialist equities investment professionals located alongside
distribution and support functions
• Local fund management platforms
Local platforms manage >US$2bn (~5% of Group AuM), more
than double AuM of three years ago
Disciplined approach to portfolio of local businesses
34% of AuM from EM clients
Clients and products
5
Growth potential across diverse clients and geographies
AuM by client type
AuM by client location
18%
10%
13%
28%
16%
3%
10% 2%
Central banks
Sovereign wealth funds
Governments
Pension plans
Corporates/Financial institutions
Fund/Sub-advisers
Third-party intermediaries
Foundations/Endowments
22%
27%
9%
23%
19% Americas
Europe ex UK
UK
Middle East & Africa
Asia Pacific

R: 0
G: 41
B: 91
R: 0
G: 174
B: 226
R: 152
G: 152
B: 156
R: 93
G: 92
B: 97
R: 225
G: 160
B: 15
R: 48
G: 144
B: 197
R: 160
G: 1
B: 46
R: 92
G: 146
B: 51
R: 176
G: 194
B: 6
R: 96
G: 187
B: 163
R: 200
G: 98
B: 27
R: 0
G: 127
B: 114
Six months ended
31 December 2016
£m
Six months ended
31 December 2015
£m
Variance
%
Management fees 116.8 99.3 18
Distribution costs (1.9) (0.6) n/m
Net management fees 114.9 98.7 16
Performance fees 21.6 8.6 151
Other revenue 2.2 2.1 5
Foreign exchange 5.4 7.0 (23)
Net revenue 144.1 116.4 24
Financial results
Revenues
6
• At constant currency:
Net management fees -3%
Net revenue flat
Revenues benefit from currency and performance
R: 0
G: 41
B: 91
R: 0
G: 174
B: 226
R: 152
G: 152
B: 156
R: 93
G: 92
B: 97
R: 225
G: 160
B: 15
R: 48
G: 144
B: 197
R: 160
G: 1
B: 46
R: 92
G: 146
B: 51
R: 176
G: 194
B: 6
R: 96
G: 187
B: 163
R: 200
G: 98
B: 27
R: 0
G: 127
B: 114
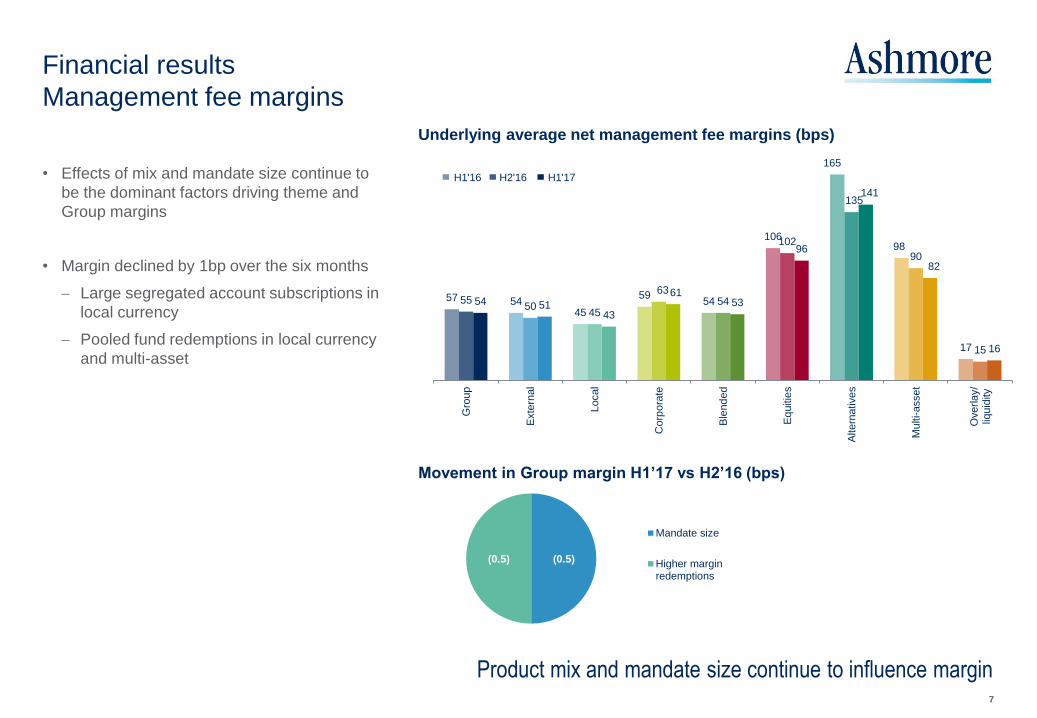
• Effects of mix and mandate size continue to
be the dominant factors driving theme and
Group margins
• Margin declined by 1bp over the six months
Large segregated account subscriptions in
local currency
Pooled fund redemptions in local currency
and multi-asset
Financial results
Management fee margins
7
Product mix and mandate size continue to influence margin
Underlying average net management fee margins (bps)
57 54 45
59 54
106
165
98
17
55 50
45
63 54
102
135
90
15
54 51 43
61 53
96
141
82
16
Gro
up
Exte
rnal
Local
Corp
ora
te
Ble
nd
ed
Eq
uitie
s
Altern
atives
Mu
lti-asset
Overlay/
liquid
ity
H1'16 H2'16 H1'17
Movement in Group margin H1’17 vs H2’16 (bps)
(0.5) (0.5)
Mandate size
Higher marginredemptions
R: 0
G: 41
B: 91
R: 0
G: 174
B: 226
R: 152
G: 152
B: 156
R: 93
G: 92
B: 97
R: 225
G: 160
B: 15
R: 48
G: 144
B: 197
R: 160
G: 1
B: 46
R: 92
G: 146
B: 51
R: 176
G: 194
B: 6
R: 96
G: 187
B: 163
R: 200
G: 98
B: 27
R: 0
G: 127
B: 114
Six months ended
31 December 2016
£m
Six months ended
31 December 2015
£m
Variance
%
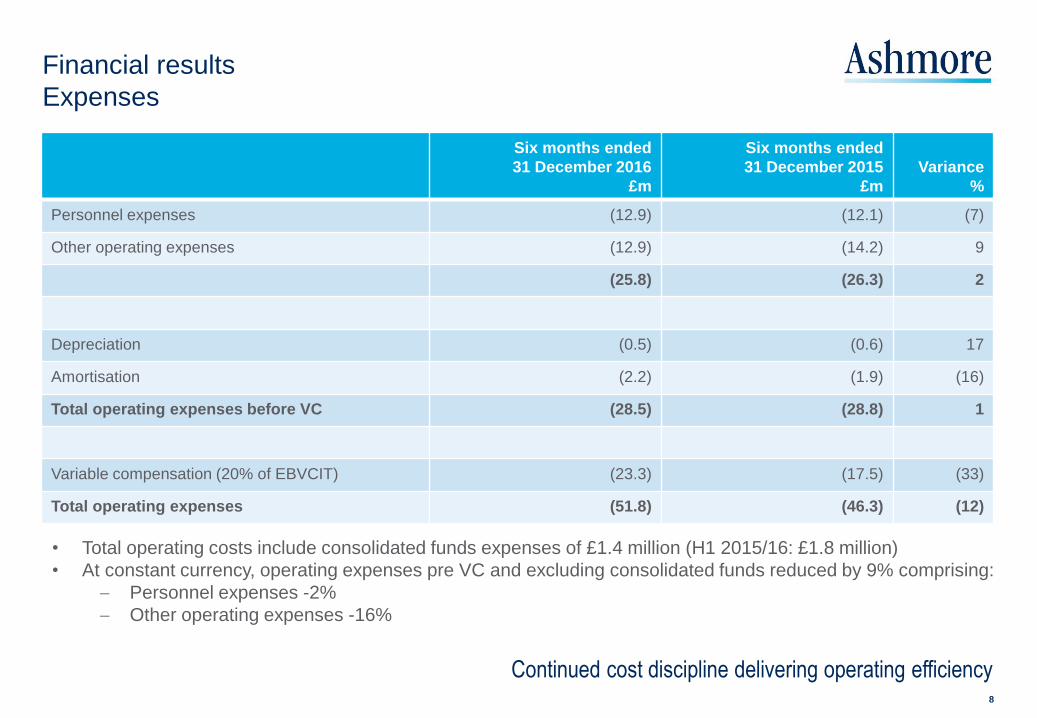
Personnel expenses (12.9) (12.1) (7)
Other operating expenses (12.9) (14.2) 9
(25.8) (26.3) 2
Depreciation (0.5) (0.6) 17
Amortisation (2.2) (1.9) (16)
Total operating expenses before VC (28.5) (28.8) 1
Variable compensation (20% of EBVCIT) (23.3) (17.5) (33)
Total operating expenses (51.8) (46.3) (12)
Financial results
Expenses
8
Continued cost discipline delivering operating efficiency
• Total operating costs include consolidated funds expenses of £1.4 million (H1 2015/16: £1.8 million)
• At constant currency, operating expenses pre VC and excluding consolidated funds reduced by 9% comprising:
Personnel expenses -2%
Other operating expenses -16%
R: 0
G: 41
B: 91
R: 0
G: 174
B: 226
R: 152
G: 152
B: 156
R: 93
G: 92
B: 97
R: 225
G: 160
B: 15
R: 48
G: 144
B: 197
R: 160
G: 1
B: 46
R: 92
G: 146
B: 51
R: 176
G: 194
B: 6
R: 96
G: 187
B: 163
R: 200
G: 98
B: 27
R: 0
G: 127
B: 114
Six months ended
31 December 2016
£m
Six months ended
31 December 2015
£m
Variance
%
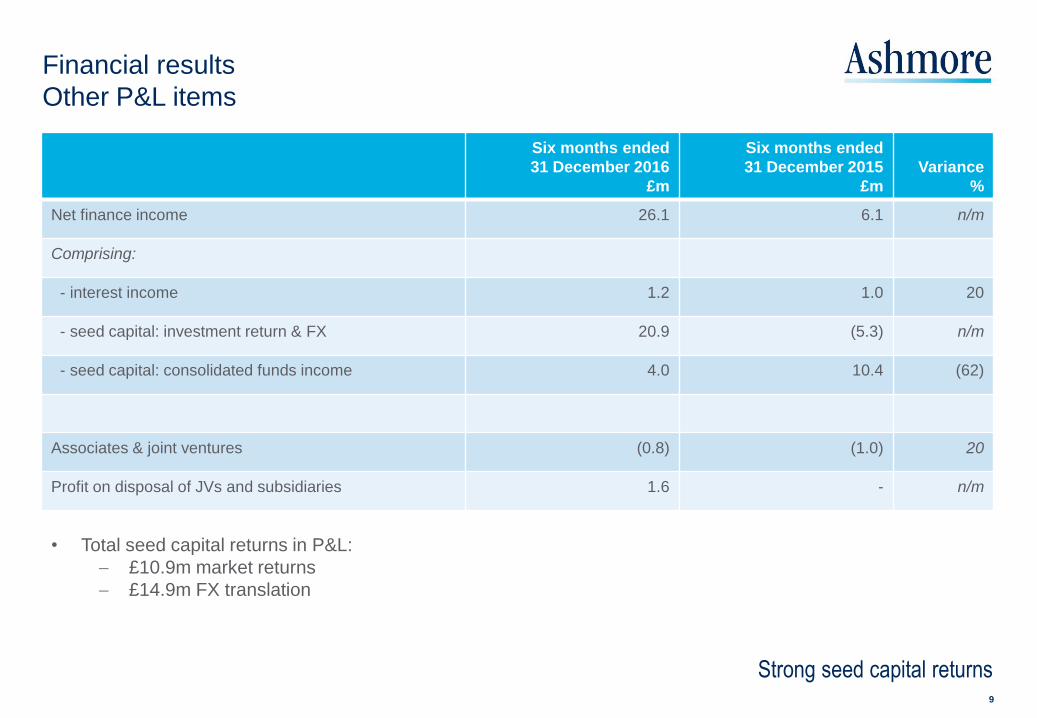
Net finance income 26.1 6.1 n/m
Comprising:
- interest income 1.2 1.0 20
- seed capital: investment return & FX 20.9 (5.3) n/m
- seed capital: consolidated funds income 4.0 10.4 (62)
Associates & joint ventures (0.8) (1.0) 20
Profit on disposal of JVs and subsidiaries 1.6 - n/m
Financial results
Other P&L items
9
Strong seed capital returns
• Total seed capital returns in P&L:
£10.9m market returns
£14.9m FX translation

R: 0
G: 41
B: 91
R: 0
G: 174
B: 226
R: 152
G: 152
B: 156
R: 93
G: 92
B: 97
R: 225
G: 160
B: 15
R: 48
G: 144
B: 197
R: 160
G: 1
B: 46
R: 92
G: 146
B: 51
R: 176
G: 194
B: 6
R: 96
G: 187
B: 163
R: 200
G: 98
B: 27
R: 0
G: 127
B: 114
Statutory
H1 2016/17
£m
Seed capital-
related items
£m
FX translation
£m
Adjusted
H1 2016/17
£m
Adjusted
H1 2015/16
£m %
Net revenue 144.1 - (8.4) 135.7 108.4 25
Investment securities & third-party interests 2.3 (2.3) - - -
Operating expenses1 (49.1) 1.4 1.7 (46.0) (40.4) 14
EBITDA 97.3 (0.9) (6.7) 89.7 68.0 32
EBITDA margin 68% - - 66% 63%
Depreciation and amortisation (2.7) - - (2.7) (2.5) (8)
Net finance income 26.1 (10.0) (14.9) 1.2 1.0 20
Associates and joint ventures 0.8 - - 0.8 (1.0) n/m
121.5 (10.9) (21.6) 89.0 65.5 36
Seed capital-related items - 10.9 - 10.9 (8.3) n/m
Foreign exchange translation - - 21.6 21.6 5.5 n/m
Profit before tax 121.5 - - 121.5 62.7 94
Financial results
Adjusted profits
10
Business model delivers higher operating margin
1. For the purposes of presenting ‘Adjusted profits’, operating expenses in H1 2016/17 and H1 2015/16
have been adjusted for the variable compensation on FX translation gains and losses.
R: 0
G: 41
B: 91
R: 0
G: 174
B: 226
R: 152
G: 152
B: 156
R: 93
G: 92
B: 97
R: 225
G: 160
B: 15
R: 48
G: 144
B: 197
R: 160
G: 1
B: 46
R: 92
G: 146
B: 51
R: 176
G: 194
B: 6
R: 96
G: 187
B: 163
R: 200
G: 98
B: 27
R: 0
G: 127
B: 114
Six months ended
31 December 2016
£m
Six months ended
31 December 2015
£m
Variance
%
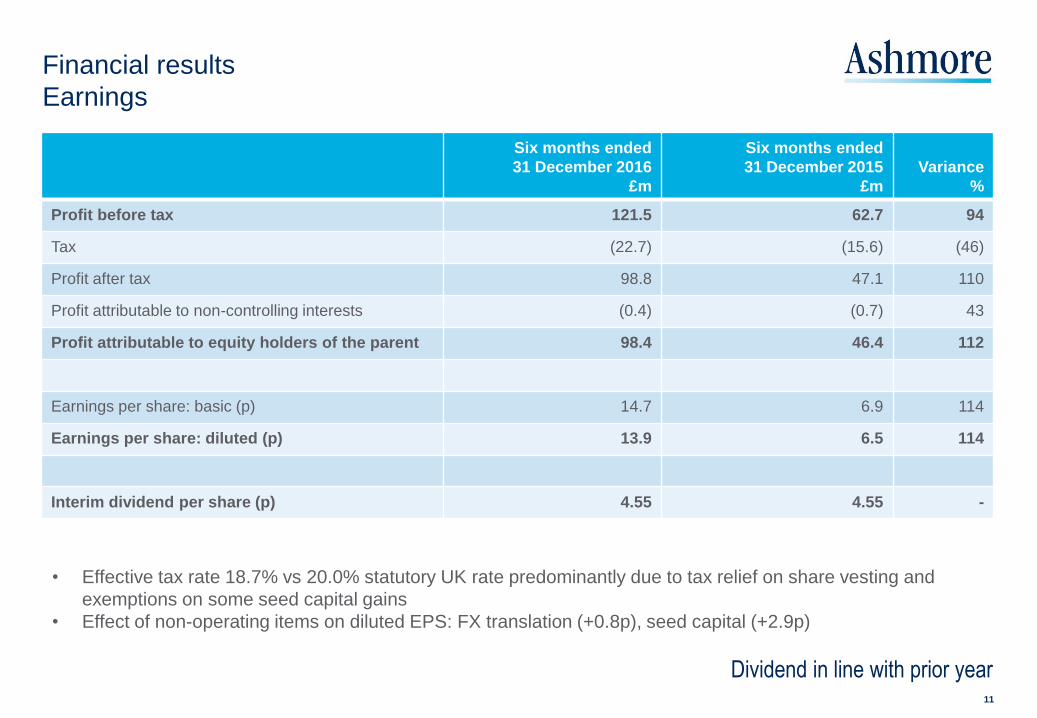
Profit before tax 121.5 62.7 94
Tax (22.7) (15.6) (46)
Profit after tax 98.8 47.1 110
Profit attributable to non-controlling interests (0.4) (0.7) 43
Profit attributable to equity holders of the parent 98.4 46.4 112
Earnings per share: basic (p) 14.7 6.9 114
Earnings per share: diluted (p) 13.9 6.5 114
Interim dividend per share (p) 4.55 4.55 -
Financial results
Earnings
11
Dividend in line with prior year
• Effective tax rate 18.7% vs 20.0% statutory UK rate predominantly due to tax relief on share vesting and
exemptions on some seed capital gains
• Effect of non-operating items on diluted EPS: FX translation (+0.8p), seed capital (+2.9p)

R: 0
G: 41
B: 91
R: 0
G: 174
B: 226
R: 152
G: 152
B: 156
R: 93
G: 92
B: 97
R: 225
G: 160
B: 15
R: 48
G: 144
B: 197
R: 160
G: 1
B: 46
R: 92
G: 146
B: 51
R: 176
G: 194
B: 6
R: 96
G: 187
B: 163
R: 200
G: 98
B: 27
R: 0
G: 127
B: 114
• Market value £233.4 million (30 June 2016: £238.5 million)
Seeded funds’ AuM growth enabled recycling of £69.7
million, e.g. from short duration and local Indonesia funds
60% in liquid funds
• Profit contribution of £25.8 million
largely unrealised at period end
• New investments of £40.3 million, e.g. into absolute return
and multi-asset funds
• Seeding has supported funds that represent 11% of Group
AuM
Financial results
Seed capital
12
Diversified across themes (% of market value)
Actively-managed programme delivering AuM scale and profits
£m
Market
returns FX Total
- consolidated funds 4.9 - 4.9
- other funds 6.0 14.9 20.9
Total 10.9 14.9 25.8
P&L gains/(losses) on seed capital in H1 2016/17
5% 6%
8%
32% 21%
18%
10% External debt
Local currency
Corporate Debt
Blended debt
Equities
Alternatives
Multi-asset
R: 0
G: 41
B: 91
R: 0
G: 174
B: 226
R: 152
G: 152
B: 156
R: 93
G: 92
B: 97
R: 225
G: 160
B: 15
R: 48
G: 144
B: 197
R: 160
G: 1
B: 46
R: 92
G: 146
B: 51
R: 176
G: 194
B: 6
R: 96
G: 187
B: 163
R: 200
G: 98
B: 27
R: 0
G: 127
B: 114
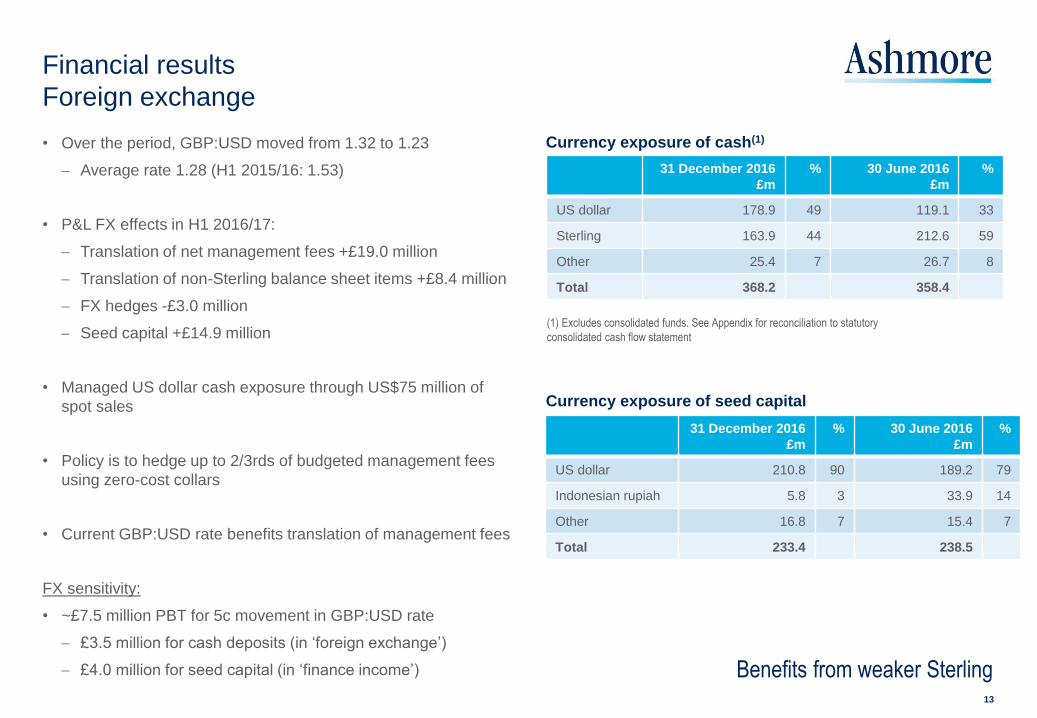
Currency exposure of cash(1) • Over the period, GBP:USD moved from 1.32 to 1.23
Average rate 1.28 (H1 2015/16: 1.53)
• P&L FX effects in H1 2016/17:
Translation of net management fees +£19.0 million
Translation of non-Sterling balance sheet items +£8.4 million
FX hedges -£3.0 million
Seed capital +£14.9 million
• Managed US dollar cash exposure through US$75 million of
spot sales
• Policy is to hedge up to 2/3rds of budgeted management fees
using zero-cost collars
• Current GBP:USD rate benefits translation of management fees
FX sensitivity:
• ~£7.5 million PBT for 5c movement in GBP:USD rate
£3.5 million for cash deposits (in ‘foreign exchange’)
£4.0 million for seed capital (in ‘finance income’)
Financial results
Foreign exchange
13
(1) Excludes consolidated funds. See Appendix for reconciliation to statutory
consolidated cash flow statement
Benefits from weaker Sterling
31 December 2016
£m
% 30 June 2016
£m
%
US dollar 178.9 49 119.1 33
Sterling 163.9 44 212.6 59
Other 25.4 7 26.7 8
Total 368.2 358.4
Currency exposure of seed capital
31 December 2016
£m
% 30 June 2016
£m
%
US dollar 210.8 90 189.2 79
Indonesian rupiah 5.8 3 33.9 14
Other 16.8 7 15.4 7
Total 233.4 238.5

R: 0
G: 41
B: 91
R: 0
G: 174
B: 226
R: 152
G: 152
B: 156
R: 93
G: 92
B: 97
R: 225
G: 160
B: 15
R: 48
G: 144
B: 197
R: 160
G: 1
B: 46
R: 92
G: 146
B: 51
R: 176
G: 194
B: 6
R: 96
G: 187
B: 163
R: 200
G: 98
B: 27
R: 0
G: 127
B: 114
• Cash increased in the period
• Operations generated cash flow of
£98.0 million (1)
109% of adjusted EBITDA
(H1 2015/16: 87%)
• H1 has seasonal effects
Prior year final dividend
Prior year bonuses
Tax payment
• Other cash flows
EBT purchases to offset dilution
Seed capital activity generated
cash
(1) Excludes consolidated funds. See Appendix for reconciliation to
statutory consolidated cash flow statement
Cash flow (£m) (1)
Financial results
Cash flow
14
Operating model and seed capital programme generate good cash flow
358.4 368.2
98.0
24.4 4.8 1.1 6.1
26.2 86.6
11.8
Openin
g c
ash
Opera
tio
ns
Ta
xatio
n
Div
idends
EB
T p
urc
hases
Net seedin
g
Acquis
itio
ns/d
isp
osals
Inte
rest
FX
and o
ther
Clo
sin
g c
ash

R: 0
G: 41
B: 91
R: 0
G: 174
B: 226
R: 152
G: 152
B: 156
R: 93
G: 92
B: 97
R: 225
G: 160
B: 15
R: 48
G: 144
B: 197
R: 160
G: 1
B: 46
R: 92
G: 146
B: 51
R: 176
G: 194
B: 6
R: 96
G: 187
B: 163
R: 200
G: 98
B: 27
R: 0
G: 127
B: 114
• Strong, well-capitalised, liquid balance sheet
with no debt
• Excess regulatory capital of £509.3 million
• 83% of balance sheet is liquid
Majority of seed capital is in funds with at
least monthly dealing frequency
(1) Excludes consolidated funds. See Appendix for reconciliation to statutory consolidated cash flow statement
(2) Total equity less deductions for intangibles, goodwill and associates
(3) Per Pillar 3 disclosures as at 30 June 2016
Financial results
Balance sheet
15
Strong, liquid balance sheet
99.9
7.6
93.6
509.3
139.7
368.2
Regulatory
capital
requirement (3)
Excess
capital
Cash and cash
equivalents (1)
Seed capital
- liquid
- illiquid
Other net assets
Financial resources = £609.2 million (2) Liquid balance sheet structure
72p/share
14p/share

R: 0
G: 41
B: 91
R: 0
G: 174
B: 226
R: 152
G: 152
B: 156
R: 93
G: 92
B: 97
R: 225
G: 160
B: 15
R: 48
G: 144
B: 197
R: 160
G: 1
B: 46
R: 92
G: 146
B: 51
R: 176
G: 194
B: 6
R: 96
G: 187
B: 163
R: 200
G: 98
B: 27
R: 0
G: 127
B: 114
Outperforming Underperforming
AuM outperforming versus benchmark,
gross 1 year annualised
Investment performance
16
AuM outperforming versus benchmark,
gross 3 years annualised AuM outperforming versus benchmark,
gross 5 years annualised
Investment processes delivering strong outperformance
55%
69%
91%
14%
63%
81%
64%
73%
86%
Exte
rnal
Local
Corp
ora
te
Ble
nd
ed
Eq
uitie
s
Mu
lti-asset
Gro
up D
ec'1
5
Gro
up J
un'1
6
Gro
up D
ec'1
6
Exte
rnal
Local
Corp
ora
te
Ble
nd
ed
Eq
uitie
s
Mu
lti-asset
Gro
up D
ec'1
5
Gro
up J
un'1
6
Gro
up D
ec'1
6
Exte
rnal
Local
Corp
ora
te
Ble
nd
ed
Eq
uitie
s
Mu
lti-asset
Gro
up D
ec'1
5
Gro
up J
un'1
6
Gro
up D
ec'1
6

R: 0
G: 41
B: 91
R: 0
G: 174
B: 226
R: 152
G: 152
B: 156
R: 93
G: 92
B: 97
R: 225
G: 160
B: 15
R: 48
G: 144
B: 197
R: 160
G: 1
B: 46
R: 92
G: 146
B: 51
R: 176
G: 194
B: 6
R: 96
G: 187
B: 163
R: 200
G: 98
B: 27
R: 0
G: 127
B: 114
Emerging Markets environment
• EM GDP growth accelerating after macro adjustments
• Institutions are underweight
• Despite recent performance, still attractive valuations
• Political risk remains, DM more than EM
• Diversity of asset classes and >65 countries is important
2017 outlook
17
Positive Emerging Markets outlook for 2017
Asset classes
External debt
• Potential to continue to outperform as US rates rise, with spread
of >300bps over UST
Local currency
• Attractive yields, potential for rate cuts
• Active FX management is critical
Corporate debt
• Index spreads are tight, credit selection is important
Blended debt
• Alpha available through active management of diverse asset
classes (e.g. +850bps in 2016)
Specialist equities
• Uncorrelated and high returns from inefficient markets, e.g.
Frontier +12.6% in 2016 vs benchmark +2.7%
External debt index returns (%, 2016)
-50
-40
-30
-20
-10
0
10
20
30
40
50
60
EMBI GD index = +10%
Venezuela +53%
Belize -36%
R: 0
G: 41
B: 91
R: 0
G: 174
B: 226
R: 152
G: 152
B: 156
R: 93
G: 92
B: 97
R: 225
G: 160
B: 15
R: 48
G: 144
B: 197
R: 160
G: 1
B: 46
R: 92
G: 146
B: 51
R: 176
G: 194
B: 6
R: 96
G: 187
B: 163
R: 200
G: 98
B: 27
R: 0
G: 127
B: 114
• Markets performing well, yet institutional allocations are underweight
• Investment performance continues to be strong, both absolute and relative to benchmarks and peers
• Good operational and financial performance in H1 2016/17
• Operating margin increased, good cash generation and maintained strong balance sheet
• Positive outlook for 2017
Summary
18

Appendices

R: 0
G: 41
B: 91
R: 0
G: 174
B: 226
R: 152
G: 152
B: 156
R: 93
G: 92
B: 97
R: 225
G: 160
B: 15
R: 48
G: 144
B: 197
R: 160
G: 1
B: 46
R: 92
G: 146
B: 51
R: 176
G: 194
B: 6
R: 96
G: 187
B: 163
R: 200
G: 98
B: 27
R: 0
G: 127
B: 114
H1 2016/17
£m
H1 2015/16
£m
H1 2016/17
US$m
H1 2015/16
US$m
External debt 23.6 19.9 30.0 30.2
Local currency 22.7 19.8 28.9 30.2
Corporate debt 12.7 11.3 16.2 17.2
Blended debt 30.8 25.6 39.2 39.1
Equities 11.4 11.5 14.5 17.5
Alternatives 7.9 5.0 10.0 7.5
Multi-asset 3.8 4.2 4.8 6.5
Overlay / liquidity 2.0 1.4 2.5 2.2
Total net management fee income 114.9 98.7 146.1 150.4
Appendix 1
Net management and performance fees by theme
20
H1 2016/17
£m
H1 2015/16
£m
H1 2016/17
US$m
H1 2015/16
US$m
External debt 8.3 0.1 10.9 0.1
Local currency 10.8 - 13.3 -
Corporate debt - - - -
Blended debt 2.5 - 3.1 -
Equities - - - -
Alternatives - 8.5 - 12.5
Multi-asset - - - -
Overlay / liquidity - - - -
Total performance fee income 21.6 8.6 27.3 12.6

R: 0
G: 41
B: 91
R: 0
G: 174
B: 226
R: 152
G: 152
B: 156
R: 93
G: 92
B: 97
R: 225
G: 160
B: 15
R: 48
G: 144
B: 197
R: 160
G: 1
B: 46
R: 92
G: 146
B: 51
R: 176
G: 194
B: 6
R: 96
G: 187
B: 163
R: 200
G: 98
B: 27
R: 0
G: 127
B: 114
AuM by theme (US$bn) AuM as invested (US$bn)
AuM by client location AuM by client type
Appendix 2a
Assets under management
21
11.4
12.4
5.2
14.1
2.9 1.5
1.1 3.6
External debt
Local currency
Corporate debt
Blended debt
Equities
Alternatives
Multi-asset
Overlay/liquidity
20.4
15.8
7.2
3.3 1.7
3.8 External debt
Local currency
Corporate debt
Equities
Alternatives
Overlay/liquidity
18%
10%
13%
28%
16%
3% 10% 2%
Central banks
Sovereign wealth funds
Governments
Pension plans
Corporates/Financial institutions
Fund/Sub-advisers
Third-party intermediaries
Foundations/Endowments
22%
27%
9%
23%
19% Americas
Europe ex UK
UK
Middle East & Africa
Asia Pacific

R: 0
G: 41
B: 91
R: 0
G: 174
B: 226
R: 152
G: 152
B: 156
R: 93
G: 92
B: 97
R: 225
G: 160
B: 15
R: 48
G: 144
B: 197
R: 160
G: 1
B: 46
R: 92
G: 146
B: 51
R: 176
G: 194
B: 6
R: 96
G: 187
B: 163
R: 200
G: 98
B: 27
R: 0
G: 127
B: 114
Appendix 2b
Investment themes
22
External Debt
(US$11.4bn)
Local Currency
(US$12.4bn)
Corporate Debt
(US$5.2bn)
Equities
(US$2.9bn)
Alternatives
(US$1.5bn)
Overlay/
Liquidity
(US$3.6bn)
Global Emerging
Markets
Sub-themes
• Broad
• Sovereign
• Sovereign,
investment grade
• Short duration
• Bonds
• Bonds (Broad)
• FX
• FX+
• Investment grade
• Broad
• High yield
• Investment grade
• Local currency
• Private Debt
• Short duration
• Global EM Value
• Global Small Cap
• Global Frontier
• Global Equity
Opportunities
• Active equity
• Private Equity
• Healthcare
• Infrastructure
• Special Situations
• Distressed Debt
• Real Estate
• Overlay
• Hedging
• Cash Management
Blended Debt
(US$14.1bn)
• Blended debt • Investment grade • Absolute return
Regional / Country
focused
Sub-themes
• China
• Indonesia
• Turkey
• Latin America
• Asia
• Africa
• China
• India
• Indonesia
• Latin America
• Middle East
• Saudi Arabia
• Turkey
• Andean
• Asia
• India
Multi-asset
(US$1.1bn)
• Global

R: 0
G: 41
B: 91
R: 0
G: 174
B: 226
R: 152
G: 152
B: 156
R: 93
G: 92
B: 97
R: 225
G: 160
B: 15
R: 48
G: 144
B: 197
R: 160
G: 1
B: 46
R: 92
G: 146
B: 51
R: 176
G: 194
B: 6
R: 96
G: 187
B: 163
R: 200
G: 98
B: 27
R: 0
G: 127
B: 114
Source: BAML, JP Morgan, Bloomberg
External debt Local currency
Equities Corporate debt
Appendix 2c
Historical valuations relative to Developed Markets
23
0
100
200
300
400
500
600
700
800
900
1000
2006
2007
2008
2009
2010
2011
2012
2013
2014
2015
2016
EMBI GD spread over UST, bps
0.00%
1.00%
2.00%
3.00%
4.00%
5.00%
6.00%
7.00%
0.0%
2.0%
4.0%
6.0%
8.0%
10.0%
12.0%
2003 2005 2007 2009 2011 2013 2015
Yie
ld (
%)
JPM GBI Global (lhs) JPM GBI-EM GD (lhs) Yield difference: GBI-EM vs GBI Global (rhs)
-200
0
200
400
600
800
1,000
2007 2008 2009 2010 2011 2012 2013 2014 2015 2016
EM vs US HY spread differential, bps
0.0
0.2
0.4
0.6
0.8
1.0
1.2
2003 2004 2005 2006 2007 2008 2009 2010 2011 2012 2013 2014 2015 2016
PER relative: MSCI EM / MSCI World

R: 0
G: 41
B: 91
R: 0
G: 174
B: 226
R: 152
G: 152
B: 156
R: 93
G: 92
B: 97
R: 225
G: 160
B: 15
R: 48
G: 144
B: 197
R: 160
G: 1
B: 46
R: 92
G: 146
B: 51
R: 176
G: 194
B: 6
R: 96
G: 187
B: 163
R: 200
G: 98
B: 27
R: 0
G: 127
B: 114
Appendix 2d
Quarterly net flows
24
-8.0
-6.0
-4.0
-2.0
+0.0
+2.0
+4.0
+6.0
+8.0
FY08 FY09 FY10 FY11 FY12 FY13 FY14 FY15 FY16 FY17
US
$ b
illio
n

R: 0
G: 41
B: 91
R: 0
G: 174
B: 226
R: 152
G: 152
B: 156
R: 93
G: 92
B: 97
R: 225
G: 160
B: 15
R: 48
G: 144
B: 197
R: 160
G: 1
B: 46
R: 92
G: 146
B: 51
R: 176
G: 194
B: 6
R: 96
G: 187
B: 163
R: 200
G: 98
B: 27
R: 0
G: 127
B: 114
US$bn
AuM
30 June 2016 Performance
Gross
subscriptions
Gross
redemptions Net flows
AuM
31 December 2016
External debt 11.7 0.2 1.1 (1.6) (0.5) 11.4
Local currency 13.3 (0.3) 0.6 (1.2) (0.6) 12.4
Corporate debt 5.0 0.1 0.9 (0.8) 0.1 5.2
Blended debt 13.7 0.2 1.7 (1.5) 0.2 14.1
Equities 3.1 - 0.4 (0.6) (0.2) 2.9
Alternatives 1.5 - - - - 1.5
Multi-asset 1.2 0.1 - (0.2) (0.2) 1.1
Overlay / liquidity 3.1 - 0.8 (0.3) 0.5 3.6
Total 52.6 0.3 5.5 (6.2) (0.7) 52.2
Appendix 3
AuM movements by theme and fund classification
25
US$bn 31 December 2016 30 June 2016
Ashmore sponsored funds 14.4 14.2
Segregated accounts 35.9 36.8
White label / other 1.9 1.6
Total 52.2 52.6

R: 0
G: 41
B: 91
R: 0
G: 174
B: 226
R: 152
G: 152
B: 156
R: 93
G: 92
B: 97
R: 225
G: 160
B: 15
R: 48
G: 144
B: 197
R: 160
G: 1
B: 46
R: 92
G: 146
B: 51
R: 176
G: 194
B: 6
R: 96
G: 187
B: 163
R: 200
G: 98
B: 27
R: 0
G: 127
B: 114
£m As reported Consolidated funds Group ex funds
Cash from operations 96.6 (1.4) 98.0
Taxation (26.2) - (26.2)
Interest received 5.1 4.0 1.1
Acquisitions/disposals 4.8 - 4.8
Seeding activities 25.4 1.0 24.4
Dividends paid (86.6) - (86.6)
Treasury/own shares (11.8) - (11.8)
FX and other 6.8 0.7 6.1
Increase/(decrease) in cash 14.1 4.3 9.8
Opening cash & cash equivalents 364.0 5.6 358.4
Closing cash & cash equivalents 378.1 9.9 368.2
Appendix 4
Cash flows and consolidated funds H1 2016/17
26

R: 0
G: 41
B: 91
R: 0
G: 174
B: 226
R: 152
G: 152
B: 156
R: 93
G: 92
B: 97
R: 225
G: 160
B: 15
R: 48
G: 144
B: 197
R: 160
G: 1
B: 46
R: 92
G: 146
B: 51
R: 176
G: 194
B: 6
R: 96
G: 187
B: 163
R: 200
G: 98
B: 27
R: 0
G: 127
B: 114
Closing rates 31 December 2016 30 June 2016 31 December 2015
GBP:USD 1.2340 1.3234 1.4736
Appendix 5
Foreign exchange
27
Average rates H1 2016/17 H1 2015/16
GBP:USD 1.2809 1.5291
R: 0
G: 41
B: 91
R: 0
G: 174
B: 226
R: 152
G: 152
B: 156
R: 93
G: 92
B: 97
R: 225
G: 160
B: 15
R: 48
G: 144
B: 197
R: 160
G: 1
B: 46
R: 92
G: 146
B: 51
R: 176
G: 194
B: 6
R: 96
G: 187
B: 163
R: 200
G: 98
B: 27
R: 0
G: 127
B: 114
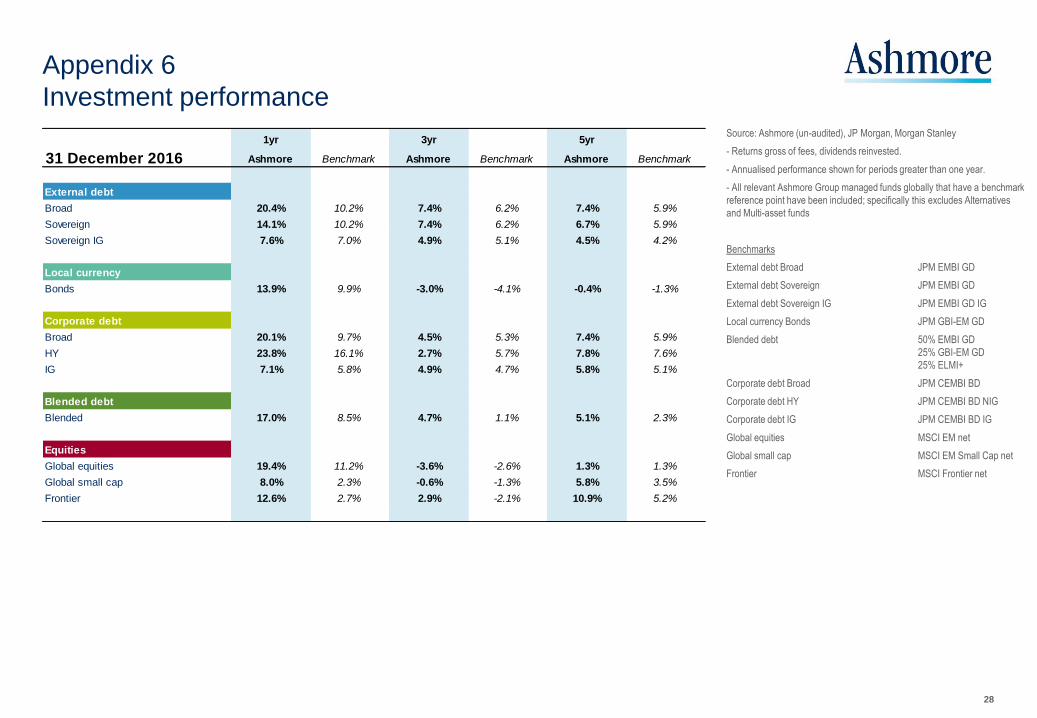
Source: Ashmore (un-audited), JP Morgan, Morgan Stanley
- Returns gross of fees, dividends reinvested.
- Annualised performance shown for periods greater than one year.
- All relevant Ashmore Group managed funds globally that have a benchmark
reference point have been included; specifically this excludes Alternatives
and Multi-asset funds
Benchmarks
External debt Broad JPM EMBI GD
External debt Sovereign JPM EMBI GD
External debt Sovereign IG JPM EMBI GD IG
Local currency Bonds JPM GBI-EM GD
Blended debt 50% EMBI GD
25% GBI-EM GD
25% ELMI+
Corporate debt Broad JPM CEMBI BD
Corporate debt HY JPM CEMBI BD NIG
Corporate debt IG JPM CEMBI BD IG
Global equities MSCI EM net
Global small cap MSCI EM Small Cap net
Frontier MSCI Frontier net
Appendix 6
Investment performance
28
1yr 3yr 5yr
31 December 2016 Ashmore Benchmark Ashmore Benchmark Ashmore Benchmark
External debt
Broad 20.4% 10.2% 7.4% 6.2% 7.4% 5.9%
Sovereign 14.1% 10.2% 7.4% 6.2% 6.7% 5.9%
Sovereign IG 7.6% 7.0% 4.9% 5.1% 4.5% 4.2%
Local currency
Bonds 13.9% 9.9% -3.0% -4.1% -0.4% -1.3%
Corporate debt
Broad 20.1% 9.7% 4.5% 5.3% 7.4% 5.9%
HY 23.8% 16.1% 2.7% 5.7% 7.8% 7.6%
IG 7.1% 5.8% 4.9% 4.7% 5.8% 5.1%
Blended debt
Blended 17.0% 8.5% 4.7% 1.1% 5.1% 2.3%
Equities
Global equities 19.4% 11.2% -3.6% -2.6% 1.3% 1.3%
Global small cap 8.0% 2.3% -0.6% -1.3% 5.8% 3.5%
Frontier 12.6% 2.7% 2.9% -2.1% 10.9% 5.2%

R: 0
G: 41
B: 91
R: 0
G: 174
B: 226
R: 152
G: 152
B: 156
R: 93
G: 92
B: 97
R: 225
G: 160
B: 15
R: 48
G: 144
B: 197
R: 160
G: 1
B: 46
R: 92
G: 146
B: 51
R: 176
G: 194
B: 6
R: 96
G: 187
B: 163
R: 200
G: 98
B: 27
R: 0
G: 127
B: 114
Disclaimer
IMPORTANT INFORMATION
This document does not constitute an offer to sell or an invitation to buy shares in Ashmore Group plc or any other invitation or inducement to engage in investment activities. Certain statements, beliefs and opinions in this document are forward-looking, which reflect the Company's current expectations and projections about future events. By their nature, forward-looking statements involve a number of risks, uncertainties and assumptions that could cause actual results or events to differ materially from those expressed or implied by the forward-looking statements.
Forward-looking statements contained in this document regarding past trends or activities should not be taken as a representation that such trends or activities will continue in the future. The value of investments, and the income from them, may go down as well as up, and is not guaranteed. Past performance cannot be relied on as a guide to future performance. Exchange rate changes may cause the value of overseas investments or investments denominated in different currencies to rise and fall. The Company does not undertake any obligation to update or revise any forward-looking statements, whether as a result of new information, future events or otherwise. You should not place undue reliance on any forward-looking statements, which speak only as of the date of this document.
29
Recommended