January 2017
Asian fixed income guide
For professional clients only
2
Contents
Introduction 3
Developments in Asian fixed income 4
Asian fixed income at a glance 5
Asian USD credit 6
Asian local currency 7
Markets in focus 8
HSBC Global Asset Management in Asian fixed income 12
Important information 13
HSBC Global Asset Management’s Asian Fixed Income Capability
– USD72 billion in Asian fixed income assets, managed by award-winning investment teams based in Asia
– Awarded Best of the Best Award by Asia Asset Management in 2008-2010, 2012, 2013 and 2015
– Long track record in Asian fixed income dating back to 1996
– Embedded into the strong compliance and governance framework of HSBC Group

3
Introduction
Asia continues to be the world’s fastest growing region despite signs of moderation. It is forecast to
grow at around 6% in 2016, while growth in the rest of the world will barely touch 2%
The sovereign ratings of Asian countries have been stable and in some cases upgraded on the back of
improving economic fundamentals
Any adverse impact from slowing growth is likely to be alleviated by more accommodative monetary
policies in the region
While accounting for over half of the world’s population, Asia is considerably underrepresented in both
developed and emerging bond indices, and accounts for less than 4% and 21% of Barclays Global
Aggregate Index and JP Morgan Emerging Market Bond Index respectively
Investor interest for Asian bonds has increased significantly, given their diversification benefits and
relatively low correlation with other asset classes. While new issuance in Asia is expected to increase
slightly, the demand continues to grow strong due to uncertainties surrounding the outlook of different
markets. This should continue to provide support to the performance of Asian bonds
-3
-2
-1
0
1
2
3
4
5
6
7
Asia ex-Japan North America Latin America EuropeanUnion
2014 2015e 2016e 2017e
Notes:
1. Source: IMF, Bloomberg, as of October 2016
2. Source: Bloomberg, as of November 2016
Any forecast, projection or target contained in this presentation is for information purposes only and is not guaranteed in any way. HSBC accepts no liability
for failure to meet such forecasts, projections or targets. For illustrative purposes only
Asia is underrepresented in Global Bond Indices1
Asian economic growth higher than other
major regions1
Higher yield in Asia compared to US and
Europe2
Rest of the World Asia
Asia accounts for
about 60% of the
world’s population
Asia accounts for
about 36% of the
world’s GDP
Asia accounts for less
than 4% of Barclays
Global Aggregate1
0
1
2
3
4
5
6
Nov-12 Nov-13 Nov-14 Nov-15 Nov-16
Euro IG Corp US IG Corp Asian IG Corp
(%)(%)
4
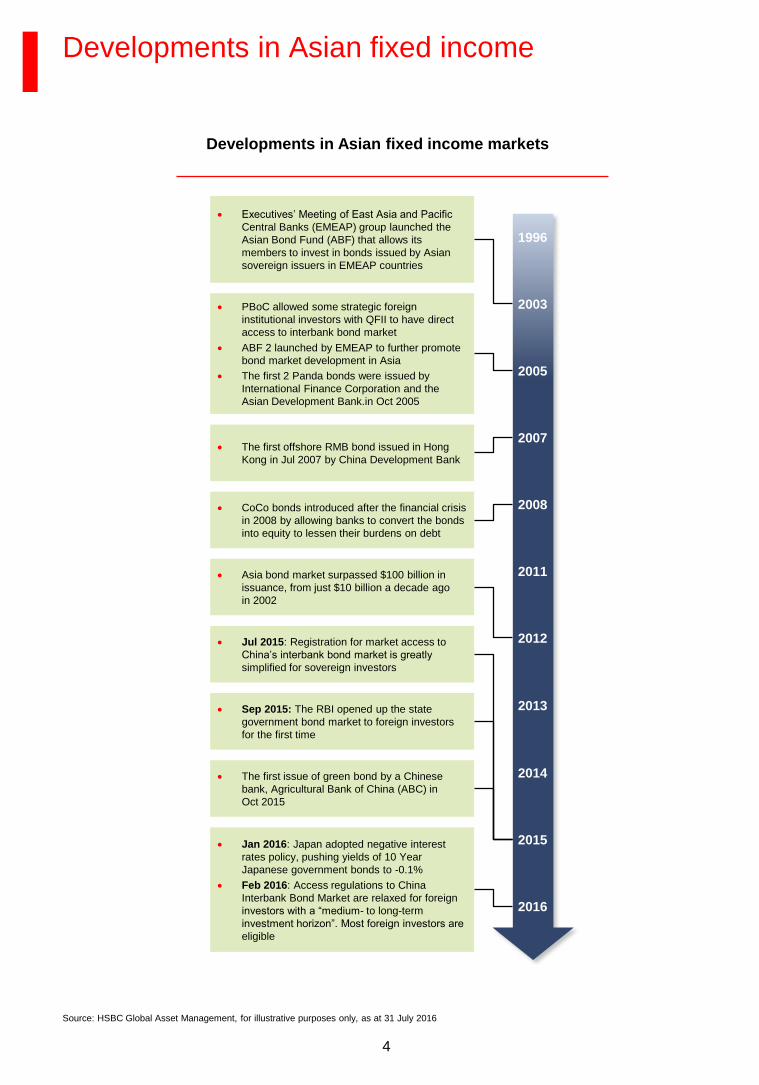
Developments in Asian fixed income
Source: HSBC Global Asset Management, for illustrative purposes only, as at 31 July 2016
Developments in Asian fixed income markets
Executives’ Meeting of East Asia and Pacific
Central Banks (EMEAP) group launched the
Asian Bond Fund (ABF) that allows its
members to invest in bonds issued by Asian
sovereign issuers in EMEAP countries
PBoC allowed some strategic foreign
institutional investors with QFII to have direct
access to interbank bond market
ABF 2 launched by EMEAP to further promote
bond market development in Asia
The first 2 Panda bonds were issued by
International Finance Corporation and the
Asian Development Bank.in Oct 2005
CoCo bonds introduced after the financial crisis
in 2008 by allowing banks to convert the bonds
into equity to lessen their burdens on debt
The first offshore RMB bond issued in Hong
Kong in Jul 2007 by China Development Bank
Asia bond market surpassed $100 billion in
issuance, from just $10 billion a decade ago
in 2002
Jul 2015: Registration for market access to
China’s interbank bond market is greatly
simplified for sovereign investors
Sep 2015: The RBI opened up the state
government bond market to foreign investors
for the first time
Jan 2016: Japan adopted negative interest
rates policy, pushing yields of 10 Year
Japanese government bonds to -0.1%
Feb 2016: Access regulations to China
Interbank Bond Market are relaxed for foreign
investors with a “medium- to long-term
investment horizon”. Most foreign investors are
eligible
The first issue of green bond by a Chinese
bank, Agricultural Bank of China (ABC) in
Oct 2015
2003
2005
2007
2015
2008
2011
2012
2016
2014
1996
2013

5
Asian fixed income at a glance
Asian Fixed Income market can be split broadly into two categories:
– 1) Asian USD credit market
– 2) Local currency bond market
Asian USD credit market is approximately USD680 billion in market size and is made up of a diverse
geography of countries, and categorized by investment grade and high yield bonds. It is freely
available to global investors, with no tax implications other than those normally incurred in the
investments. The following chart shows the breakdown of the JPMorgan Asia Credit Index (JACI),
which is one of the most comprehensive and inclusive indices available
The Asian Local currency bond market is approximately USD10 trillion in market size and
approximately half of this is made up of China alone, a market which has been difficult for foreigners
to access
(USDbn) (%)
Asian local currency bond markets2
Asian USD credit markets1
(USDbn) (%)
Notes:
1. Source: JPMorgan Asia Credit Index, as of 31 October 2016
2. Source: AsiaBondsOnline; market sizes as of 30 September 2016 (India market size as of June 2016, taken from CCIL, RBI, SEBI); Yield numbers as of
10 November 2016
Data shown is for illustrative purposes only and does not constitute any investment recommendation to buy or sell in the above-mentioned countries and
asset classes
0.0%
1.0%
2.0%
3.0%
4.0%
5.0%
6.0%
7.0%
8.0%
9.0%
0
50
100
150
200
250
300
350
China Korea Indonesia Hong Kong India Philippines Singapore Malaysia Thailand
Size of Asian USD credit market (LHS) Yield (RHS)
0.0%
1.0%
2.0%
3.0%
4.0%
5.0%
6.0%
7.0%
8.0%
9.0%
0
1,000
2,000
3,000
4,000
5,000
6,000
7,000
8,000
China Korea India Thailand Malaysia Singapore Indonesia Hong Kong Philippines
Size of Asian local currency bond market (LHS) 10-year Government Yields (RHS)

6
Asian USD credit
Reasons for considering Asian credit
Healthy macro conditions. Solid external balances should help keep Asian currencies more stable and
improve Asian institutions’ ability to pay debts denominated in foreign currencies
Solid credit profile on the corporate level. Default rate for Asian hard currency bonds is expected to
moderate to 1.8% in 2016, and Asia is the only region that received a cut in the latest default forecast
Good diversification for global credit portfolios. Asian fixed income has registered low volatility, and
low correlation with other asset classes, including US Treasuries
Competitive yields relative to developed markets. Despite stronger credit fundamentals in the region,
Asian credits are still trading at a yield premium over comparable US and Euro credits. This should
offer better value for Asian bond investors
Strong market demand with limited increase in supply. Estimated net financing to remain relatively low
with gross supply expected to pick up slightly in 2016, however, the strong demand for Asian bonds
should outweigh the increase in supply
Notes:
1. Source: JP Morgan as of 31 August 2016
2. Source: JP Morgan as of 23 November 2016
Any forecast, projection or target contained in this presentation is for information purposes only and is not guaranteed in any way. HSBC accepts no liability
for any failure to meet such forecasts, projections or targets. For illustrative purpose only
Asian default rate expected to stay below most other regions in 20172
2012 2013 2014 2015 2016 YTD 2017f
Asia 2.7% 1.2% 1.5% 3.1% 1.0% 2.0%
EM Europe 5.2% 2.3% 4.0% 2.5% 3.0% 1.1%
Latin America 3.6% 10.6% 6.5% 5.7% 9.2% 2.6%
MENA 0.2% 0.0% 4.6% 4.0% 4.6% 3.4%
EM (total) 3.5% 4.3% 3.8% 3.8% 4.9% 2.1%
US 1.2% 0.7% 3.0% 2.6% 3.6% 2.5%
(USDbn)
13
5268
57
116 119
180
148163
-6 -9 -12 -16 -19 -24 -31 -34 -37-13 -20 -17 -26 -24 -16-39 -44 -54
-6
2439
16
74 79
110
71 73
-80
-30
20
70
120
170
220
2008 2009 2010 2011 2012 2013 2014 2015 2016e
Gross supply Coupon Maturity Net financing
Estimated net financing remains low1

7
Asian local currency
Reasons for considering Asian currency bonds
Strong Current account positions. Current account positions are strong for most Asian countries as
backed up by healthy FX reserves, which suggest potential for appreciation
Debt ratios are much lower. Government gross debt as a percentage of GDP for G7 countries are
expected to stay at above 100%, versus the 50% for the emerging market and developing economies
Underrepresentation in Emerging market indices. Despite accounting for 65% of EM’s GDP, Asia’s
weight in emerging markets indices is substantially below that figure
Increased likelihood of further rating upgrades. Some parts of the region are widely regarded as
“developed” with investment grade rating. As macro economic fundamentals improve in the region,
further rating upgrades are likely
Source: 1. Bloomberg, 30 September 2016
Countries S&P’s credit rating
Singapore AAA
Hong Kong SAR AAA
China AA-
Korea AA-
Malaysia A-
Thailand BBB+
Philippines BBB
India BBB-
International reserve assets1
0
500
1,000
1,500
2,000
2,500
3,000
3,500
Chin
a
Jap
an
Sw
itzerlan
d
Sa
udi A
rabia
Ta
iwan
Hong K
on
g
So
uth
Kore
a
Bra
zil
India
Russia
Eu
rozone
Sin
ga
pore
Me
xic
o
Th
aila
nd
Alg
eria
United K
ingdom
Indonesia
Tu
rkey
Mala
ysia
Isra
el
Po
lan
d
U.A
.E.
Cze
ch R
epublic
Ph
ilippin
es
Lib
ya
Canada
Norw
ay
Pe
ru
Denm
ark
Sw
eden
US
So
uth
Afr
ica
Germ
any
Asia ex Japan Others
(USDbn)
Key Asian markets with investment grade sovereign rating1

8
Local rating
International rating
(S&P)
AAA
AA+
AA
AA-
A+
A
A-
BBB+
BBB
BBB-
BB+
BB
BB-
B+
B
B-
CCC
Markets in focus – China
Onshore Offshore
Where are the bonds traded? Mainland China Outside mainland China
Market size USD6,150 billion USD107 billion
Accessibility
Accessible on a restricted basis to certain
investor types– Onshore institutional investors
– Offshore institutions with QFII/RQFII licenses
– Foreign investors with a medium- to long-term
investment horizon, eligible for access to CIBM1
Can be accessed by all
offshore investors– Retail and institutional
investors
– No quota restriction
Rating agencies
Local rating agencies, eg Chengxin,
Dagong,
Pengyuan, etc
International rating
agencies, eg Moody’s,
Fitch, S&P
Market Composition
Sovereigns: 21%
Policy banks: 29%
Others2: 50%
Sovereigns: 26%
Non-Sovereigns: 74%
AAA
AA+
AA
AA-
A+ and
below
Sovereign rating
Notes:
1. CIBM refers to China’s Interbank Bond Market. Most real money
investors are eligible, including commercial banks, insurance companies,
securities houses, fund/asset management companies, as well as
pension funds, charity funds and endowment funds, so long as they
have a medium- or long-term investment horizon
2. Others include local government bonds, corporates, enterprise bonds etc
3. Source: ChinaBond, as of 31 August 2016
4. Source: HSBC Global Asset Management, September 2016. The table
is provided for discussion purposes only. There is no official mapping to
convert local rating into international rating
5. The rating criteria and methodology used by Chinese local rating
agencies may differ from those adopted by established international
credit rating agencies. Therefore, the Chinese local credit rating system
may not provide an equivalent standard for comparison with securities
rated by international credit rating agencies
Any forecast, projection or target contained in this presentation is for
information purposes only and is not guaranteed in any way. HSBC Global
Asset Management accepts no liability for any failure to meet such
forecasts, projections or targets
For illustrative purposes only
Mapping local credit ratings to
international equivalents4,5
Onshore and offshore RMB bonds
RMB bonds can be differentiated by onshore and offshore. The two markets currently have materially
different accessibility requirements and characteristics
Onshore RMB bond market used to be largely closed to foreign investors, except those with certain licenses
and quotas. With new regulations announced in February 2016, most foreign investors with a medium or
long-term investment horizon can invest in the market, with a relatively simple application process
With the continued opening up of the onshore bond market, we expect the onshore and offshore bond
markets to eventually evolve into one
Local credit ratings vs international credit ratings5
China’s offshore RMB bonds are rated by international agencies. China onshore bonds are rated by local rating
agencies, which have difference methodologies, scales and standards
Over 98% of the onshore market is rated AA or above by local credit agencies, less than 2% is rated AA- or
below. As a result, there is currently limited ratings and pricing differentiation in the onshore RMB credit market.
The emergence of credit events (from zero defaults historically) will likely drive improved pricing differentiation
going forward. Credit selection and research capabilities is key to investing in this market
AAA (63.0%)
AA+ (18.9%)
AA (17.1%)
AA- (0.7%)
A+ (0.1%)
A & Below (0.1%)
Credit quality breakdown (onshore)3

9
Markets in focus – China (cont’d)
Source: JP Morgan, Barclays, Citi; June 2015
Any forecast, projection or target contained in this document is for illustrative purpose only and is not guaranteed in any way. HSBC accepts no liability for
any failure to meet such forecasts, projections or targets
Reasons for considering RMB bonds
Higher yields compared with international markets of similar size or the same credit rating (AA- or Aa3)
Low historical volatility and correlation compared with other asset classes
Potential inclusion in global bond indices could lead to increased future investor demand
Potential inclusion in global bond indices
There is substantial speculation as to if and when China may be included in global bond indices. The Chinese
bond market is already tracked by the key index providers. JP Morgan, Citigroup and Barclays have been
maintaining their own Chinese bond indices for some years
We had an attempt in forecasting China’s weight in global/emerging market bond indices should full inclusion take
place. We have used a ‘base case’ assumption of China’s full inclusion within 5 years’ time. Our forecast was
based on the current market value of the Chinese bond index and the market value of the indices maintained by
the same index provider. We then worked out China’s current weight in the indices should China be included. We
assumed the allocation to the Chinese bond market and other markets would grow in line with their GDP over the
next 5 years. In this scenario, China could make up a significant part of the emerging market bond indices after 5
years. (52% of Citigroup Emerging Market Government Bond Index, 38% of Barclays Emerging Market Local
Currency Government Index and 33% of JP Morgan GBI-EM Global Index). The impact from China’s inclusion in
the global bond indices would be less significant but the market would still be a meaningful addition to the global
indices. The initial weights of China in emerging market indices are unlikely to be the levels outlined above. Some
indices will limit the weight of China to 10% under their index diversification rules. We expect China’s inclusion to
be gradual, starting from a low level and grow in line with the gradual path of market opening, reflecting the actual
investability over time
Following the recent announcement on enhanced market access, JPMorgan has placed China under review for
potential GBI-EM Global Diversified inclusion (15 March 2016). It is believed that USD180bn AUM is tracking this
index, and so as China’s weight grows to its maximum 10% (maximum incremental increase 1% per month), this
would imply extra demand of USD18bn for onshore RMB bonds (about 0.35% of overall market size)
China’s weight in global indices if
included in global indices
China’s weight in global indices if
included in GEM indices
0.0%
29.3%
32.6%
35.3%38.0%
49.3%52.2%
0%
10%
20%
30%
40%
50%
60%
Current Current if China isincluded
(hypothetical)
Year 2020 if Chinais included(forecast)
JPM GBI-EM Global
Barclays EM Local Ccy Govt
Citi EMGBI
0.0%
1.8%
2.3%
2.2%
2.8%
4.5%
5.7%
0%
1%
2%
3%
4%
5%
6%
Current Current if China isincluded
(hypothetical)
Year 2020 if Chinais included(forecast)
JPM GBI Global
BGA
Citi WGBI
China’s weight in index China’s weight in index

10
Markets in focus – India
Indian bond market
The Indian bond market has grown rapidly in the past few years. It is a large, well diversified and liquid
market that is dominated by government issuance.
The market can be broadly classified in three segments:
– Government Securities comprising the Central and State Government securities and treasury bills
– Public Sector Undertaking (PSU) bonds, generally treated as surrogates of sovereign paper, often due to the comfort of
Government ownership of the PSUs
– Corporate securities comprising debentures/corporate bonds and commercial papers
Reasons for considering India bonds
Attractive yields - Indian government bond yields are attractive relative to emerging market peers, but
especially so against developed markets
Supportive macro environment – A number of effective measures have been put in place by RBI and
the government to help control inflation, and keep liquidity at neutral level. Current account deficit has
narrowed significantly thanks to the increased foreign direct investments
Greater accessibility – Recent reforms on the development of the onshore fixed income and currency
markets have facilitated market access to foreign investors. The reduction on withholding tax on
interest income of the Masala bonds also boosted investor demand. All of these measures have
helped widen the investor base and increase inflows from foreign investments
Onshore Offshore
Where are the bonds traded? India Outside India
Currency INR USD/INR
Market size USD1307 billion1 USD53 billion2
Accessibility
Not freely accessible to foreign
investors, but can be accessed
through FPI (Foreign Portfolio
Investor) license
– There are limitations to active
management once the license is
obtained
– There is tax to pay on coupons and
capital gains
Can be accessed by all offshore
investors
– A number of USD bonds linked to
Indian companies or institutions
– There can be hedged into Rupee
with non-deliverable forwards (NDF)
– Limited supply of offshore INR bonds
/ Masala bonds
Notes:
1. HSBC Global Asset Management, as of June 2016
2. JPMorgan Asia Credit Index, as of 30 September 2016
3. Selected 10 year bond yields. Bloomberg, data as of 3 November 2016
Any forecast, projection or target contained in this presentation is for information purposes only and is not guaranteed in any way. HSBC Global Asset
Management accepts no liability for any failure to meet such forecasts, projections or targets. For illustrative purposes only
Relative Attractive Yields3
6.82
0
2
4
6
8
10
So
uth
Afr
ica
Indonesia
India
Me
xic
o
Ph
ilippin
es
Mala
ysia
Hungary
Chin
a
Th
aila
nd
US
Sp
ain UK
Germ
any
Yield (%)

11
Markets in focus – Indonesia
Onshore Offshore
Where are the bonds traded? Indonesia Outside Indonesia
Currency IDR USD/IDR
Market Size USD 165 billion1 USD 65 billion2
Average govt duration 6.343 8.022
Notes:
1. ABD, as of 30 September 2016
2. JP Morgan Asia credit index as of 31 October 2016
3. Markit iBoxx ALBI Indonesia, as of 31 October 2016
4. Bank of Indonesia, as of August 2016.
Any forecast, projection or target contained in this presentation is for information purposes only and is not guaranteed in any way. HSBC Global Asset
Management accepts no liability for any failure to meet such forecasts, projections or targets. For illustrative purposes only
Indonesian bond market
The Indonesian bond market has steadily expanded with improving liquidity in the past few years and is
dominated by government issues
There are no restrictions on foreign investments in this market
Even though Indonesia is the region’s fifth largest economy, the size of its government bond market
ranks tenth in the region. There is significant room for more state project financing to take place via the
government bond market
Reasons for considering Indonesian bonds
Positive market technicals – The market offers competitive yields, which attract steady capital inflows
from foreign investors in the long term. Moreover, recent domestic regulatory changes have led to
increasing demand from local pension funds and insurance companies
Attractive yields - Indonesian bond yields are attractive relative to emerging market peers as well as
developed markets. At the time of writing, the yield of the 10 year government bonds is over 7.5%
Constructive macro environment – Indonesia sovereign rating is steadily improving on the back of
relatively low leverage, current account improvement, and benign inflation. Meanwhile, the
improvement in macro fundamental provides better stability for the currency
Improving policy environment – Recent reform progress should benefit Indonesian economy and bond
market in the medium to long term. The government has unveiled numerous ‘stimulus’ packages since
September 2015 aiming to reinvigorate growth dynamics. Current account deficit has narrowed
significantly in recent years due to a large fall in imports than exports
(USDbn)
3.7
1.2
(4.7)
(7.6)
(1.9)
-15
-10
-5
0
5
10
15
Q1 Q2 Q3 Q4 Q1 Q2 Q3 Q4 Q1 Q2 Q3 Q4 Q1 Q2 Q3 Q4 Q1 Q2 Q3 Q4 Q1 Q2
2011 2012 2013 2014 2015 2016
Goods Services Income Secondary Inc. Current Acc.
2011:
CA surplus
USD1.7bn
2012:
CA deficit
USD24.4bn
2013:
CA deficit
USD29.1bn
2014:
CA deficit
USD27.5bn
2015:
CA deficit
USD17.8bn
2016:
CA deficit
USD4.7bn
Import compression narrows CAD4

12
AMG’s Asian fixed income capabilityLong track record in Asian fixed income
Recognised leadership in Asian fixed income
USD72 billion in Asian fixed income assets under
management
Award winning investment team in Asia
Well resourced, experienced and integrated investment team
Long track record in Asian fixed income dating back to 1996
22 managers, 11 analysts
Investment process built on solid proprietary research
Best use of global resources with local insight
Collective thinking on global investment risks and themes
Local decision-making to ensure empowerment and flexibility
~40 credit analysts
~10 macro-economists
USD189.7bn fixed income
asset under management*
~170 investment
professionals
Source: HSBC Global Asset Management, as of 30 September 2016
Firm-wide Statistics
(Fixed Income)

13
Important information
For Professional Clients only and should not be distributed to or relied upon by Retail Clients.
The contents of this document may not be reproduced or further distributed to any person or entity, whether in
whole or in part, for any purpose. All non-authorised reproduction or use of this document will be the
responsibility of the user and may lead to legal proceedings. The material contained in this document is for
general information purposes only and does not constitute advice or a recommendation to buy or sell
investments. Some of the statements contained in this document may be considered forward looking
statements which provide current expectations or forecasts of future events. Such forward looking statements
are not guarantees of future performance or events and involve risks and uncertainties. Actual results may
differ materially from those described in such forward-looking statements as a result of various factors. We do
not undertake any obligation to update the forward-looking statements contained herein, or to update the
reasons why actual results could differ from those projected in the forward-looking statements. This document
has no contractual value and is not by any means intended as a solicitation, nor a recommendation for the
purchase or sale of any financial instrument in any jurisdiction in which such an offer is not lawful. The views
and opinions expressed herein are subject to change at any time. These views may not necessarily indicate
current portfolios' composition. Individual portfolios managed by HSBC Global Asset Management primarily
reflect individual clients' objectives, risk preferences, time horizon, and market liquidity.
The value of investments and the income from them can go down as well as up and investors may not get
back the amount originally invested. Past performance contained in this document is not a reliable indicator of
future performance whilst any forecasts, projections and simulations contained herein should not be relied
upon as an indication of future results. Where overseas investments are held the rate of currency exchange
may cause the value of such investments to go down as well as up.
We accept no responsibility for the accuracy and/or completeness of any third party information obtained from
sources we believe to be reliable but which have not been independently verified.
HSBC Global Asset Management (UK) Limited provides information to Institutions, Professional Advisers and
their clients on the investment products and services of the HSBC Group.
This presentation has been produced by HSBC Global Asset Management (Hong Kong) Limited and has been
approved for issue in the United Kingdom by HSBC Global Asset Management (UK) Limited. Authorised and
regulated by the Financial Conduct Authority. www.assetmanagement.hsbc.com/uk
Copyright © HSBC Global Asset Management (UK) Limited 2017. All rights reserved.
17-I-00242/0117ex160717/FP17-0035
Recommended


![Fixed Income Index Guide - BlackRock · [10] FIXED INCOME INDEX GUIDE Bloomberg Barclays index family ... Broad family of fixed income indices, including: aggregate, government, corporate,](https://img.pdfslide.net/doc/110x75/5b0274907f8b9af1148fb575/fixed-income-index-guide-blackrock-10-fixed-income-index-guide-bloomberg-barclays.jpg)