Asian Polyester Markets and the
Impact of Feedstocks
Jeffrey Ong & Samuel Wong
ICIS Markets Editors
5 August 2014, Mumbai

www.icis.com
0
500
1000
1500
2000
2500
3000
3500
4000
2009 2010 2011 2012 2013
tho
usa
nd
to
nn
es
China's Polyester Export Volumes
Polyester filament yarn Polyester short staple PET bottle chips
1455
1846
2411
2696
3474
China’s polyester export volumes
continue rising Year on Year
In 2013, China’s polyester export volumes grew by about
30% compared with 2012.
Source: Industry

www.icis.com
Slowdown in China’s export volumes
in Mar-May 2014
Dip in export volumes in February 2014; very little growth in
export volumes from Mar-May 2014.
0
50
100
150
200
250
300
350
400
450
Jan Feb Mar Apr May
tho
usa
nd
to
nn
es
China's Polyester Export Volumes (Jan-May 2013 vs 2014)
2013 2014
Source: Industry

www.icis.com
Exports of China’s POY 150 Denier
mainly headed for Egypt and Turkey
From Jan 2013 to May 2014, Egypt and Turkey imported
186,000 tonnes of POY; over 80% of total exports from China.
Source: ICIS China
www.icis.com
Exports of China’s PSF 1.4 Denier
mainly headed for USA and Pakistan
From Jan 2013 to May 2014, USA and Pakistan imported
359,000 tonnes of PSF; over 65% of total exports from China.
Source: ICIS China

www.icis.com
China Polyester Production in 2011-Apr 2014
2011 2012 2013 Jan-Apr
2014
Output (m tonnes)
26.6 30.2 32.5 11
Change (yoy)
(+13.6%) (+13.5%) (+7.62%) (+9%)
Av. Op Rate 87% 87% 81% 76%
Source: Industry

www.icis.com
Prices of MEG/PTA and polyester demand drive
China’s polyester export prices
Recovery of polyester demand slower than expected; more
restocking in late March/early April; higher offers from June
on feedstock price rise; dip in early July
Source: ICIS

www.icis.com
Feedstock: Monoethylene Glycol
Asia Monoethylene Glycol (MEG)
Market Brief / Key Price Drivers
www.icis.com
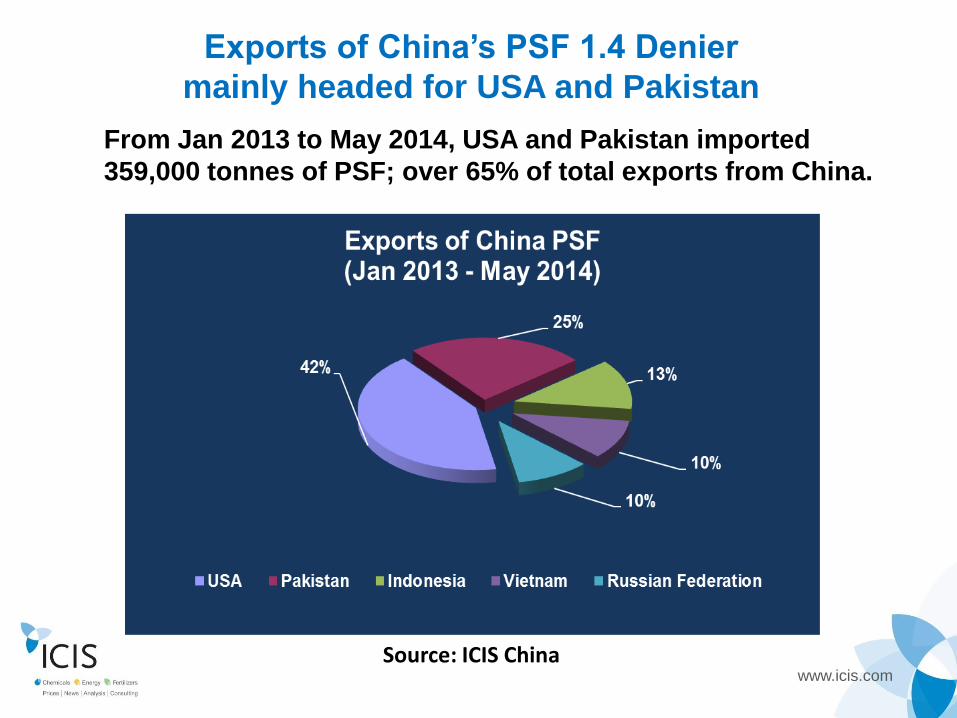
MEG producers face squeezed margins
• Weaker demand in 2014 affected MEG profitability.
• Average spread at $245/tonne in 2013; fell to $42/tonne in Jan-Jun 2014, breakeven level at $100-150/tonne.
-50
50
150
250
350
450 Spread between MEG Price and Feedstock Cost
Spread: MEG spot CFR China prices - Ethylene spot CFR NE Asia prices *0.62
Feedstock ethylene prices rose amid tighter supply and firmer upstream prices; MEG prices fell because of weak sentiment and poor downstream demand
Source: ICIS

www.icis.com
Several production routes for MEG projects
Naphtha, Coal and gas-based MEG projects dominate the
market
Source: Industry

www.icis.com
MEG supply growth higher than demand growth
• Demand growth expected at 6-7% in the coming years
• Capacity growth to reach 8% per year on average in 2013-
2017
-5%
0%
5%
10%
15%
20%
2011 2012 2013 2014E 2015E 2016E 2017E
Gro
wth
rat
e, %
Asia & Middle East MEG Supply vs Demand Growth
Supply Growth Demand growth
Source: Industry

www.icis.com
China’s MEG port inventories stay high, indicating
ample supply in short term
• China’s MEG port inventories hit record high of 1.14m tonnes in
end-Feb 2014 because of import influx and weak domestic
consumption
• Inventories have declined since May, driven by improved demand
Source: ICIS

www.icis.com
Traders dominate Asia spot MEG trade; highly
speculative market
• MEG was viewed by traders as a financial product in 2012-2013 • Tighter credit supply and stringent checks in 2014 curbed
speculation • Entrance of traders not in polyester-related business in 2014
Source: ICIS

www.icis.com
How ethylene prices affect MEG prices
0
500
1000
1500
2000
Jul-03 Jul-04 Jul-05 Jul-06 Jul-07 Jul-08 Jul-09 Jul-10 Jul-11 Jul-12 Jul-13
Asia Ethylene Spot Price vs Asia MEG Spot Price in a 10-year Span
Ethylene spot prices, CFR NE Asia MEG spot prices, CFR China Main Port
In a 10-year time span, the correlation coefficient
between ethylene and MEG spot prices is 0.67
Source: ICIS

www.icis.com
How PTA futures affect MEG spot prices
The correlation coefficient between PTA futures and
spot prices rose to 0.82 in Jun 2013-Jun 2014 from 0.72
in 2011-2012
6000
6500
7000
7500
8000
8500
9000
Jun-13 Jul-13 Aug-13 Sep-13 Oct-13 Nov-13 Dec-13 Jan-14 Feb-14 Mar-14 Apr-14 May-14 Jun-14
Pri
ces,
yu
an (
CN
Y)/
ton
ne
PTA Futures vs MEG Domestic Spot Prices
PTA Futures - the most actively traded contract month MEG spot prices in east China, ex-warehouse
Source: ICIS / Zhengzhou Commodity Exchange

www.icis.com
How downstream demand affects MEG prices
Strong polyester sales drive up prices; weak polyester
demand dampens prices; the correlation coefficient is 0.56
0%
100%
200%
300%
500
750
1000
1250
$/tonne Polyester Sales-to-output Ratios vs MEG Spot Prices
MEG Spot Prices, CFR China Main Port Sales-to-output ratios of yarn producers
Trendline of sales-to-output ratio
Source: ICIS
www.icis.com
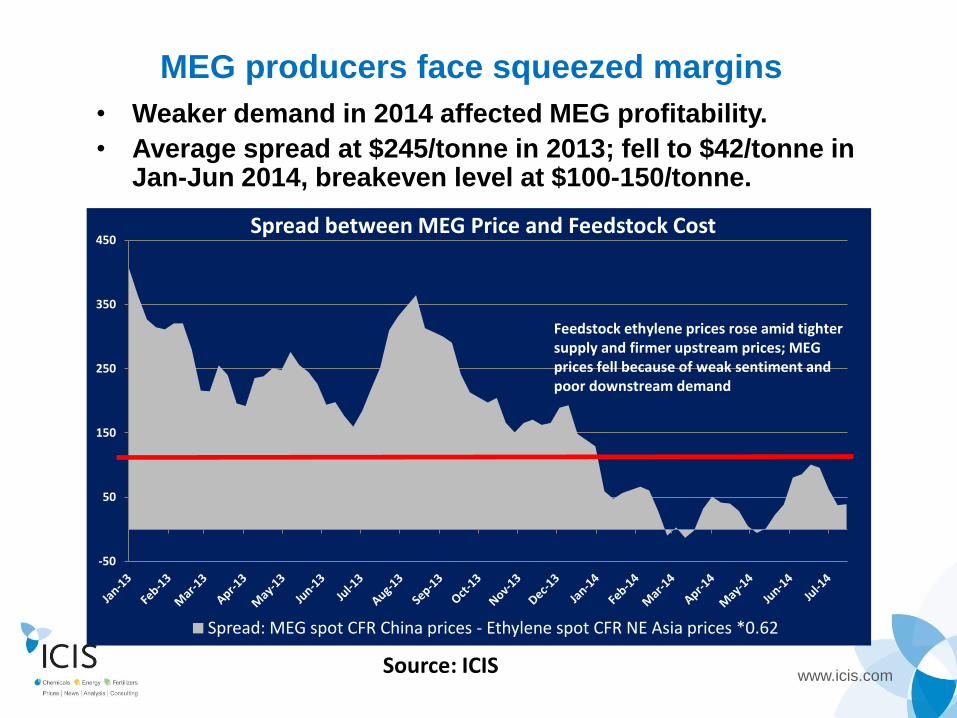
Port inventories as a indicator of supply,
demand balance
Higher inventories weigh on prices; correlation coefficient
at 0.53
800
900
1000
1100
1200
400
600
800
1000
1200
Ap
r-1
2
May
-12
Jun
-12
Jul-
12
Au
g-1
2
Sep
-12
Oct
-12
No
v-1
2
De
c-1
2
Jan
-13
Feb
-13
Mar
-13
Ap
r-1
3
May
-13
Jun
-13
Jul-
13
Au
g-1
3
Sep
-13
Oct
-13
No
v-1
3
De
c-1
3
Jan
-14
Feb
-14
Mar
-14
Ap
r-1
4
May
-14
Prices, $/tonne thousand tonnes China port inventories vs MEG spot prices
China port inventories, thousand tonnes MEG spot prices, CFR China Main Port
Source: ICIS

www.icis.com
Asia Monoethylene Glycol (MEG)
Market Outlook

www.icis.com
Speculation adds uncertainty to MEG spot market
• MEG seen as financial commodity by traders, because of its
balanced-to-tight market fundamentals and price volatility
• As a financial commodity, MEG’s price trend is affected by
• Macroeconomic factors; perfect for speculation
• Crude futures
• China’s monetary policy; credit renewals
• MEG forward-trading prices, PTA futures’ prices
• MEG supply issues, plant outages
• Polyester demand
Traders dominate Asia’s spot MEG market

www.icis.com
China’s port inventories – seen as a good indicator of
supply-and-demand balance
• Supply likely to decrease in H2 2014, because:
• More plant shutdown plans in H2 2014
• One new MEG plant start-up in Korea
• Demand likely to increase in H2 2014, because:
• Peak textile manufacturing season in China in Sep-Oct
• PET capacity expansion in India, PET peak season in US
Asia to see balanced-to-tight supply-demand
balance in near future
www.icis.com
Asia MEG capacity expansion to accelerate
• More coal-based MEG production but quality of MEG from the
process still not satisfactory for polyester production
• MEG capacity expansion to speed up in 2016-2017
• Asian markets might be outlets for shale-gas MEG
Asian MEG supply/demand balance expected to turn balanced-to-long

www.icis.com
Polyester capacity in 2014
Plant name Cap ’13
(kt) New cap ’14
(kt) Start date
for new cap Type
Hainan Yi Sheng Petrochemicals
500 500 Feb Bottle chip
Zhejiang Guxiandao Industrial Fiber Co.
500 500 Mid Mar Industrial
filament yarn
Xin Feng Ming Group Co.
1350 250 Apr (est) Filament yarn
Tong Kun Group Co. 2200 400 Mid Apr Filament yarn
Jiangsu Sanfangxiang 2800 200 Mid May Filament yarn
Shangli Chemical Fiber Co.
0 200 Q4 2014 Short staple
Zhejiang Hua Xin Chemical Fiber Co
25 40 Aug Filament yarn
New capacity will reach 5.57m tonnes
Source: ICIS China

www.icis.com
Feedstock: Purified Terephthalic Acid
Asia Purified Terephthalic Acid (PTA)
Market Brief / Key Price Drivers

www.icis.com
When One Suffers, a Chain Effect Begins
Crude oil Heavy naphtha Crude gasoline Mixed xylenes Para-xylene
Long-chained producers Medium-chained producers
Short-chained producers
Para-xylene *.665 PTA *.86 Polyester *.34 MEG
Key End Use Markets – Consumer Goods
Food & Beverage Personal Care & Home Care
Apparel, Home Textile Apparel, Home Textile Electronics

www.icis.com
PX capacity expansion to accelerate in Asia
Source: Industry
www.icis.com
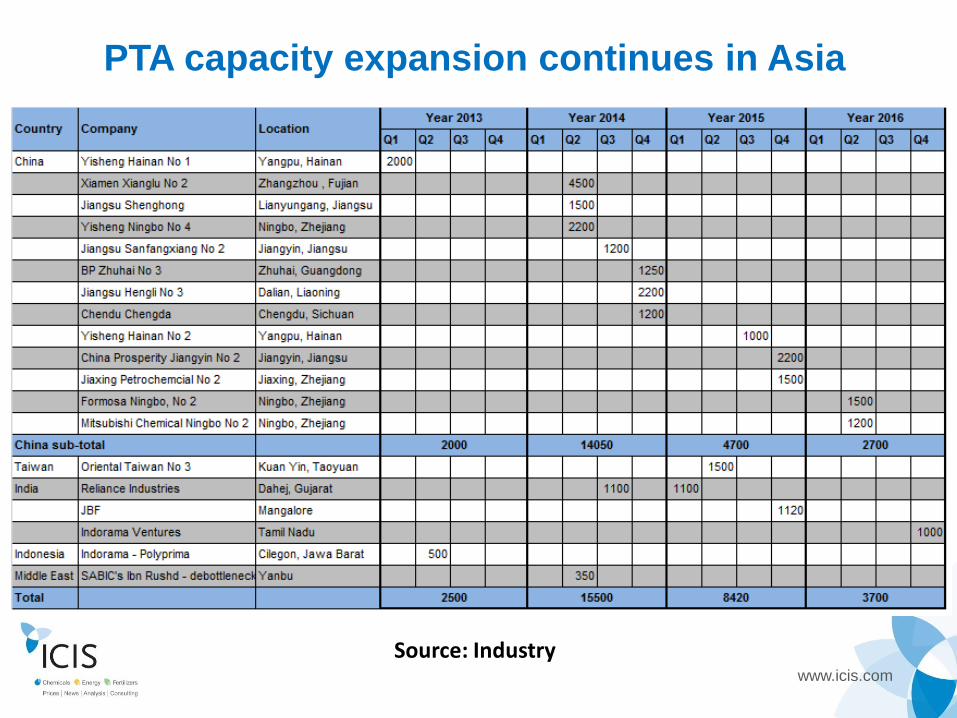
PTA capacity expansion continues in Asia
Source: Industry

www.icis.com
Asia PX capacity growth peaks in 2013-2015
Data source: Industry sources
• Asia’s PX demand growth expected to remain at 5-6% annually.
• Capacity growth forecast at 14-17% annually in 2013-2015, to decline to
5% in 2016. Supply growth acceleration to keep up with downstream
capacities.
9%
2%
17% 15%
14%
5%
8% 5%
6% 5% 5% 6%
0%
2%
4%
6%
8%
10%
12%
14%
16%
18%
20%
2011 2012 2013E 2014E 2015E 2016E
Gro
wth
rate
, %
Asia PX Supply vs Demand Growth
Supply growth rate Demand growth rate

www.icis.com
Asia PTA market to remain oversupplied
Demand expected to grow 6-7%/year; capacity
growth to accelerate again in 2014
Source: Industry
3%
12%
25%
12%
20%
12%
5%
14.5%
7.3% 6.2% 6.5% 7.1% 6.7% 6.8%
0%
5%
10%
15%
20%
25%
30%
2010 2011 2012 2013 2014E 2015E 2016E
Gro
wth
rate
, %
Asia PTA Supply vs Demand Growth
Supply growth rate Demand growth rate

www.icis.com
Asian PTA Producers Under Constant Pressure
-100
-50
0
50
100
150
200
250
300
0
200
400
600
800
1000
1200
1400
1600
1800
2000
Jan
-07
Ap
r-0
7
Jul-
07
Oct
-07
Jan
-08
Ap
r-0
8
Jul-
08
Oct
-08
Jan
-09
Ap
r-0
9
Jul-
09
Oct
-09
Jan
-10
Ap
r-1
0
Jul-
10
Oct
-10
Jan
-11
Ap
r-1
1
Jul-
11
Oct
-11
Jan
-12
Ap
r-1
2
Jul-
12
Oct
-12
Jan
-13
Ap
r-1
3
Jul-
13
Oct
-13
Jan
-14
Ap
r-1
4
Jul-
14
Mar
gin
s ($
/to
nn
e)
PX
*0.6
6+$
12
0/t
on
ne
Pri
ces
($/t
on
ne
CFR
CM
P b
asis
)
Time Period
PTA-PX Margins
Margins PTA PX

www.icis.com
PX
Marg
ins
0
200
400
600
800
Jul'13 Aug'13 Sep'13 Oct'13 Nov'13 Dec'13 Jan'14 Feb'14 Mar'14 Apr'14
$/t
on
ne
Naphtha-PX Spread
MARGINS Break Even
0
50
100
150
200
250
Jul'13 Aug'13 Sep'13 Oct'13 Nov'13 Dec'13 Jan'14 Feb'14 Mar'14 Apr'14
$/t
on
ne
MX-PX Spread
MARGINS BREAKEVEN
BREAKEVEN
BREAKEVEN
0
50
100
150
200
250
300
Jul'13 Aug'13 Sep'13 Oct'13 Nov'13 Dec'13 Jan'14 Feb'14 Mar'14 Apr'14
$/t
on
ne
TDP Margins Based on Tol/BZ/PX
TDP Margins BREAKEVEN
BREAKEVEN

www.icis.com
Weak Polyester Demand, PTA Cutbacks
CA
PAC
ITY
80%
72% 68%
55%
68% 63%
69%
0%
10%
20%
30%
40%
50%
60%
70%
80%
90%
0
500
1,000
1,500
2,000
2,500
3,000
3,500
4,000
Jan'14 Feb'14 Mar'14 Apr'14 May'14 Jun'14 Jul'14
Tho
usa
nd
to
nn
es/m
on
th
China's PTA Operating Rates 2014
TOTAL CAP EFFECTIVE CAP O/R
UTI
LIZA
TIO
N
UTI
LIZA
TIO
N
UTI
LIZA
TIO
N
UTI
LIZA
TIO
N
UTI
LIZA
TIO
N
UTI
LIZA
TIO
N
UTI
LIZA
TIO
N
CA
PAC
ITY
CA
PAC
ITY
CA
PAC
ITY
CA
PAC
ITY
CA
PAC
ITY
CA
PAC
ITY
CA
PAC
ITY

www.icis.com
PX Makers Attempt To Balance Market
South Korea’s makers have largely maintained high operating rates as downstream PTA makers were running their plants at around 95%. Several makers continue to operate TDP at full, while cutting operating rates at PX site, selling feedstock MX, or pushing it for blending.
0
200
400
600
800
1000
1200
1400
1600
1800
2000
60%
65%
70%
75%
80%
85%
90%
95%
100%
105%
Jan Feb Mar Apr
PX Operating Rates
China South Korea Japan China South Korea Japan

www.icis.com
Why The Squeezed Margins In Q1 2014?
76%
82%
74%
80%
72% 68%
0%
10%
20%
30%
40%
50%
60%
70%
80%
90%
0
200,000
400,000
600,000
800,000
1,000,000
1,200,000
1,400,000
1,600,000
January February March
Import PX Requirement Local Build Up PX O/R PTA O/R
• Build up in stocks in China
• Weak downstream performance

www.icis.com
96% 95% 98%
89%
82%
76% 76%
0%
20%
40%
60%
80%
100%
120%
0
5
10
15
20
25
30
35
40
45
50
2010 2011 2012 2013 2014E 2015E 2016E
Op
erati
ng
rate
s
Un
it:
millio
n t
on
nes/
year
Asia PX Plants Operating Rate
Asia PX capacity Asia PX O/R
To balance supply/demand conditions

www.icis.com
Asia PTA plants to run at lower operating rates
Source: Industry
• PTA capacity reached 60.5m tonnes/year in 2013, up by 12%
from 2012, after a 25% growth in 2012
• Continued expansions will lower operating rates further
91%
77% 73%
66%
63% 64%
55%
70%
85%
100%
0
20
40
60
80
100
2010 2011 2012 2013 2014E 2015E
Op
erati
ng
rate
s
Un
it:
millio
n t
on
nes/
year
Asia and Middle East PTA Capacity Expansion
PTA capacity PTA operating rates

www.icis.com
Thank you!
For enquiries, please contact:
Samuel Wong
Tel: +65 6780 4348
Email: [email protected]
Jeffrey Ong
Tel: +65 6780 4346
Email: [email protected]
Acknowledgments:
ICIS China
Sandra Shen & Luo Xiao Li
Tel: +8621 5155 0208, +86 535-3606408
Email: [email protected],
Recommended