ASSESSING ALCOHOL POLICY
IN AN INTERNATIONAL CONTEXT Marion DEVAUX, Health Policy Analyst, OECD RARHA Expert Meeting, Helsinki, 17 February 2016
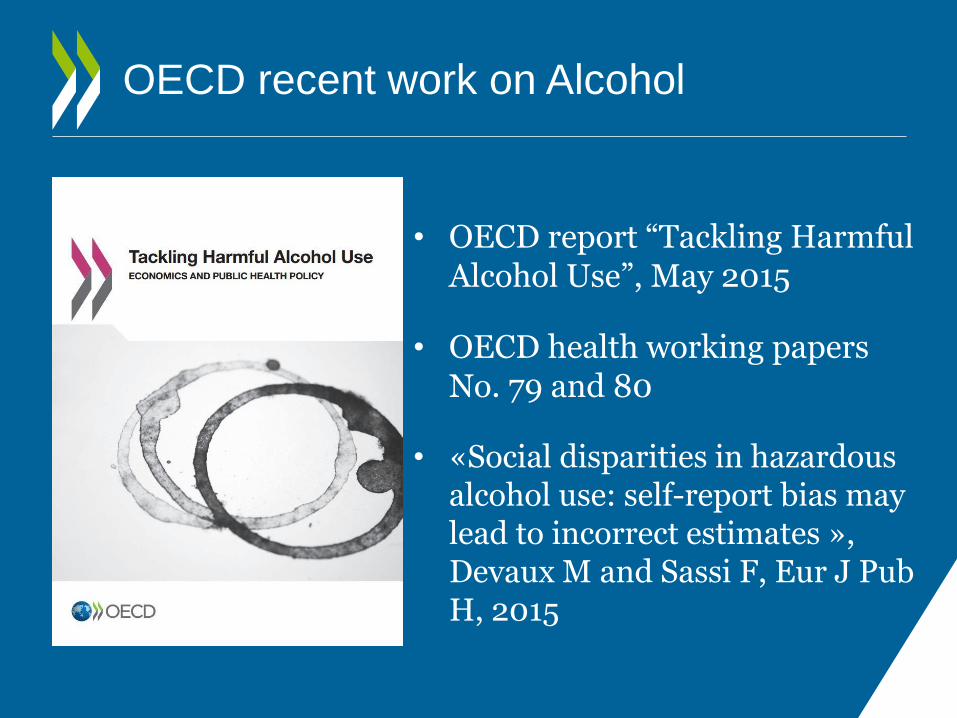
• OECD report “Tackling Harmful Alcohol Use”, May 2015
• OECD health working papers No. 79 and 80
• «Social disparities in hazardous alcohol use: self-report bias may lead to incorrect estimates », Devaux M and Sassi F, Eur J Pub H, 2015
OECD recent work on Alcohol
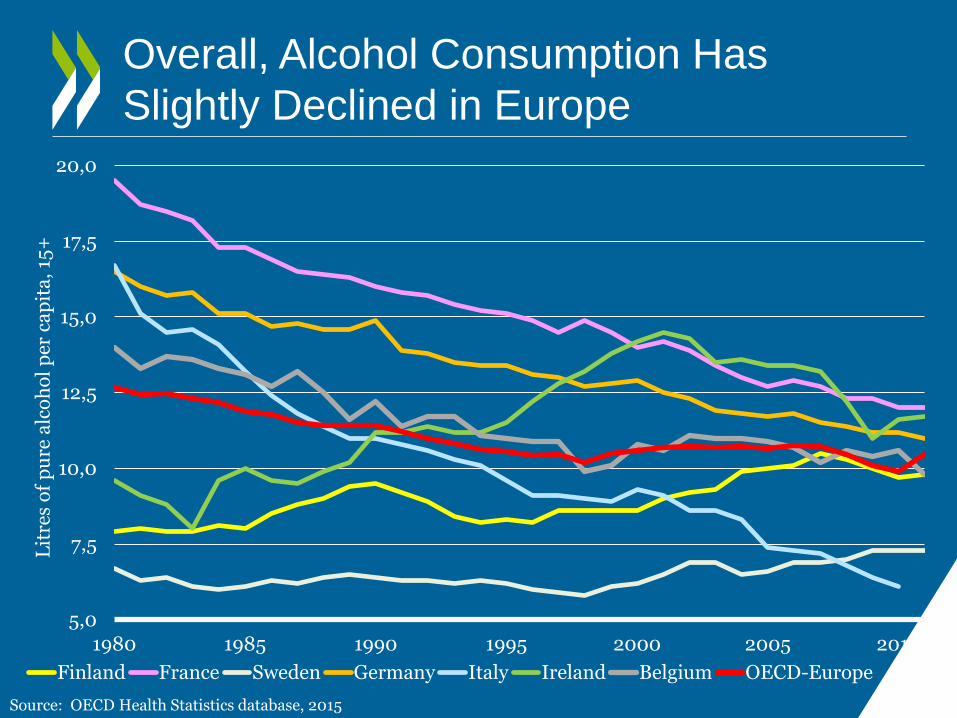
Overall, Alcohol Consumption Has
Slightly Declined in Europe
5,0
7,5
10,0
12,5
15,0
17,5
20,0
1980 1985 1990 1995 2000 2005 2010
Lit
res
of
pu
re a
lco
ho
l p
er c
ap
ita
, 15
+
Finland France Sweden Germany Italy Ireland Belgium OECD-Europe
Source: OECD Health Statistics database, 2015
20%
30%
40%
50%
60%
70%
80%
2001-02 2005-06 2009-10
Sh
ar
e o
f p
eo
ple
ag
ed
15
or
le
ss
in
O
EC
D
Time (years)
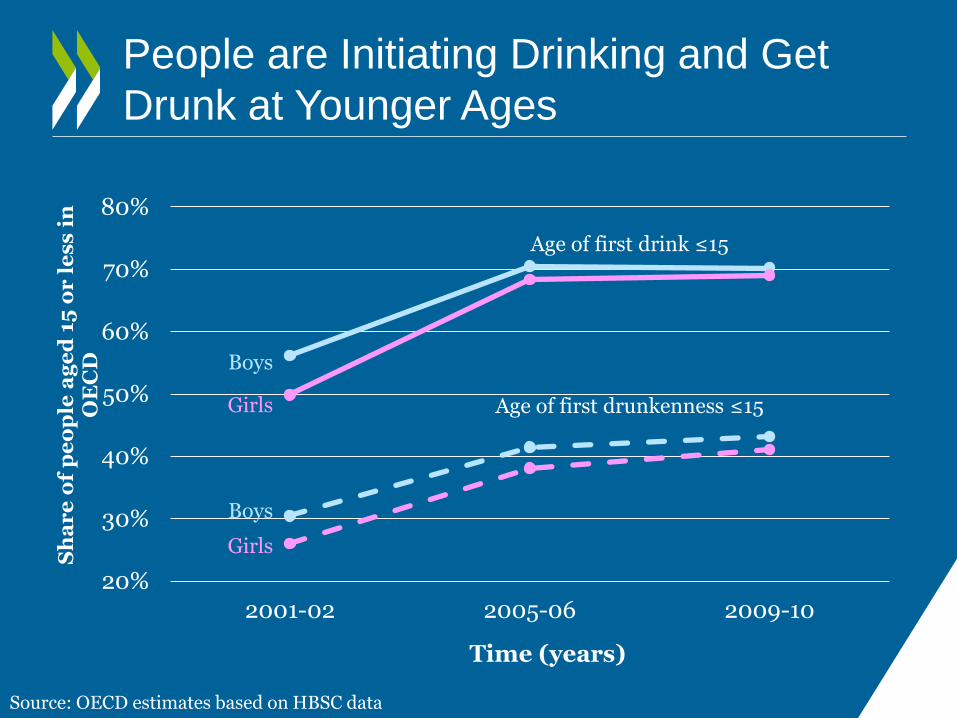
People are Initiating Drinking and Get
Drunk at Younger Ages
Age of first drink ≤15
Age of first drunkenness ≤15
Boys
Girls
Girls
Boys
Source: OECD estimates based on HBSC data
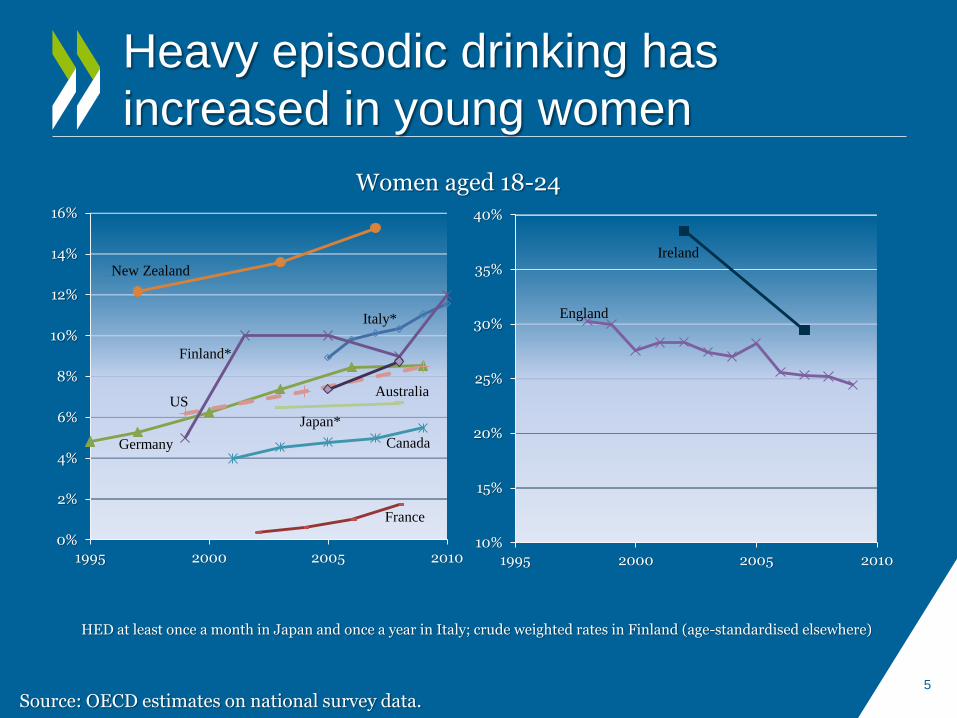
Heavy episodic drinking has
increased in young women
0%
2%
4%
6%
8%
10%
12%
14%
16%
1995 2000 2005 2010
New Zealand
Germany Canada
Italy*
France
Finland*
Japan*
Australia US
10%
15%
20%
25%
30%
35%
40%
1995 2000 2005 2010
England
Ireland
HED at least once a month in Japan and once a year in Italy; crude weighted rates in Finland (age-standardised elsewhere)
Women aged 18-24
5
Source: OECD estimates on national survey data.
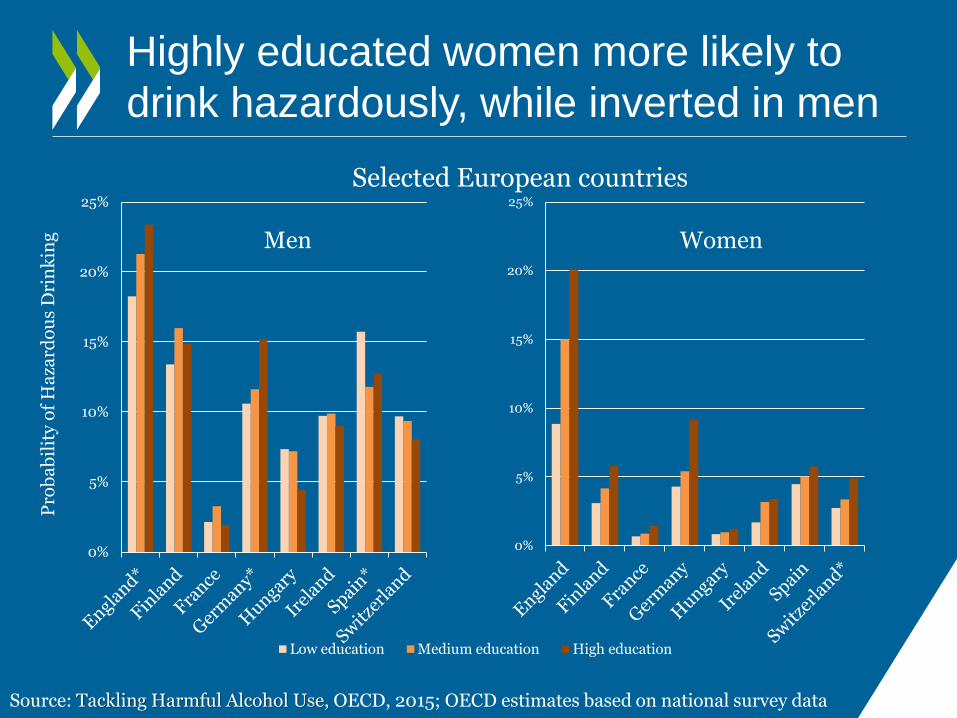
Highly educated women more likely to
drink hazardously, while inverted in men
Pro
ba
bil
ity
of
Ha
zard
ou
s D
rin
kin
g
0%
5%
10%
15%
20%
25%
Low education Medium education High education
0%
5%
10%
15%
20%
25%
Women
Selected European countries
Men
Source: Tackling Harmful Alcohol Use, OECD, 2015; OECD estimates based on national survey data
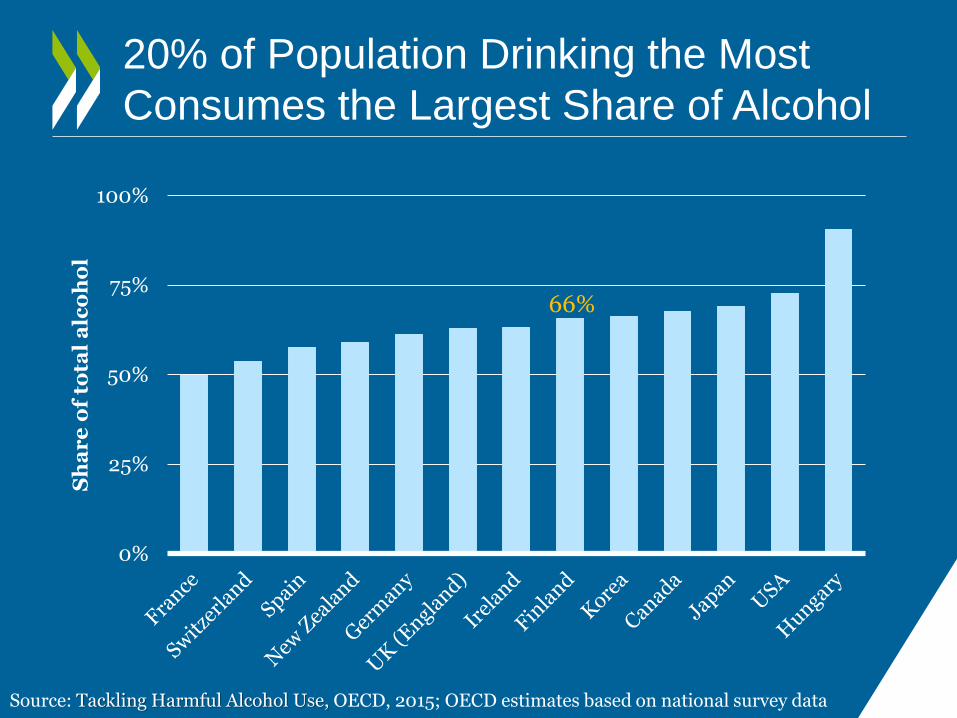
0%
25%
50%
75%
100%
Sh
ar
e o
f to
tal
alc
oh
ol
20% of Population Drinking the Most
Consumes the Largest Share of Alcohol
Source: Tackling Harmful Alcohol Use, OECD, 2015; OECD estimates based on national survey data
66%
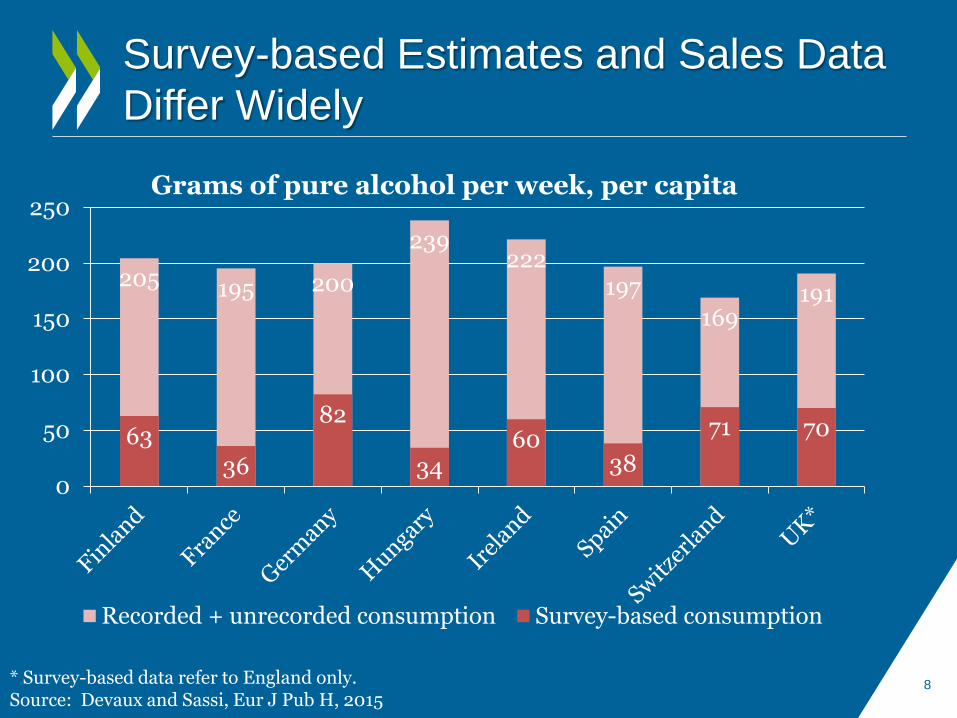
Survey-based Estimates and Sales Data
Differ Widely
8
205 195 200
239 222
197
169 191
63
36
82
34 60
38
71 70
0
50
100
150
200
250Grams of pure alcohol per week, per capita
Recorded + unrecorded consumption Survey-based consumption
* Survey-based data refer to England only. Source: Devaux and Sassi, Eur J Pub H, 2015
Correcting for Self-Report Bias in Drinking
• Triangulation of self-reported survey data with aggregate WHO data (Rehm et al. 2009)
To shift the distribution of alcohol consumption to the aggregate data average .
• Assume the same degree of bias for all population groups, although differences may exist across SES groups or categories of drinkers.
9
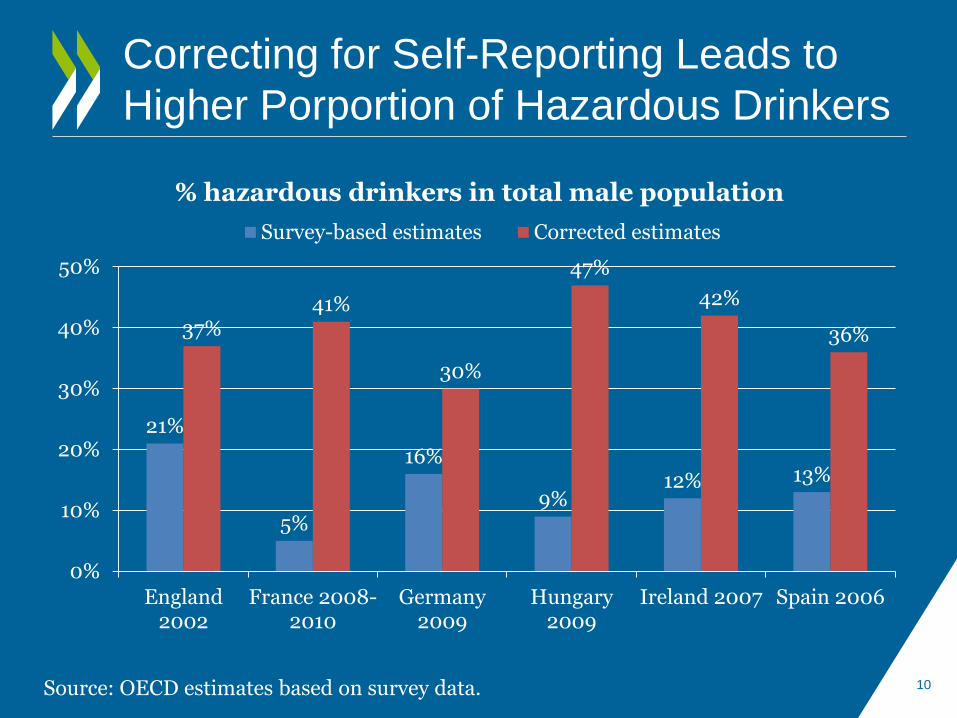
Correcting for Self-Reporting Leads to
Higher Porportion of Hazardous Drinkers
10
21%
5%
16%
9% 12% 13%
37% 41%
30%
47%
42%
36%
0%
10%
20%
30%
40%
50%
England2002
France 2008-2010
Germany2009
Hungary2009
Ireland 2007 Spain 2006
% hazardous drinkers in total male population
Survey-based estimates Corrected estimates
Source: OECD estimates based on survey data.
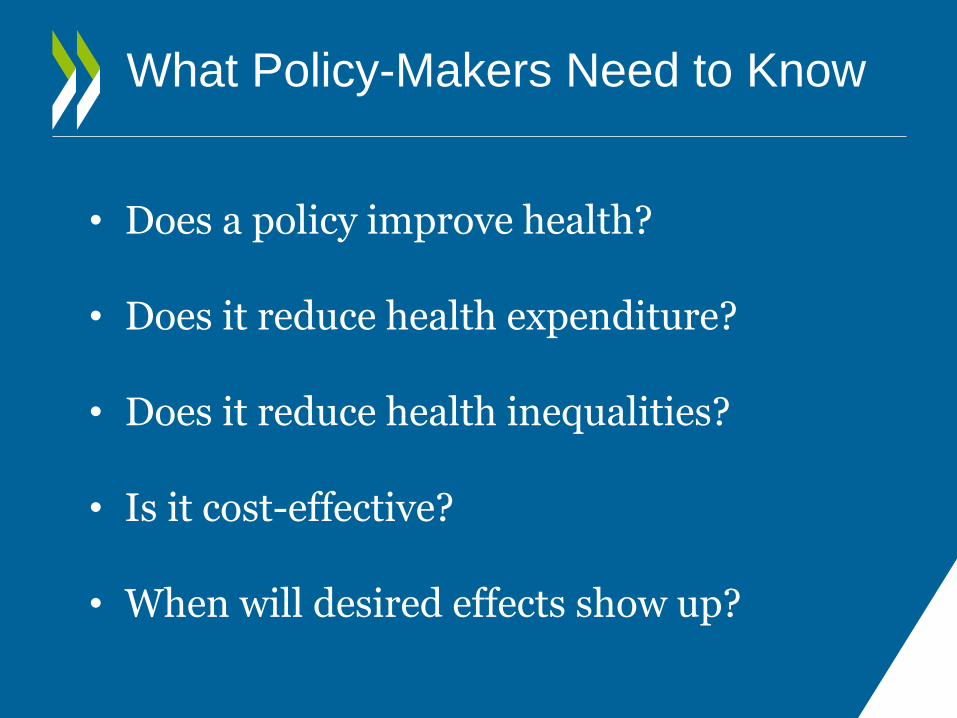
What Policy-Makers Need to Know
• Does a policy improve health?
• Does it reduce health expenditure?
• Does it reduce health inequalities?
• Is it cost-effective?
• When will desired effects show up?
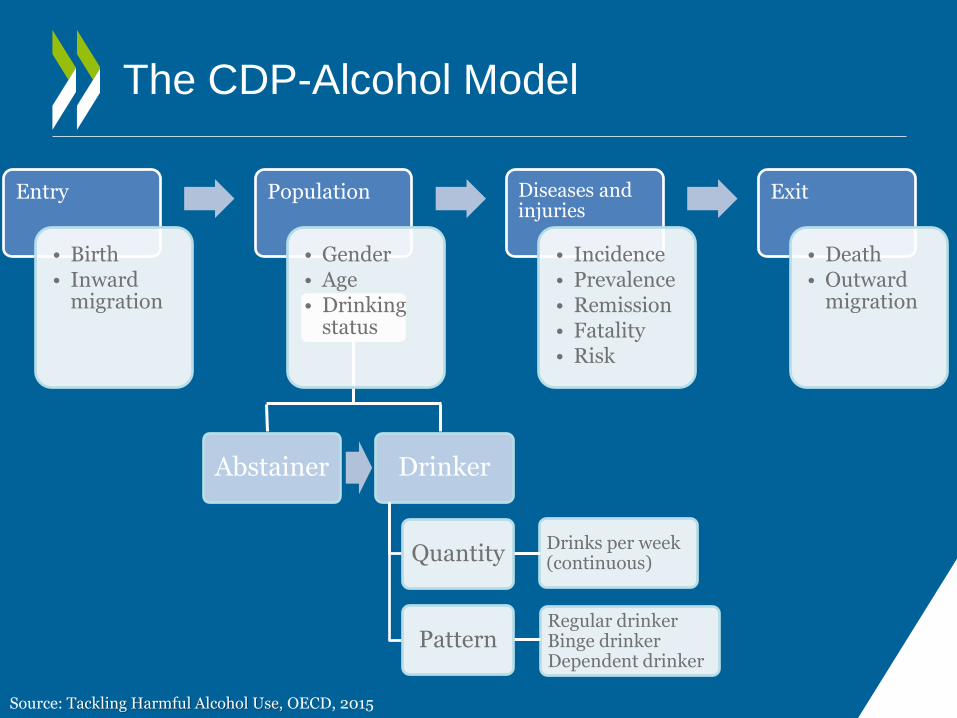
The CDP-Alcohol Model
Abstainer Drinker
Quantity
Pattern
Drinks per week (continuous)
Regular drinker Binge drinker Dependent drinker
Source: Tackling Harmful Alcohol Use, OECD, 2015
Entry
• Birth • Inward
migration
Population
• Gender • Age • Drinking
status
Diseases and injuries
• Incidence • Prevalence • Remission • Fatality • Risk
Exit
• Death • Outward
migration
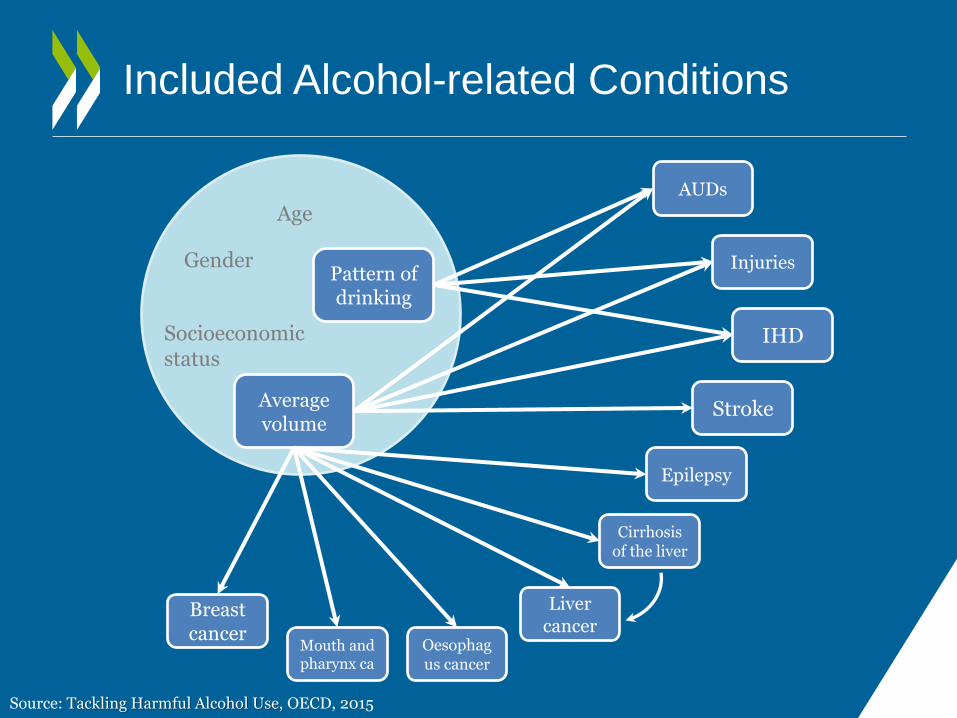
Included Alcohol-related Conditions
Average volume
Pattern of drinking
Breast cancer
Mouth and pharynx ca
Liver cancer
Oesophagus cancer
Cirrhosis of the liver
Epilepsy
Stroke
IHD
Injuries
AUDs
Age
Gender
Socioeconomic status
Source: Tackling Harmful Alcohol Use, OECD, 2015
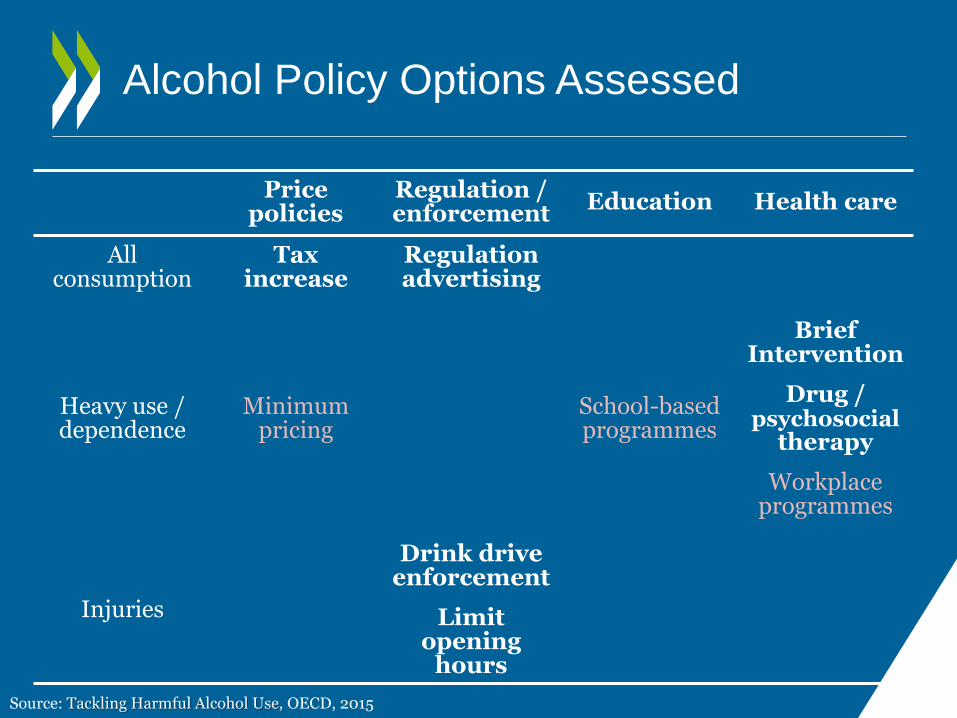
Alcohol Policy Options Assessed
Price policies
Regulation / enforcement
Education Health care
All consumption
Tax increase
Regulation advertising
Heavy use / dependence
Minimum pricing
School-based programmes
Brief Intervention
Drug / psychosocial
therapy
Workplace programmes
Injuries
Drink drive enforcement
Limit opening
hours
Source: Tackling Harmful Alcohol Use, OECD, 2015
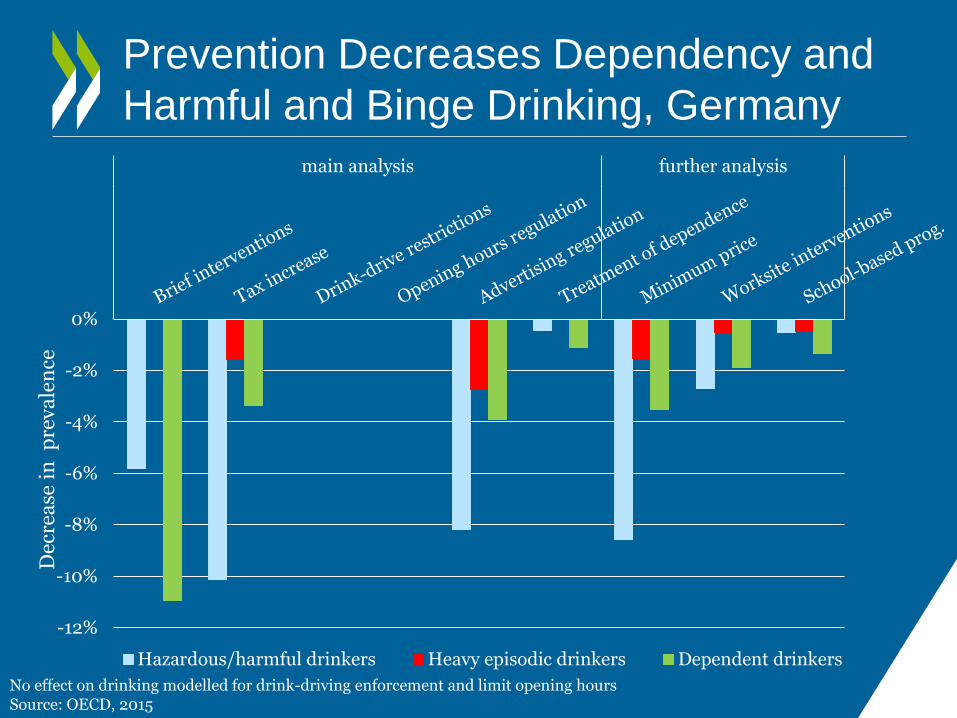
No effect on drinking modelled for drink-driving enforcement and limit opening hours Source: OECD, 2015
Prevention Decreases Dependency and
Harmful and Binge Drinking, Germany
-12%
-10%
-8%
-6%
-4%
-2%
0%
main analysis further analysis
Dec
rea
se i
n
pre
va
len
ce
Hazardous/harmful drinkers Heavy episodic drinkers Dependent drinkers
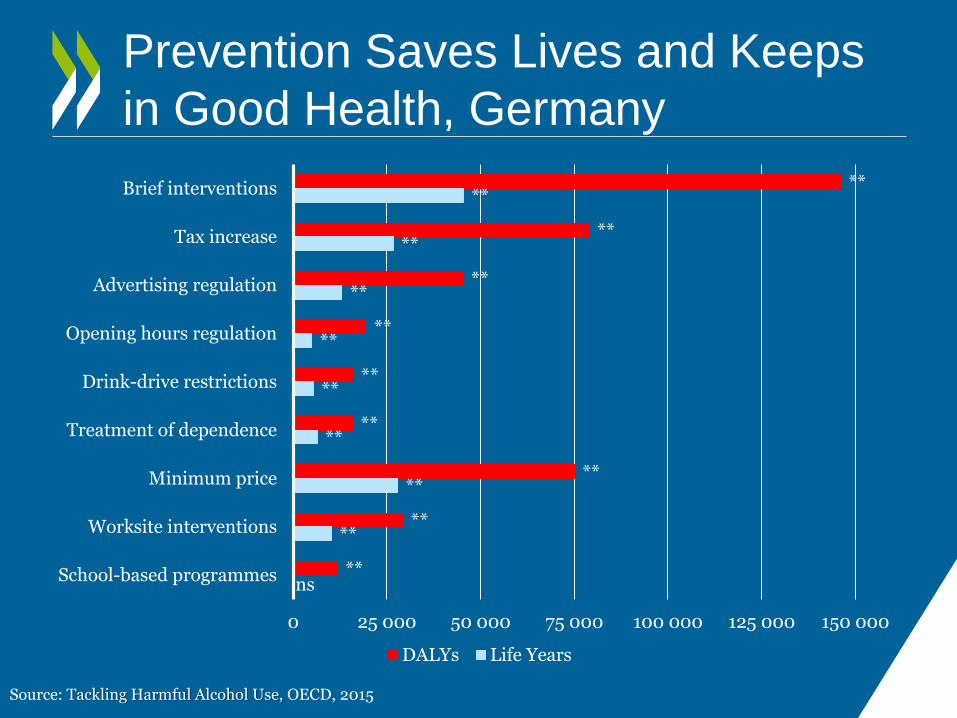
Prevention Saves Lives and Keeps
in Good Health, Germany
**
**
**
**
**
**
**
**
**
**
**
**
**
**
**
**
**
ns
0 25 000 50 000 75 000 100 000 125 000 150 000
Brief interventions
Tax increase
Advertising regulation
Opening hours regulation
Drink-drive restrictions
Treatment of dependence
Minimum price
Worksite interventions
School-based programmes
DALYs Life Years
Source: Tackling Harmful Alcohol Use, OECD, 2015
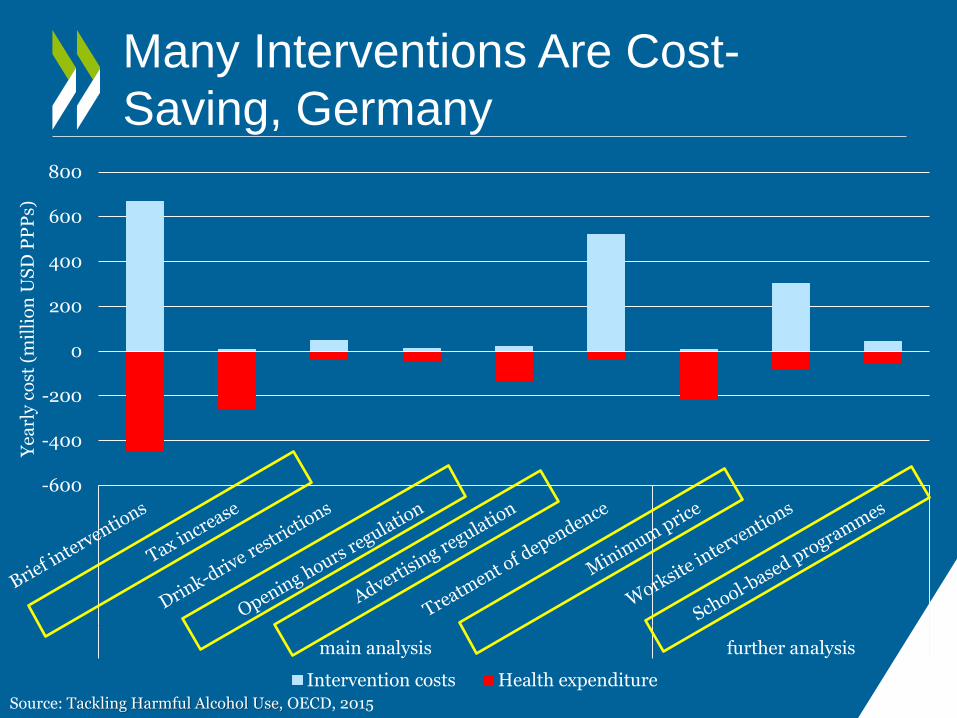
Many Interventions Are Cost-
Saving, Germany
-600
-400
-200
0
200
400
600
800
main analysis further analysis
Ye
arl
y c
ost
(m
illi
on
US
D P
PP
s)
Intervention costs Health expenditureSource: Tackling Harmful Alcohol Use, OECD, 2015
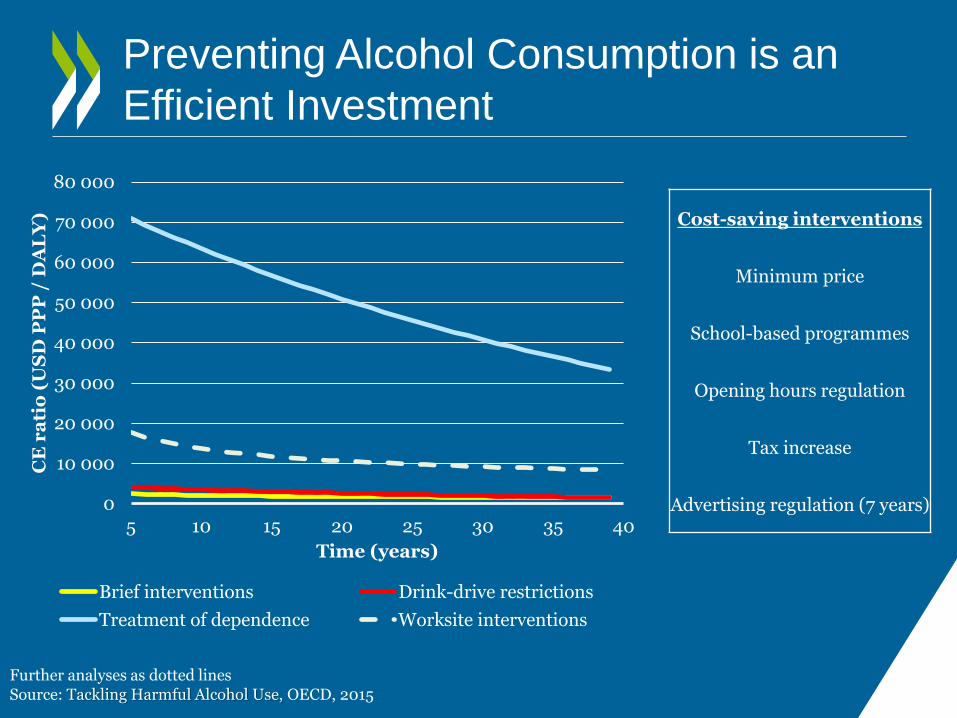
Preventing Alcohol Consumption is an
Efficient Investment
Further analyses as dotted lines
0
10 000
20 000
30 000
40 000
50 000
60 000
70 000
80 000
5 10 15 20 25 30 35 40
CE
ra
tio
(U
SD
PP
P /
DA
LY
)
Time (years)
Brief interventions Drink-drive restrictions
Treatment of dependence Worksite interventions
Cost-saving interventions
Minimum price
School-based programmes
Opening hours regulation
Tax increase
Advertising regulation (7 years)
Source: Tackling Harmful Alcohol Use, OECD, 2015
Key Policy Implications
• Alcohol consumption is decreasing, overall, but with social & geographical disparities and a rise in binge drinking in some groups
• Brief interventions and price and regulation policies provide large health gains
• Alcohol policies produce significant reductions in health care expenditure. Many interventions are cost saving
• All policies become cost-effective soon after implementation
International Alcohol Policy Model
(RAND/OECD/WHO)
• New project funded by NIH for 2015-2019
• 3 types of policy: Price
Drink driving enforcement
Health care policy
• 8 countries: USA, Canada, Mexico, Chile, UK, Finland, Russia + France
• Modelling, Evaluation, Diffusion
Contact: [email protected]
Read more about our work Follow us on Twitter: @OECD_Social
Website: http://www.oecd.org/health/health-systems/economics-of-prevention.htm
Newsletter: http://www.oecd.org/health/update
Thank you
This presentation was produced for a meeting organized within Joint Action
on Reducing Alcohol Related Harm (RARHA) which has received funding
from the European Union, in the framework of the Health Programme (2008-
2013).
The content of this presentation represents the views of the author/s and it
is their sole responsibility; it can in no way be taken to reflect the views of
the European Commission or of the Consumers, Health, Agriculture and
Food Executive Agency or any other body of the European Union. The
European Commission and the Executive Agency do not accept
responsibility for any use that may be made of the information it contains.
Recommended