ASSESSMENT OF EEG EVENT-RELATED
DESYNCHRONIZATION IN STROKE SURVIVORS
PERFORMING SHOULDER-ELBOW MOVEMENTS
by
MICHAEL FU
Submitted in partial fulfillment of the requirements
for the degree of Master of Science
Thesis Advisors:
Dr. M. Cenk Cavusoglu
Dr. Janis J. Daly
Department of Electrical Engineering and Computer Science
CASE WESTERN RESERVE UNIVERSITY
January, 2006

Copyright c©2005 Michael John FuAll rights reserved

Contents
List of Tables iv
List of Figures vii
Abbreviations viii
Abstract ix
1 Introduction 1
1.1 Thesis Contributions . . . . . . . . . . . . . . . . . . . . . . . . . . . 2
1.2 Thesis Outline . . . . . . . . . . . . . . . . . . . . . . . . . . . . . . . 3
2 Background 4
2.1 Background on Stroke-related Motor Deficits . . . . . . . . . . . . . . 4
2.2 Background on EEG . . . . . . . . . . . . . . . . . . . . . . . . . . . 5
2.3 EEG Alpha Band . . . . . . . . . . . . . . . . . . . . . . . . . . . . . 6
2.4 Mu or Rolandic Waves . . . . . . . . . . . . . . . . . . . . . . . . . . 7
2.5 Event-Related Desynchronization . . . . . . . . . . . . . . . . . . . . 8
2.6 Movement-related Cortical Potential . . . . . . . . . . . . . . . . . . 10
2.7 Brain Computer Interface . . . . . . . . . . . . . . . . . . . . . . . . 10
3 Literature Review 13
3.1 EEG Characteristics in Stroke Survivors . . . . . . . . . . . . . . . . 13
i

3.2 Evaluation of EEG Characteristics for Stroke Rehabilitation Use . . . 14
4 Methods 16
4.1 Subjects . . . . . . . . . . . . . . . . . . . . . . . . . . . . . . . . . . 16
4.2 Experimental Paradigm . . . . . . . . . . . . . . . . . . . . . . . . . 17
4.3 Data Recording . . . . . . . . . . . . . . . . . . . . . . . . . . . . . . 18
4.4 Preliminary Data Processing . . . . . . . . . . . . . . . . . . . . . . . 19
4.4.1 Noise Rejection . . . . . . . . . . . . . . . . . . . . . . . . . . 19
4.4.2 Spatial Filtering . . . . . . . . . . . . . . . . . . . . . . . . . . 20
4.4.3 Scalp EMG Noise Detection and Rejection . . . . . . . . . . . 20
4.4.4 ERD Data Processing . . . . . . . . . . . . . . . . . . . . . . 25
4.4.5 Statistical Analysis . . . . . . . . . . . . . . . . . . . . . . . . 29
5 Results 30
5.1 Identification of Brain Region With Greatest Activity . . . . . . . . . 30
5.1.1 Dominant Arm Control Subjects (Right-Arm Tested) . . . . . 30
5.1.2 Non-dominant Arm Control Subjects (Left-Arm Tested) . . . 31
5.1.3 Dominant Arm Stroke Subjects (Right-Arm Tested) . . . . . . 31
5.1.4 Non-dominant Arm Stroke Subjects (Left-Arm Tested) . . . . 32
5.1.5 Outlier Results . . . . . . . . . . . . . . . . . . . . . . . . . . 33
5.2 Identification of Frequency with Greatest Brain Activity . . . . . . . 34
5.2.1 Dominant Arm Control Subjects (Right-Arm Tested) . . . . . 34
5.2.2 Non-Dominant Arm Control Subjects (Left-Arm Tested) . . . 35
5.2.3 Dominant Arm Stroke Survivors (Right-Arm Tested) . . . . . 35
5.2.4 Non-dominant Arm Stroke Survivors (Left-Arm Tested) . . . . 35
5.3 Peak ERD% at the Mu Frequency . . . . . . . . . . . . . . . . . . . . 36
5.3.1 Control Subjects . . . . . . . . . . . . . . . . . . . . . . . . . 36
5.3.2 Stroke Survivors . . . . . . . . . . . . . . . . . . . . . . . . . 36
ii

5.3.3 Controls vs. Stroke Survivors (Right-Arm Tested) . . . . . . . 38
5.3.4 Controls vs. Stroke Survivors (Left-Arm Tested) . . . . . . . . 39
5.3.5 All Stroke Survivors vs. All Control Subjects . . . . . . . . . . 40
6 Discussion 42
6.1 Extensions to Literature . . . . . . . . . . . . . . . . . . . . . . . . . 42
6.2 Limitations . . . . . . . . . . . . . . . . . . . . . . . . . . . . . . . . 43
6.3 Conclusion . . . . . . . . . . . . . . . . . . . . . . . . . . . . . . . . . 44
6.4 Future Work . . . . . . . . . . . . . . . . . . . . . . . . . . . . . . . . 44
Bibliography 46
iii

List of Tables
5.1 Right Arm Tested Control Subjects . . . . . . . . . . . . . . . . . . . 31
5.2 Left Arm Tested Control Subjects . . . . . . . . . . . . . . . . . . . . 31
5.3 Right Arm Tested Stroke Survivors . . . . . . . . . . . . . . . . . . . 32
5.4 Left Arm Tested Stroke Survivors . . . . . . . . . . . . . . . . . . . . 32
5.5 Data from Outliers . . . . . . . . . . . . . . . . . . . . . . . . . . . . 33
5.6 Right Arm Tested Controls . . . . . . . . . . . . . . . . . . . . . . . 34
5.7 Left Arm Tested Controls . . . . . . . . . . . . . . . . . . . . . . . . 34
5.8 Right Arm Tested Stroke Survivors . . . . . . . . . . . . . . . . . . . 35
5.9 Left Arm Tested Stroke Survivors . . . . . . . . . . . . . . . . . . . . 35
5.10 Right Arm Tested Controls . . . . . . . . . . . . . . . . . . . . . . . 37
5.11 Left Arm Tested Controls . . . . . . . . . . . . . . . . . . . . . . . . 38
5.12 Right Arm Tested Stroke Survivors . . . . . . . . . . . . . . . . . . . 39
5.13 Left Arm Tested Stroke Survivors . . . . . . . . . . . . . . . . . . . . 40
5.14 Comparison of all Subjects by Category . . . . . . . . . . . . . . . . . 41
iv

List of Figures
1.1 The Inmotion2 Shoulder-Elbow Robot is used in upper extremity phys-
ical rehabilitation therapies and only allows 2D shoulder-elbow move-
ments [1]. . . . . . . . . . . . . . . . . . . . . . . . . . . . . . . . . . 2
2.1 The major cortical regions of the brain over which EEG electrodes were
placed [2]. . . . . . . . . . . . . . . . . . . . . . . . . . . . . . . . . . 5
2.2 Different perspectives of the International 10-20 standard system of
electrode placement. (A) Sagittal plane, (B) axial plane, and (C) the
locations of the 64 electrode configuration used in this study [3]. . . . 7
2.3 An illustration of an ERD% calculation and the resulting time-domain
plot [4]. . . . . . . . . . . . . . . . . . . . . . . . . . . . . . . . . . . 9
2.4 Example of an MRCP curve starting from baseline approximately 4 s
before movement onset. . . . . . . . . . . . . . . . . . . . . . . . . . . 11
4.1 Illustration of the experimental paradigm in which the diagram to the
right represents what was seen on the subject’s screen. The subject
was to move from the ‘start’ circle to stop at the ‘end’ circle in as
straight a line as possible. . . . . . . . . . . . . . . . . . . . . . . . . 17
4.2 Photograph of the NeuroScan 64-electrode Quik-Cap used to make
EEG recordings in this study. . . . . . . . . . . . . . . . . . . . . . . 18
v
4.3 Photograph of the NeuroScan Synamps amplifier system used to make
EEG recordings in this study [5]. . . . . . . . . . . . . . . . . . . . . 19
4.4 A)Frequency-domain plots of the range 8–30 Hz of EEG recordings at
64 electrodes for a randomly selected subject in this study. The vertical
axis is magnitude in uV. The effects of the unknown noise source at 20
Hz are clearly visible as the vertical spike in the center of each electrode
recording. B) A more detailed plot of electrode C3 reveals that the 20
Hz noise signal (darkened bar) is approximately 4 uV in amplitude and
greater than all the other frequency components. . . . . . . . . . . . . 21
4.5 Shaded electrodes were the locations where EMG from the scalp mus-
cles showed greatest activity when recorded from EEG electrodes. AF7
and AF8 were affected by the frontalis muscles, while FT7 and FT8
were affected by the temporalis muscles [6]. . . . . . . . . . . . . . . . 23
4.6 If a trial at electrode AF7 was suspected of EMG contamination, then
the same trial from 5 neighboring electrodes were also examined. . . . 24
4.7 Illustration of the cognitive rest and planning intervals identified for
stroke subjects. . . . . . . . . . . . . . . . . . . . . . . . . . . . . . . 26
4.8 The dashed line represents the power spectrum of motor planning state
EEG while the solid line represents the power spectrum of rest state
EEG. The peak mu frequency was identified at the frequency where
there is the greatest difference between the power spectrum values of
the two states. . . . . . . . . . . . . . . . . . . . . . . . . . . . . . . . 27
4.9 Illustration of what a normal adult’s ERD% time series plot would
look like if they were recorded while performing a movement. The
peak ERD% correlates to the greatest amount of cortical activity. . . 29
vi

5.1 Boxplot of peak ERD for control subjects. For each boxplot, the box
is centered about the mean, the upper edge of the box represents the
3rd quartile and the lower side represents the 1st quartile. The vertical
lines span the range of the data. They were significantly different (p
= 0.008). . . . . . . . . . . . . . . . . . . . . . . . . . . . . . . . . . . 37
5.2 Boxplot of peak ERD for stroke survivors. a statistically significant
difference between the left and right arm tested stroke survivors (p =
0.01). . . . . . . . . . . . . . . . . . . . . . . . . . . . . . . . . . . . . 38
5.3 Boxplot of peak ERD for right-arm tested subjects. Controls and
stroke survivors were not significantly different (p = 0.09). . . . . . . 39
5.4 Boxplot of peak ERD for left-arm tested subjects. Left-arm tested
stroke survivors had significantly less peak ERD versus the left-arm
tested control subjects (p = 0.023). . . . . . . . . . . . . . . . . . . . 40
5.5 Boxplot of peak ERD for right-arm tested subjects. There was a sta-
tistically significant difference between the control and stroke groups
(p = 0.002). . . . . . . . . . . . . . . . . . . . . . . . . . . . . . . . . 41
vii

Abbreviations
ALS - Amyotrophic Lateral Sclerosis
ANOVA - Analysis of Variance
BCI - Brain-Computer Interface
CAR - Common Average Reference
CD - Complex Demodulation
EEG - Electroencephalography
EMG - Electromyography
ERBP - Event-Related Band Power
ERD - Event-Related Desynchronization
FbEEG - Full-Band Electroencephalography
MRCP - Movement-Related Cortical Potential
SCI - Spinal Chord Injury
SNR - Signal-to-Noise Ratio
viii

Assessment of Event-Related Desynchronization in Stroke Survivors
Performing Shoulder-Elbow Movements
Abstract
by
MICHAEL FU
It is unknown whether electroencephalography (EEG) signal characteristics in stroke
survivors with motor deficits register enough activity for use with brain-computer
interfaces (BCIs). This research studied pre-movement EEG from shoulder-elbow
movement in stroke survivors to identify signal characteristics potentially useful for
robot-assisted stroke rehabilitation. Pre-movement event-related desynchronization
(ERD) was examined in the alpha band mu rhythm for control (n =7) and stroke
subjects (n = 11). Subjects were all right-hand dominant; stroke subjects used their
afflicted arm and controls were assigned a side to match stroke subjects. Both non-
dominant-arm-tested stroke and control subjects exhibited greater ERD intensity vs.
those using their dominant arm (p < 0.05). Also, pre-movement ERD was detected
in stroke survivors, which suggests at the possibility of using ERD as a BCI system
control signal. However, the peak ERD of stroke survivors was significantly lower
than that of healthy subjects (p < 0.05), which brings doubt to whether the intensity
of ERD in stroke survivors is large enough to be used as a BCI system control signal.
ix

Chapter 1
Introduction
Cortical activity driving motor-related activity has become an important field of
research for studies attempting to decode the brain’s electrical activity for use as a
control signal in brain-computer interfaces (BCIs) or brain-machine interfaces (BMIs).
Many studies reported use of BCI or BMI to improve the lives of people suffering
from spinal chord injuries (SCI) or amyotrophic lateral sclerosis (ALS) [7]. Patients
with SCI or ALS can plan out or imagine movements normally, but not perform
them. In these studies, the brain’s neural activity was detected during imagined
movements and translated into prosthesis control signals or into mouse cursor motions
for communication purposes.
Cortical activity as a result of motor-related planning exists not only in normal,
undamaged brains, but also in the brains of stroke survivors, despite the injury that
ischemia inflicts in the brain [8]. However, because of the ischemia, damaged neurons,
and potentially altered neural activity, it is unknown whether EEG in stroke survivors
can be used in BCI. The purpose of this research study was to characterize EEG in
stroke survivors in order to identify signal characteristics that could potentially be
used in BCI applications.
1

Figure 1.1: The Inmotion2 Shoulder-Elbow Robot is used in upper extremity physicalrehabilitation therapies and only allows 2D shoulder-elbow movements [1].
1.1 Thesis Contributions
The objective of this thesis was to extend existing literature in a number of ways.
First, the event-related desynchronization characteristics of stroke-affected EEG dur-
ing a shoulder-elbow motion were evaluated during use of the Interactive Motion
Technologies, Inc. (Cambridge, MA) Inmotion2 Shoulder-Elbow Robot (Fig. 1.1).
Second, new information was identified regarding EEG signal characteristics for dom-
inant versus non-dominant shoulder elbow movements for both healthy controls and
stroke survivors.
2

1.2 Thesis Outline
The remainder of this thesis is organized as follows. Several relevant background
topics and existing research are discussed in the Background (ch. 2) and Literature
Review (ch. 3) chapters. Then, the Methods chapter (ch. 4) describes the experiment
paradigm and data analysis techniques that were employed. Findings from this study
are reported in the Results chapter (ch. 5) and extensions to literature and study
limitations are mentioned in the Discussion chapter (ch. 6). Key findings and further
research directions are also described in the Discussion chapter.
3

Chapter 2
Background
This section will discuss information and current research regarding stroke, EEG
waves, and BCI. Niedermeyer and Lopes da Silva’s text Electroencephalography [9]
and Bogousslaysky and Caplan’s text Stroke Syndromes [10] are definitive texts on
EEG and stroke, respectively.
2.1 Background on Stroke-related Motor Deficits
A stroke occurs when a blood vessel leading directly to the brain can no longer deliver
oxygen and nutrients to it, resulting in the death of cortical tissue. There are two
types of stroke: 1) an ischemic stroke occurs when a blood clot blocks blood from
entering the brain and 2) a hemorrhagic stroke occurs when a blood vessel ruptures.
In a normal adult, motor tasks on a particular side of the body are controlled by
the side of the brain contralateral to the side of motion (for instance, a right arm
movement is controlled by the left side of the brain). Therefore, if a stroke occurs
near the sensory or motor areas of the brain (Fig. 2.1) various motor deficits can
occur and impair the side of the body contralateral to the damaged side of the brain.
Some of the motor impairments that can occur are hemiparesis, hemiplegia and
motor aphasia. Hemiparesis is a weakness in the muscles of a single side of the
4

body, whereas hemiplegia is a total paralysis of one side of the body. Stroke victims
suffering motor aphasia, on the other hand, might have little trouble with executing
movements, but are unable to understand how objects are used. For instance, they
will see a hammer and a nail and not understand how to use the hammer on the nail.
The stroke survivors in this study suffered from hemiparesis or hemiplegia.
Figure 2.1: The major cortical regions of the brain over which EEG electrodes wereplaced [2].
2.2 Background on EEG
Electroencephalography (EEG) signals are recorded in terms of voltage (microvolts
in scale) by electrodes placed on the scalp of a subject and were first studied by
Hans Berger in humans in 1920 [9]. The recorded signals result from fluctuating
extracellular electric field potentials surrounding neurons in the brain. When active
excitatory or inhibitory synapses alter the electric signal arriving from the neuron, the
result is a fluctuating field potential that can be measured at the scalp with electrodes
and amplifiers. The current standard for electrode placement is the International 10-
5

20 system (Figure 2.2). Each electrode is 8 mm in diameter and has a cavity depth
of 5 mm in which conductive gel can be injected to lower impedance between the
electrode and the scalp. The electrodes are labeled by their location on the scalp (F
for frontal, C for central, T for temporal, P for parietal, and O for occipital) and
numbered so that the Z (for zero) electrodes run down the center, odd electrodes are
on the left hemisphere, and even electrodes are on the right.
Prior to practical analog to digital conversion technologies, EEG recordings were
plotted onto paper and visually examined. But since the 1970s, the norm has become
frequency domain and statistical analysis of EEG signals with computers. Like other
bioelectric signals, EEG waves are quasi-periodic, but for analysis purposes several
frequency band classifications of EEG have been defined by researchers and are named
in the order of their discovery — not by their order in the frequency spectrum. Five
commonly studied ones are: alpha band (8–13 Hz), beta band (14–30 Hz), gamma
band (30–70 Hz), delta band (0.1–3.5 Hz), and theta band (4–7.5 Hz) [9].
2.3 EEG Alpha Band
This study focused on EEG signal characteristics in the alpha band. The alpha band
was one of the earliest identified by Berger and includes waves oscillating from 8–
13 Hz. An increase in the amplitude of alpha waves is best correlated with relaxed
wakefulness for the normal adult. Most notably, amplitudes can be enhanced when
the eyes are closed (such as during meditation). Typical amplitudes of alpha waves
are difficult to define because they vary greatly from person to person, but a typical
range can be from 0–50 uV. Values above 100 uV are uncommon in normal adults
[9]. Attenuation of the alpha waves, which is also called desynchronization, occurs
when the subject is either attentive, anxious, or in a state of expectancy to external
stimuli. Therefore, motor task planning attenuates waves in this frequency band.
6

Figure 2.2: Different perspectives of the International 10-20 standard system of elec-trode placement. (A) Sagittal plane, (B) axial plane, and (C) the locations of the 64electrode configuration used in this study [3].
2.4 Mu or Rolandic Waves
Mu waves, also known as Rolandic waves, were discovered by Jasper and Andrews in
1938 and are known to exist in the alpha band. Mu stands for motor and in most
healthy adults, the mu wave is attenuated whenever movements (voluntary, passive,
or reflexive) are performed or even imagined. Mu wave attenuation occurs up to, and
sometimes beyond, 2 s before movement onset. It has key, harmonically unrelated
frequency components at around 10 Hz (alphoid component) and at 20 Hz (beta
component). The alphoid component can exist anywhere from 8 Hz to above 11 Hz in
some adults. The alphoid component of the mu wave arises from the somatosensory
7

cortex (Fig. 2.1), so it is usually most active and detectable under the CP EEG
electrodes that overlay the parietal area, which can be seen by comparing Figure 2.1
with Figure 2.2A. The beta component of the mu wave, however, arises from the
motor cortex (Fig. 2.1) and is most active under the CZ, C3, and C4 electrodes
(Fig. 2.2C). Both the alpha and beta band mu components exhibit attenuation, or
desynchronization, prior to and during movements [11].
2.5 Event-Related Desynchronization
Brain activity during sensory processing or motor behavior was first reported by
Berger in 1930 and can be observed in EEG data as the desynchronization, or atten-
uation, of alpha and beta band waves. Event-related desynchronization (ERD) refers
to desynchronization that occurs due to voluntary or involuntary activity. It is also
a reliable correlate of increased cellular excitability in the thalamocortical systems
during cortical information processing [9]. In contrast, when the brain is idling (at
rest), alpha waves are enhanced, reflecting greater amplitudes in the EEG data. One
theory on the cause of desynchronization is that neurons behave like weakly-coupled
non-linear oscillators which synchronize with each other when the brain is idle, but
desynchronize from the weak coupling when processes become active in the brain [12].
Gert Pfurtscheller developed the ERD percentage measure to quantify the amount
of EEG desynchronization, [9]. The measure is formally defined as
ERD%decrease = 100× Powerref − Powerx
Powerref
(2.1)
where Power ref is the average power in a reference interval (typically a period of
time that is a few seconds while the subject is at rest) and Powerx is the average
power in an interval of interest with which we wish to compare the reference interval
for activity in the EEG data. A positive ERD percentage indicates that there is a
8

decrease in power with respect to the reference state and a negative value means there
is an increase in power.
In ERD analysis of motor tasks, the subject is asked to perform multiple trials of
the task so that the mu wave can be identified. This is accomplished by identifying
the frequency in the alpha and beta bands, for which there is a maximum difference
in average power between the rest and motor-planning states. Then, each trial’s
time-domain EEG data is bandpass filtered to include only mu frequency signals,
squared to obtain power, and finally the ERD percentage equation is applied to the
data with Power ref as defined and Powerx as each sample of data in the bandpassed
and squared data. Figure 2.3 gives a graphical example of the calculation and the
resulting time-series ERD% plot.
Figure 2.3: An illustration of an ERD% calculation and the resulting time-domainplot [4].
9

2.6 Movement-related Cortical Potential
ERD is most noticeable in the 8–12 Hz range, but there is also a movement-related
EEG activity in the slow, 0.1–1 Hz range called the movement-related cortical po-
tential (MRCP). MRCPs are negative potentials that can be seen in the raw EEG
data after averaging many trials of the same motor task together (Fig. 2.4). The
initiation of the MRCP curve occurs before movement onset and is the beginning of
pre-motor planning [9]. The amplitude of the curve is correlated with the amount of
cognitive effort. For example, one would suspect that using the non-dominant hand
to perform a motor task requires more focus or effort, which should be detectable in
the MRCP. And in fact, Tarkka found that the MRCP for moving the non-dominant
index finger starts earlier and rises to higher amplitude than dominant finger move-
ments [13]. Although the MRCP reflects cortical activity, it is not practical as a BCI
input signal because it is discernable only after averaging many trials, unlike ERD.
MRCP and ERD share common timing characteristics, though, so MRCP start times
and duration can be used to help identify periods of cortical activity in which ERD
should be present [14].
2.7 Brain Computer Interface
BCI systems are designed to translate the brain’s activity during imagined move-
ments into computer cursor or prosthesis control. Wolpaw, et al. at the Wadsworth
Center for Laboratories and Research in NY implemented a pioneering EEG-based
BCI system in 1991 [15]. This system measured the amplitude of mu waves to al-
low a well trained subject to control the direction of a cursor in one dimension by
varying the amplitude of their mu waves [15]. In 2004, the same group was able to
make two dimensional control possible using noninvasive EEG, even though it was
widely assumed that only invasive recordings of brain waves can provide the resolu-
10

Figure 2.4: Example of an MRCP curve starting from baseline approximately 4 sbefore movement onset.
tion needed to achieve 2D control [16]. These advancements in noninvasive EEG BCI
systems are important for developing a BCI system for stroke survivors because in-
vasive recordings require implanted electrodes under the skull, which is not desirable
for individuals who already have stroke-induced damage to their brains.
Stroke survivors are unique from other types of people who can benefit from BCI
because they can be rehabilitated to a greater degree than those suffering from SCI or
ALS. Therefore, stroke survivors might best use BCI not as a permanent prosthesis-
driving technology, but instead as a rehabilitation tool that might provide therapies
to focus on and take advantage of the plasticity of the brain to regain motor control.
Plasticity is the brain’s ability to reorganize around damaged cortical areas and
recover functions for which those areas were responsible. Using EEG recordings,
Sterns, et al. discovered that increases in task-related coupling between cortical areas
may compensate for brain damage after stroke [17]. They also found that some of
the increased coupling decreases as patients make a functional recovery. Therefore,
if a BCI system is developed to analyze the EEG of stroke survivors, then it can be
paired with a rehabilitation robot to tailor-design therapy sessions which promote
11

plasticity in the brain of the subject.
Since the 1990s, rehabilitation robots have become an effective component of
stroke therapy studies [18]. Unlike a self-evoked motion, robots like the Inmotion2
Shoulder-Elbow Robot (Fig. 1.1) challenge and assist stroke survivors to accomplish
movements they cannot otherwise successfully perform. Lum, et al. even found that
robot-assisted therapy helped stroke survivors improve more (in both biomechanical
and Fugl-Meyer assessment of motor impairment measures) than conventional therapy
did [19]. A combination of robotic rehabilitation and BCI would allow therapists to
actively measure and restore lost motor skills cortically, instead of only functionally.
However, there are currently no studies on the effect of stroke on the EEG of subjects
executing movements that can be assisted with a rehabilitation robot.
12

Chapter 3
Literature Review
This section will discuss existing literature regarding two topics relevant to this thesis:
1) EEG characteristics in stroke survivors and 2) the use of EEG as a control signal
in stroke rehabilitation.
3.1 EEG Characteristics in Stroke Survivors
EEG signals during motor tasks have been characterized in normal adults. The
purpose of the current study was to characterize EEG signal in stroke survivors and
determine whether any of the characteristics of the EEG signal would be potentially
useful for BCI in stroke survivors with sensorimotor cortex damage. There was some
doubt about this issue, as sensorimotor cortical damage might render the cortical
signal useless as a control signal or in rehabilitation applications. In fact, Daly, et al.
found that the initiation of cognitive planning in stroke survivors was significantly
delayed versus healthy control subjects (p < 0.05) [20]. Daly, et al.’s study was the
first to report on pre-movement cortical motor planning for a shoulder-elbow motor
task. The outcome measure that was used was an averaged “off-line” (not in real
time) calculation of motor planning time. In order to use EEG signals “on-line”
(in real time) during motor re-training, a characteristic of the raw signal must be
13

identified. BCI systems currently use mu rhythm ERD as a BCI control signal for
normal, ALS, and SCI subjects [15]. The purpose of the current study was to evaluate
the usefulness of ERD in order to identify a real-time measure of brain activity.
Most studies of healthy adults focused on ERD during finger movements [8], [21],
and [11]. Platz, et al. investigated cortical motor planning by using a motor task that
involved the index finger tracing a small triangle. Functional movements involve the
use of shoulder and elbow movements, and stroke survivors often have impairment in
the control of these movements [8]. Therefore, shoulder-elbow movements in stroke
survivors were studied. The only study that examined a shoulder-elbow movement
was Labyt, et al., who studied the ERD of a targeting movement in which subjects
pointed to a target in front of them with their index finger, but the subjects were
healthy young and elderly adults [22]. In contrast, the subjects in the current study
were not required to be able to complete the movement required for the motor task.
3.2 Evaluation of EEG Characteristics for Stroke
Rehabilitation Use
Conventional therapies do not restore normal control to many stroke survivors. There-
fore, it is critical to identify more effective stroke rehabilitation strategies. The use of
mu wave ERD as a control signal has shown some promise in normal adults, locked in
syndrome, ALS, and SCI [15], [7]. BCI users typically train to voluntarily modulate
their mu waves by imagining movement and inducing ERD [15]. These changes in sig-
nal amplitude are then detected and translated into control signals for communication
or prosthetic control [23].
It is not clear whether the EEG signal can be used for stroke survivors as a control
signal or in rehabilitation of motor or cognitive function. There is no literature on
stroke survivors using BCI and Daly, et al.’s discovery that stroke survivors have
14

delayed cortical planning periods versus healthy controls raises doubts about whether
stroke survivor EEG is compatible with BCI systems [20].
This study also investigated whether the effect of hand dominance on the EEG
signal characteristics for shoulder-elbow movement is consistent with literature on
finger movements. Tarkka studied the healthy adults performing finger movements
on different hands and found that the MRCP began significantly earlier and with
elevated intensity for subjects moving their non-dominant hand versus dominant-side
movements (p < 0.05) [13]. Consistent with this finding, Stancak reported an earlier
start and greater percentage of ERD for non-dominant finger movements compared
with dominant hand movements [24]. Finally, Bai et al. provided the most recent
findings on this topic in a 2005 study investigating hand dominance using ERD cor-
related with EMG signals [21]. They reported that, compared to the non-working
side of the brain during dominant hand finger movements, there is more activity on
the non-working side of the brain when fingers of the non-dominant hand are moved.
To date, there is no available information regarding ERD for dominant versus non-
dominant upper limb during shoulder or elbow movements for either healthy or stroke
subjects.
Another gap in the literature is that there are currently no published studies
on the EEG signals of subjects operating rehabilitation robots. Daly’s study was
the first, to date, to look at EEG signal activity during cognitive pre-movement
planning in stroke subjects using a rehabilitation robot, and this thesis extends those
findings [20]. This thesis analyzed ERD measures rather than MRCP measures in
order to evaluate whether real-time EEG signal characteristics can accurately reflect
pre-movement cortical activity.
15

Chapter 4
Methods
Event-related desynchronization was the EEG signal characteristic analyzed for this
study because it is a reliable correlate of increased cortical activity during information
processing [9]. Also, the intensity of ERD relative to a cortical rest interval can be
computed in real time to reflect the amount of cortical activity that is responsible for
motor task planning. This section describes the methods used to analyze ERD in this
thesis. The contents include a description of the subjects recruited for the study, the
experimental paradigm and data recording methods, and the data analysis techniques
that were used (spatial filtering, noise rejection, and computation of ERD).
4.1 Subjects
Twenty right-hand-dominant subjects were selected and gave consent to enroll in
this study. This study was conducted according to the Declaration of Helsinki and
oversight was provided by the Internal Review Board of the Louis Stokes Cleveland
Veterans Affairs Medical Center. Ages ranged from 48–72 years old, with a mean age
of 61. Twelve of these subjects had chronic (> than 12 months) arm coordination
deficits following stroke and eight subjects were age-matched, healthy individuals.
16
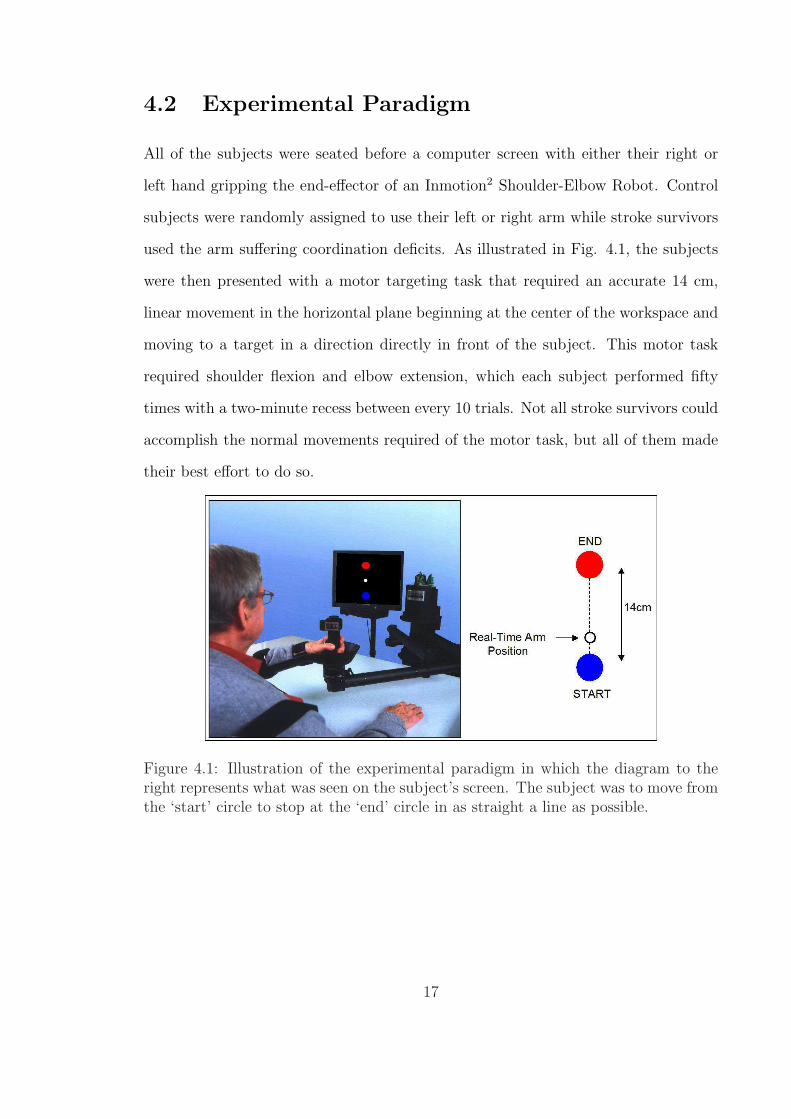
4.2 Experimental Paradigm
All of the subjects were seated before a computer screen with either their right or
left hand gripping the end-effector of an Inmotion2 Shoulder-Elbow Robot. Control
subjects were randomly assigned to use their left or right arm while stroke survivors
used the arm suffering coordination deficits. As illustrated in Fig. 4.1, the subjects
were then presented with a motor targeting task that required an accurate 14 cm,
linear movement in the horizontal plane beginning at the center of the workspace and
moving to a target in a direction directly in front of the subject. This motor task
required shoulder flexion and elbow extension, which each subject performed fifty
times with a two-minute recess between every 10 trials. Not all stroke survivors could
accomplish the normal movements required of the motor task, but all of them made
their best effort to do so.
Figure 4.1: Illustration of the experimental paradigm in which the diagram to theright represents what was seen on the subject’s screen. The subject was to move fromthe ‘start’ circle to stop at the ‘end’ circle in as straight a line as possible.
17

4.3 Data Recording
Simultaneous data recordings were obtained for EEG, electromyography (EMG), and
movement onset. EEG data were obtained using Compumedics NeuroScan Ltd. (El
Paso, TX) devices and software. The data were recorded using NeuroScan Acquire
4.3.1 software, a 64-electrode Quick-Cap EEG cap (Fig. 4.2), and a NeuroScan
Synamps amplifier system with a gain of 500, sampling rate of 1000 Hz, and bandpass
filter set to pass 0.1–40 Hz (Fig. 4.3). All electrodes on the EEG cap were 8 mm in
diameter with a 5 mm cavity depth and were arranged on the scalp in compliance with
the International 10-20 standard [25]. Each recording was referenced to the common
linked left and right mastoid surface electrodes. All electrode-to-scalp impedances
were reduced to less than 10 kΩ using electrically conductive gel and real-time elec-
trode impedance measurements provided by the NeruoScan Acquire software.
Figure 4.2: Photograph of the NeuroScan 64-electrode Quik-Cap used to make EEGrecordings in this study.
18
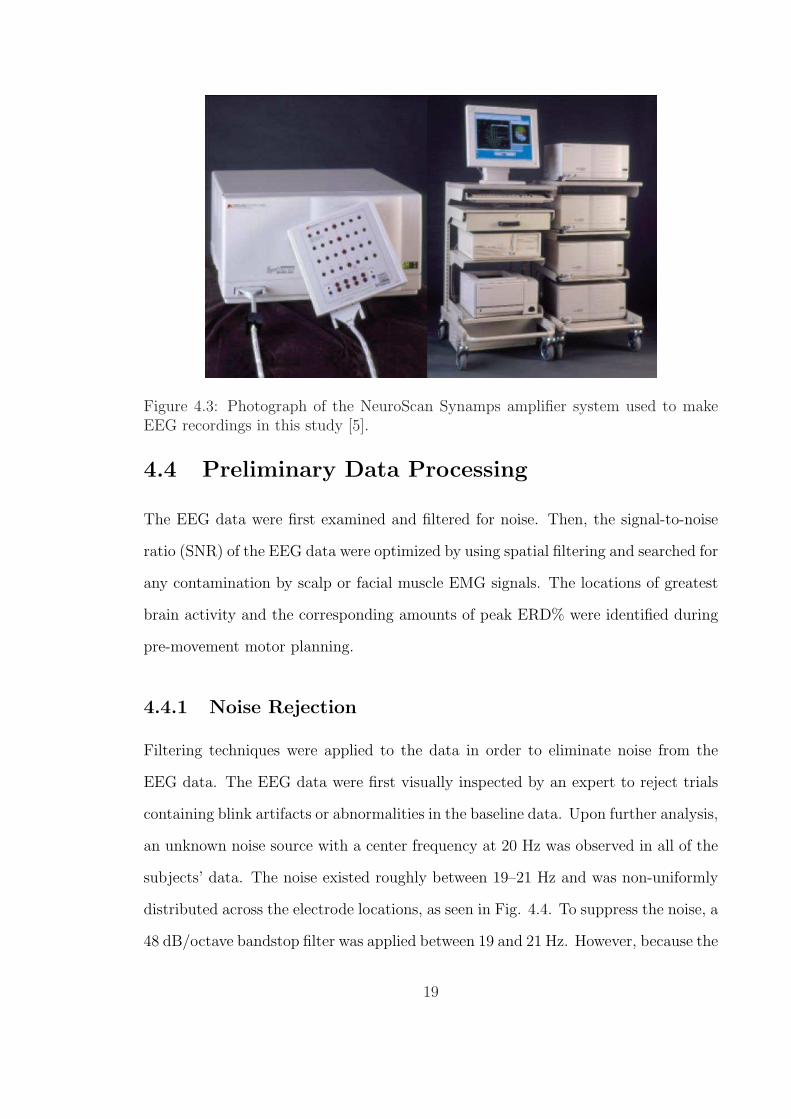
Figure 4.3: Photograph of the NeuroScan Synamps amplifier system used to makeEEG recordings in this study [5].
4.4 Preliminary Data Processing
The EEG data were first examined and filtered for noise. Then, the signal-to-noise
ratio (SNR) of the EEG data were optimized by using spatial filtering and searched for
any contamination by scalp or facial muscle EMG signals. The locations of greatest
brain activity and the corresponding amounts of peak ERD% were identified during
pre-movement motor planning.
4.4.1 Noise Rejection
Filtering techniques were applied to the data in order to eliminate noise from the
EEG data. The EEG data were first visually inspected by an expert to reject trials
containing blink artifacts or abnormalities in the baseline data. Upon further analysis,
an unknown noise source with a center frequency at 20 Hz was observed in all of the
subjects’ data. The noise existed roughly between 19–21 Hz and was non-uniformly
distributed across the electrode locations, as seen in Fig. 4.4. To suppress the noise, a
48 dB/octave bandstop filter was applied between 19 and 21 Hz. However, because the
19

beta band component of mu waves in normal adults are most active at approximately
20 Hz, the noise prevented accurate analysis of the beta band for cortical activity [9].
Therefore analysis was performed only on the alpha band for this study.
4.4.2 Spatial Filtering
Spatial filtering was performed to improve the signal-to-noise (SNR) ratio of the EEG
data being analyzed by removing any noise common to all of the electrodes. Using
NeuroScan Edit 4.3.1, a common average reference (CAR) was performed on all 64
electrodes in order to produce a ‘reference-free’ version of the EEG data. CAR was
chosen based on its superior SNR characteristics as reported in a study performed
by McFarland, which compared several spatial filtering techniques for improving the
SNR of EEG signals for BCI use and concluded that the CAR had the best SNR [26].
In the calculation of the CAR, the average value of all 64 electrodes was subtracted
from the channel of interest for each sample of data. Specifically, the formula for
CAR was
V CARi = V ER
i − 1
64
64∑j=1
V ERj (4.1)
where ViER is the potential between the ith electrode and the reference electrode.
The effect of the CAR spatial filter was that any noise common to all the electrodes
was reduced from the EEG data.
4.4.3 Scalp EMG Noise Detection and Rejection
EEG recording systems are sensitive to EMG signals produced by the scalp muscles, so
any trials affected by EMG signals were removed. Some of the stroke survivors exerted
considerable effort while attempting the motor task and there was a possibility that
their facial muscles were strained or teeth were clenched. These muscle contractions
20
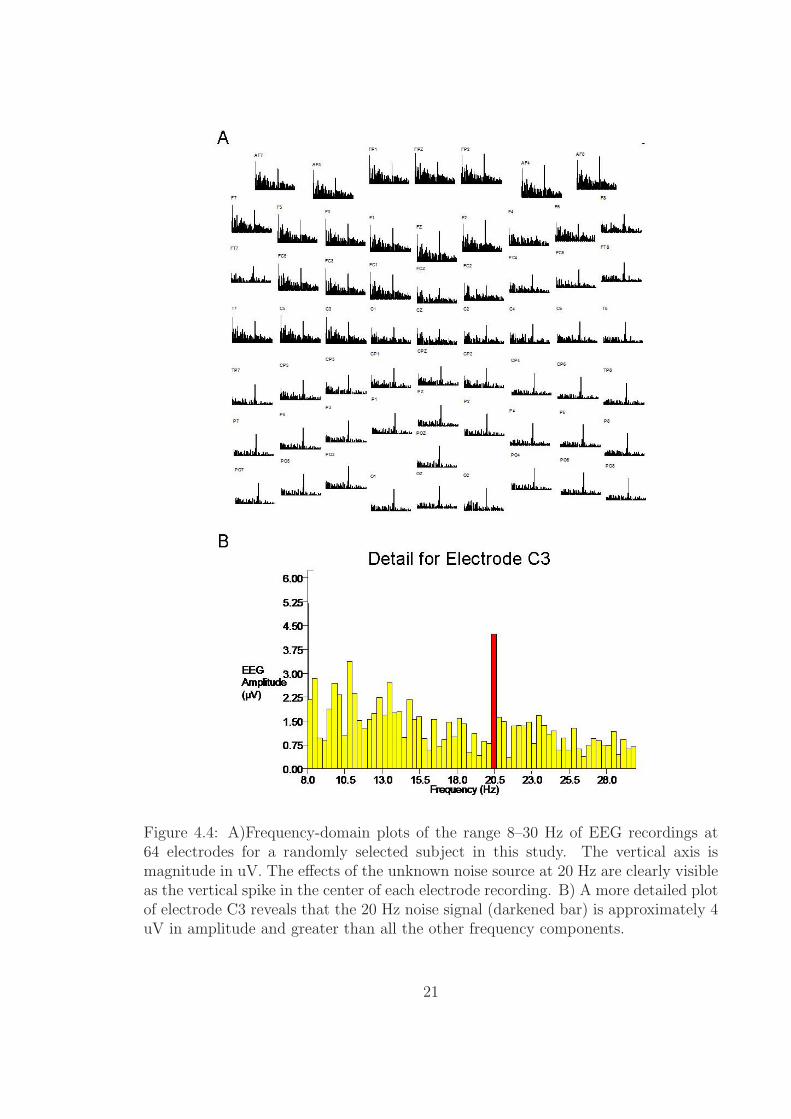
Figure 4.4: A)Frequency-domain plots of the range 8–30 Hz of EEG recordings at64 electrodes for a randomly selected subject in this study. The vertical axis ismagnitude in uV. The effects of the unknown noise source at 20 Hz are clearly visibleas the vertical spike in the center of each electrode recording. B) A more detailed plotof electrode C3 reveals that the 20 Hz noise signal (darkened bar) is approximately 4uV in amplitude and greater than all the other frequency components.
21

have the potential to introduce EMG activity that could be sensed by the EEG
electrodes and subsequently recorded along with cortical activity.
The following methods for EMG detection are largely based on the results of a
study by Goncharova on the characteristics of facial and scalp muscle EMG signals as
measured through EEG recording equipment [6]. The EMG detection and rejection
were performed for both the pre-movement planning interval and the rest interval
of each trial, because EMG noise in either interval would have affected the accuracy
of ERD calculations. The planning state was defined as the 3 s interval preceding
movement onset and the rest state was a separate 3 s interval preceding the planning
state. A time interval larger than that used by Goncharova [6] was used since stroke
survivors had longer motor planning intervals [20]. The procedures that were followed
for the EMG noise detection were consistent in all respects to Goncharova’s [6].
EMG from the frontalis and temporalis muscles can be a source of noise when
examining EEG signals because the range of frequencies spanned by EEG and EMG
overlap. Clinically relevant scalp EEG signals range from 0.1–100 Hz, but EMG
ranges from 0 to > 200 Hz [9]. The frontalis muscle (which moves the forehead skin
and eyebrows) shows maximum EMG activity from 20–30 Hz and the temporalis
muscles (which clench the teeth) have maximum EMG activity from 45–70 Hz. Even
with weak contractions, EMG data is detectable at the vertex of the scalp in the
8–12 Hz frequency band (exactly our frequencies of interest), so it was important to
reject any trial that might be contaminated with EMG signals from the frontalis or
temporalis muscles.
To determine whether a trial contained EMG noise, data were analyzed from four
electrode locations that were most susceptible to EMG contamination, which will be
referred to as the ‘primary’ electrodes for EMG rejection, as shown in Fig. 4.5. AF7
and AF8 were most affected by the frontalis muscles, and FT7 and FT8 were most
affected by the temporalis muscles. At these electrodes, the 45–70 Hz frequency band
22

Figure 4.5: Shaded electrodes were the locations where EMG from the scalp musclesshowed greatest activity when recorded from EEG electrodes. AF7 and AF8 wereaffected by the frontalis muscles, while FT7 and FT8 were affected by the temporalismuscles [6].
power was first computed in each trial because scalp muscle EMG exhibits peaks in
this frequency band, but EEG signals do not. The power was calculated using the
formula
Power45−70Hz =1
N2
70Nfs∑
k= 45Nfs
(|X(k)|2 + |X(N − k)|2) (4.2)
where N is the total number of samples in the rest or planning state and X(k) is the
kth FFT coefficient, and fs is the sampling frequency.
In any of the 50 trials, if the 45–70 Hz band power for a primary electrode exceeded
one standard deviation above the 50-trial mean for each respective electrode, then
five immediately adjacent electrodes were analyzed. The goal was to determine if the
45–70 Hz power value from the same trial at adjacent electrodes also exceeded the
mean plus one standard deviation. Finally, if three of the five adjacent electrodes
had power values that exceeded one standard deviation above the mean, then the
suspected trial was rejected from analysis.
For instance, if trial number 4 was suspected of having EMG noise during the
23
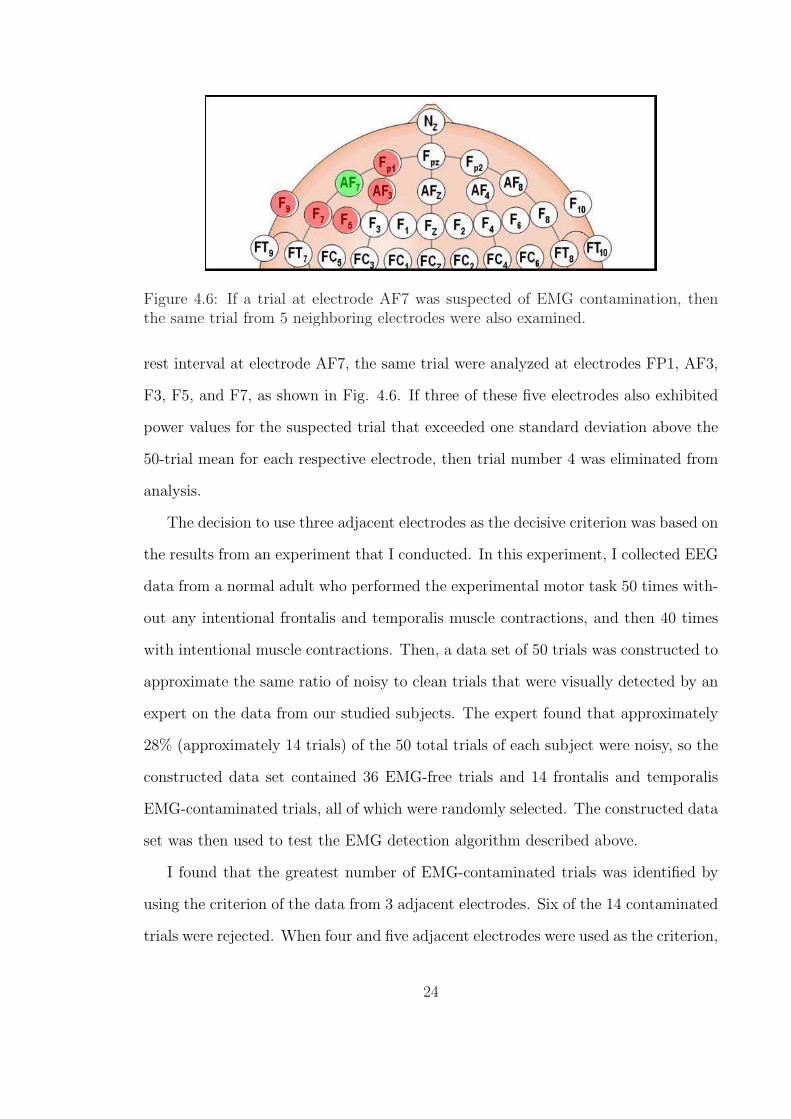
Figure 4.6: If a trial at electrode AF7 was suspected of EMG contamination, thenthe same trial from 5 neighboring electrodes were also examined.
rest interval at electrode AF7, the same trial were analyzed at electrodes FP1, AF3,
F3, F5, and F7, as shown in Fig. 4.6. If three of these five electrodes also exhibited
power values for the suspected trial that exceeded one standard deviation above the
50-trial mean for each respective electrode, then trial number 4 was eliminated from
analysis.
The decision to use three adjacent electrodes as the decisive criterion was based on
the results from an experiment that I conducted. In this experiment, I collected EEG
data from a normal adult who performed the experimental motor task 50 times with-
out any intentional frontalis and temporalis muscle contractions, and then 40 times
with intentional muscle contractions. Then, a data set of 50 trials was constructed to
approximate the same ratio of noisy to clean trials that were visually detected by an
expert on the data from our studied subjects. The expert found that approximately
28% (approximately 14 trials) of the 50 total trials of each subject were noisy, so the
constructed data set contained 36 EMG-free trials and 14 frontalis and temporalis
EMG-contaminated trials, all of which were randomly selected. The constructed data
set was then used to test the EMG detection algorithm described above.
I found that the greatest number of EMG-contaminated trials was identified by
using the criterion of the data from 3 adjacent electrodes. Six of the 14 contaminated
trials were rejected. When four and five adjacent electrodes were used as the criterion,
24

only 4 of the same 14 contaminated trials were detected. Therefore, the criterion of
using data from three adjacent electrodes was chosen.
Mean plus one standard deviation was selected as the optimal threshold in the
algorithm because I found that rejecting trials outside this threshold preserved roughly
85%of uncontaminated data, 20% of frontalis contaminated data, and 0% of frontalis
and temporalis contaminated data. This threshold was chosen because of its superior
performance compared to other threshold values that were evaluated.
4.4.4 ERD Data Processing
Event-related desynchronization in the alpha band mu waves was analyzed using
Matlab and Compumedics NeuroScan Edit 4.3.1 using procedures consistent with
existing literature [9]. First, the electrode with greatest alpha band pre-movement
activity was identified. Subsequently, the frequency component in the alpha band
with the greatest change in amplitude was identified as the mu frequency. Next, the
data were bandpass filtered at the mu frequency ± 1 Hz, all the accepted trials of data
were averaged, and the ERD percentage value was calculated for each sample of data.
Analysis of variance (ANOVA) models were then analyzed to make the following
comparisons according to the greatest amount of ERD: stroke versus control and
dominant versus non-dominant arm. Peak ERD was analyzed because the percentage
of ERD reflects the level of cortical activity [9].
The electrode with the greatest pre-movement planning activity was identified
by comparing the average power of a subject’s cortical rest (baseline) state to their
planning (active) state for the alpha band. For control subjects, the motor planning
state was defined as the period two seconds preceding movement onset while the rest
state was a two second interval that began five seconds before the active interval.
These time periods were selected in light of findings that ERD and MRCP share
common timing features [14] and that the mean sensorimotor MRCP onset time for
25

the control subjects used in this study occurred 1.466 ± 779 ms (roughly 2 s) before
movement onset [20]. For the stroke survivors in this study, however, Daly, et al.
found that the average sensorimotor MRCP start time (2.734 ± 1.205 ms) varied
much more than that of the control subjects. In light of this fact, the active state for
stroke subjects was defined as the time between the start of the MRCP and movement
onset [20]. This definition was based on actual EEG data and for this reason, was
potentially more accurate than the approximation methods used by others [6]. The
rest interval was chosen as an interval equal in length to the active interval and ended
3 s before the start of the active interval, as seen in Fig. 4.7.
Figure 4.7: Illustration of the cognitive rest and planning intervals identified for strokesubjects.
Matlab’s periodogram.m function was used to compute the power spectral density
(PSD) in the alpha band (8–12 Hz). The periodogram function uses the equation
Power8−12Hz =1
N2
12Nfs∑
k= 8Nfs
(|X(k)|2 + |X(N − k)|2) (4.3)
where N is the total number of samples in the rest or planning state and X(k) is
the kth FFT coefficient, and fs is the sampling frequency, which was 1000 Hz in this
study. The PSD for each of the 50 trials was computed and then averaged for each
26

subject. The level of activity at an electrode was computed by subtracting the rest
PSD from the active PSD and integrating the differences for the 8–12 Hz frequency
band. Fig. 4.8 shows an example of the difference between the PSD of the motor
planning and rest states. The electrode with the greatest difference in power was
identified as the one with peak activity. Electrodes over the sensorimotor frontal and
parietal cortices (FCZ, FC1–6, CZ, C1–6, CPZ, and CP1–6) were all analyzed for
peak activity.
Next, the individual frequency component at which activity peaked was identified
at the peak electrode locations. This was accomplished by finding the frequency in
the alpha band that exhibited the greatest change in amplitude between the cognitive
rest and active states. This is illustrated in Fig. 4.8.
Figure 4.8: The dashed line represents the power spectrum of motor planning stateEEG while the solid line represents the power spectrum of rest state EEG. The peakmu frequency was identified at the frequency where there is the greatest differencebetween the power spectrum values of the two states.
ERD% values were then calculated for the alpha band mu frequency ± 1 Hz
using the Event Related Band Power (ERBP) function in NeuroScan Edit 4.3.1. The
ERBP function computed ERD percentage using complex demodulation (CD), an
27

alternative to the classical methods described in the Background section.
Complex demodulation essentially treated the frequency of interest as a carrier
wave and preserved only the amplitude variations of that frequency by producing a
shifted and filtered version of the original signal centered at the frequency of interest
[27]. As an elaboration, it can be assumed a times series signal Xt contains a compo-
nent xt that varies in amplitude around a frequency f0. The signal can be expressed
as
Xt = xt + zt = At cos (f0t + φt) + zt =At
2(ejf0t+φt + e−jf0t+φt) + zt (4.4)
where At and φt are the changes of amplitude and phase of the frequency of interest
f0, and zt represents all other frequency components in Xt. The first step of the CD
algorithm is to multiply Xt by a complex exponential at f0, which results in
Yt = Xte−jf0t =
At
2ejf0t+φt +
At
2e−jf0t+φt + zte
−jf0t (4.5)
The first term on the right hand side of the equation in Fig. 4.5 contains the
amplitude and phase variations at the frequency of interest and can be separated
from the rest of Yt by low pass filtering to obtain
yt =At
2e−jf0t+φt ⇒ At = 2|yt| (4.6)
Once At was computed, a reference interval was identified and the average amplitude
over that interval Aref was used in the ERD equation
ERD%decrease = 100× Aref − Ax
Aref
(4.7)
ERD was computed for each sample of data Ax in a trial. Complex demodulation was
performed on each trial of data and the data from all trials were averaged together
to form one ERD time-series dataset for each subject, as shown in Fig. 4.9. Finally,
28
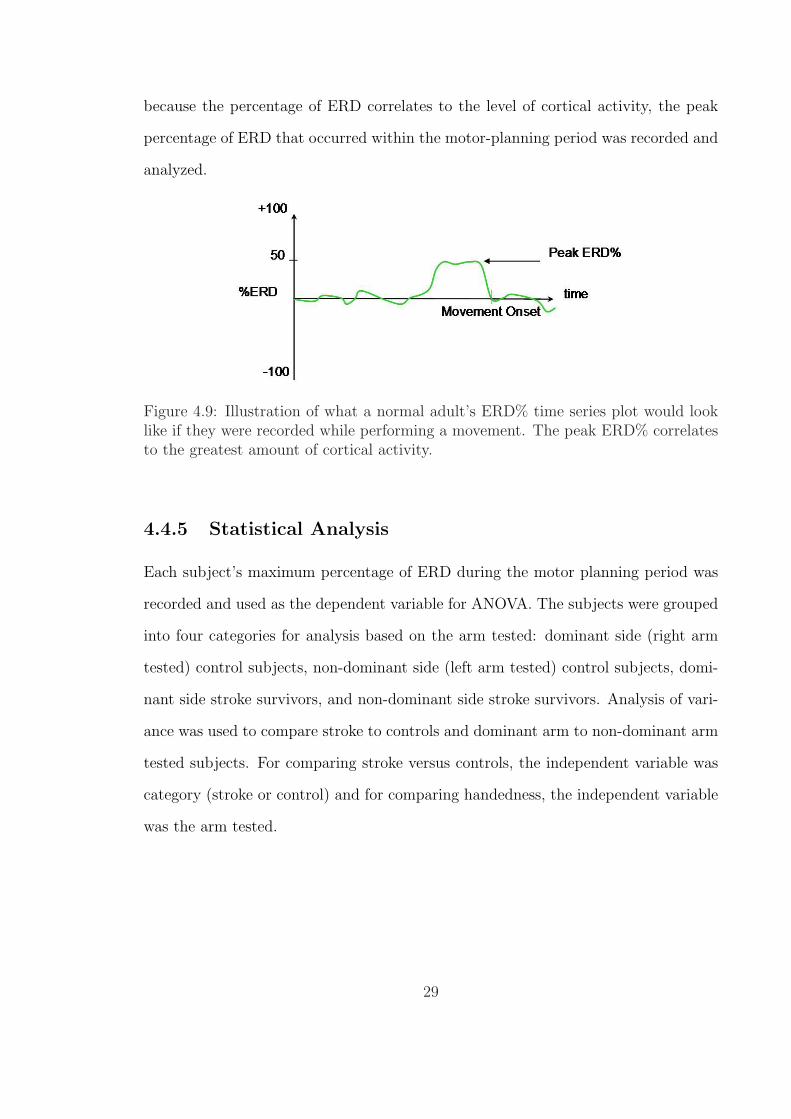
because the percentage of ERD correlates to the level of cortical activity, the peak
percentage of ERD that occurred within the motor-planning period was recorded and
analyzed.
Figure 4.9: Illustration of what a normal adult’s ERD% time series plot would looklike if they were recorded while performing a movement. The peak ERD% correlatesto the greatest amount of cortical activity.
4.4.5 Statistical Analysis
Each subject’s maximum percentage of ERD during the motor planning period was
recorded and used as the dependent variable for ANOVA. The subjects were grouped
into four categories for analysis based on the arm tested: dominant side (right arm
tested) control subjects, non-dominant side (left arm tested) control subjects, domi-
nant side stroke survivors, and non-dominant side stroke survivors. Analysis of vari-
ance was used to compare stroke to controls and dominant arm to non-dominant arm
tested subjects. For comparing stroke versus controls, the independent variable was
category (stroke or control) and for comparing handedness, the independent variable
was the arm tested.
29

Chapter 5
Results
The Results section will follow the same order as the ERD signal analysis procedures
I described in the methods section. The first section reports the electrode locations
where the most pre-movement brain activity occurred. The second section identifies
the frequencies at which the greatest brain activity occurred. The third reports the
ERD characteristics observed in the subjects.
5.1 Identification of Brain Region With Greatest
Activity
5.1.1 Dominant Arm Control Subjects (Right-Arm Tested)
Of the four subjects in this category, all but subject number 4 had the most active
electrode on either the working side (odd numbered electrodes) or at medial locations
of the brain (CZ and CPZ) (5.1). It is unknown why subject number 4 did not follow
this trend and exhibited the greatest activity on the non-working side of the brain
(even numbered electrodes) at electrode C6. Subject numbers 1 and 2 had peak
activity at working side CPZ and CP5 electrode locations, respectively, and subject
number 8 had peak activity at C5. The peak activity at CP electrodes is expected in
30

normal adults [9]. C5 is not expected to have peak activity due to motor tasks, but
since C5 is on the working side of the brain, it is possible for activity to peak there
and subject 8 cannot be considered an outlier.
Table 5.1: Right Arm Tested Control SubjectsSubject Peak Electrode Alpha Band Power Difference (uV2)
1. CPZ 2.752. CP5 2.174. C6 3.088. C5 4.05
Table 5.2: Left Arm Tested Control SubjectsSubject Peak Electrode Alpha Band Power Difference (uV2)
3. CP2 104.706. FC5 5.207. CP6 26.22
These tables report the control subject electrode locations with the greatest differencein alpha band power for the rest versus motor-planning intervals and the difference val-ues for subjects tested with their dominant (right) arm (Table 5.1) and non-dominant(left) arm (Table 5.2).
5.1.2 Non-dominant Arm Control Subjects (Left-Arm Tested)
There were three subjects in this category. Two of them, subject numbers 3 and 7,
had peak activity on the working side at CP2 and CP6, respectively. However, one,
subject number 6, had peak activity on the non-working side at FC5 (Table 5.2).
5.1.3 Dominant Arm Stroke Subjects (Right-Arm Tested)
Table 5.3 shows the six post-stroke subjects in this category. Three of them (subject
numbers 10, 18, and 19) had the most active electrodes on the non-working side of
the brain, while the remaining three showed the most activity on either the working
side or center of the brain. The locations of the most active electrodes for all six
31

subjects were C or FC electrodes. C electrodes were the most active electrodes for
three subjects, and FP electrodes were the most active for two subjects.
Table 5.3: Right Arm Tested Stroke SurvivorsSubject Peak Electrode Alpha Band Power Difference (uV2)
10. C6 11.4212. FC1 15.2916. FC6 3.0818. CZ 4.0519. C6 5.1220. FC5 49.37
Table 5.4: Left Arm Tested Stroke SurvivorsSubject Peak Electrode Alpha Band Power Difference (uV2)
9. CP3 11.1711. FC5 1.7413. CP5 1.7714. FC5 284.4517. FC6 7.87
For right-arm tested stroke survivors (Table 5.3) and left-arm tested stroke survivors(Table 5.4), the tables contain the electrode locations with the greatest difference inalpha band power for the rest versus motor-planning intervals and the correspondingdifference values.
5.1.4 Non-dominant Arm Stroke Subjects (Left-Arm Tested)
Five subjects were in this category and four of them had the most active electrode
on the non-working side. As seen in Table 5.4, subject number 13 was the only one
in this group who had the most active C or CP electrode on the working side of the
brain. All of the left hand tested stroke subjects showed FC and CP electrodes as
the most active; two of them had the most activity at CP electrodes and three at FC
electrodes.
32
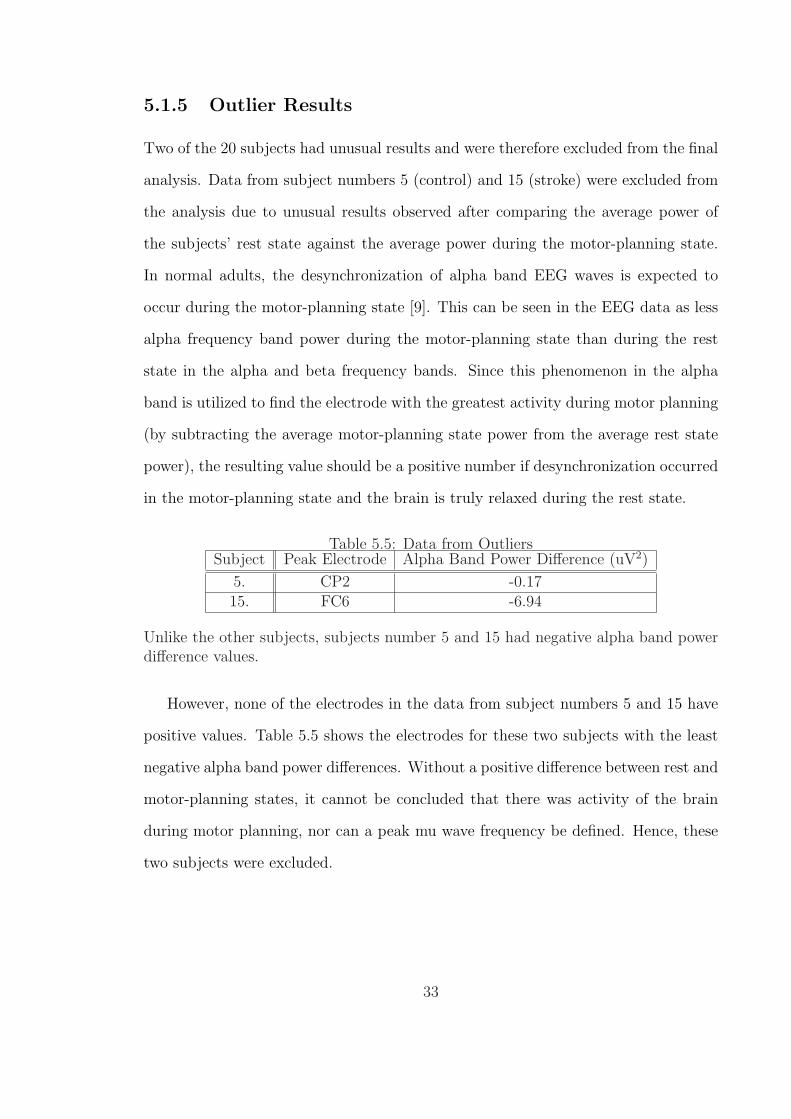
5.1.5 Outlier Results
Two of the 20 subjects had unusual results and were therefore excluded from the final
analysis. Data from subject numbers 5 (control) and 15 (stroke) were excluded from
the analysis due to unusual results observed after comparing the average power of
the subjects’ rest state against the average power during the motor-planning state.
In normal adults, the desynchronization of alpha band EEG waves is expected to
occur during the motor-planning state [9]. This can be seen in the EEG data as less
alpha frequency band power during the motor-planning state than during the rest
state in the alpha and beta frequency bands. Since this phenomenon in the alpha
band is utilized to find the electrode with the greatest activity during motor planning
(by subtracting the average motor-planning state power from the average rest state
power), the resulting value should be a positive number if desynchronization occurred
in the motor-planning state and the brain is truly relaxed during the rest state.
Table 5.5: Data from OutliersSubject Peak Electrode Alpha Band Power Difference (uV2)
5. CP2 -0.1715. FC6 -6.94
Unlike the other subjects, subjects number 5 and 15 had negative alpha band powerdifference values.
However, none of the electrodes in the data from subject numbers 5 and 15 have
positive values. Table 5.5 shows the electrodes for these two subjects with the least
negative alpha band power differences. Without a positive difference between rest and
motor-planning states, it cannot be concluded that there was activity of the brain
during motor planning, nor can a peak mu wave frequency be defined. Hence, these
two subjects were excluded.
33

5.2 Identification of Frequency with Greatest Brain
Activity
The mu frequency is defined as the frequency at which there is the greatest difference
in rest versus pre-movement power. In normal adults, a mu frequency of around 10
Hz is expected [9].
5.2.1 Dominant Arm Control Subjects (Right-Arm Tested)
As seen in Table 5.6, within the alpha band, the highest mu frequency detected was
10 Hz and the lowest was 8 Hz. The mean mu frequency for this group was 9.13 (±1.3) Hz.
Table 5.6: Right Arm Tested ControlsSubject Mu Frequency (Hz)
1. 8.52. 10.04. 8.08. 10.0
Mean 9.1Std. Dev. 1.3
Table 5.7: Left Arm Tested ControlsSubject Mu Frequency (Hz)
3. 9.06. 8.07. 10.4
Mean 9.1Std. Dev. 1.2
Frequencies at which there is greatest pre-motor planning activity for right-arm testedcontrol subjects (Table 5.6) and for left-arm tested control subjects (Table 5.7).
34

5.2.2 Non-Dominant Arm Control Subjects (Left-Arm Tested)
As seen in Table 5.7, the highest mu frequency detected was 10.4 Hz and the lowest
was 8 Hz. The mean mu frequency for this group was also 9.13 (± 1.2) Hz.
5.2.3 Dominant Arm Stroke Survivors (Right-Arm Tested)
From Table 5.8, the highest mu frequency detected was 11.4 Hz and the lowest was 8
Hz. The mean mu frequency for this group was 8.9 (± 1.3) Hz.
Table 5.8: Right Arm Tested Stroke SurvivorsSubject Mu Frequency (Hz)
10. 11.412. 8.216. 8.018. 8.519. 9.020. 8.5
Mean 8.9Std. Dev. 1.3
Table 5.9: Left Arm Tested Stroke SurvivorsSubject Mu Frequency (Hz)
9. 11.211. 9.513. 9.714. 8.017. 8.2
Mean 9.3Std. Dev. 1.3
Frequencies at which there is greatest pre-motor planning activity for right-arm testedcontrol subjects (Table 5.8) and for left-arm tested control subjects (Table 5.9).
5.2.4 Non-dominant Arm Stroke Survivors (Left-Arm Tested)
From Table 5.9, the highest mu frequency detected was 11.2 Hz and the lowest was 8
Hz. The mean mu frequency for this group was 9.3 (± 1.3) Hz.
35

Both control and stroke subjects had average peak mu frequencies of approxi-
mately 9 (± 1.3) Hz, which is consistent with normal adults according to literature
[9]. Since the individual mu frequencies can vary from 8 to 12 Hz, these results were
within the expected norms.
5.3 Peak ERD% at the Mu Frequency
The peak ERD percentage at the mu frequency was determined by examining the
times-series ERD data and finding the maximum ERD value in the interval of time
between the onset of the MRCP and movement onset. Because the onset of the MRCP
reflects the start of motor planning and the timing of ERD and MRCP coincide, the
EEG desynchronization occurring in this time interval reflected cortical activity most
relevant to motor planning of the motor task [14].
5.3.1 Control Subjects
The mean peak ERD value for right arm tested controls was 59.7 (± 10.5 standard
deviation)% and the range was 41.4–71%. For left arm tested controls, the mean peak
ERD was 96.7 (± 7.7)% with a range of 81.9–96.7%. These results showed that the
ranges of the left and right arm tested controls do not overlap and the ANOVA model
of the values in Table 5.10 and 5.11 confirmed that they were significantly different
(p = 0.008). The difference can be seen in Figure 5.1.
5.3.2 Stroke Survivors
From Table 5.12, right arm tested stroke subjects had a mean peak ERD of 46.4
(± 11)% and a range of 42.8–64.8%. From Table 5.13 shows that left arm tested
stroke subjects had a mean peak ERD of 66.4 (± 12.3)% with a range of 52.2–80.1%.
ANOVA model analysis revealed a statistically significant difference between the left
36
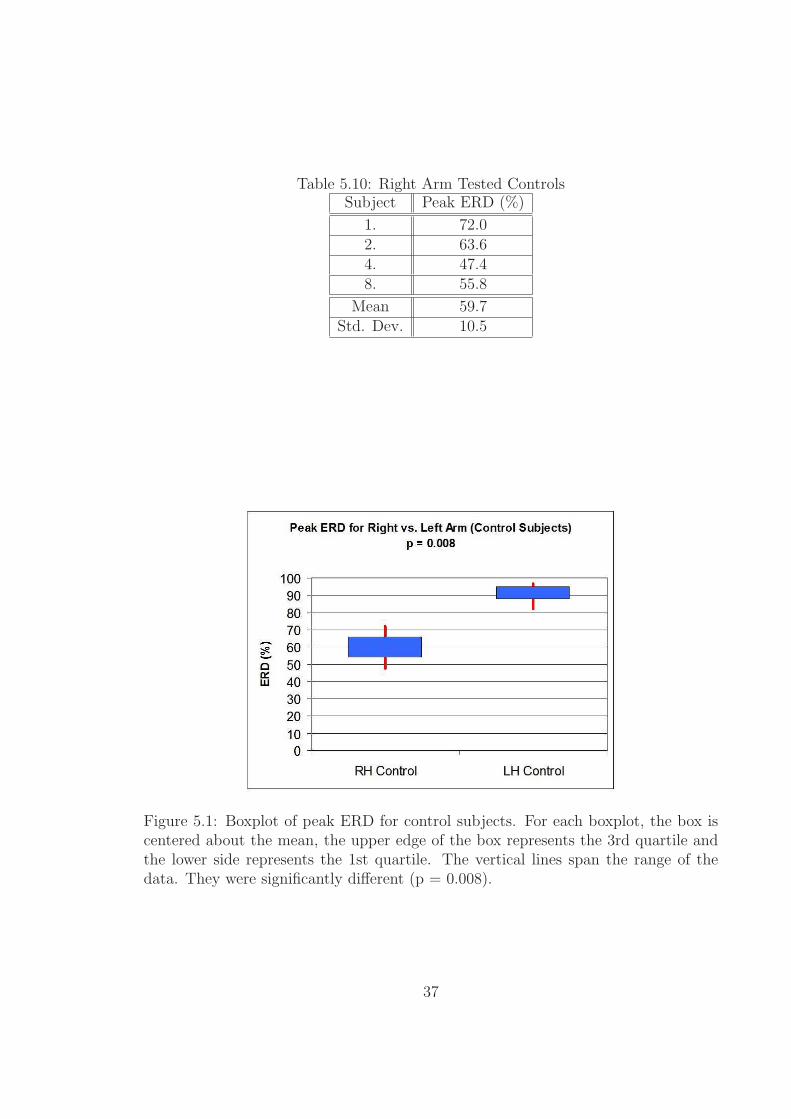
Table 5.10: Right Arm Tested ControlsSubject Peak ERD (%)
1. 72.02. 63.64. 47.48. 55.8
Mean 59.7Std. Dev. 10.5
Figure 5.1: Boxplot of peak ERD for control subjects. For each boxplot, the box iscentered about the mean, the upper edge of the box represents the 3rd quartile andthe lower side represents the 1st quartile. The vertical lines span the range of thedata. They were significantly different (p = 0.008).
37

and right arm tested stroke survivors (p = 0.01). Fig. 5.2 illustrates the difference
between these two groups.
Table 5.11: Left Arm Tested ControlsSubject Peak ERD (%)
3. 96.76. 81.97. 93.2
Mean 90.6Std. Dev. 7.7
Figure 5.2: Boxplot of peak ERD for stroke survivors. a statistically significantdifference between the left and right arm tested stroke survivors (p = 0.01).
5.3.3 Controls vs. Stroke Survivors (Right-Arm Tested)
Next, the right-arm tested controls and right-arm tested stroke survivors were com-
pared. An ANOVA model on the values shown in Table 5.10 and Table 5.12 revealed
that the controls and stroke survivors were not significantly different (p = 0.09).
However, a statistical power analysis was performed and showed that a significant
38

difference (alpha = 0.05, p < 0.05) could have been detected if there had been a total
of 30 dominant arm subjects. Fig. 5.3 illustrates the data for these two groups.
Table 5.12: Right Arm Tested Stroke SurvivorsSubject Peak ERD (%)
10. 45.112. 30.616. 48.118. 47.119. 64.820. 42.8
Mean 46.4Std. Dev. 11.0
Figure 5.3: Boxplot of peak ERD for right-arm tested subjects. Controls and strokesurvivors were not significantly different (p = 0.09).
5.3.4 Controls vs. Stroke Survivors (Left-Arm Tested)
An ANOVA model on the values shown in Table 5.13 and Table 5.11 revealed that the
left-arm tested stroke survivors had significantly less peak ERD versus the left-arm
tested control subjects (p = 0.023). Fig. 5.4 illustrates the data for these two groups.
39

Table 5.13: Left Arm Tested Stroke SurvivorsSubject Peak ERD (%)
9. 57.511. 52.213. 77.814. 80.117. 64.2
Mean 66.4Std. Dev. 12.3
Figure 5.4: Boxplot of peak ERD for left-arm tested subjects. Left-arm tested strokesurvivors had significantly less peak ERD versus the left-arm tested control subjects(p = 0.023).
5.3.5 All Stroke Survivors vs. All Control Subjects
An ANOVA model was analyzed on a group consisting of all 7 healthy subjects (both
left and right-arm tested) and a group consisting of all 11 stroke survivors (both
left and right-arm tested). From Table 5.14, the mean peak ERD% for all control
subjects was 72.9 (± 18.7)% and 55.5 (± 15.1) % for all stroke survivors. There was a
statistically significant difference between the control and stroke groups (p = 0.002).
Fig. 5.5 illustrates this difference.
40

Table 5.14: Comparison of all Subjects by CategoryAll Control Subjects All Stroke Survivors
Mean Peak ERD%: 72.9 Mean Peak ERD%: 55.5Standard Deviation: 18.7 Standard Deviation: 15.1
The peak ERD averages for a group consisting of all the control subjects and a groupconsisting of all the stroke subjects, regardless of the arm tested.
Figure 5.5: Boxplot of peak ERD for right-arm tested subjects. There was a statis-tically significant difference between the control and stroke groups (p = 0.002).
41

Chapter 6
Discussion
This section reviews the main findings of the study with regard to existing literature,
covers the extensions to literature and discusses some limitations of the study. Finally,
future study directions are discussed.
6.1 Extensions to Literature
The main findings from this study extend the literature in two ways: first in the
effects of handedness on shoulder-elbow movement planning and second, in the effects
of stroke on shoulder-elbow movement planning.
There was a statistically significant difference in the peak ERD% of control versus
stroke subjects (p = 0.002). Also, for both stroke survivors and healthy controls,
there was a statistically significant difference in the peak ERD% between those who
used their dominant versus non-dominant arms (p = 0.008 for controls and p = 0.02
for stroke survivors).
This finding extended the literature regarding the effects of hand dominance on
pre-movement brain activity. These results are consistent with the findings of others
who studied finger motions in healthy controls. Prior studies showed that there was
more pre-movement cortical activity in healthy adults for non-dominant hand finger
42
movements versus the dominant hand [13], [24], and [21]. Specifically, Stancak [24]
and Bai [21] both found that ERD occured at significantly higher percentages for
healthy adults moving fingers on the non-dominant hand versus the dominant hand.
In the current study, the effect of hand dominance on ERD% during shoulder-
elbow movement was consistent with literature for both control and stroke subjects on
finger movements, showing significantly higher peak ERD% when the non-dominant
arm was tested versus the dominant arm (p < 0.05). This observation showed that
handedness significantly influenced pre-movement brain activity for arm motion in
stroke survivors and highlights hand-dominance as an important dependent variable
in the design of future experiments on stroke survivors.
6.2 Limitations
This study was limited by noise and EEG data acquisition methods. Even though
measures were taken to electrically isolate the EEG recording system, the data from
all subjects in this study was affected by an unknown noise source that introduced
signals ranging from 19–21 Hz into all channels of the EEG data record. This noise
prevented the accurate analysis of beta frequency mu waves, which are also known to
reflect pre-movement cortical activity.
Also, no eye blink detection electrodes were used for the data collections so blink
contaminated data was rejected by visual inspection. Finally, the detection of facial
and scalp muscle EMG contamination of the EEG data was made difficult because
all EEG data beyond 40 Hz was filtered out by the amplifier settings. EMG in the
scalp and facial muscles can peak anywhere in the range of 45–70 Hz, so it would be
most beneficial for EMG detection if frequencies below 70 Hz are not filter out.
43

6.3 Conclusion
The peak ERD% of stroke survivors was significantly lower than that of healthy
subjects. Also, subjects who used the non-dominant arm had significantly greater
ERD% than those who used their dominant arm.
6.4 Future Work
Because of the limitations of this study, the beta band component of mu waves could
not be studied, but it is known to exhibit ERD during pre-motor cortical planning
in the hand movements of healthy adults and in stroke survivors [9], [8]. Therefore,
an investigation into the behavior of beta band mu wave pre-movement ERD is one
area of future study. In addition to mu waves, high-frequency EEG waves are also
known to reflect cortical activity, but have yet to be studied in stroke survivors.
A study on monkeys by Heldman has reported that waves of frequencies ranging
from 31–200 Hz (high frequency waves) contained signal characteristics that can be
used to predict arm velocities during a circle drawing task (high frequency waves
were not studied in this thesis because amplifier filters were set to cutoff frequencies
above 40 Hz) [28] . Heldman’s study used intracortical electrodes, which have much
higher frequency resolution than scalp-mounted electrodes, but scalp electrodes are
routinely used to study frequencies up to 100 Hz and even higher-frequency recordings
are recommended by the emerging Full-band EEG (FbEEG) recording standard [9],
[29]. Investigations of high-frequency EEG characteristics in stroke survivors do not
exist in literature, but this is an area of future study that can potentially provide
important findings.
Also, by virtue of the experimental paradigm, our study did not produce measures
directly comparable to conventional BCI measures (which correlate brain rhythm
control to target accuracy). Therefore, additional work needs to be performed to
44

directly relate the current study to BCI applications.
45

Bibliography
[1] Interactive Motion Technologies Inc., “Interactive motion technologies productdescription pamphlet,” Cambridge, MA, 2004.
[2] “Images for Physcology 220,” University of Virginia, August 2005. [Online].Available: http://cti.itc.virginia.edu/ psyc220/
[3] J. Malmivuo and R. Plonsey, Bioelectromagnetism, 1st ed. New York, NewYork: Oxford University Press, 1995.
[4] G. Pfurtshceller and L. H. Lopes da Silva, “Event-related EEG/MEG synchro-nization and desynchronization: basic principles,” Clinical Neurophysiology, vol.110, pp. 1842–1857, November 1999.
[5] Compumedics Neuroscan Inc., “Compumedics neuroscan synamps brochure,”2005.
[6] I. I. Goncharova, D. J. McFarland, T. M. Vaughan, and J. R. Wolpaw, “EMGcontamination of EEG: spectral and topographical characteristics,” Clinical Neu-rophysiology, vol. 114, pp. 1580–1593, March 2003.
[7] J. Wolpaw, N. Birbaumer, D. J. McFarland, G. Pfurtscheller, and T. M. Vaughan,“Brain-computer interfaces for communication and control,” Clinical Neurophys-iology, vol. 113, pp. 767–791, June 2002.
[8] T. Platz, I. H. Kim, H. Pintschovius, T. Winter, A. Kieselbach, K. Villringer,K. R., and K. Mauritz, “Multimodal EEG analysis in man suggests impairment-specific changes in movement-related electric brain activity after stroke,” Brain,vol. 123, pp. 2475–2490, December 2000.
[9] E. Niedermeyer and L. H. Lopes da Silva, Electroencephalography: Basic Princi-ples, Clinical Applications, and Related Fields, 4th ed. Baltimore, MD: Williamsand Wilkins, 1999.
[10] J. Bogousslaysky and L. R. Caplan, Stroke Syndromes, 2nd ed. Cambridge, NY:Cambridge University Press, 2001.
[11] A. J. Stancak and G. Pfurtscheller, “Event-related desynchronisation of centralbeta-rhythms during brisk and slow self-paced finger movements of dominant
46

and nondominant hand,” Brain Research: Cognitive Brain Research, vol. 4, pp.171–183, October 1996.
[12] W. S. Newman, November 2005, personal communication.
[13] I. M. Tarkka and M. Hallet, “Cortical topography of premotor and motor poten-tials preceding self-paced, voluntary movement of dominant and non-dominanthands,” Electroencephalography and Clinical Neurophysiology, vol. 75, pp. 36–43,February 1990.
[14] C. Toro, G. Deuschl, R. Thatcher, S. Sato, C. Kufta, and M. Hallet, “Event-related desynchronization and movement-related cortical potentials on the ECoGand EEG,” Electroencephalography and Clinical Neurophysiology, vol. 93, pp.380–389, October 1994.
[15] J. Wolpaw, D. J. McFarland, G. W. Neat, and C. A. Forneris, “An EEG-basedbrain-computer interface for cursor control,” Electroencephalography and ClinicalNeurophysiology, vol. 78, pp. 252–259, March 1991.
[16] J. Wolpaw and D. J. McFarland, “Control of a two-dimensional movement sig-nal by a noninvasive brain-computer interface in humans,” Proceedings of theNational Academy of Sciences, vol. 101, pp. 17 849–17 854, December 2004.
[17] L. Sterns, P. Asselman, A. Pogosyan, C. Loukas, A. J. Thompson, and P. Brown,“Corticocortical coupling in chronic stroke: its relevance to recovery,” Electroen-cephalography and Clinical Neurophysiology, vol. 63, pp. 475–484, August 2004.
[18] R. Riener, T. Nef, and G. Colombo, “Robot-aided neurorehabilitation of theupper extremities,” Medical and Biological Engineering and Computing, vol. 43,pp. 2–10, January 2005.
[19] P. S. Lum, C. G. Burgar, P. C. Shore, M. Majmundar, and M. Van der Loos,“Robot-assisted movement training compared with conventional therapy tech-niques for the rehabilitation of upper-limb motor function after stroke,” Archivesof Physical Medicine and Rehabilitation, vol. 83, pp. 952–959, June 2002.
[20] J. J. Daly, Y. Fang, E. M. Perepezko, V. Siemionow, and G. Yue, “Prolonged cog-nitive planning time, elevated cognitive effort, and relationship to coordinationand motor control following stroke,” 2004, abstract submitted for review.
[21] O. Bai, Z. Mari, S. Vorbach, and M. Hallett, “Asymmetric spatiotemporal pat-terns of event-related desynchronization preceding voluntary sequential fingermovements: a high-resolution eeg study,” Clinical Neurophysiology, vol. 116, pp.1213–1221, March 2005.
[22] E. Labyt, W. Szurhaj, J.-L. Bourriez, F. Cassim, L. Defebvre, A. Destee, J. D.Guieu, and P. Derambure, “Changes in oscillatory cortical activity related to avisuomotor task in young and elderly healthy subjects,” Clinical Neurophysiol-ogy, vol. 114, pp. 1580–1593, March 2003.
47

[23] G. R. Muller-Putz, R. Scherer, G. Pfurtscheller, and R. Rupp, “EEG-basedneuroprosthesis control: a step towards clinical practice,” Neuroscience Letters,vol. 382, pp. 169–174, April 2005.
[24] A. J. Stancak and G. Pfurtscheller, “The effects of handedness and type of move-ment on the contralateral preponderance of mu-rhythm desynchronisation,” Elec-troencephalography and Clinical Neurophysiology, vol. 99, pp. 174–182, August1996.
[25] H. H. Jasper, “Report of the committee on methods of clinical examination inelectroencephalography,” Electroencephalography and Clinical Neurophysiology.,vol. 10, pp. 370–375, 1958.
[26] D. J. McFarland, L. M. McCane, S. V. David, and J. R. Wolpaw, “Spatial filterselection for EEG-based communication,” Electroencephalography and ClinicalNeurophysiology., vol. 103, pp. 386–394, September 1997.
[27] R. Draganova and D. Popivanov, “Assessment of EEG frequency dynamics usingcomplex demodulation.” Physiological Research, vol. 48, pp. 157–165, Setptember1999.
[28] D. A. heldman, W. Wang, S. S. Chan, and D. W. Moran, “Local field poten-tial spectral tuning in motor cortex during reaching and drawing movements,”Society for Neuroscience Abstracts, October 2004, presented in San Diego, CAOctober 23-27.
[29] S. Vanhatalo, J. Voipio, and K. Kaila, “Full-band EEG (FbEEG): an emergingstandard in electroencephalography,” Clinical Neurophysiology, vol. 116, pp. 1–8,January 2004.
48
Recommended


![Desynchronization and sustainability of noisy ... · arXiv:q-bio/0701032v1 [q-bio.PE] 20 Jan 2007 Desynchronization and sustainability of noisy metapopulation cycles Refael Abta1,](https://img.pdfslide.net/doc/110x75/5e6b40e71bafa44ca0602752/desynchronization-and-sustainability-of-noisy-arxivq-bio0701032v1-q-biope.jpg)