La
st M
od
ifie
d: 7
De
c 2
00
6
12
:23
P
M
7 December 2006
ASSET MANAGEMENT
LECTURE III
An Introduction to Security Valuation
Asse
t M
an
ag
em
en
t, le
ctu
re II
I

2
Investment decision and the valuation process
• Two steps of the investment decision process
─ Determine the required rate of return
• Evaluate the investment to determine if its market price is consistent with your required rate of return
• Estimate the value of the security based on its expected cash flows and your required rate of return
─ Compare this intrinsic value to the market price to decide if you want to buy it
• Two approaches to valuation. The difference between the two approaches is the perceived importance of economic and industry influence on individual securities
─ Top-down, three-step approach
─ Bottom-up, stock valuation, stock picking type approach
Reference: BROWN & REILLY, Chapter XI
Asse
t M
an
ag
em
en
t, le
ctu
re II
I

3
The top down, three steps approach
• Top down, three steps approach
─ General economic influences. Decide how to allocate investment funds among countries, and within countries to bonds, stocks, and cash
─ Industry influences. Determine which industries will prosper and which industries will suffer on a global basis and within countries
─ Company analysis. Determine which companies in the selected industries will prosper and which stocks are undervalued
• Studies indicate that most changes in an individual firm’s earnings can be attributed to changes in
aggregate corporate earnings and changes in the firm’s industry
• Studies have found a relationship between aggregate stock prices and various economic series such as
employment, income, or production
• An analysis of the relationship between rates of return for the aggregate stock market, alternative industries,
and individual stocks showed that most of the changes in rates of return for individual stock could be
explained by changes in the rates of return for the aggregate stock market and the stock’s industry
Reference: BROWN & REILLY, Chapter XI
4
Theory of valuation
• The value of an asset is the present value of its expected returns. You expect an asset to provide a stream of returns while you own it
• To convert this stream of returns to a value for the security, you must discount this stream at your required rate of return. This requires estimates of the stream of expected returns and the required rate of return on the investment
• Form of returns: earnings, cash flows, dividends, interest payments, capital gains (increases in value). The time pattern and growth rate of returns are also important
• As you already know, the required rate of return is made up of three components
─ The risk-free rate of return
─ The expected rate of inflation during the holding period
─ The risk premium determined by the uncertainty of returns
• Valuation of bonds is relatively easy because the size and time pattern of cash flows from the bond over its life are known
Reference: BROWN & REILLY, Chapter XI
5
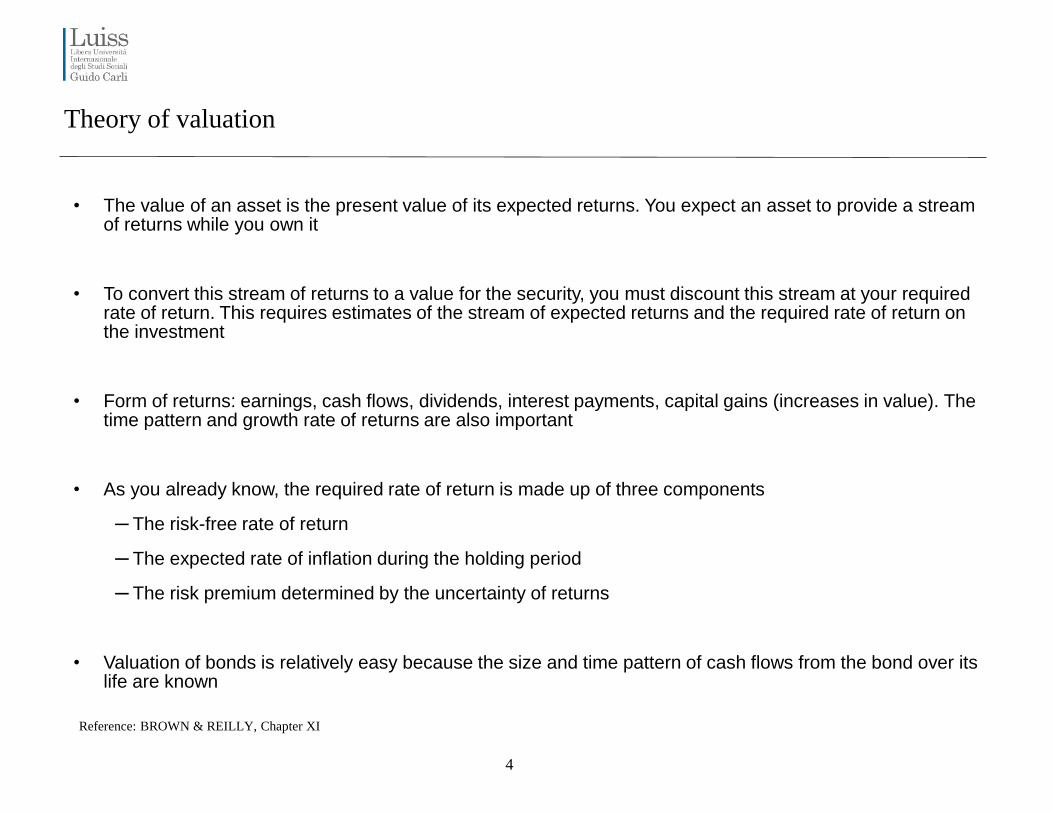
Risk free rate …Bloomberg bond valuation screen
6
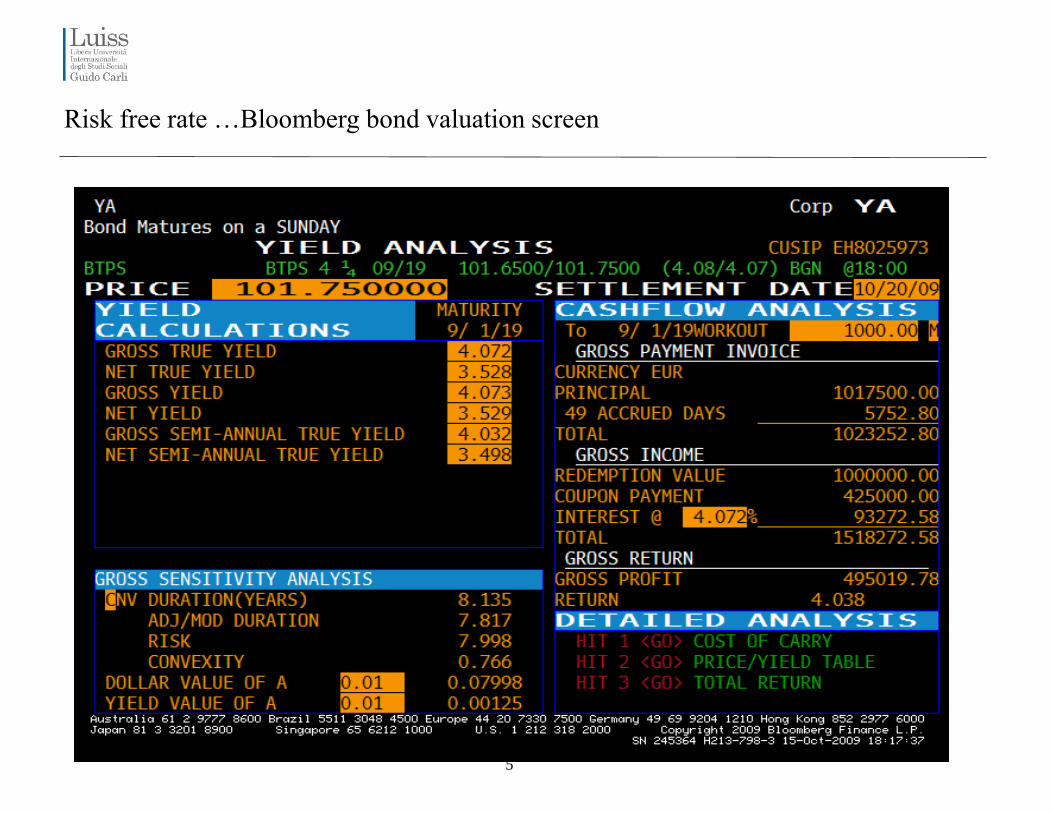
Risk free rate…Bloomberg Yield Curve

7
Lessons from Peter Lynch (Fidelity Investments) and Warren Buffet (Berkshire
Hathaway)…before looking at the numbers !
• Peter Lynch is a veteran Wall Street stock investor who managed the legendary Fidelity Magellan fund from 1977 to 1990. Warren Buffett needs no introduction
• Favorable attributes of firms according to Peter Lynch
─ Firm’s product should not be faddish
─ Firm should have some long-run comparative advantage over its rivals
─ Firm’s industry or product has market stability
─ Firm can benefit from cost reductions
─ Firms that buy back shares show there are putting money into the firm
• Warren Buffet’s four classes of tenets
─ Business tenets
─ Management tenets
─ Financial tenets
─ Market tenets
Reference: BROWN & REILLY, Chapter XV

8
Warren Buffet’s tenets
• Business tenets
─ Is the business simple and understandable?
─ Does the business have a consistent operating history?
─ Does the business have favorable long-term prospects?
• Management tenets
─ Is management rational?
─ Is management candid with its shareholders?
─ Does management resist the institutional imperative?
• Financial tenets
─ Focus on return on equity, not earnings per share (importance of owner’s earnings)
─ Look for companies with high profit margins
─ For every dollar retained, make sure the company has created at least one dollar of market value
Reference: BROWN & REILLY, Chapter XV

9
Estimating the fundamental intrinsic value
• Market tenets
─ What is the value of the business?
─ Can the business be purchased at a significant discount to its fundamental intrinsic value?
• How do you estimate the fundamental intrinsic value of a firm?
─ Present value of cash flows (PVCF)
• Present value of dividends (DDM)
• Present value of free cash flow to equity (FCFE)
• Present value of free cash flow (FCFF)
─ Relative valuation techniques
• Price earnings ratio (P/E)
• Price cash flow ratios (P/CF)
• Price book value ratios (P/BV)
• Price sales ratio (P/S)
Reference: BROWN & REILLY, Chapter XV

10
Approaches to the valuation of common stock
• Two approaches have developed
─ Discounted cash-flow valuation. Present value of some measure of cash flow, including dividends, operating cash flow, and free cash flow
─ Relative valuation technique. Value estimated based on its price relative to significant variables, such as earnings, cash flow, book value, or sales (uses ratios). Provides information about how the market is currently valuing stocks but no guidance as to whether valuations are appropriate
• The discounted cash flow approaches are dependent on some factors
─ The rate of growth and the duration of growth of the cash flows
─ The estimate of the discount rate
• The discounting factor depends on the measure of cash flow used
─ Dividends → Cost of equity
─ Operating cash flow → Weighted average cost of capital (WACC)
─ Free cash flow to equity → Cost of equity
Reference: BROWN & REILLY, Chapter XI

11
Approaches to the valuation of common stock
Operating
value
Equity
value
Debt
value
Net Present Value of Operating Free Cash Flow
Net Present Value of Free Cash Flow to Debtholders
Net Present Value of Free Cash Flow to Equity owners
= NOPAT= NOPAT
+ D & A+ D & A
--/+ delta net working capital/+ delta net working capital
--/+ delta /+ delta CapexCapex
= avalaible dividends / Ke = avalaible dividends / Ke
= avalaible interest income / Ki = avalaible interest income / Ki
= Op FCF / WACC = Op FCF / WACC
12
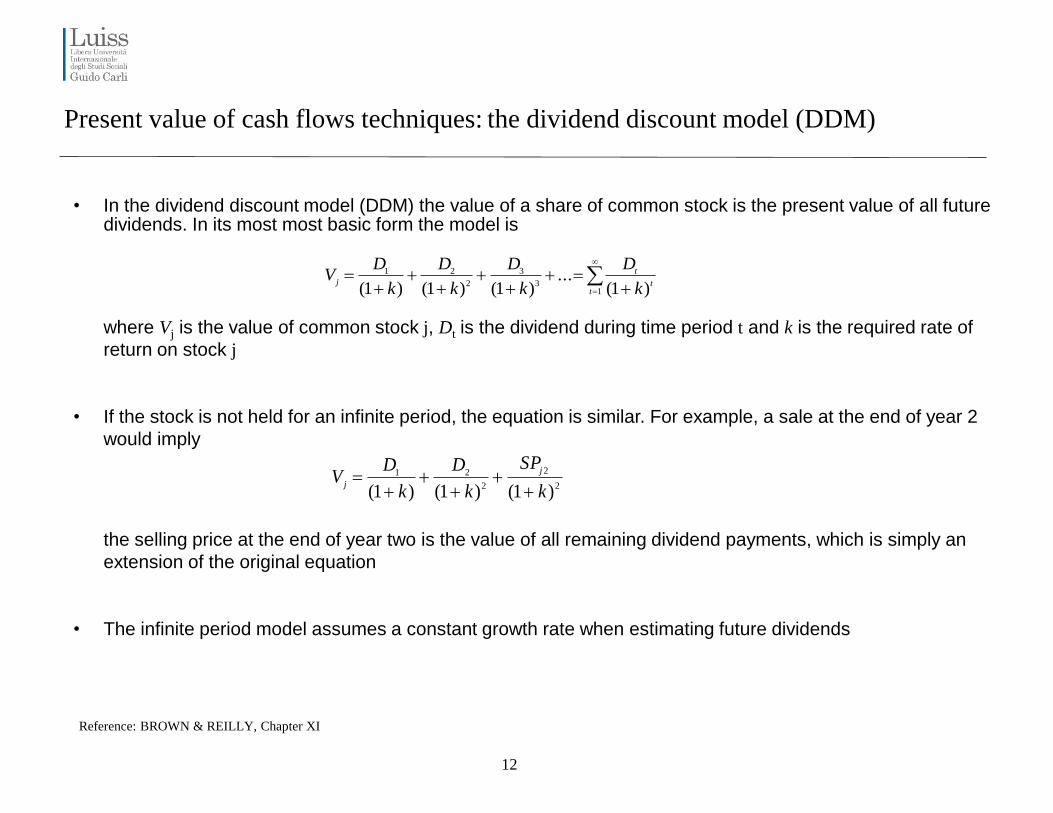
• In the dividend discount model (DDM) the value of a share of common stock is the present value of all future dividends. In its most most basic form the model is
where Vj is the value of common stock j, Dt is the dividend during time period t and k is the required rate of
return on stock j
• If the stock is not held for an infinite period, the equation is similar. For example, a sale at the end of year 2
would imply
the selling price at the end of year two is the value of all remaining dividend payments, which is simply an
extension of the original equation
• The infinite period model assumes a constant growth rate when estimating future dividends
Reference: BROWN & REILLY, Chapter XI
13
3
2
21
)1(...
)1()1()1( tt
t
jk
D
k
D
k
D
k
DV
2
2
2
21
)1()1()1( k
SP
k
D
k
DV
j
j
Present value of cash flows techniques: the dividend discount model (DDM)

13
Present value of cash flows techniques: the dividend discount model (DDM)
• The basic valuation equation including growth is
• The assumptions of the infinite period DDM including growth are then
• Dividends grow at a constant rate
• The constant growth rate will continue for an infinite period
• The required rate of return (k) is greater than the infinite growth rate (g)
• Growth companies have opportunities to earn return on investments greater than their required rates of
return. To exploit these opportunities, these firms generally retain a high percentage of earnings for
reinvestment, and their earnings grow faster than those of a typical firm
• The infinite period DDM assumes constant growth for an infinite period, but abnormally high growth usually
cannot be maintained indefinitely. Combine the models to evaluate the years of supernormal growth and
then use DDM to compute the remaining years at a sustainable rate
Reference: BROWN & REILLY, Chapter XI
gk
D
k
gD
k
gD
k
gDV
n
n
j
10
2
2
00 ...)1(
)1(...
)1(
)1(
)1(
)1(

14 Asse
t M
an
ag
em
en
t, le
ctu
re II
I
Please input a ticker in cell A7 and press enter. For further information about how the model has been constructed, please cllick the Help button for further assistance
3-stage DDM model
Enter Ticker:
enel im equity Period contribution to value
ENEL SPA High growth period
Utilities 11,25%
Current Transition Period Transition period
Current EPS 0,75 Transition Period length (yrs) 8 32,66%
Current DPS 0,43 Riskfree Rate 3,30% Stable growth
High growth period Beta 0,77833885 56,09%
Payout ratio 59,99% Expected Market Return 9,00%
Riskfree Rate 3,30% Cost of Equity 7,74%
Expected Market Return 9,00% Payout ratio 59,99%
Beta 0,734007 Stable growth period
High growth period length (yrs) 2 EPS Growth Rate 2,00% 2,00%
Cost of Equity 7,48% Cost of Equity 7,99%
Applied EPS growth rate 2,83% Beta in stable phase 0,8226711
Hist Avg eps growth 13,71% 30,00% Weighting Riskfree Rate 3,30%
Analyst estimated eps growth -1,83% 70,00% for EPS Expected Market Return 9,00%
Revenue growth
Y Model Present Value 4,52
This Year Estimate 0,50 Current Price of Security 4,26
Next Year Estimate 0,44 Potential misprice 6,19%
Growth Rate in revenues 2,83%
Net difference Goalseeker 0,26
Override values Override values
For first 2 years use short term
broker forecasts? (Y/N)
BloombergHelp
Present value of cash flows techniques: DDM on Bloomberg

15
Please input a ticker in cell A7 and press enter. For further information about how the model has been constructed, please cllick the Help button for further assistance
3-stage FCFE model -
Enter Ticker:
enel im equity Period contribution to value
ENEL SPA High growth period
Utilities 9,33%
Current Transition Period Transition period
Current EPS 0,75 Transition Period length (yrs) 8 13,90%
Current DPS 0,43 Growth rate in CapEx 12,54% Stable growth
Capex per share 1,01 Growth rate in Depreciation 12,54% 76,77%
Depr per share 0,51 WC as %age of Revenue -0,36%
Revenue per share 8,49 Debt to Capital ratio 70,30%
Working Capital per share -0,03 Riskfree Rate 3,30%
Chg Working Capital per share -0,96 Beta 0,77833885
Debt to Capital ratio 70,30% Expected Market Return 9,00%
High growth period Cost of Equity 7,74%
Riskfree Rate 3,30%
Expected Market Return 9,00% Stable growth period
Beta 0,734007 EPS Growth Rate 2,00% 2,00%
WC as %age of Revenue -0,36% WC as%age revenue -0,36% Revenue growth
High growth period length (yrs) 2 Debt to Capital ratio 70,30%
Cost of Equity 7,48% Cost of Equity 7,99%
Applied EPS growth rate 2,83% Beta in stable phase 0,8226711
Hist Avg eps growth 13,71% 30,00% Weighting Riskfree Rate 3,30%
Analyst estimated eps growth -1,83% 70,00% for EPS Expected Market Return 9,00%
Y Model Present Value 5,51
This Year Estimate 0,50 Current Price of Security 4,26
Next Year Estimate 0,44 Potential misprice 29,39%
Growth Rate in CapEx 14,81%
Growth Rate in Depreciation 12,54% Net difference Goalseeker 1,25
Growth Rate in revenues 2,83%
Override values Override values
For first 2 years use short term
broker forecasts? (Y/N)
BloombergHelp
Present value of cash flows techniques: FCFE on Bloomberg
16
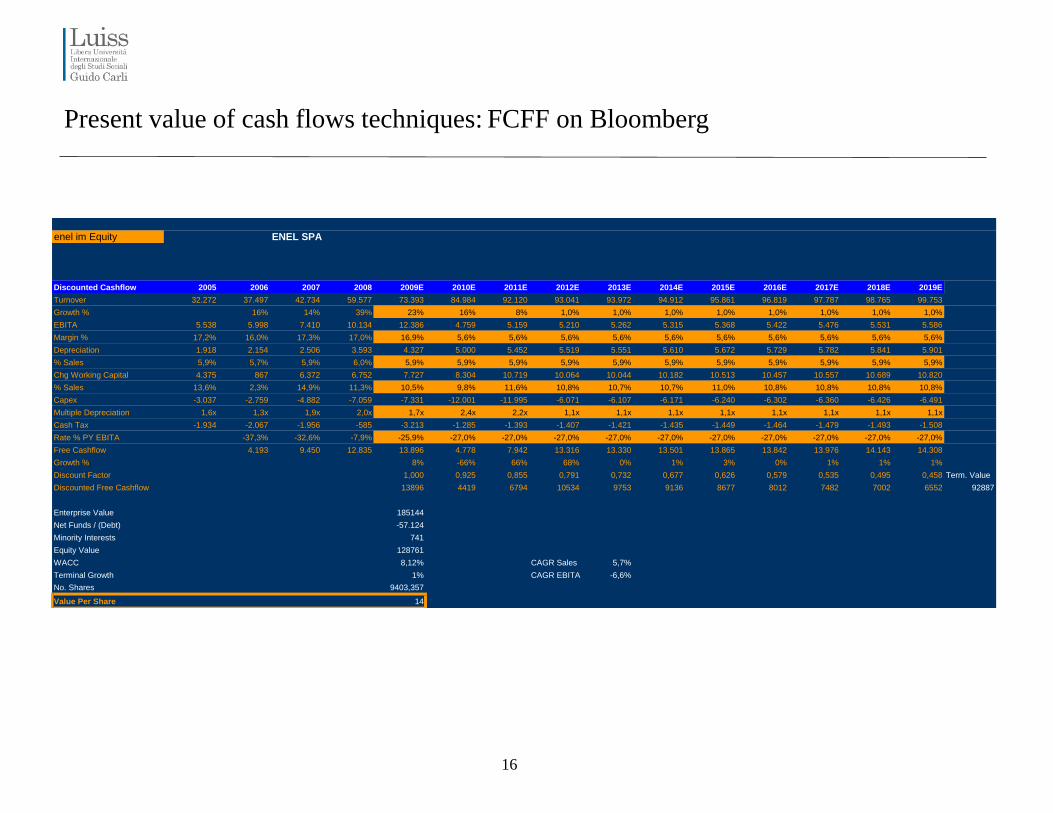
enel im Equity ENEL SPA
0 0 1 2 3 4 5 6 7 8 9 10
Discounted Cashflow 2005 2006 2007 2008 2009E 2010E 2011E 2012E 2013E 2014E 2015E 2016E 2017E 2018E 2019E
Turnover 32.272 37.497 42.734 59.577 73.393 84.984 92.120 93.041 93.972 94.912 95.861 96.819 97.787 98.765 99.753
Growth % 16% 14% 39% 23% 16% 8% 1,0% 1,0% 1,0% 1,0% 1,0% 1,0% 1,0% 1,0%
EBITA 5.538 5.998 7.410 10.134 12.386 4.759 5.159 5.210 5.262 5.315 5.368 5.422 5.476 5.531 5.586
Margin % 17,2% 16,0% 17,3% 17,0% 16,9% 5,6% 5,6% 5,6% 5,6% 5,6% 5,6% 5,6% 5,6% 5,6% 5,6%
Depreciation 1.918 2.154 2.506 3.593 4.327 5.000 5.452 5.519 5.551 5.610 5.672 5.729 5.782 5.841 5.901
% Sales 5,9% 5,7% 5,9% 6,0% 5,9% 5,9% 5,9% 5,9% 5,9% 5,9% 5,9% 5,9% 5,9% 5,9% 5,9%
Chg Working Capital 4.375 867 6.372 6.752 7.727 8.304 10.719 10.064 10.044 10.182 10.513 10.457 10.557 10.689 10.820
% Sales 13,6% 2,3% 14,9% 11,3% 10,5% 9,8% 11,6% 10,8% 10,7% 10,7% 11,0% 10,8% 10,8% 10,8% 10,8%
Capex -3.037 -2.759 -4.882 -7.059 -7.331 -12.001 -11.995 -6.071 -6.107 -6.171 -6.240 -6.302 -6.360 -6.426 -6.491
Multiple Depreciation 1,6x 1,3x 1,9x 2,0x 1,7x 2,4x 2,2x 1,1x 1,1x 1,1x 1,1x 1,1x 1,1x 1,1x 1,1x
Cash Tax -1.934 -2.067 -1.956 -585 -3.213 -1.285 -1.393 -1.407 -1.421 -1.435 -1.449 -1.464 -1.479 -1.493 -1.508
Rate % PY EBITA -37,3% -32,6% -7,9% -25,9% -27,0% -27,0% -27,0% -27,0% -27,0% -27,0% -27,0% -27,0% -27,0% -27,0%
Free Cashflow 4.193 9.450 12.835 13.896 4.778 7.942 13.316 13.330 13.501 13.865 13.842 13.976 14.143 14.308
Growth % 8% -66% 66% 68% 0% 1% 3% 0% 1% 1% 1%
Discount Factor 1,000 0,925 0,855 0,791 0,732 0,677 0,626 0,579 0,535 0,495 0,458 Term. Value
Discounted Free Cashflow 13896 4419 6794 10534 9753 9136 8677 8012 7482 7002 6552 92887
Enterprise Value 185144
Net Funds / (Debt) -57.124 57.124
Minority Interests 741 741
Equity Value 128761
WACC 8,12% 5,123871 0,05123871 CAGR Sales 5,7% 7%
Terminal Growth 1% CAGR EBITA -6,6%
No. Shares 9403,357
Value Per Share 14
Present value of cash flows techniques: FCFF on Bloomberg

17
Present value of cash flows techniques: g = retention rate * ROE
• Simplifying assumptions help in estimating present value of future dividends. For example, the assumption of a constant growth rate yields
• The required rate of return (or cost of capital) k may be estimated using a CAPM-type assumption
As you know, the model requires k > g. With g > k, the analyst must use multi-stage model
Reference: BROWN & REILLY, Chapter XV
withrate growth historical dividend valueIntrinsic gDDgk
D
1);(
01
1
rateretention or rate)growth l(historica 1
0 ROEgD
Dg n
n
fmarketstockf r)E(rβrk

18
Present value of cash flows techniques: Free cash flow to equity, Free cash flow to firm
• You may define the as follows: FCFE = net income + depreciation expense - capital expenditures - Δ in working capital - principal debt repayments + new debt issues
• The present value of free cash flows to equity (PVFCFE) under the constant growth assumption is given by
• The free cash flows to the firm are given by FCFF = EBIT (1-tax rate) + depreciation expense - capital spending - Δ in working capital - Δ in other assets
• The present value of free cash flows to the firm (PVFCFF) under the constant growth assumption is given by
Reference: BROWN & REILLY, Chapter XV
firm the forequity toflow cash free of rate growth constant expected the
firm the forequity on return of rate required the
1 period inflow cash free expected the
where,
FCFE
FCFE
g
k
FCFE
gk
FCFEPVFCFE
1
1
firm the toflow cash free of rate growth constant expected the
firm the for capital of cost average weightedthe
1 period in firm the toflow cash free expected the
where,
FCFF
FCFF
g
WACC
FCFF
gWACC
FCFFPVFCFF
1
1

19
Reference: A. DAMODARAN Investment Valuation
Present value of cash flows techniques: the dividend discount model (DDM)

20
Reference: A. DAMODARAN Investment Valuation
Present value of cash flows techniques: Free cash flow to equity

21
Reference: A. DAMODARAN Investment Valuation
Present value of cash flows techniques: Free cash flow to firm

22
Present value of cash flows techniques
• The FCFF can also be replaced by the operating free cash flows to the firm. The growth rate estimate can be obtained as follows
and the weighted average cost of capital is given by (in plain English: the proportion of equity in total capital by the after-tax cost of equity plus the proportion of debt in total capital by the after-tax cost of debt)
• By plugging in the constant growth DDM in the price to earnings ratio, we get
and therefore the ratio is affected by two variables: the required rate of return on quity (k) and the expected growth rate of dividends (g)
• The constant growth model is not appropriate for growth companies. Moreover, generating rates of return greater than the firm’s cost of capital is considered to be temporary. We would further discuss these issues in the next lecture
Reference: BROWN & REILLY, Chapter XV
capital Total
ratetax whererate retention
1;
EBITROICROICg
FCFF
iWkWWACCDE
gk
EDEP
11
1
//

23
Present value of cash flows techniques: EVA / ERI / MVA
• Economic Value-Added (EVA) or Economic Residual Income (ERI)
– Compare net operating profit less adjusted taxes (NOPLAT) to the firm’s total cost of
capital in dollar terms, including the cost of equity
– EVA =
• EVA return on capital
EVA/Capital
• Alternative measure of EVA
– Compare return on capital to cost of capital
• Market Value-Added (MVA)
– Measure of external performance
– How the market has evaluated the firm’s performance in terms of market value of debt and
market value of equity compared to the capital invested in the firm
• Relationships between EVA and MVA
– mixed results
)()( ICWACCROICWACCICNOPLAT

24
Relative valuation: Enterprise and equity multiple
What is a multiple?
A valuation multiple is simply an expression of market value relative to a key statistic that is assumed to relate to
that value. To be useful, that statistic-whether earnings, cash flow or some other measure-must bear a logical
relationship to the market value observed; to be seen, in fact, as the driver of that market value.
There are two basic types of multiple - enterprise value and equity:
• Enterprise multiple (unlevered), express the value of an entire enterprise - the value of all claims on a business
- relative to a statistic that relates to the entire enterprise, such as sales or EBIT.
• Equity multiples (levered), by contrast, express the value of shareholders' claims on the assets and cash flow
of the business. An equity multiple therefore expresses the value of this claim relative to a statistic that applies
to shareholders only, such as earnings (the residual left after payments to creditors, minority shareholders and
other non-equity claimants).
Enterprise value multiples Equity multiples
Allow the user to focus on statistics where accounting policy
differences can be minimised (EBITDA, OpFCF)
More relevant to equity valuation
Avoid the influence of capital structure on equity value
multiples
More reliable (estimating enterprise value involves more
subjectivity, especially in the valuation of non-core assets)
More comprehensive (apply to the entire enterprise) More familiar to investors
Wider range of multiples possible

25
Advantages/Disadvantages of Multiples
Advantages
• Usefulness: Valuation is about judgement, and multiples provide a framework for making value judgements.
When used properly, multiples are robust tools that can provide useful information about relative value.
• Simplicity: Their simplicity and ease of calculation makes multiples an appealing and user-friendly method
of assessing value. Multiples can help the user avoid the potentially misleading precision of other, more
'precise' approaches such as discounted cash flow valuation or EVA , which can create a false sense of
comfort.
• Relevance: Multiples focus on the key statistics that other investors use. Since investors in aggregate move
markets, the most commonly used statistics and multiples will have the most impact.
Disadvantages
• Simplistic: A multiple is a distillation of a great deal of information into a single number or series of numbers.
By combining many value drivers into a point estimate, multiples may make it difficult to disaggregate the
effect of different drivers, such as growth, on value.
• Static: A multiple represents a snapshot of where a firm is at a point in time, but fails to capture the dynamic
and ever-evolving nature of business and competition.
• Difficult to compare: Multiples are primarily used to make comparisons (relative value). But comparing
multiples is almost an art form, because there are so many reasons that multiples can differ, not all of which
relate to true differences in value.
Relative valuation: Enterprise and equity multiple
26
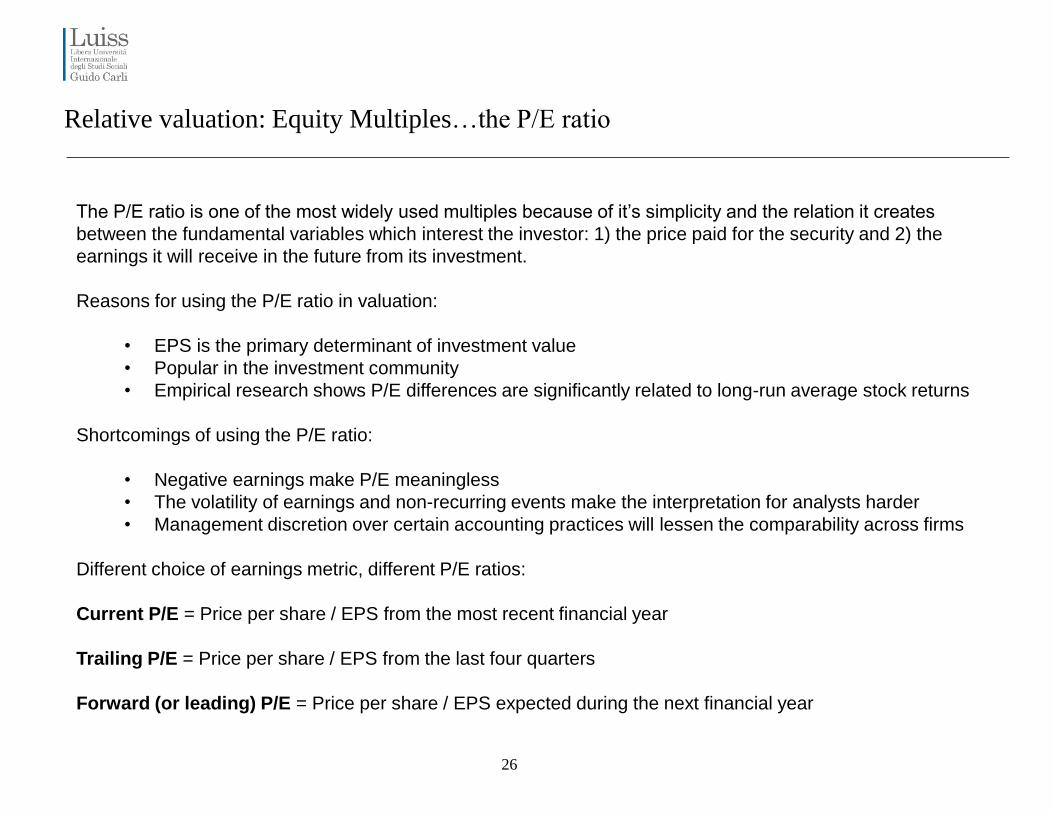
Relative valuation: Equity Multiples…the P/E ratio
The P/E ratio is one of the most widely used multiples because of it’s simplicity and the relation it creates
between the fundamental variables which interest the investor: 1) the price paid for the security and 2) the
earnings it will receive in the future from its investment.
Reasons for using the P/E ratio in valuation:
• EPS is the primary determinant of investment value
• Popular in the investment community
• Empirical research shows P/E differences are significantly related to long-run average stock returns
Shortcomings of using the P/E ratio:
• Negative earnings make P/E meaningless
• The volatility of earnings and non-recurring events make the interpretation for analysts harder
• Management discretion over certain accounting practices will lessen the comparability across firms
Different choice of earnings metric, different P/E ratios:
Current P/E = Price per share / EPS from the most recent financial year
Trailing P/E = Price per share / EPS from the last four quarters
Forward (or leading) P/E = Price per share / EPS expected during the next financial year

27
Reported EPS (or GAAP)
As the number derived from generally accepted accounting principles (GAAP), which are reported in SEC
filings. The company derives these earnings according to the accounting guidelines used. A company's
reported earnings can be distorted by GAAP. For example, a one-time gain from the sale of machinery or a
subsidiary could be considered as operating income under GAAP and cause EPS to spike. Also, a company
could classify a large lump of normal operating expenses as an "unusual charge" which can boost EPS
because the "unusual charge" is excluded from calculations. Investors need to read the footnotes in order to
decide what factors should be included in "normal" earnings and make adjustments in their own calculations.
Ongoing EPS
Is calculated based upon normalized or ongoing net income and excludes anything that is an unusual one-
time event. The goal is to find the stream of earnings from core operations which can be used to forecast
future EPS. This can mean excluding a large one-time gain from the sale of equipment as well as an unusual
expense. Attempts to determine an EPS using this methodology is also called "pro forma" EPS.
Relative valuation: Equity Multiples…the P/E ratio
27

28
Pro Forma EPS
The words "pro forma" indicate that assumptions were used to derive whatever number is being discussed.
Different from reported EPS, pro forma EPS generally excludes some expenses/income that were used in
calculating reported earnings. For example, if a company sold a large division, it could, in reporting historical
results, exclude the expenses and revenues associated with that unit. This allows for more of an "apples-to-
apples" comparison. Another example of pro forma is a company choosing to exclude some expenses
because management feels that the expenses are non-recurring and distort the company's "true" earnings.
Non-recurring expenses, however, seem to appear with increasing regularity these days. This raises questions
as to whether management knows what it is doing or is trying to build a "rainy day fund" to smooth EPS.
The headline EPS
Is the EPS number that is highlighted in the company's press release and picked up in the media. Sometimes
it is the pro forma number, but it could also be an EPS number that has been calculated by the analyst/pundit
that is discussing the company. Generally, sound bites do not provide enough information to determine which
EPS number is being used.
Cash EPS
Is operating cash flow (not EBITDA) divided by diluted shares outstanding. We think cash EPS is more
important than other EPS numbers because it is a "purer" number. Cash EPS is better because operating
cash flow cannot be manipulated as easily as net income and represents real cash earned, calculated by
including changes in key asset categories such as receivables and inventories.
Relative valuation: Equity Multiples…the P/E ratio
28

29
Relative valuation: the P/BV
The Price-to-Book Value ratio compares the market (expectations of a firm’s earnings power and cash flow) and
book value of equity for a given company.
Book Value = BV of Assets – BV Liabilities
Advantages
• BV is typically positive, even when a firm reports a loss and EPS is negative
• BV is more stable than EPS so it can be more useful when EPS is high, low or volatile
• BV is a good measure of net asset value for firms which hold liquid assets (like banks, insurance or
investment companies)
• Useful with companies expected to go out of business
Disadvantages
• It does not reflect human capital of a firm
• Outsourcing decisions might inflate the P/BV ratio compared to firms that don’t
• Accounting practices can distort the BV and reduce the comparability across firms (ex. Depreciation
methods or capitalization/expense R&D)
• Inflation and technological change can cause book and market value to differ significantly

30
Relative valuation: the P/S
The Price-Sales ratio solves some of the issues with the P/E and P/BV ratios.
Advantages
• P/S is positive even for distressed firms, since revenue is always positive (not true for P/E and P/BV)
• Revenues are not easy to manipulate like earnings and BV which are subject to accounting
conventions
• Sales are not as volatile as earnings and make P/S useful when P/E is very high or very low
• Useful to value start-ups which might already have revenues but no earnings
Disadvantages
• High sales growth does not indicate high operating profit
• P/S does not capture differences in cost structures across companies
• Even if less prone to manipulation, revenues can still be distorted through sales recognition practices
(ex. Bill and hold practices)
31
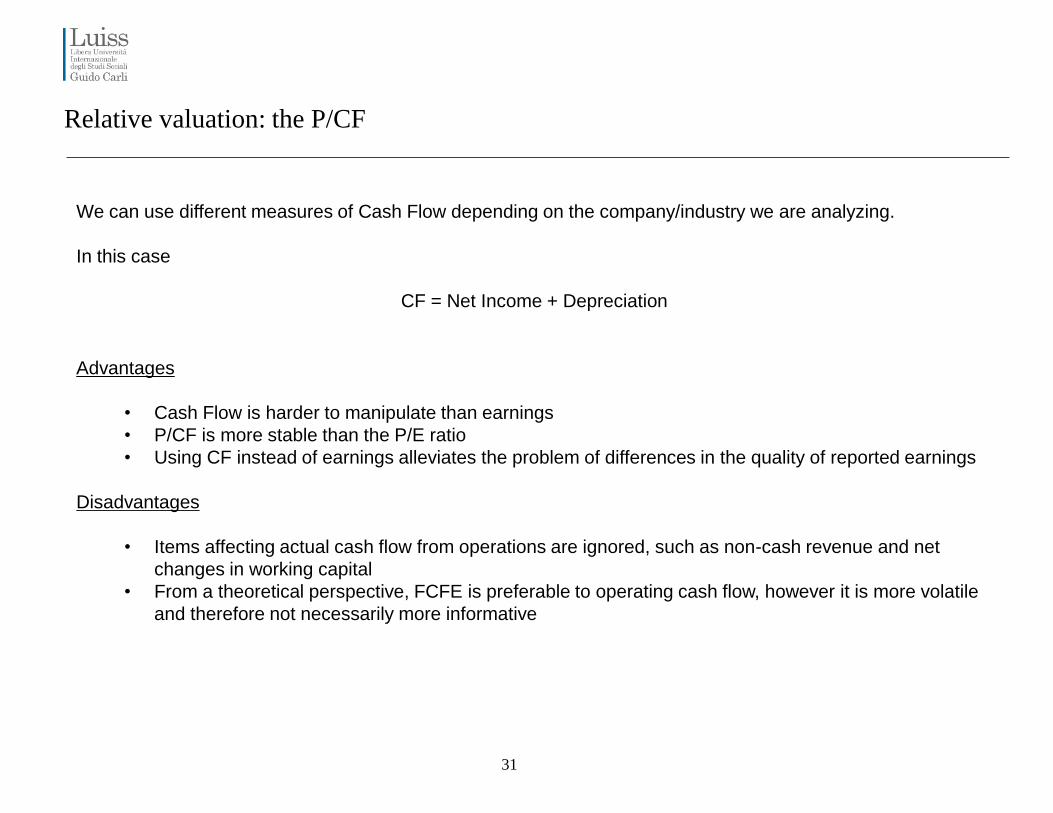
Relative valuation: the P/CF
We can use different measures of Cash Flow depending on the company/industry we are analyzing.
In this case
CF = Net Income + Depreciation
Advantages
• Cash Flow is harder to manipulate than earnings
• P/CF is more stable than the P/E ratio
• Using CF instead of earnings alleviates the problem of differences in the quality of reported earnings
Disadvantages
• Items affecting actual cash flow from operations are ignored, such as non-cash revenue and net
changes in working capital
• From a theoretical perspective, FCFE is preferable to operating cash flow, however it is more volatile
and therefore not necessarily more informative

32
Relative valuation: the EV/EBITDA
Enterprise value multiples are particularly relevant when we want to compare flows to both equity and debt, to
the value of the whole company.
They are particulary relevant with Mergers and Acquisition transactions.
Where
EV = MV of Common Shares + MV of Debt – Cash and equivalents
EBITDA = recurring earnings from continuing operations + interest + taxes + depreciation/amortization
or
EBIT + depreciation/amortization
Advantages
• More useful than P/E when comparing firms with different financial leverage
• Useful for valuing capital intensive firms with high levels of depreciation and amortization
• EBITDA is usually positive when EPS is not
Disadvantages
• If working capital is growing, EBITDA will overstate CFO
• It does not consider CAPEX and tax management

33
A Practical example: …strong buy for P/E …no action for EV/EBITDA
In choosing multiples for relative valuation, we recommend the use of enterprise value multiples if there are
material differences in gearing. This allows investors and analysts to initially value the business based on the
assumption that differences in gearing do not affect enterprise value. Subsequently, we capture the gearing
effect by deducting the value of other claims to arrive at an equity value. We believe that, when there are
material differences in gearing within a sector, applying PE multiples can lead to erroneous investment
conclusions.

34
Consistency and spread of valuation factor quintiles…some multiples are better than other
…WHY ?
Automobiles & Components,
Consumer Durables & Apparel,
Consumer Services:
Media, Publisher

35
Consumer staples (food,
beverage, tobacco…)
Retailing (apparel, distribution)
Consistency and spread of valuation factor quintiles…some multiples are better than other
…WHY ?

36
Energy (integrated, E&P…)
Healthcare
Consistency and spread of valuation factor quintiles…some multiples are better than other
…WHY ?

37
Relative valuation: multiple and… present value of cash flows…not very different !
Dividing both sides by the earnings per share
Dividing both sides by the sales per
share
Defining the return on equity (ROE) = EPS0 /
Book Value of Equity, the value of equity can
be written as:
Justified ratios: Ratios where the “P” in the numerator equals the value derived from a valuation
model
38
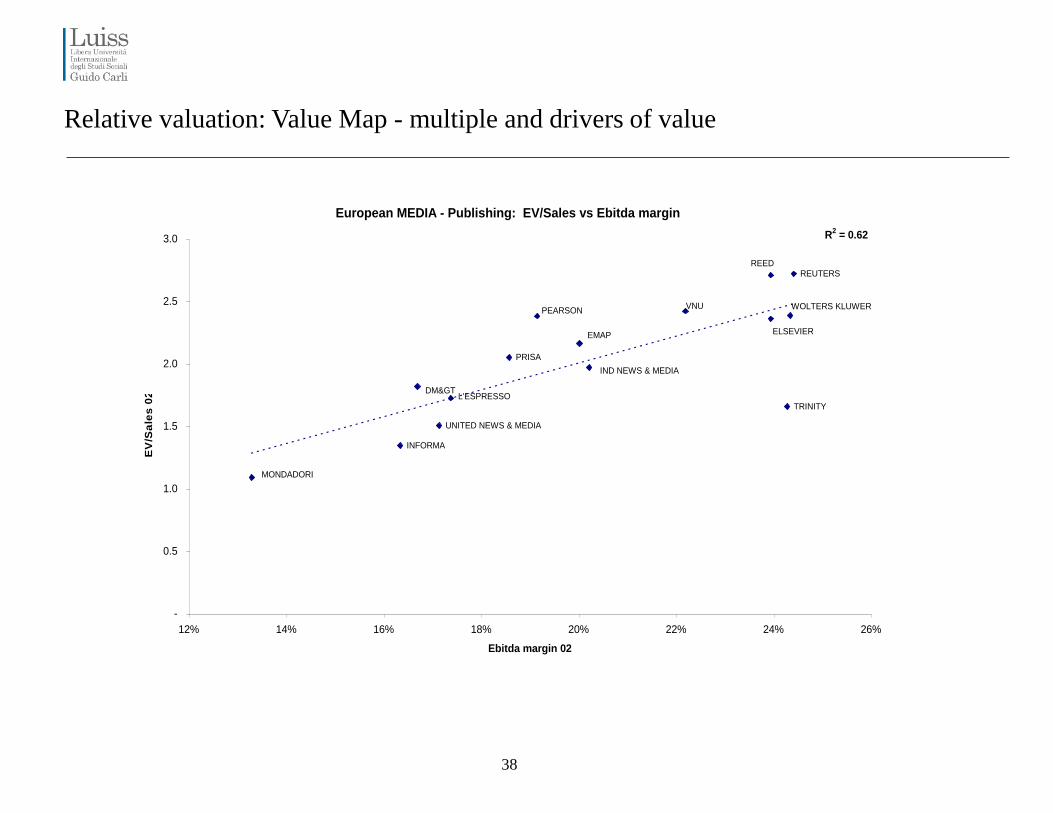
European MEDIA - Publishing: EV/Sales vs Ebitda margin
WOLTERS KLUWERVNU
UNITED NEWS & MEDIA
TRINITY
REUTERSREED
PRISA
PEARSON
MONDADORI
INFORMA
IND NEWS & MEDIA
L'ESPRESSO
EMAP ELSEVIER
DM>
R2 = 0.62
-
0.5
1.0
1.5
2.0
2.5
3.0
12% 14% 16% 18% 20% 22% 24% 26%
Ebitda margin 02
EV
/Sa
les
02
Relative valuation: Value Map - multiple and drivers of value

39
European MEDIA - Publishing: EV/Ebitda vs Ebitda CAGR
WOLTERS KLUWER
VNU
TRINITY
REUTERSREED
PRISA
PEARSON
MONDADORIINFORMA
IND NEWS & MEDIA
L'ESPRESSO
ELSEVIER
DM>
R2 = 0.34
6.0
7.0
8.0
9.0
10.0
11.0
12.0
13.0
1.0% 2.0% 3.0% 4.0% 5.0% 6.0% 7.0% 8.0% 9.0% 10.0%
Ebitda CAGR
EV
/Eb
itd
a 0
2
Relative valuation: Value Map - multiple and drivers of value

40
European MEDIA - Publishing: PE vs EPS CAGR
(senza Future Network)
WOLTERS KLUWERVNU
UNITED NEWS & MEDIA
TRINITY
REUTERS
REED
PRISA
PEARSON
MONDADORI
INFORMAIND NEWS & MEDIA
L'ESPRESSO
EMAP
ELSEVIER
DM>
R2 = 0.44
-
5.0
10.0
15.0
20.0
25.0
30.0
35.0
0.0% 10.0% 20.0% 30.0% 40.0% 50.0% 60.0%
EPS CAGR 00-02
PE
02
Relative valuation: Value Map - multiple and drivers of value

41
ROIC vs EV/IC
PHILIP MORRIS
PEPSICO
WALGREEN
SYSCO
SARA LEE
SAFEWAY
MCDONALD ' S
KROGER
CVS CORP
COCA-COLA
ANHEUSER-BUSCH
R2 = 0.6499
1.0
2.0
3.0
4.0
5.0
6.0
7.0
8.0
9.0
10.0
11.0
10.0% 12.0% 14.0% 16.0% 18.0% 20.0% 22.0% 24.0% 26.0% 28.0%
ROIC 02
EV
/IC
00
Relative valuation: Value Map - multiple and drivers of value
42
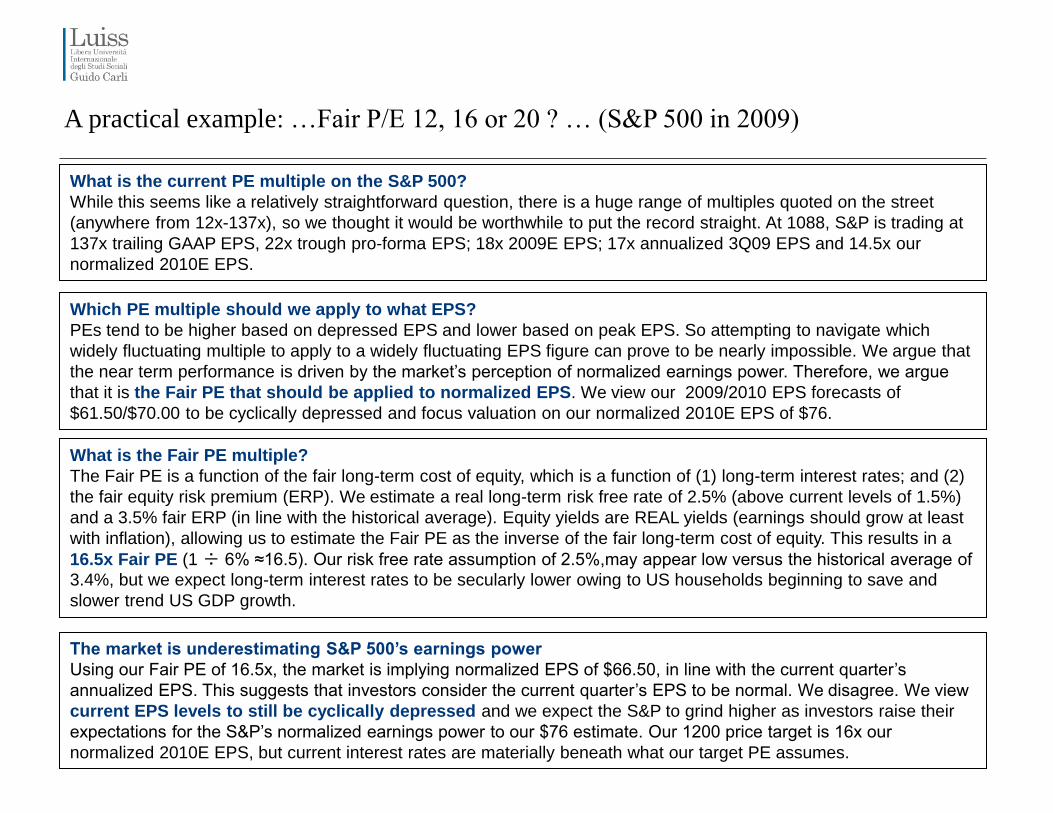
What is the current PE multiple on the S&P 500?
While this seems like a relatively straightforward question, there is a huge range of multiples quoted on the street
(anywhere from 12x-137x), so we thought it would be worthwhile to put the record straight. At 1088, S&P is trading at
137x trailing GAAP EPS, 22x trough pro-forma EPS; 18x 2009E EPS; 17x annualized 3Q09 EPS and 14.5x our
normalized 2010E EPS.
Which PE multiple should we apply to what EPS?
PEs tend to be higher based on depressed EPS and lower based on peak EPS. So attempting to navigate which
widely fluctuating multiple to apply to a widely fluctuating EPS figure can prove to be nearly impossible. We argue that
the near term performance is driven by the market’s perception of normalized earnings power. Therefore, we argue
that it is the Fair PE that should be applied to normalized EPS. We view our 2009/2010 EPS forecasts of
$61.50/$70.00 to be cyclically depressed and focus valuation on our normalized 2010E EPS of $76.
What is the Fair PE multiple?
The Fair PE is a function of the fair long-term cost of equity, which is a function of (1) long-term interest rates; and (2)
the fair equity risk premium (ERP). We estimate a real long-term risk free rate of 2.5% (above current levels of 1.5%)
and a 3.5% fair ERP (in line with the historical average). Equity yields are REAL yields (earnings should grow at least
with inflation), allowing us to estimate the Fair PE as the inverse of the fair long-term cost of equity. This results in a
16.5x Fair PE (1 ÷ 6% ≈16.5). Our risk free rate assumption of 2.5%,may appear low versus the historical average of
3.4%, but we expect long-term interest rates to be secularly lower owing to US households beginning to save and
slower trend US GDP growth.
The market is underestimating S&P 500’s earnings power
Using our Fair PE of 16.5x, the market is implying normalized EPS of $66.50, in line with the current quarter’s
annualized EPS. This suggests that investors consider the current quarter’s EPS to be normal. We disagree. We view
current EPS levels to still be cyclically depressed and we expect the S&P to grind higher as investors raise their
expectations for the S&P’s normalized earnings power to our $76 estimate. Our 1200 price target is 16x our
normalized 2010E EPS, but current interest rates are materially beneath what our target PE assumes.
A practical example: …Fair P/E 12, 16 or 20 ? … (S&P 500 in 2009)

43
While current
valuations may appear
stretched on
depressed EPS, they
are still
attractive on
normalized EPS
A practical example: …Fair P/E 12, 16 or 20 ? …

44
Normal EPS / Fair Real Cost of Equity = Fair Value
Normalized EPS estimates are intended to represent what
EPS would be in the current year if the current year were more
in the middle of the economic cycle.
In this case, we believe that our 2011E EPS of $80 is close to
normal. Discounting $80 by the nominal cost of equity less the
dividend yield (equity time value discounting) is how we
estimate normalized 2010 EPS of $76.
Accounting Quality Adj. Normal EPS / FairReal CoE = FV
Normalized EPS estimate is based on pro forma EPS for
accounting quality. Accounting quality adjustment is made to
ensure that EPS represents cash flow available for distribution
or reinvestment. Our adjustment is based upon historical GAAP
versus pro forma EPS differences and comparing pro forma
EPS to adjusted cash flow measures. S&P 500 Fair Cost of Equity = Normal
Treasury Bond Yield + Normal ERP
8.0% = 4.5% + 3.5%
Subtracting long-term expected
inflation gives the fair real S&P 500 cost
of equity.
S&P 500 Real Cost of Equity = 6.0% (8% -
2%)
Fair PE = 16.5 = 1/6%
A practical example: …Fair P/E 12, 16 or 20 ? …

45
A practical example: …Themes and Strategy…

46
A practical example: …and sector allocation

47
Business cycle and industry performance
• Wide dispersion in rates of return in different industries: performance varies from year to year, company performance varies within industries, risks vary widely by industry but are fairly stable over time
• Economic trends can and do affect industry performance. By identifying and monitoring key assumptions and variables, we can monitor the economy and gauge the implications of new information on our economic outlook and industry analysis
• Cyclical or Structural Changes
─ Cyclical changes in the economy arise from the ups and downs of the business cycle
─ Structural changes occur when the economy undergoes a major change in organization or how it functions (demographics, lifestyles, technology, economic reasoning)
─ Keep in mind that regulations substantially affect international transactions
• Rotation strategy is when one switches from one industry group to another over the course of a business cycle (see exhibit 14.2 of Brown and Reilly)
Reference: BROWN & REILLY, Chapter XIV

48
Sector allocation can enhance your performances !
Business cycle and industry performance

49
Technical Analysis
DEFINITION
Technical analysis is a tool used to forecast future price moves (across the whole spectrum of financial
instruments) through the study of statistics derived from trading activity such as past price action and volume.
• The philosophy behind technical analysis is in sharp contrast to the efficient market hypothesis, which
contends that past performance has no influence on future performance or market values.
• It is also very different from fundamental analysis, which as we have seen, involves making investment
decisions based on the examination of the economy, an industry, and company variables that lead to an
estimate of intrinsic value for an investment, which is then compared to its prevailing market price.
Reference: BROWN & REILLY, Chapter XV

50
Technical Analysis: underlying assumptions
Assumptions of Technical Analysis (Levy 1966)
1. The market value of any good or service is determined solely by the interaction of supply and demand.
2. Supply and demand are governed by numerous rational and irrational factors. Such as economic variables
relied on by the fundamental analyst as well as opinions, moods, and guesses of other market participants.
The market weighs all these factors continually and automatically.
3. Price of individual securities and of the market as a whole, move in trends most of the time and for
prolonged time periods.
4. Prevailing trends change in reaction to shifts in supply and demand relationships. These shifts, no matter
why they occur, can be detected sooner or later in the action of the market itself.
Reference: BROWN & REILLY, Chapter XV

51
Technical Analysis
How quickly does the market adjust to new information?
We all agree that stock prices change on the basis of supply and demand shifts, but how quick is this process?
The speed of adjustment
Technical analysts believe:
• Markets move in trends
• Trends last for prolonged periods of time
Why?
• Because information enters the market over a period of time rather than being processed instantaneously
Reference: BROWN & REILLY, Chapter XV

52
Technical Analysis…USD/EUR and Non-Farm Payrolls...3-Jun-2016 (30min)

53
Technical Analysis…USD/EUR and Non-Farm Payrolls...3-Jun-2016 (1min)

54
Technical Analysis…USD/EUR and Non-Farm Payrolls...3-Jun-2016 (4 hours)

55
Technical Analysis: types of charts
Line chart Bar Chart
Candlestick chart

56
Technical Analysis: trend lines and channels

57
Technical Analysis: Support and Resistance

58
Technical Analysis: Support and Resistance

59
Technical Analysis: Moving averages

60
Technical Analysis: Relative Strength Index

61
Technical Analysis: Moving Average Convergence Divergence

62
Technical Analysis
Fundamental or Technical analysis?
Fundamental Analysis = the evaluation of a secutity’s related economic, financial and other qualitative
quantitative factors, to determine its intrinsic value.
Technical Analysis = trys to forecast the future value of a security through the study of past price movements
and the study of other trading statistics such as volume.
…..the answer is somewhere in between
When we invest, timing and market behaviour are just as important as fundamental value!
Recommended