Automatic Dental Bur Automatic Dental Bur LoaderLoader
NCDADental Products Development Group
Design Concept Design Concept ReviewReview
Team 99.06:Team 99.06:Jason Dickey, Greg Frantz,Jason Dickey, Greg Frantz,
Allison Martin, Nancy MeyerAllison Martin, Nancy Meyer
Sponsor:Sponsor:Dave Berezowski, Dave Berezowski,
Dentsply/CaulkDentsply/Caulk
Advisor:Advisor:Dr. Jim GlanceyDr. Jim Glancey
1 December 19981 December 1998

Mission & ApproachMission & Approach
MissionMission::To develop a cost effective dental bur automatic loading and unloading device, while fulfilling as many of the customer and team wants as possible, within the specified time and budget constraints.
ApproachApproach::Using the SSD process, we will determine our customers, their wants and constraints, associated metrics, and benchmarks, which will lead into the conceptual design and prototyping of the automatic dental bur loader.

Presentation OverviewPresentation Overview
Project Description & BackgroundProject Description & Background Customers -- Constraints & WantsCustomers -- Constraints & Wants Wants -- Metrics -- Target ValuesWants -- Metrics -- Target Values Concept Generation & SelectionConcept Generation & Selection Final Concept DetailsFinal Concept Details Overview of Project ManagementOverview of Project Management

Project Description & Project Description & BackgroundBackground
Automate Unload / Load Cycle of Bur Automate Unload / Load Cycle of Bur GrinderGrinder
Currently 3 Operators Per Shift to Currently 3 Operators Per Shift to Manually Unload / Load 27 GrindersManually Unload / Load 27 Grinders
Looking to Reduce Labor Costs Through Looking to Reduce Labor Costs Through Complete Automation of GrindersComplete Automation of Grinders
Estimate Only One Operator Per Shift Will Estimate Only One Operator Per Shift Will be Required for the Automated Processbe Required for the Automated Process
Economical if Firm Budget is MaintainedEconomical if Firm Budget is Maintained

CustomersCustomers
Dave BerezowskiDave Berezowski• Bur Area ManagerBur Area Manager
Gene AnthonyGene Anthony• Grinder MechanicGrinder Mechanic
Dave BrownDave Brown• ManagerManager
Kevin BarkleyKevin Barkley• Grinder OperatorGrinder Operator
Brian HuntingtonBrian Huntington• Safety & HAZMAT Safety & HAZMAT
OfficerOfficer James AgnewJames Agnew
• ISO AuditorISO Auditor Brian MelonakisBrian Melonakis
• General ManagerGeneral Manager Dr. Donald BondDr. Donald Bond
• DentistDentist

Project ConstraintsProject Constraints
Must Be Under BudgetMust Be Under Budget Must Load 4 Bur FamiliesMust Load 4 Bur Families Quality of Burs Produced Must Not Quality of Burs Produced Must Not
DecreaseDecrease Cycle Time Must Not IncreaseCycle Time Must Not Increase Must Have Operation InterlockMust Have Operation Interlock Must Perform Design & Equipment Must Perform Design & Equipment
ValidationValidation Voltage and Air Pressure RequirementsVoltage and Air Pressure Requirements

Top Ten Wants & Related Top Ten Wants & Related MetricsMetrics
Minimize Per Unit CostMinimize Per Unit Cost• Prototype CostPrototype Cost• Per unit cost Per unit cost
Simplify operation of grinderSimplify operation of grinder• Number of steps needed by operatorNumber of steps needed by operator
Increase consistency of operationIncrease consistency of operation• Percentage of incorrect loadsPercentage of incorrect loads• Ratio of interlocks to positionsRatio of interlocks to positions

Easy to Adjust, Diagnose, and Repair Easy to Adjust, Diagnose, and Repair ProblemsProblems• Number of status Indicators (amount of Number of status Indicators (amount of
feedback)feedback)• Completeness of documentation and drawingsCompleteness of documentation and drawings
Minimize Unscheduled Down TimeMinimize Unscheduled Down Time• Cycles between FailureCycles between Failure• Completeness of documentation and drawingsCompleteness of documentation and drawings• Ratio of interlocks to positionsRatio of interlocks to positions
Comply with RegulationsComply with Regulations• Noise LevelNoise Level• Completeness of documentation and drawingsCompleteness of documentation and drawings

Reduce bur Production CostReduce bur Production Cost• Number of steps needed by operatorNumber of steps needed by operator
Complete DocumentationComplete Documentation• Completeness of documentation and drawingsCompleteness of documentation and drawings
Match Caulk Engineering PhilosophyMatch Caulk Engineering Philosophy• % of parts from Standard Vendors or made in house% of parts from Standard Vendors or made in house
Decrease Bur Unloading / Loading Cycle TimeDecrease Bur Unloading / Loading Cycle Time• Unload/Load Cycle TimeUnload/Load Cycle Time

Metrics & Target ValuesMetrics & Target Values
Prototype Cost . . . . . . . . . . . . . . . . . . . . . . . . . . < Prototype Cost . . . . . . . . . . . . . . . . . . . . . . . . . . < $25,000$25,000
Per unit cost. . . . . . . . . . . . . . . . . . . . . . . . . . . . . Per unit cost. . . . . . . . . . . . . . . . . . . . . . . . . . . . . < $8,000 < $8,000
Number of steps needed by operator. . < 7Number of steps needed by operator. . < 7 Percentage of incorrect loads . . . . . . . . . < 0.02%Percentage of incorrect loads . . . . . . . . . < 0.02% Ratio of interlocks to positions . . . . . . . . = 1/1Ratio of interlocks to positions . . . . . . . . = 1/1 Number of status Indicators . . . = # of IndicatorsNumber of status Indicators . . . = # of Indicators

Metrics & Target Values, Metrics & Target Values, cont.cont.
Completeness of documentation Completeness of documentation and drawings . . . . . . . . . . . . . . . . . . . . . . . . = 100%and drawings . . . . . . . . . . . . . . . . . . . . . . . . = 100% Cycles between Failure . . . . . . . . . . . . . > 250,000Cycles between Failure . . . . . . . . . . . . . > 250,000 Noise Level . . . . . . . . . . . . . . . . . . . . . . . . . . . < 80 dBNoise Level . . . . . . . . . . . . . . . . . . . . . . . . . . . < 80 dB % of parts from Standard Vendors % of parts from Standard Vendors or made in house . . . . . . . . . . . . . . . . . . . . .= 100%or made in house . . . . . . . . . . . . . . . . . . . . .= 100% Unload/Load Cycle Time . . . . . . . . . . . . . < 13 Unload/Load Cycle Time . . . . . . . . . . . . . < 13
secondsseconds
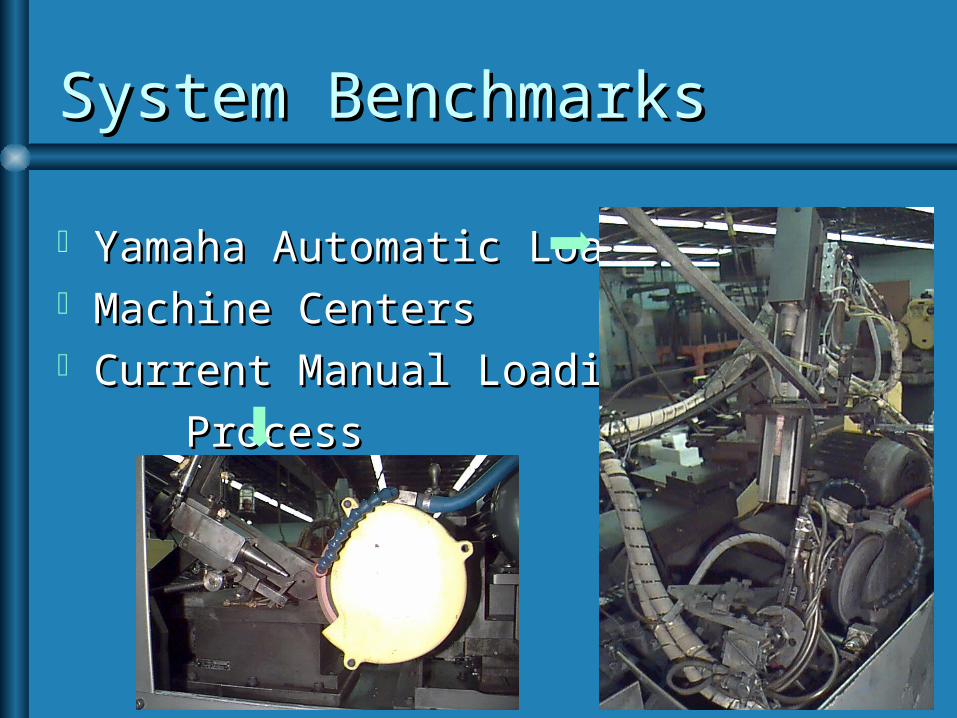
System BenchmarksSystem Benchmarks
Yamaha Automatic LoaderYamaha Automatic Loader Machine CentersMachine Centers Current Manual LoadingCurrent Manual Loading
ProcessProcess
Initial ConceptsInitial Concepts
Linear Screw DriveLinear Screw Drive Swing ArmSwing Arm Linear PistonLinear Piston Eliminate Head Unit -- Grippers OnlyEliminate Head Unit -- Grippers Only Robotic ArmRobotic Arm Four-Bar MechanismFour-Bar Mechanism
Initial Concepts, cont.Initial Concepts, cont.
Replace Steady Rest with GrippersReplace Steady Rest with Grippers MonkeyMonkey Rear Load Push RodRear Load Push Rod Rear Load Chain DriveRear Load Chain Drive Top LoaderTop Loader Conveyor BeltConveyor Belt

Initial Iteration of Initial Iteration of SelectionsSelections
Linear Piston ArmLinear Piston Arm
Linear Lead Screw Drive ArmLinear Lead Screw Drive Arm
Swing ArmSwing Arm
System FunctionsSystem Functions
Bur DeliveryBur Delivery
Collet ControlCollet Control
Steady Rest Steady Rest ControlControl
Bur TransferBur Transfer
Type of GrippersType of Grippers
Final Bur StorageFinal Bur Storage
Control SystemsControl Systems

Functional BenchmarksFunctional Benchmarks
Collet ControlCollet Control• Pneumatic PistonPneumatic Piston• Pneumatic ScrewPneumatic Screw• Electro MagnetElectro Magnet• Electro Servo MotorElectro Servo Motor• Pneumatic Lever ArmPneumatic Lever Arm
Final Bur StorageFinal Bur Storage• BasketsBaskets• x-y Indexed Trayx-y Indexed Tray
Type of GrippersType of Grippers• Pneumatic Grippers Pneumatic Grippers
& Actuators& Actuators• Magnetic “Grips”Magnetic “Grips”• Vacuum “Grips”Vacuum “Grips”
Control SystemsControl Systems• PLCsPLCs• LabVIEWLabVIEW• CamsCams
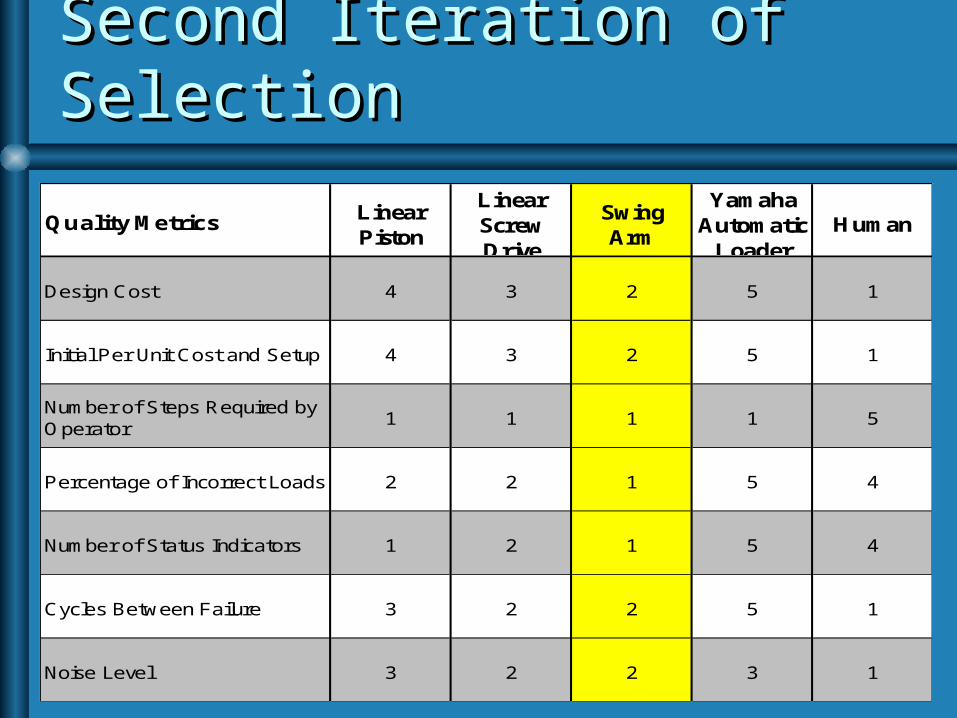
Second Iteration of Second Iteration of SelectionSelection
Quality Metrics Linear Piston
Linear Screw Drive
Swing Arm
Yamaha Automatic
LoaderHuman
Design Cost 4 3 2 5 1
Initial Per Unit Cost and Setup 4 3 2 5 1
Number of Steps Required by Operator
1 1 1 1 5
Percentage of Incorrect Loads 2 2 1 5 4
Number of Status Indicators 1 2 1 5 4
Cycles Between Failure 3 2 2 5 1
Noise Level 3 2 2 3 1

Continuation of SelectionContinuation of Selection
Quality Metrics Linear Piston
Linear Screw Drive
Swing Arm
Yamaha Automatic
LoaderHuman
Labor Cost 1 2 1 4 5
(# of interlocks)/(# of positions)
1 2 1 1 5
Contains SOPs, PM Plan, Tech. Drawings, Component List, and Training Aids
1 2 1 5 1
% of Parts from Standard Vendors or made in-house
1 2 1 5 1
Unload/Load Cycle Time 1 2 1 4 5
Total Points 23 25 16 48 34

Advantages Of Swing ArmAdvantages Of Swing Arm
Bur Transfer has One Degree of FreedomBur Transfer has One Degree of Freedom
Minimal Redesign of Current SystemMinimal Redesign of Current System
Fewer PartsFewer Parts
Easier to Diagnose and Repair Problems.Easier to Diagnose and Repair Problems.
Cheaper to Design Cheaper to Design
Cheaper to ImplementCheaper to Implement

Collet ExtensionCollet Extension
Normal ColletNormal ColletExtension ~1/8”Extension ~1/8”
Extended ColletExtended ColletExtension ~1/4”Extension ~1/4”

Final DesignFinal Design
Head Unit
Swing Arm
Grippers
Collet ControlPiston
Bur Tray &Feed Tube
Range ofMotion

Materials ListMaterials List
Quantity Item1 Omron C60 PLC 1 Numatics 6 Station Mark III6 Numatics Station1 Numatics Cord w/ lead (6') 5163--10100001 Meto-Fer Grippers KZ12D1 Bimba Air Cylinder PT-006270-A1MR2 Bimba Air Cylinder 0070.5-D1 Bimba Air Cylinder FO-170.375-3FMNTEE0.3751 Bimba Air Cylinder FT-041.25-3FMEE0.3751 Bimba Air Cylinder MRS-041-DXP4 Bimba Hall Effect Switch4 Bimba Magnetic Reed Switches4 Standard Lever Switch
Division of LaborDivision of Labor
Report, Slides, Schedule - JasonReport, Slides, Schedule - Jason AutoCAD, Design, Liaison - GregAutoCAD, Design, Liaison - Greg Report, AutoCAD - NancyReport, AutoCAD - Nancy Spread Sheet Design, Budget, Report - Spread Sheet Design, Budget, Report -
AllisonAllison
All other aspects such as customer, want, All other aspects such as customer, want, constraint, and metric determination was constraint, and metric determination was completed equally as a group.completed equally as a group.

Actual Schedule to DateActual Schedule to Date
Planned schedule:Planned schedule: Receive grinder by mid Receive grinder by mid
OctoberOctober 2 weeks of concept 2 weeks of concept
generation after generation after grinder unit receivedgrinder unit received
2 weeks of concept 2 weeks of concept selectionselection
1 week on the report1 week on the report
Actual Schedule:Actual Schedule: Receive head unit Receive head unit
November 13November 13 Less than one week of Less than one week of
generation due to time generation due to time constraintsconstraints
Less than one week Less than one week concept selection concept selection
A few days on the A few days on the reportreport
Schedule of Future EventsSchedule of Future Events
Submit design to Caulk for review in mid Submit design to Caulk for review in mid DecemberDecember
Begin ordering and making parts in early Begin ordering and making parts in early JanuaryJanuary
Begin building prototype early in FebruaryBegin building prototype early in February Continue testing and improving prototype Continue testing and improving prototype
through Marchthrough March Work on finalizing documentation in AprilWork on finalizing documentation in April

Preliminary Prototype Preliminary Prototype BudgetBudget
Materials Materials $3,800 $3,800
Engineering hoursEngineering hours 600 @ 600 @ $0.00/hr$0.00/hr
Shop hoursShop hours 100 @ 100 @ $0.00/hr$0.00/hr
Engineering ContingencyEngineering Contingency $2,400$2,400
Total CostTotal Cost $6,200$6,200
Recommended