Automotive taxationin the Netherlands
The effects of fiscal measures on passenger car sales in the Netherlands
Skatteudvalget 2013-14SAU Alm.del Bilag 11Offentligt
RAI Vereniging
Trade Association for the automotive industry in the Netherlands
Since 1893
More than 500 members
Passenger cars, light commercial vehicles, trucks, spareparts, garage-equipment, bicycles, motorcycles, mopeds, trailers, coaches etc.

The Dutch Car Park
Background data
Passenger car park 8,1 million vehicles
Annual new car sales approximately 500,000 vehicles
Average annual distance driven 13,317 km (petrol 10,877 km and diesel 23,806 km)
Average new car price: € 25,627
Petrol cars have dominant market share
Petrol79,18%
Diesel17,10%
LPG2,51%
Hybrid1,12%
Electric0,02%
CNG0,04%
Biofuel0,03%
Hydrogen0,00%
Passenger car park by fuel type
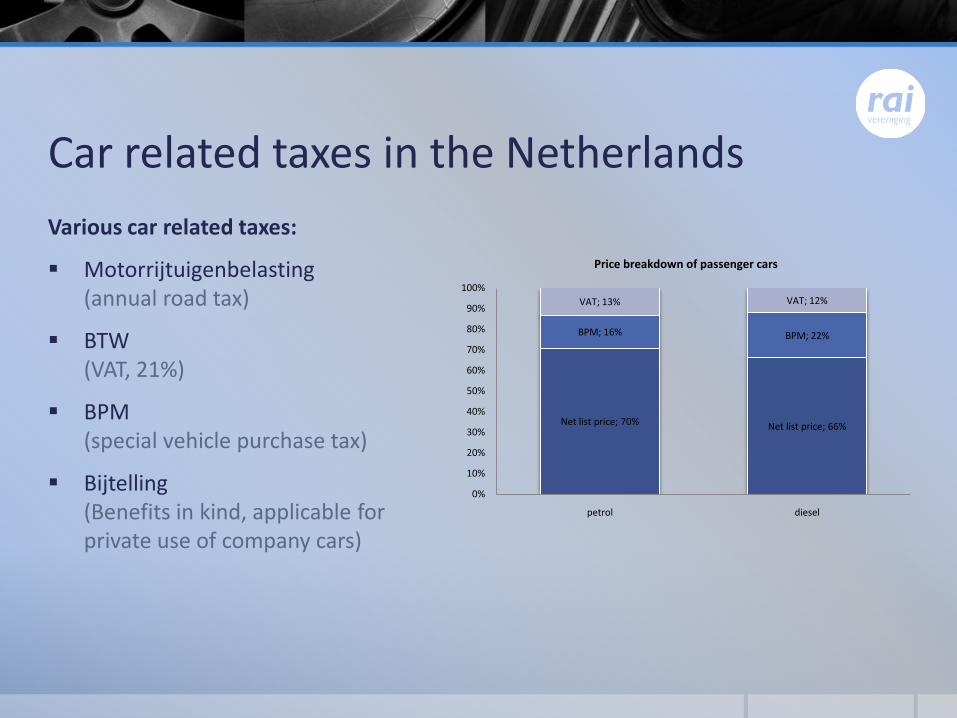
Car related taxes in the Netherlands
Various car related taxes:
Motorrijtuigenbelasting(annual road tax)
BTW (VAT, 21%)
BPM (special vehicle purchase tax)
Bijtelling(Benefits in kind, applicable for private use of company cars)
Net list price; 70% Net list price; 66%
BPM; 16% BPM; 22%
VAT; 13% VAT; 12%
0%
10%
20%
30%
40%
50%
60%
70%
80%
90%
100%
petrol diesel
Price breakdown of passenger cars

BPM
Since 1993
1993 – 2008: BPM is based on nett catalogue price of car
2006: introduction of bonus – malus scheme for fuel efficient cars (with labelling)
2008: gradual conversion from list price to CO2 emission as base for BPM
2013: BPM fully based on CO2 emission
BPM
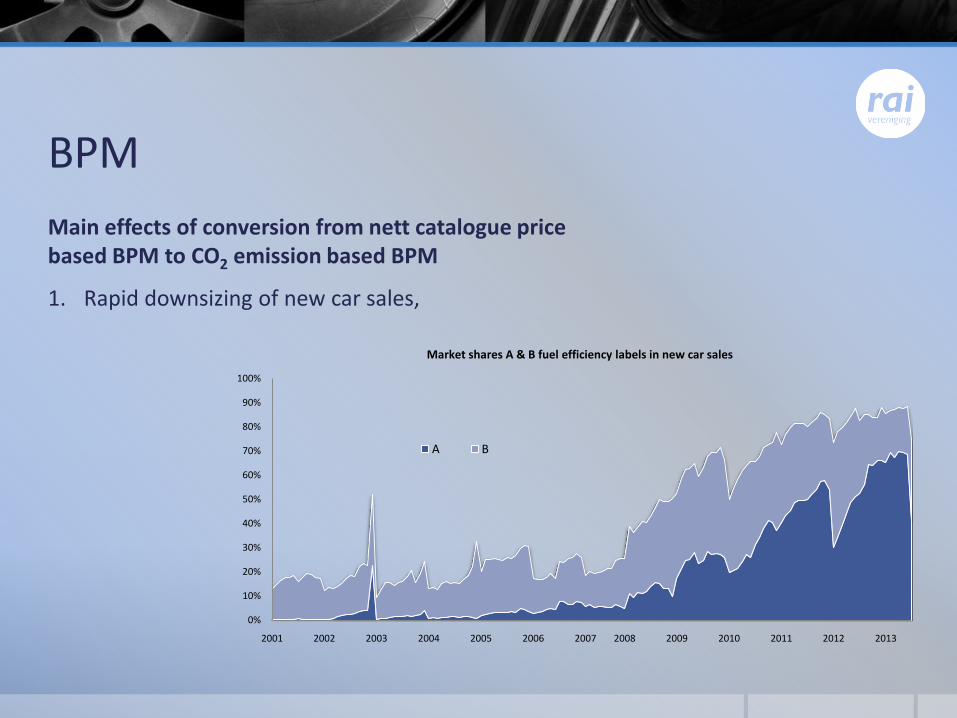
Main effects of conversion from nett catalogue pricebased BPM to CO2 emission based BPM
1. Rapid downsizing of new car sales,
0%
10%
20%
30%
40%
50%
60%
70%
80%
90%
100%
2001 2002 2003 2004 2005 2006 2007 2008 2009 2010 2011 2012 2013
Market shares A & B fuel efficiency labels in new car sales
A B
BPM
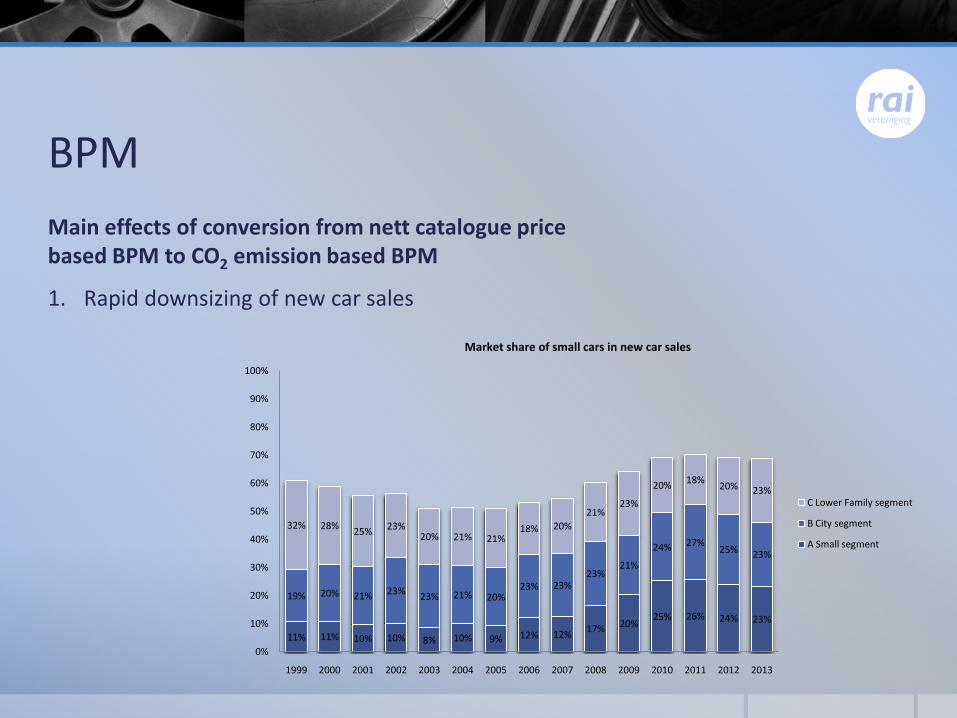
Main effects of conversion from nett catalogue pricebased BPM to CO2 emission based BPM
1. Rapid downsizing of new car sales
11% 11% 10% 10% 8% 10% 9% 12% 12%17% 20%
25% 26% 24% 23%
19% 20% 21% 23%23% 21% 20%
23% 23%23%
21%
24% 27%25% 23%
32% 28%25%
23%20% 21% 21%
18% 20%
21%23%
20%18%
20% 23%
0%
10%
20%
30%
40%
50%
60%
70%
80%
90%
100%
1999 2000 2001 2002 2003 2004 2005 2006 2007 2008 2009 2010 2011 2012 2013
Market share of small cars in new car sales
C Lower Family segment
B City segment
A Small segment
BPM
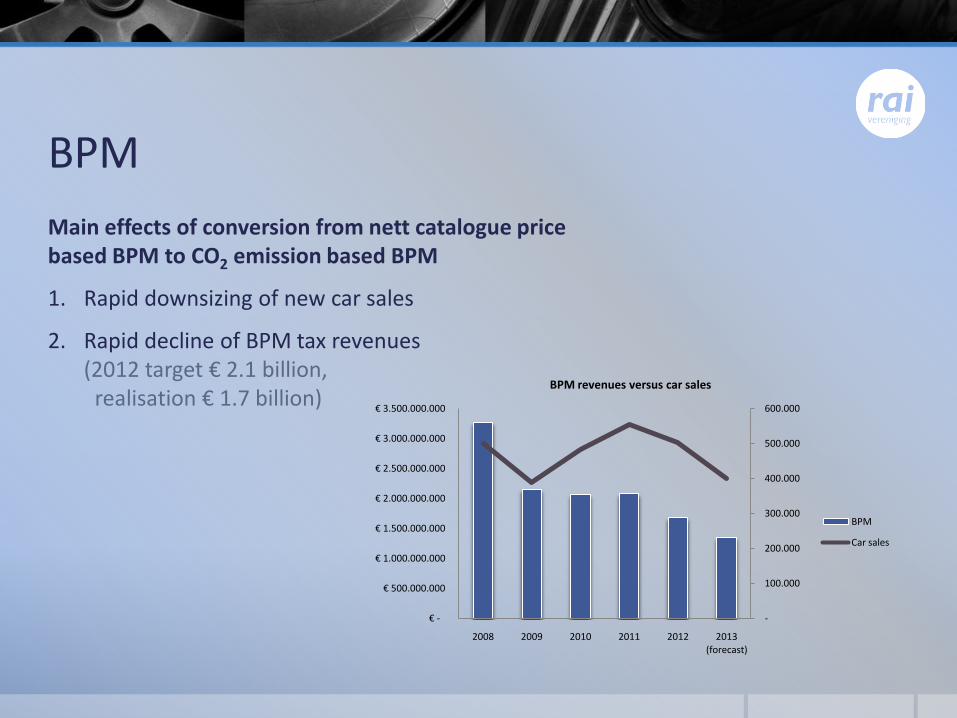
Main effects of conversion from nett catalogue pricebased BPM to CO2 emission based BPM
1. Rapid downsizing of new car sales
2. Rapid decline of BPM tax revenues(2012 target € 2.1 billion,
realisation € 1.7 billion)
-
100.000
200.000
300.000
400.000
500.000
600.000
€ -
€ 500.000.000
€ 1.000.000.000
€ 1.500.000.000
€ 2.000.000.000
€ 2.500.000.000
€ 3.000.000.000
€ 3.500.000.000
2008 2009 2010 2011 2012 2013 (forecast)
BPM revenues versus car sales
BPM
Car sales
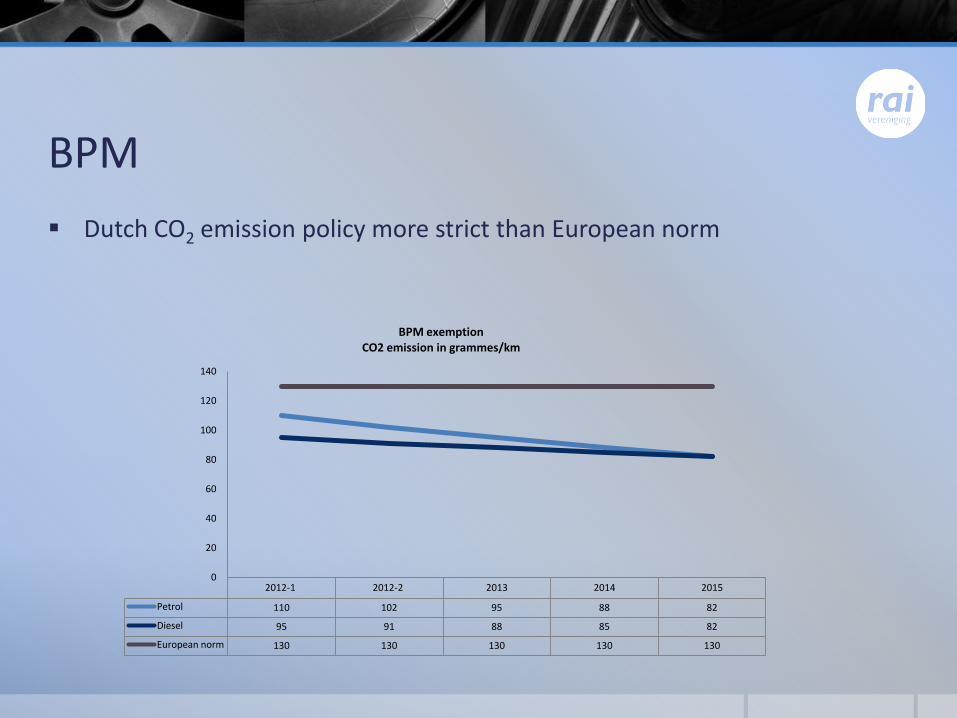
BPM
Dutch CO2 emission policy more strict than European norm
2012-1 2012-2 2013 2014 2015
Petrol 110 102 95 88 82
Diesel 95 91 88 85 82
European norm 130 130 130 130 130
0
20
40
60
80
100
120
140
BPM exemptionCO2 emission in grammes/km
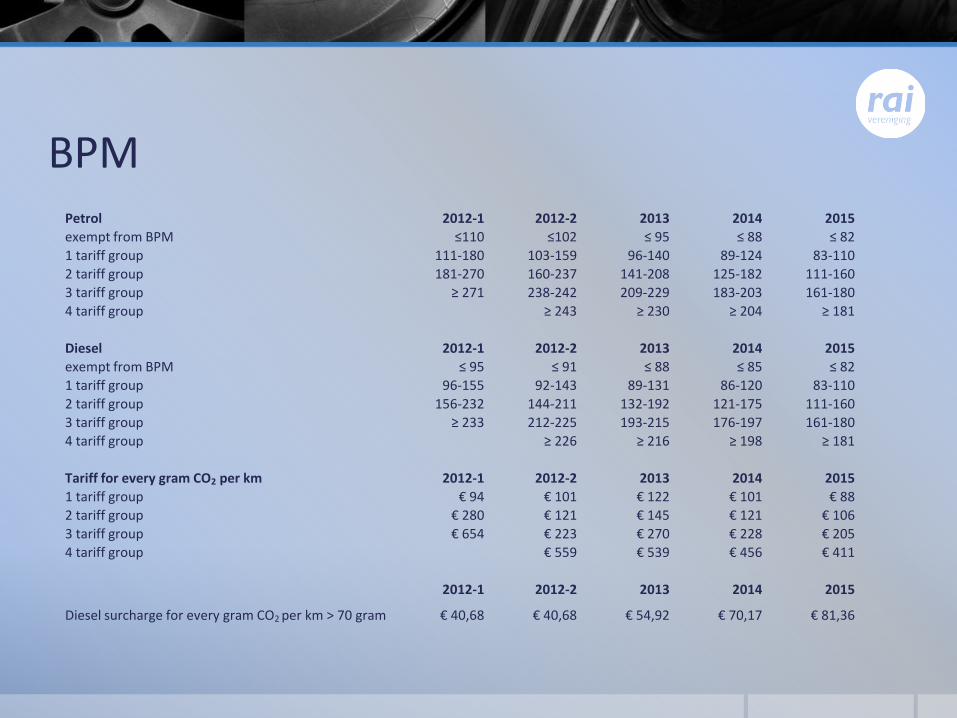
BPMPetrol 2012-1 2012-2 2013 2014 2015
exempt from BPM ≤110 ≤102 ≤ 95 ≤ 88 ≤ 82
1 tariff group 111-180 103-159 96-140 89-124 83-110
2 tariff group 181-270 160-237 141-208 125-182 111-160
3 tariff group ≥ 271 238-242 209-229 183-203 161-180
4 tariff group ≥ 243 ≥ 230 ≥ 204 ≥ 181
Diesel 2012-1 2012-2 2013 2014 2015
exempt from BPM ≤ 95 ≤ 91 ≤ 88 ≤ 85 ≤ 82
1 tariff group 96-155 92-143 89-131 86-120 83-110
2 tariff group 156-232 144-211 132-192 121-175 111-160
3 tariff group ≥ 233 212-225 193-215 176-197 161-180
4 tariff group ≥ 226 ≥ 216 ≥ 198 ≥ 181
Tariff for every gram CO2 per km 2012-1 2012-2 2013 2014 2015
1 tariff group € 94 € 101 € 122 € 101 € 88
2 tariff group € 280 € 121 € 145 € 121 € 106
3 tariff group € 654 € 223 € 270 € 228 € 205
4 tariff group € 559 € 539 € 456 € 411
2012-1 2012-2 2013 2014 2015
Diesel surcharge for every gram CO2 per km > 70 gram € 40,68 € 40,68 € 54,92 € 70,17 € 81,36
Bijtelling
Bijtelling is a form of income tax
The private use of a company car (> 500 km per year) is seenas a benefit in kind
If the private use of the company car is limited to less than500 km per year than there is no ‘bijtelling’
0%, 14%, 20% or 25% of the list price of the company car is tobe added to the annual income
Percentage of the bijtelling is based on the CO2 emission of the company car

Bijtelling
Company cars dominate the new car sales
Approximately 60% of new car sales are company cars
0%
10%
20%
30%
40%
50%
60%
70%
80%
90%
100%
Market share company cars in new car sales1999 - 2013
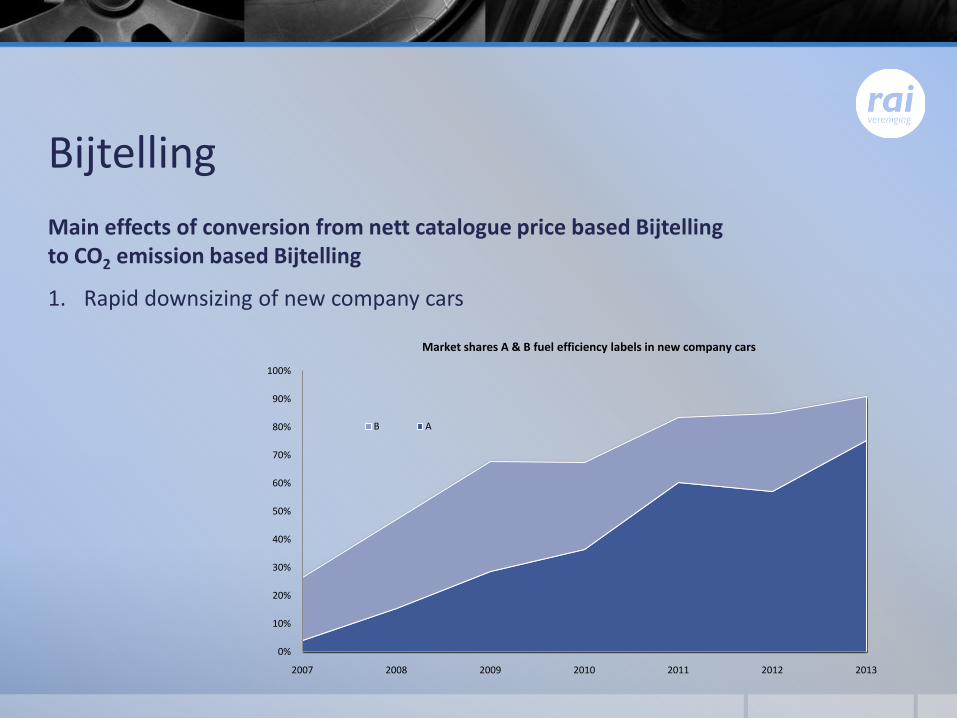
Bijtelling
Main effects of conversion from nett catalogue price based Bijtelling to CO2 emission based Bijtelling
1. Rapid downsizing of new company cars
0%
10%
20%
30%
40%
50%
60%
70%
80%
90%
100%
2007 2008 2009 2010 2011 2012 2013
Market shares A & B fuel efficiency labels in new company cars
B A

Bijtelling
Main effects of conversion from nett catalogue price based Bijtelling to CO2 emission based Bijtelling
1. Rapid downsizing of new company cars
2% 3% 3% 2% 1% 2% 2% 3% 4% 6% 8%14% 15%
10% 11%11% 11% 11% 11% 11% 11% 12% 14% 15% 14% 12%
16%22%
17% 13%
34% 32% 30%26% 23% 25%
26%26% 25%
29% 32%
29%24%
30% 35%
0%
10%
20%
30%
40%
50%
60%
70%
80%
90%
100%
1999 2000 2001 2002 2003 2004 2005 2006 2007 2008 2009 2010 2011 2012 2013
Market share of small cars in new company cars
C Lower Family segment
B City segment
A Small segment
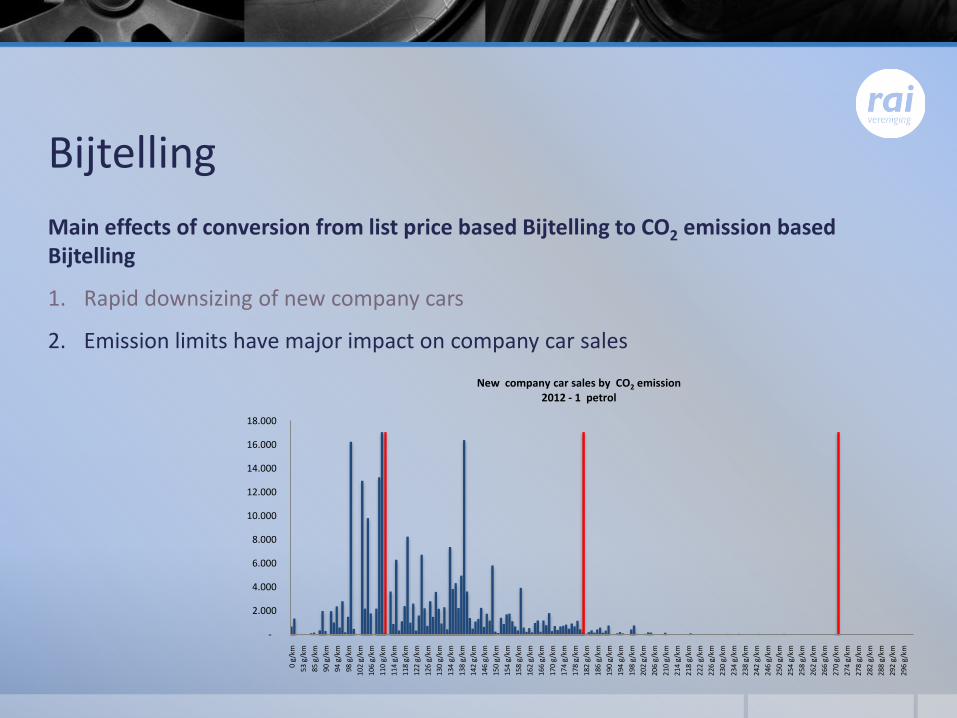
Bijtelling
Main effects of conversion from list price based Bijtelling to CO2 emission basedBijtelling
1. Rapid downsizing of new company cars
2. Emission limits have major impact on company car sales
-
2.000
4.000
6.000
8.000
10.000
12.000
14.000
16.000
18.000
0 g/
km
53 g
/km
85 g
/km
90 g
/km
94 g
/km
98 g
/km
102
g/km
106
g/km
110
g/km
114
g/km
118
g/km
122
g/km
126
g/km
130
g/km
134
g/km
138
g/km
142
g/km
146
g/km
150
g/km
154
g/km
158
g/km
162
g/km
166
g/km
170
g/km
174
g/km
178
g/km
182
g/km
186
g/km
190
g/km
194
g/km
198
g/km
202
g/km
206
g/km
210
g/km
214
g/km
218
g/km
222
g/km
226
g/km
230
g/km
234
g/km
238
g/km
242
g/km
246
g/km
250
g/km
254
g/km
258
g/km
262
g/km
266
g/km
270
g/km
274
g/km
278
g/km
282
g/km
288
g/km
292
g/km
296
g/km
New company car sales by CO2 emission2012 - 1 petrol
Bijtelling
Main effects of conversion from list price based Bijtelling to CO2 emission basedBijtelling
1. Rapid downsizing of new company cars
2. Emission limits have major impact on company car sales
-
2.000
4.000
6.000
8.000
10.000
12.000
14.000
16.000
18.000
0 g/
km
53 g
/km
85 g
/km
90 g
/km
94 g
/km
98 g
/km
102
g/km
106
g/km
110
g/km
114
g/km
118
g/km
122
g/km
126
g/km
130
g/km
134
g/km
138
g/km
142
g/km
146
g/km
150
g/km
154
g/km
158
g/km
162
g/km
166
g/km
170
g/km
174
g/km
178
g/km
182
g/km
186
g/km
190
g/km
194
g/km
198
g/km
202
g/km
206
g/km
210
g/km
214
g/km
218
g/km
222
g/km
226
g/km
230
g/km
234
g/km
238
g/km
242
g/km
246
g/km
250
g/km
254
g/km
258
g/km
262
g/km
266
g/km
270
g/km
274
g/km
278
g/km
282
g/km
288
g/km
292
g/km
296
g/km
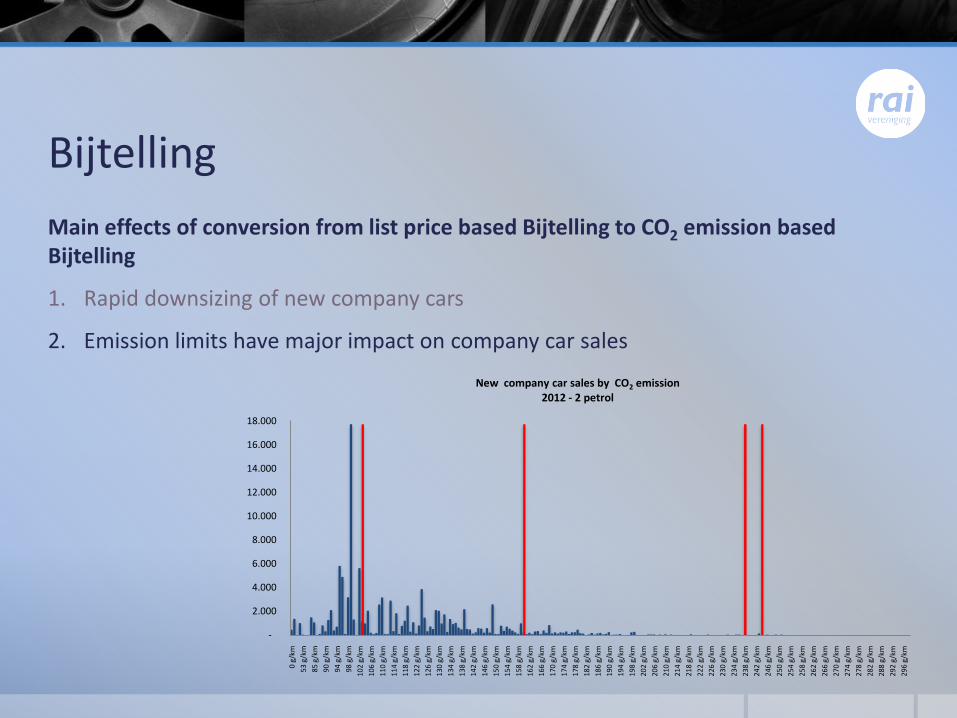
New company car sales by CO2 emission2012 - 2 petrol
Bijtelling
Main effects of conversion from nett catalogue price based Bijtelling to CO2 emission based Bijtelling
1. Rapid downsizing of new company cars
2. Emission limits have major impact on company car sales
-
2.000
4.000
6.000
8.000
10.000
12.000
0 g/
km
86 g
/km
89 g
/km
93 g
/km
96 g
/km
99 g
/km
102
g/km
105
g/km
108
g/km
111
g/km
114
g/km
117
g/km
120
g/km
123
g/km
126
g/km
129
g/km
132
g/km
135
g/km
138
g/km
141
g/km
144
g/km
147
g/km
150
g/km
153
g/km
156
g/km
159
g/km
162
g/km
165
g/km
168
g/km
171
g/km
174
g/km
177
g/km
180
g/km
183
g/km
186
g/km
189
g/km
192
g/km
195
g/km
198
g/km
201
g/km
204
g/km
207
g/km
210
g/km
213
g/km
216
g/km
219
g/km
222
g/km
225
g/km
228
g/km
231
g/km
234
g/km
237
g/km
240
g/km
243
g/km
246
g/km
249
g/km
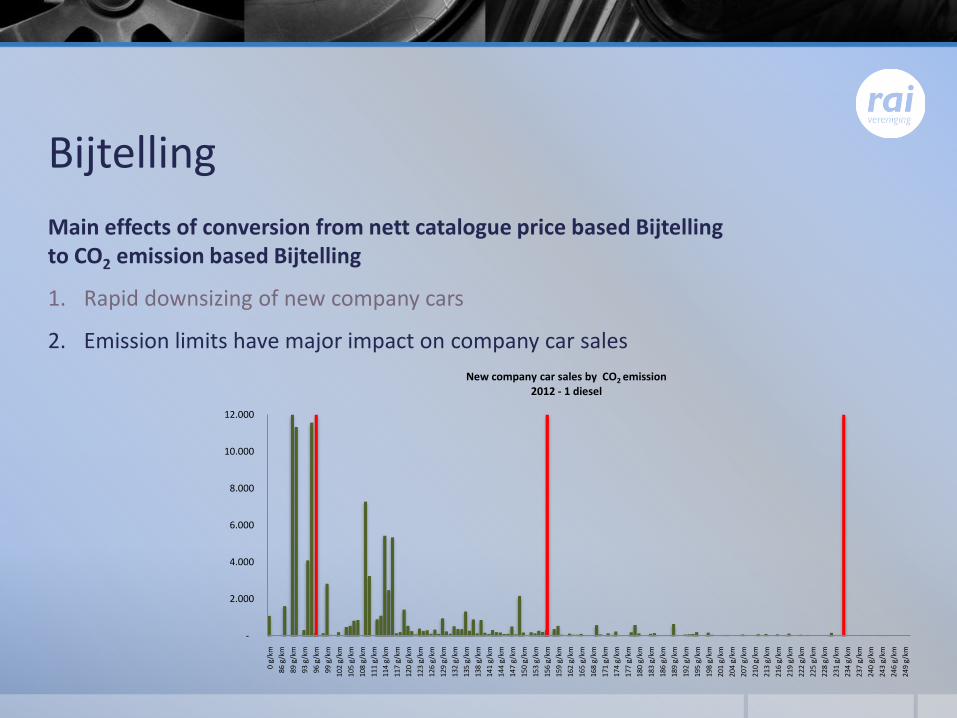
New company car sales by CO2 emission2012 - 1 diesel
Bijtelling
Main effects of conversion from nett catalogue price based Bijtelling to CO2 emission based Bijtelling
1. Rapid downsizing of new company cars
2. Emission limits have major impact on company car sales
-
2.000
4.000
6.000
8.000
10.000
12.000
0 g/
km
86 g
/km
89 g
/km
93 g
/km
96 g
/km
99 g
/km
102
g/km
105
g/km
108
g/km
111
g/km
114
g/km
117
g/km
120
g/km
123
g/km
126
g/km
129
g/km
132
g/km
135
g/km
138
g/km
141
g/km
144
g/km
147
g/km
150
g/km
153
g/km
156
g/km
159
g/km
162
g/km
165
g/km
168
g/km
171
g/km
174
g/km
177
g/km
180
g/km
183
g/km
186
g/km
189
g/km
192
g/km
195
g/km
198
g/km
201
g/km
204
g/km
207
g/km
210
g/km
213
g/km
216
g/km
219
g/km
222
g/km
225
g/km
228
g/km
231
g/km
234
g/km
237
g/km
240
g/km
243
g/km
246
g/km
249
g/km
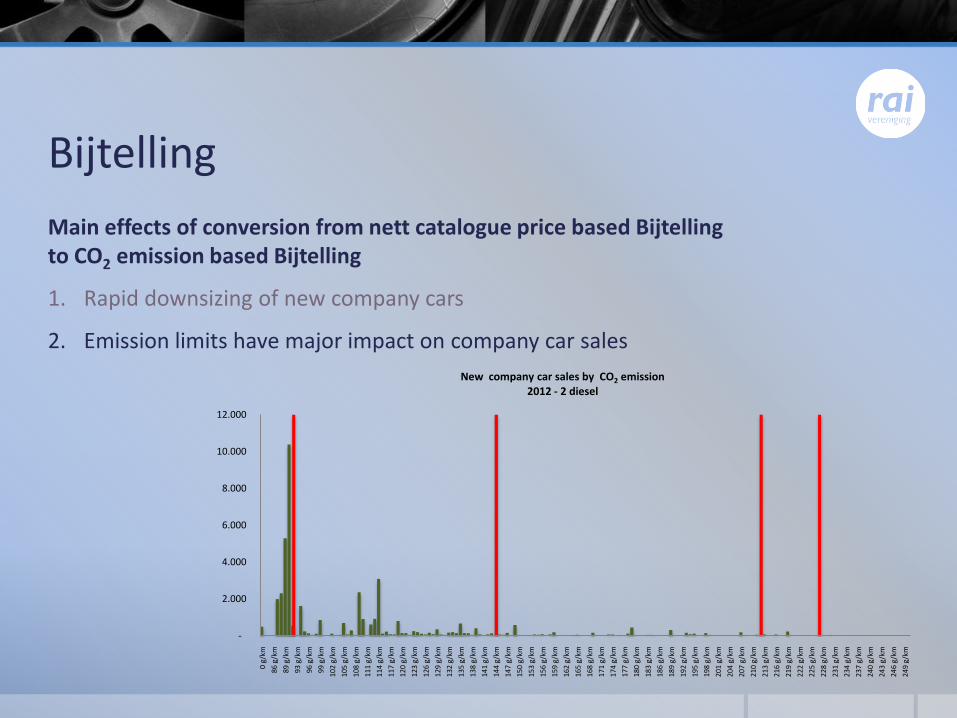
New company car sales by CO2 emission2012 - 2 diesel
Bijtelling
Main effects of conversion from nett catalogue price based Bijtelling to CO2 emission based Bijtelling
1. Rapid downsizing of new company cars
2. Emission limits have major impact on company car sales
3. Rapid decline of tax revenues
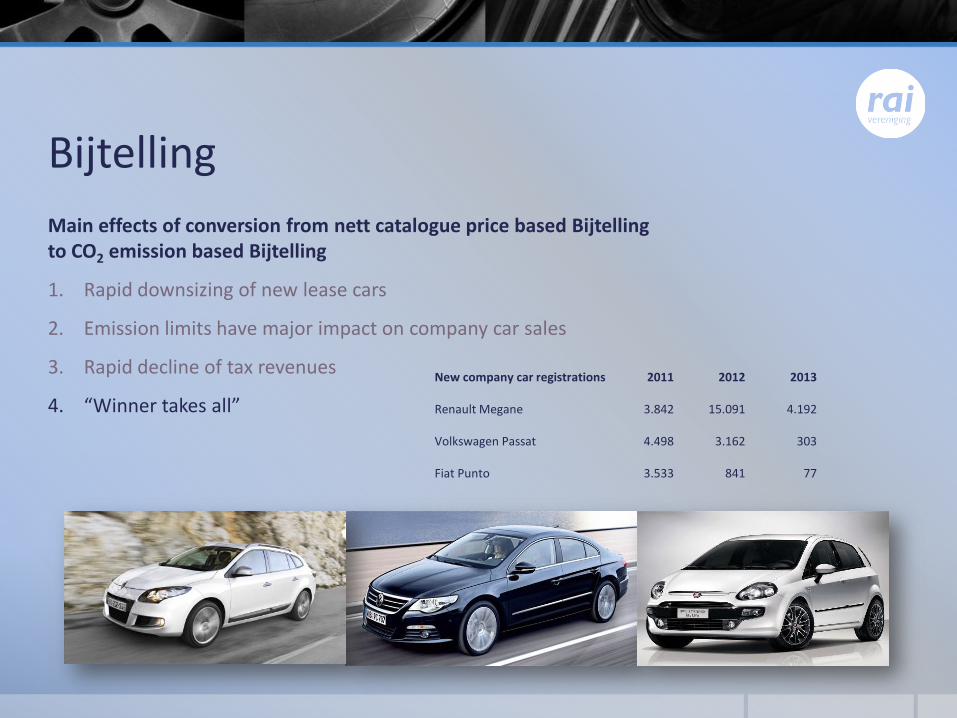
Bijtelling
Main effects of conversion from nett catalogue price based Bijtelling to CO2 emission based Bijtelling
1. Rapid downsizing of new lease cars
2. Emission limits have major impact on company car sales
3. Rapid decline of tax revenues
4. “Winner takes all”
New company car registrations 2011 2012 2013
Renault Megane 3.842 15.091 4.192
Volkswagen Passat 4.498 3.162 303
Fiat Punto 3.533 841 77
Position RAI Vereniging on taxation (1)
Taxation should not be local but on an EU basisCurrently, the Netherlands is among the countries in the EU with the highest car taxation.
Automotive taxes should be efficient and should not cause unnecessary administrative burdens
Automotive taxes should have broad support in politics and society and should be easy to explain
Automotive taxes must be predictable and robust
In the long run, automotive taxes should be technology neutral
Position RAI Vereniging on taxation (2)
The current ‘greening’ of the BPM, annual road tax and ‘bijtelling’ has disproportional and undesirable effects on the car market. Small differences in CO2 emissions can have major consequences.
The different treatment of fuels in taxation delays the introduction of alternative fuels
The BPM, annual road tax and bijtelling are taxes based on the purchase or possession of the car. In the long run, taxation of the use of the car is the only 'sustainable' way of taxation.
Anders Betalen voor Mobiliteit (Introduction of a form of road tax) is RAI Vereniging’s solution for sustainable automotive taxation
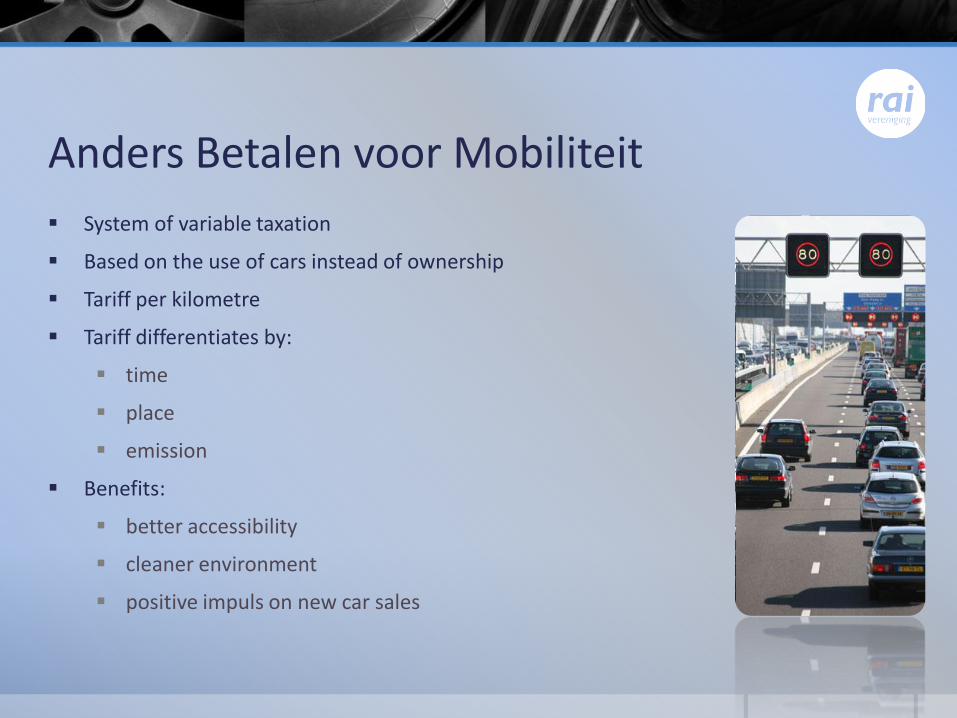
Anders Betalen voor Mobiliteit
System of variable taxation
Based on the use of cars instead of ownership
Tariff per kilometre
Tariff differentiates by:
time
place
emission
Benefits:
better accessibility
cleaner environment
positive impuls on new car sales
Anders Betalen voor Mobiliteit
Critical factors for success
System should be simple and explicable
System must be future-proof
System must not cause major market distortions(new and used cars)
System should encourage replacement of older cars for new cars
System should take into account the development of alternative fuels and drive systems
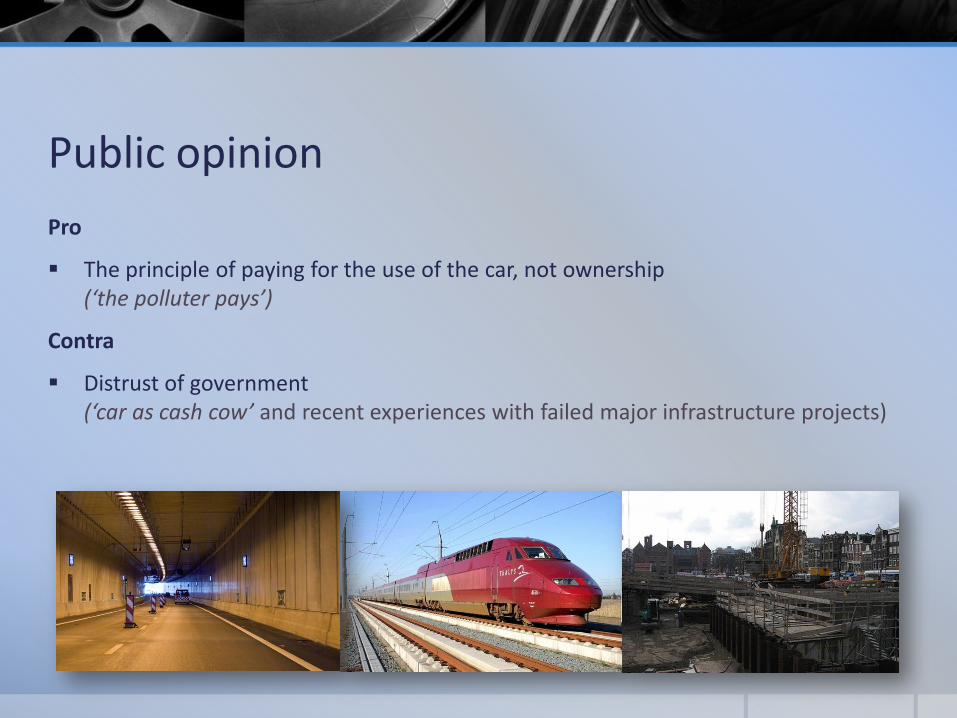
Public opinion
Pro
The principle of paying for the use of the car, not ownership(‘the polluter pays’)
Contra
Distrust of government(‘car as cash cow’ and recent experiences with failed major infrastructure projects)
Recommended