Avian and Bat Studies for the Garden Peninsula Phase I Wind Energy Site:
Summary of Fall 2010 Field Season
Prepared By: Joelle Gehring, Ph.D.
Senior Conservation Scientist-Zoology Leader Michigan State University, Michigan Natural Features Inventory
P.O. Box 30444 Lansing, MI 48909-7944
Prepared For: Heritage Sustainable Energy
121 East Front Street Traverse City, MI 49684-2570
30 January 2011
(revised 28 December 2011)
2
Executive summary
Many areas in Michigan possess winds adequate for the efficient generation of
wind energy, especially areas near the shorelines of the Great Lakes. These shorelines
have also been documented to provide important habitat for wildlife, including migratory
songbirds and raptors. Avian collisions with wind turbines have been documented, but
the frequency of those collisions is site and situation specific. Informed siting of wind
turbines can minimize impacts to birds. In addition to collision risks, some grassland or
open-land bird species are not adapted to using areas near any tall structure, including a
wind turbine, and can be displaced. Due to the potential for avian collisions with wind
turbines or turbine related avian displacement, we conducted surveys of large birds to
better understand the densities of birds in the project areas, as well as the species
composition, habitat use and flight behaviors. These data will help wind energy
developers and resource managers to make appropriate decisions regarding the potential
impacts to birds and the methods by which they might reduce those impacts.
We collected data at 2 raptor and other large bird viewing stations in the Garden
Peninsula Phase I Project Area. We conducted 3-hour surveys at the stations in the fall of
2010. During surveys, each raptor, large bird, and sensitive status species was recorded
in addition to the bird’s flight path, flight direction, approximate flight altitude, and the
distance to each bird from the observer. Technicians also recorded the behavior and
habitat use of each bird, and weather characteristics. Examination of the fall 2010 large
bird survey data suggests that most species’ flight behaviors do not put them at frequent risk
of collisions, as the majority of birds flew below the RSA. However, flight altitudes of
several species are consistent with the potential estimated RSA of the wind turbines
suggesting that the risk of collisions for these species may be higher than for the other
species observed in the area. This is the case with Bald Eagles, Turkey Vultures, Mallards,
and Wood Ducks. The Project Area had much lower passage rates for raptors than regional
designated hawk migration observation sites. Future consideration of external, ongoing
research may be useful in determining the potential risk that wind turbine construction
would provide for these species.
We also collected data on the migrating small birds using the Project Area. No
rare or declining birds were detected during our surveys. The small birds detected in our
3
migration studies were typical of what we would expect to find in this region during the
fall migration, such as Snow Buntings, American Pipets, Black-capped Chickadees, and
some warblers.
In an effort to quantify the bat use and activity of the Project Area, we collected
acoustic, echolocation data (via Anabat SD2 units) to estimate the bat densities in early
August – late November 2010. Low frequency bat calls made up 90% of the total calls
detected, whereas the high frequency calls were only 9% of the calls. The general Myotis
group was qualitatively identified and classified (1.3 bats/ detector night) as were the big
brown bat/sliver-haired bat group, and the Eastern red bat. The Eastern pipistrelle were
present in the area they were not in high enough densities for our acoustic sampling
design to adequately detect and specifically classify them. The species detected were
generally consistent with the open / disturbed / agricultural habitats found in the Project
Area.
The species expected to be in the Project Area that would be most likely to suffer
fatalities at wind turbines include: Eastern red bat, hoary bat, silver-haired bat, and
Eastern pipistrelle. Fatalities can potentially be mitigated using different turbine cut-in
speeds during periods of the year with high risk for bat fatalities. Specifically, Arnett et
al, (2010) determined that if cut-in speeds were increased to 5-6 m per second that
fatalities could be reduced by 43-90%. In addition to changes to cut-in speeds, I
recommend that water sources and forest edges be buffered in the micro-siting of wind
turbines.
4
Table of contents Page
Introduction……………………………………………………… 4
Study Site and Methods…………………………………………. 6
Study site and description……………………………………….. 6
Large bird surveys……………………………………………….. 7
Songbird surveys…..…………………………………………….. 10
Bat acoustic data collection..…………………………………… 12
Bat acoustics data analysis…… ……………………………….. 13
Results and Summary…………………………………………… 14
Large bird surveys - all observation sites combined…………… 14
Large bird surveys – Site 1………………………….….….…… 17
Large bird surveys – Site 2…………………………..…….…… 18
Summary of large bird flight behavior in the project area……… 18
Fall Small bird surveys…..………………………………………. 20
Bat acoustics results……………………………………………… 23
Comparison of bat vocalization frequency……………………… 24
Conclusion and summary……………………………………….. 25
Additional efforts to consider the potential impact
of the Project on birds and bats………………………… 25
Acknowledgements……………………………………………… 26
Literature Cited…………………………………………………. 26
Appendix 1…………………………………………………….... 30
Introduction
The development of wind energy has the potential to significantly reduce the
emissions of harmful air pollutants, greenhouse gases, and our reliance on fossil fuels.
The U.S. Department of Energy has a goal of 10 GW of wind energy deployment in
Michigan by the year 2030, and Michigan currently has only about 150 MW deployed - a
99% gap between potential and capacity. The interconnection queue for the Midwest
Independent (Transmission) System Operator (MISO) presently includes requests for the
interconnection in Michigan of approximately 3,000 MW of wind turbines. The majority
5
of the areas with high potential for wind energy generation are near the shorelines of the
Great Lakes. These shorelines have also been documented to provide important habitat
for wildlife, including migratory songbirds and raptors. Shoreline areas have been
suggested to be important as stopover sites for Neotropical migratory birds (Ewert 2006,
Diehl et al. 2003) and as concentration or funneling areas for migrating raptors which
avoid crossing large areas of water (Kerlinger 1989). Waterfowl (e.g., Common Loon)
and waterbirds (e.g., gulls, herons, cranes) also use shoreline areas especially during the
breeding and migration seasons. Research across North America has demonstrated a
relationship between the densities of birds in an area and the numbers of avian collisions.
Avian collisions with wind turbines have been documented but the frequency of
those collisions is site and situation specific. Songbird collisions with turbines, as well as
with other tall structures, are related to the lighting systems of the structure (Gehring et
al. 2009). Songbirds can become attracted to non-blinking lights, especially during
nocturnal migration; thereby, increasing their risk of collision with any structure
illuminated with these types of lights. Most turbines are lit with Federal Aviation
Administration recommended blinking lights which decreases the likelihood of songbirds
becoming attracted into the site. Birds that use the airspace within the rotor swept area of
a turbine are at risk of a collision and therefore the frequency of avian collisions at
turbine sites can be directly correlated to the density of birds at the turbine site.
In addition to collision risks, some grassland or open-land nesting bird species are
not adapted to nesting or otherwise using habitat near any tall structure, including a wind
turbine (Strickland 2004). These species can be displaced from traditional nesting and
foraging areas upon construction of a nearby wind turbine (Leddy et al. 1999).
Due to the potential for avian collisions with wind turbines or turbine related
avian displacement from areas previously used we conducted surveys of both large birds
and songbirds to better understand the densities of birds in the area as well as the species
composition, habitat use and flight behaviors. These data will help wind energy
developers and resource managers to make appropriate decisions regarding the potential
impacts to birds and the methods in which they might reduce those impacts.
6
Study Site and Methods
Study site and description
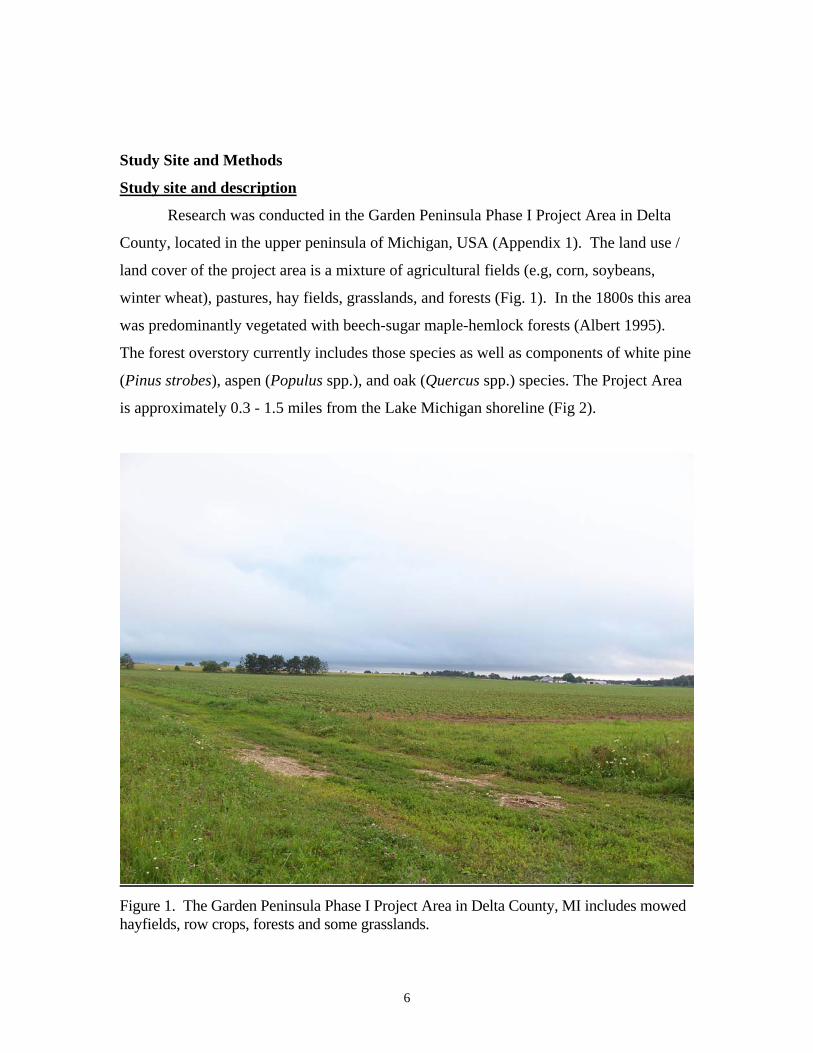
Research was conducted in the Garden Peninsula Phase I Project Area in Delta
County, located in the upper peninsula of Michigan, USA (Appendix 1). The land use /
land cover of the project area is a mixture of agricultural fields (e.g, corn, soybeans,
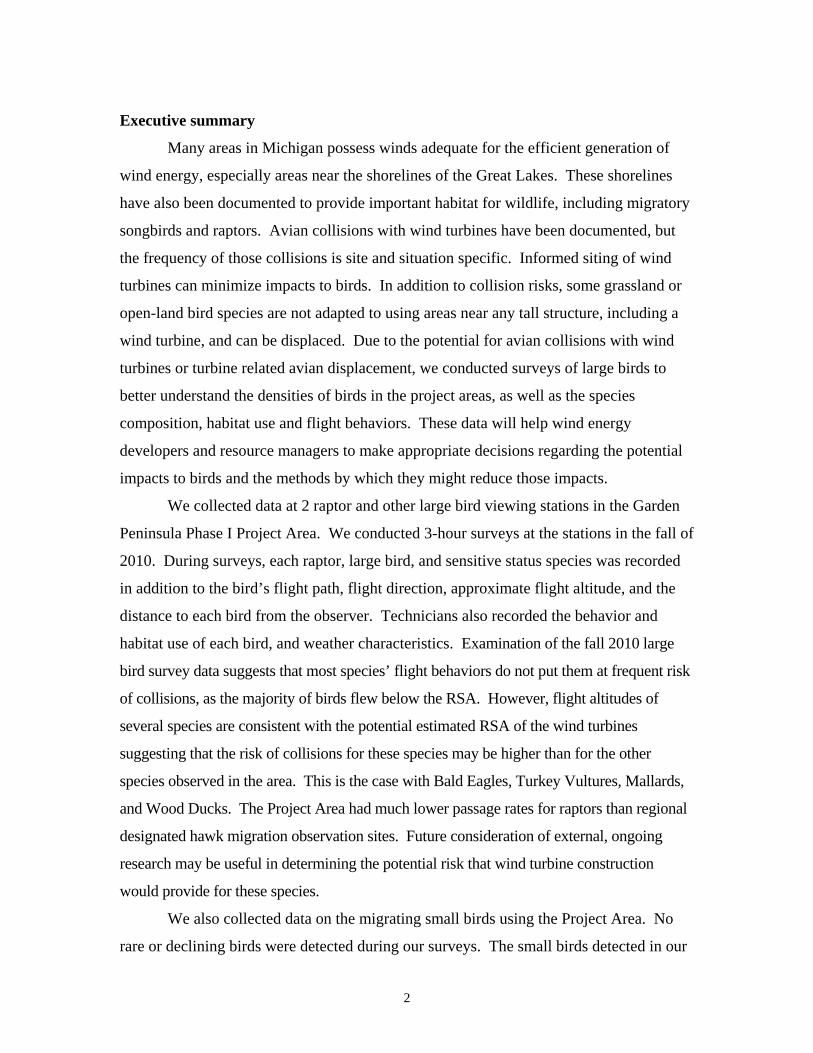
winter wheat), pastures, hay fields, grasslands, and forests (Fig. 1). In the 1800s this area
was predominantly vegetated with beech-sugar maple-hemlock forests (Albert 1995).
The forest overstory currently includes those species as well as components of white pine
(Pinus strobes), aspen (Populus spp.), and oak (Quercus spp.) species. The Project Area
is approximately 0.3 - 1.5 miles from the Lake Michigan shoreline (Fig 2).
Figure 1. The Garden Peninsula Phase I Project Area in Delta County, MI includes mowed hayfields, row crops, forests and some grasslands.
7
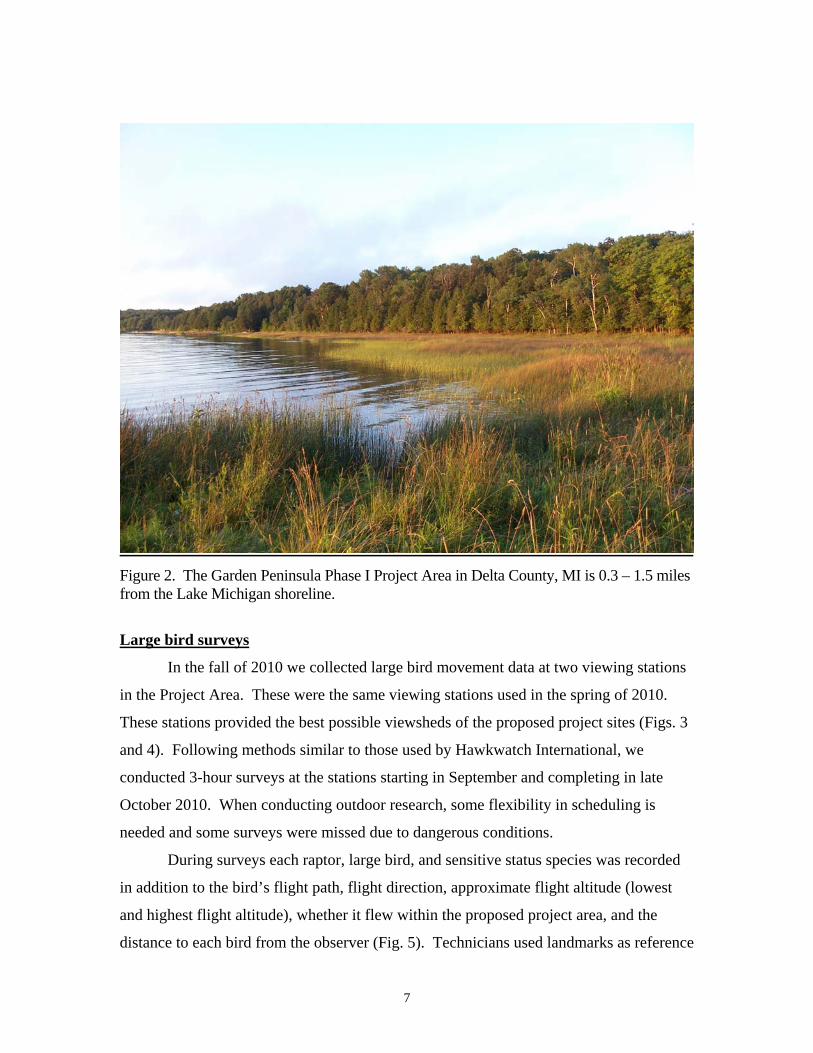
Figure 2. The Garden Peninsula Phase I Project Area in Delta County, MI is 0.3 – 1.5 miles from the Lake Michigan shoreline.
Large bird surveys
In the fall of 2010 we collected large bird movement data at two viewing stations
in the Project Area. These were the same viewing stations used in the spring of 2010.
These stations provided the best possible viewsheds of the proposed project sites (Figs. 3
and 4). Following methods similar to those used by Hawkwatch International, we
conducted 3-hour surveys at the stations starting in September and completing in late
October 2010. When conducting outdoor research, some flexibility in scheduling is
needed and some surveys were missed due to dangerous conditions.
During surveys each raptor, large bird, and sensitive status species was recorded
in addition to the bird’s flight path, flight direction, approximate flight altitude (lowest
and highest flight altitude), whether it flew within the proposed project area, and the
distance to each bird from the observer (Fig. 5). Technicians used landmarks as reference
8
when measuring distance to birds and flight altitude. Technicians also recorded the
behavior and habitat use of each bird. Behavior categories were as follows: perched
(PE), soaring (SO), flapping (FL), flushed (FH), circle soaring (CS), hunting (HU),
gliding (GL), and other (OT, noted in comments). Any comments or unusual
observations were also noted. Weather data were collected in concert with large bird
surveys; specifically, temperature, wind speed, wind direction, and cloud cover. The
date, start, and end time of observation period, species or best possible identification,
number of individuals, gender and age class, distance from plot center when first
observed, closest distance, height above ground, activity, and habitat(s) were recorded.
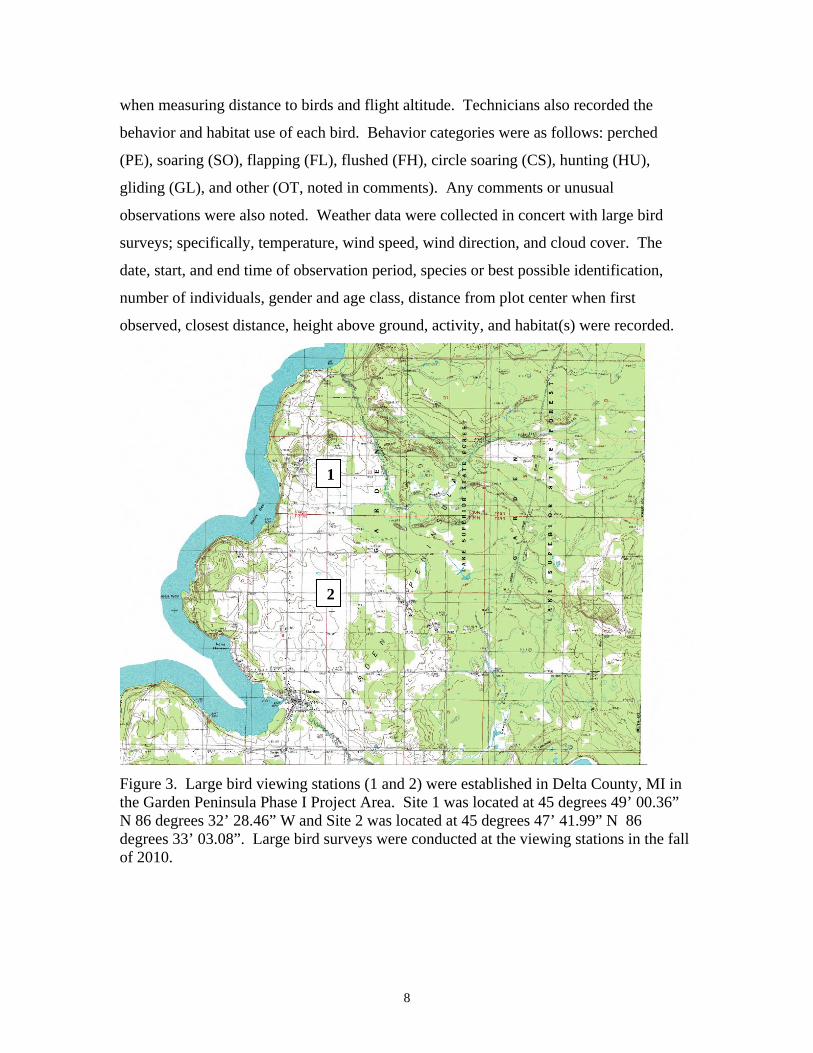
Figure 3. Large bird viewing stations (1 and 2) were established in Delta County, MI in the Garden Peninsula Phase I Project Area. Site 1 was located at 45 degrees 49’ 00.36” N 86 degrees 32’ 28.46” W and Site 2 was located at 45 degrees 47’ 41.99” N 86 degrees 33’ 03.08”. Large bird surveys were conducted at the viewing stations in the fall of 2010.
2
1

9
Figure 4. Large bird viewing stations (1 and 2) were established in Delta County, MI in the Garden Peninsula Phase I Project Area. Large bird surveys were conducted at the viewing stations in the fall of 2010.
2
1
10
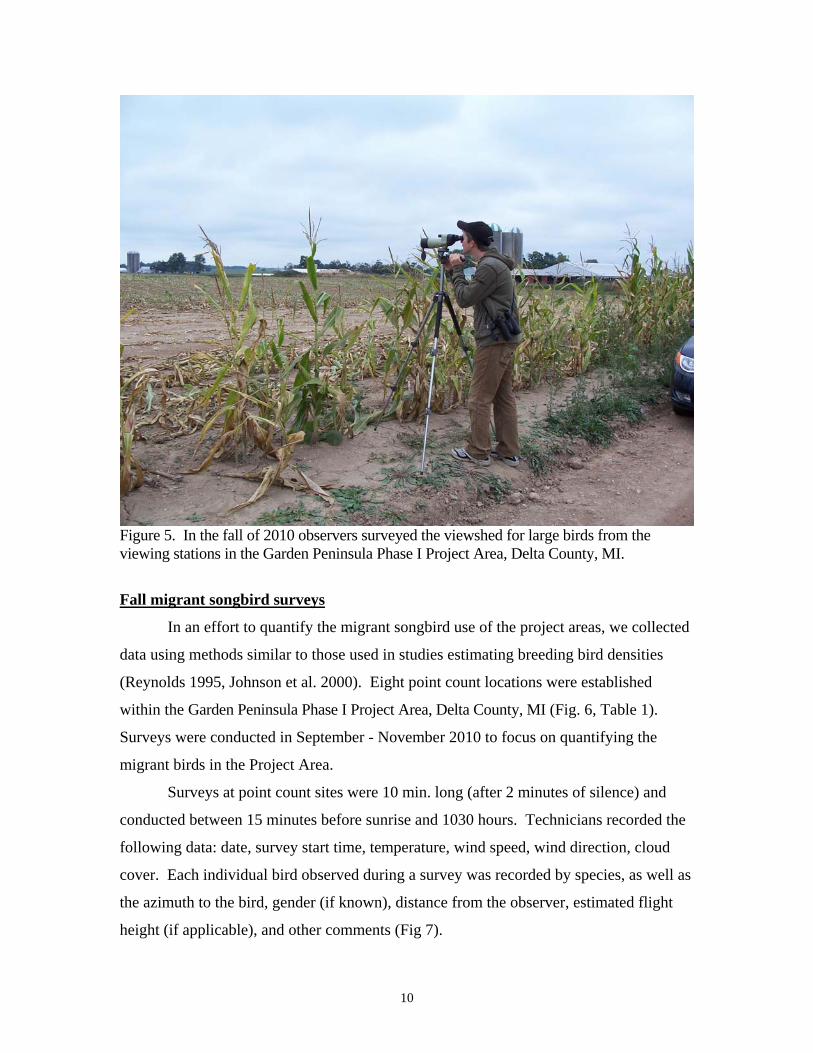
Figure 5. In the fall of 2010 observers surveyed the viewshed for large birds from the viewing stations in the Garden Peninsula Phase I Project Area, Delta County, MI.
Fall migrant songbird surveys
In an effort to quantify the migrant songbird use of the project areas, we collected
data using methods similar to those used in studies estimating breeding bird densities
(Reynolds 1995, Johnson et al. 2000). Eight point count locations were established
within the Garden Peninsula Phase I Project Area, Delta County, MI (Fig. 6, Table 1).
Surveys were conducted in September - November 2010 to focus on quantifying the
migrant birds in the Project Area.
Surveys at point count sites were 10 min. long (after 2 minutes of silence) and
conducted between 15 minutes before sunrise and 1030 hours. Technicians recorded the
following data: date, survey start time, temperature, wind speed, wind direction, cloud
cover. Each individual bird observed during a survey was recorded by species, as well as
the azimuth to the bird, gender (if known), distance from the observer, estimated flight
height (if applicable), and other comments (Fig 7).
11
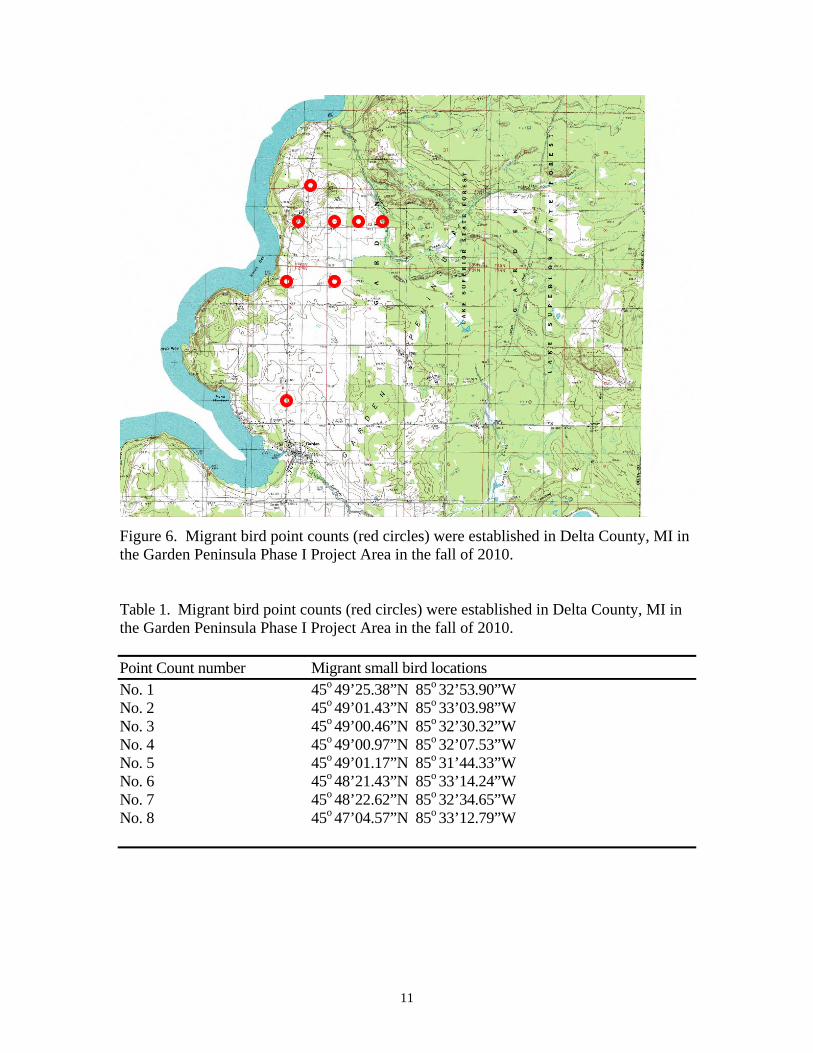
Figure 6. Migrant bird point counts (red circles) were established in Delta County, MI in the Garden Peninsula Phase I Project Area in the fall of 2010. Table 1. Migrant bird point counts (red circles) were established in Delta County, MI in the Garden Peninsula Phase I Project Area in the fall of 2010. Point Count number Migrant small bird locations No. 1 45o 49’25.38”N 85o 32’53.90”W No. 2 45o 49’01.43”N 85o 33’03.98”W No. 3 45o 49’00.46”N 85o 32’30.32”W No. 4 45o 49’00.97”N 85o 32’07.53”W No. 5 45o 49’01.17”N 85o 31’44.33”W No. 6 45o 48’21.43”N 85o 33’14.24”W No. 7 45o 48’22.62”N 85o 32’34.65”W No. 8 45o 47’04.57”N 85o 33’12.79”W
12
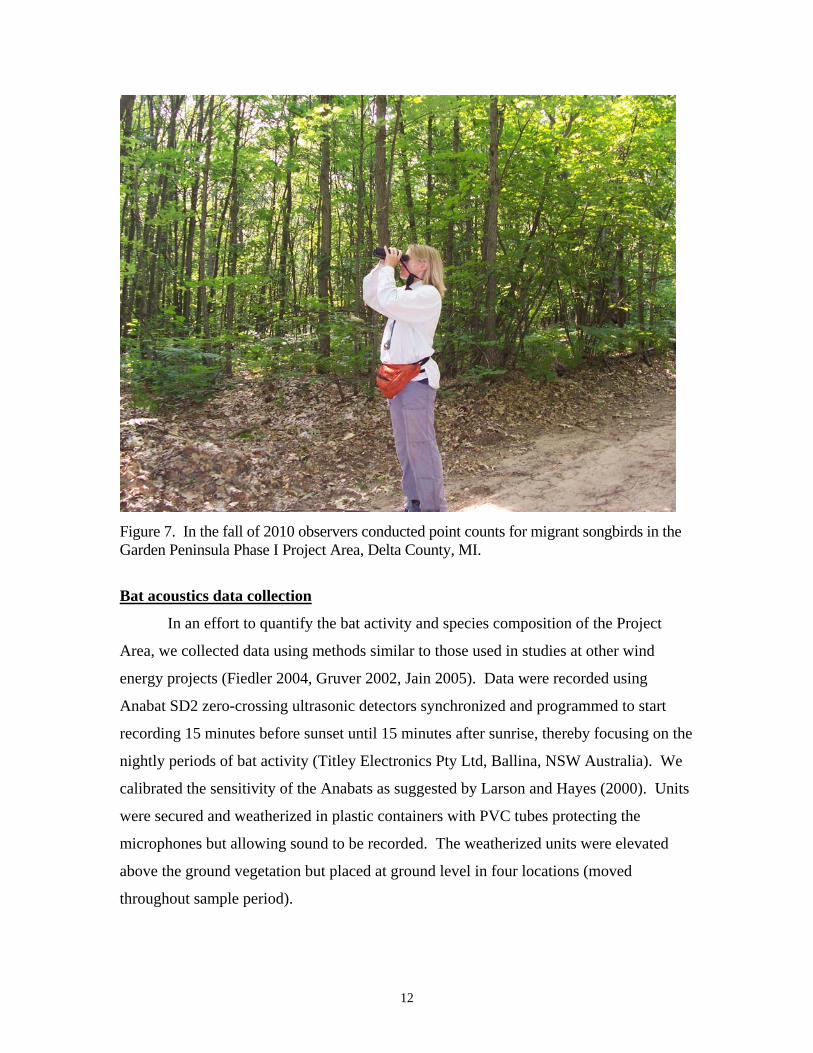
Figure 7. In the fall of 2010 observers conducted point counts for migrant songbirds in the Garden Peninsula Phase I Project Area, Delta County, MI.
Bat acoustics data collection
In an effort to quantify the bat activity and species composition of the Project
Area, we collected data using methods similar to those used in studies at other wind
energy projects (Fiedler 2004, Gruver 2002, Jain 2005). Data were recorded using
Anabat SD2 zero-crossing ultrasonic detectors synchronized and programmed to start
recording 15 minutes before sunset until 15 minutes after sunrise, thereby focusing on the
nightly periods of bat activity (Titley Electronics Pty Ltd, Ballina, NSW Australia). We
calibrated the sensitivity of the Anabats as suggested by Larson and Hayes (2000). Units
were secured and weatherized in plastic containers with PVC tubes protecting the
microphones but allowing sound to be recorded. The weatherized units were elevated
above the ground vegetation but placed at ground level in four locations (moved
throughout sample period).

13
Figure 8. Two Anabats were installed in four locations to collect bat acoustic data in the Garden Peninsula Project Area in Michigan.
Bat acoustic data analysis
We used the data analysis techniques and definitions suggested by Hayes (2000),
Sherwin et al. (2000), and Gannon et al. (2003). Specifically, a “call” was defined as a
sequence with duration greater than 10 milliseconds (ms) and including >2 individual
calls (Thomas 1988, O’Farrell and Gannon 1999, and Gannon et al. 2003); and calls were
considered to be separate events and independent.
Data from the entire survey period were downloaded and processed. Before
analysis began all non-bat ultrasonic detections were eliminated from the data set using
Analook filters. Remaining data were then separated into two groups based on their
minimum frequency of the call; with high frequency calls defined as >35 kHz and low
frequency calls defined as <35 kHz calls. These Analook filters were developed by
Britzke and Murray (2000) and included a Smoothness value of 15 and a Bodyover value
of 240 which assisted in removing additional noise in the data such as echoes, extraneous
Anabat #1
Anabat #3
Anabat #4
Anabat #2
14
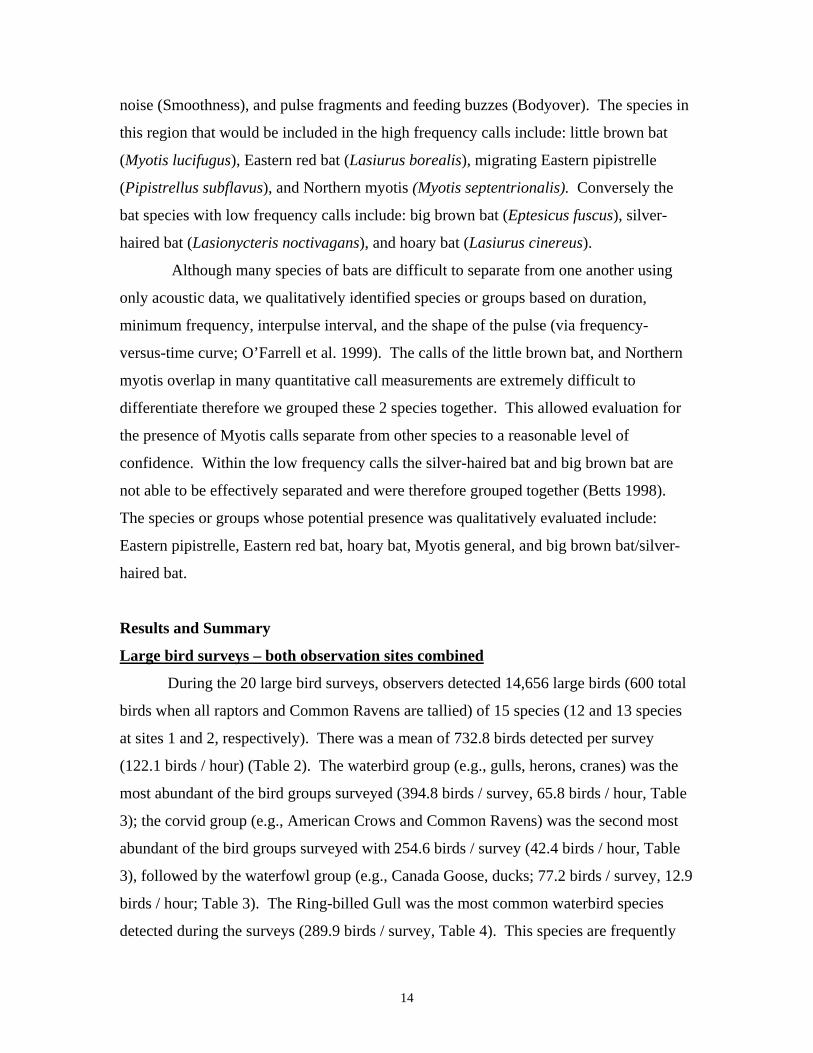
noise (Smoothness), and pulse fragments and feeding buzzes (Bodyover). The species in
this region that would be included in the high frequency calls include: little brown bat
(Myotis lucifugus), Eastern red bat (Lasiurus borealis), migrating Eastern pipistrelle
(Pipistrellus subflavus), and Northern myotis (Myotis septentrionalis). Conversely the
bat species with low frequency calls include: big brown bat (Eptesicus fuscus), silver-
haired bat (Lasionycteris noctivagans), and hoary bat (Lasiurus cinereus).
Although many species of bats are difficult to separate from one another using
only acoustic data, we qualitatively identified species or groups based on duration,
minimum frequency, interpulse interval, and the shape of the pulse (via frequency-
versus-time curve; O’Farrell et al. 1999). The calls of the little brown bat, and Northern
myotis overlap in many quantitative call measurements are extremely difficult to
differentiate therefore we grouped these 2 species together. This allowed evaluation for
the presence of Myotis calls separate from other species to a reasonable level of
confidence. Within the low frequency calls the silver-haired bat and big brown bat are
not able to be effectively separated and were therefore grouped together (Betts 1998).
The species or groups whose potential presence was qualitatively evaluated include:
Eastern pipistrelle, Eastern red bat, hoary bat, Myotis general, and big brown bat/silver-
haired bat.
Results and Summary
Large bird surveys – both observation sites combined
During the 20 large bird surveys, observers detected 14,656 large birds (600 total
birds when all raptors and Common Ravens are tallied) of 15 species (12 and 13 species
at sites 1 and 2, respectively). There was a mean of 732.8 birds detected per survey
(122.1 birds / hour) (Table 2). The waterbird group (e.g., gulls, herons, cranes) was the
most abundant of the bird groups surveyed (394.8 birds / survey, 65.8 birds / hour, Table
3); the corvid group (e.g., American Crows and Common Ravens) was the second most
abundant of the bird groups surveyed with 254.6 birds / survey (42.4 birds / hour, Table
3), followed by the waterfowl group (e.g., Canada Goose, ducks; 77.2 birds / survey, 12.9
birds / hour; Table 3). The Ring-billed Gull was the most common waterbird species
detected during the surveys (289.9 birds / survey, Table 4). This species are frequently

15
found in high numbers in close proximity to large waterbodies such as Lake Michigan.
Gulls can also be associated with farming practices (e.g., tilling, planting) that expose
invertebrates and other food items. The raptor group is often a focus of concern when
considering the potential impacts of wind farm construction. The Bald Eagle was the
most common raptor species detected (2.5 birds / survey, Table 4). The Rough-legged
Hawk was also detected in relatively high numbers (1.9 birds / survey; Table 4). Five
other raptor species were detected but in lower numbers (Table 4).
Assuming the wind turbine rotor-swept area (RSA) would be 54 – 146 m above
the ground (AGL), 84.2% of all birds used areas below the RSA, 13.0% within the RSA,
and 2.8% flew above the RSA. The mean flight altitude of the most common raptor
species, the Bald Eagle, was 51.4 m AGL with 65% flying below the RSA and 35%
within the RSA (Table 5).
Table 2. Large bird abundance and richness in Delta County, MI in the Garden Peninsula Phase I Project Area proposed for the development of wind energy by Heritage Sustainable Energy. Data were collected in the fall of 2010 at 2 large bird survey sites. Large Bird Survey Total No. 1 No. 2 No. Species 15 12 13 Mean No. Species / Survey 0.75 1.2 1.3 Mean No. Species / Hour 0.25 0.2 0.2 Mean No. Birds / Survey 732.8 278.6 908.8 Mean No. Birds / Hour 122.1 92.9 151.5 Table 3. Mean bird abundance in Delta County, MI in the Garden Peninsula Phase I Project Area proposed for the development of wind energy by Heritage Sustainable Energy. Data were collected in the fall of 2010 at 2 large bird survey sites. _________________________________________________________________________ Group Mean Abundance a Total No. 1 No. 2 Waterfowl 77.2 103.8 50.6 Waterbirds 394.8 123.6 666.0 Raptors 6.0 5.2 7.0 Corvids 254.6 324.6 184.8 a Mean Abundance = mean number of individuals observed per survey
16
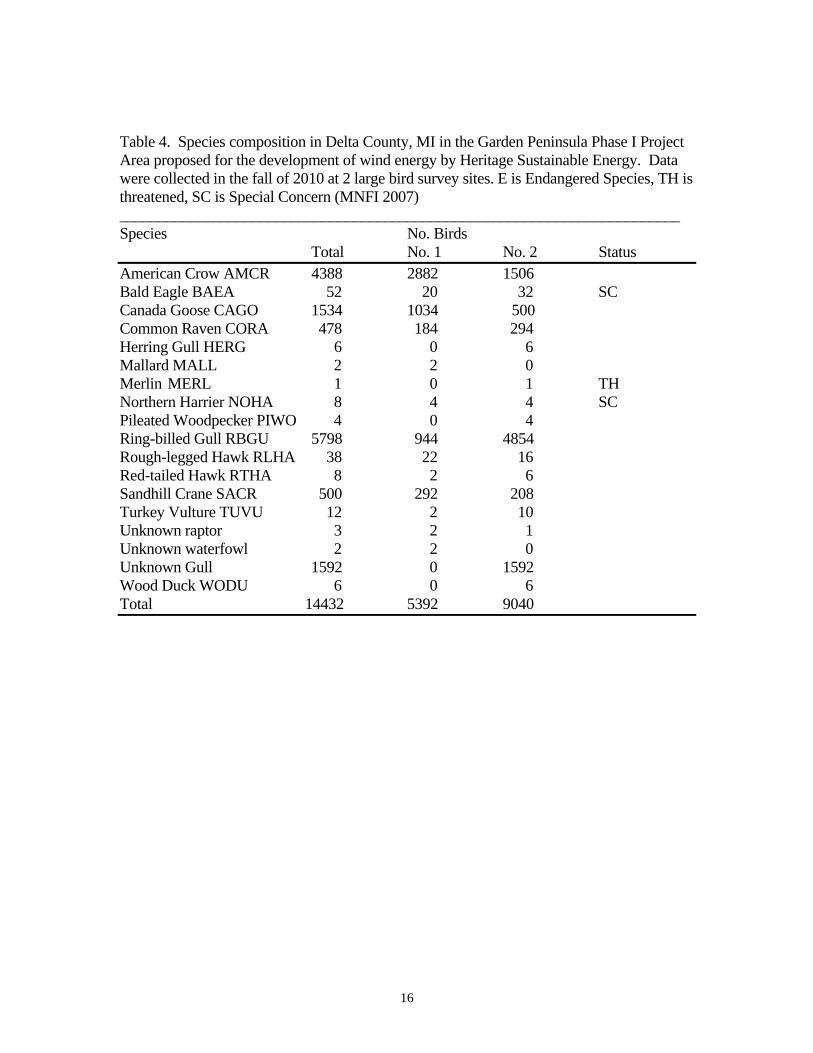
Table 4. Species composition in Delta County, MI in the Garden Peninsula Phase I Project Area proposed for the development of wind energy by Heritage Sustainable Energy. Data were collected in the fall of 2010 at 2 large bird survey sites. E is Endangered Species, TH is threatened, SC is Special Concern (MNFI 2007) ________________________________________________________________________ Species No. Birds Total No. 1 No. 2 Status American Crow AMCR 4388 2882 1506 Bald Eagle BAEA 52 20 32 SC Canada Goose CAGO 1534 1034 500 Common Raven CORA 478 184 294 Herring Gull HERG 6 0 6 Mallard MALL 2 2 0 Merlin MERL 1 0 1 TH Northern Harrier NOHA 8 4 4 SC Pileated Woodpecker PIWO 4 0 4 Ring-billed Gull RBGU 5798 944 4854 Rough-legged Hawk RLHA 38 22 16 Red-tailed Hawk RTHA 8 2 6 Sandhill Crane SACR 500 292 208 Turkey Vulture TUVU 12 2 10 Unknown raptor 3 2 1 Unknown waterfowl 2 2 0 Unknown Gull 1592 0 1592 Wood Duck WODU 6 0 6 Total 14432 5392 9040

17
Table 5. Species flight height (upon first observation) distribution in Delta County, MI in the Garden Peninsula Phase I Project Area proposed for the development of wind energy by Heritage Sustainable Energy. Data were collected in the fall of 2010 at 2 large bird survey sites. The estimated Rotor Swept Area (RSA) was 54 m – 146 m above ground level. ________________________________________________________________________ Species Proportion Below RSA Within RSA Above RSA American Crow AMCR 79 22 0 Bald Eagle BAEA 65 35 0 Canada Goose CAGO 89 11 0 Common Raven CORA 75 23 2 Herring Gull HERG 100 0 0 Mallard MALL 100 0 0 Merlin MERL 100 0 0 Northern Harrier NOHA 100 0 0 Pileated Woodpecker PIWO 100 0 0 Ring-billed Gull RBGU 92 8 0 Rough-legged Hawk RLHA 74 26 0 Red-tailed Hawk RTHA 100 0 0 Sandhill Crane SACR 99 1 0 Turkey Vulture TUVU 50 33 17 Unknown raptor 100 0 0 Unknown waterfowl 100 0 0 Unknown Gull 91 9 0 Wood Duck WODU 100 0 0
Large bird surveys – Fall 2010, Site 1
Observers detected 5,572 large birds of 12 species. There was a mean of 278.6
birds detected per survey (92.9 birds / hour) (Table 2). The corvid group (e.g., American
Crows and Common Ravens) was the most abundant of the bird groups surveyed (324.6
birds / survey, 54.1 birds / hour, Table 3); waterbird group (e.g., gulls, herons, cranes)
was the second most abundant with 123.6 birds / survey (20.6 birds / hour; Table 2),
followed by the waterfowl group (e.g., Canada Goose, ducks; 103.8 birds / survey; 17.3
birds / hour, Table 3). The American Crow was the most common corvid species
detected during the surveys (288.2 birds / survey, Table 4). Like gulls, American Crows
are frequently found in high numbers in close proximity to human dominated landscapes,
including agricultural land where farming practices (e.g., tilling, planting) expose
invertebrates and other food items. The raptor group is often a focus of concern when
considering the potential impacts of wind farm construction. The Rough-legged Hawk
18
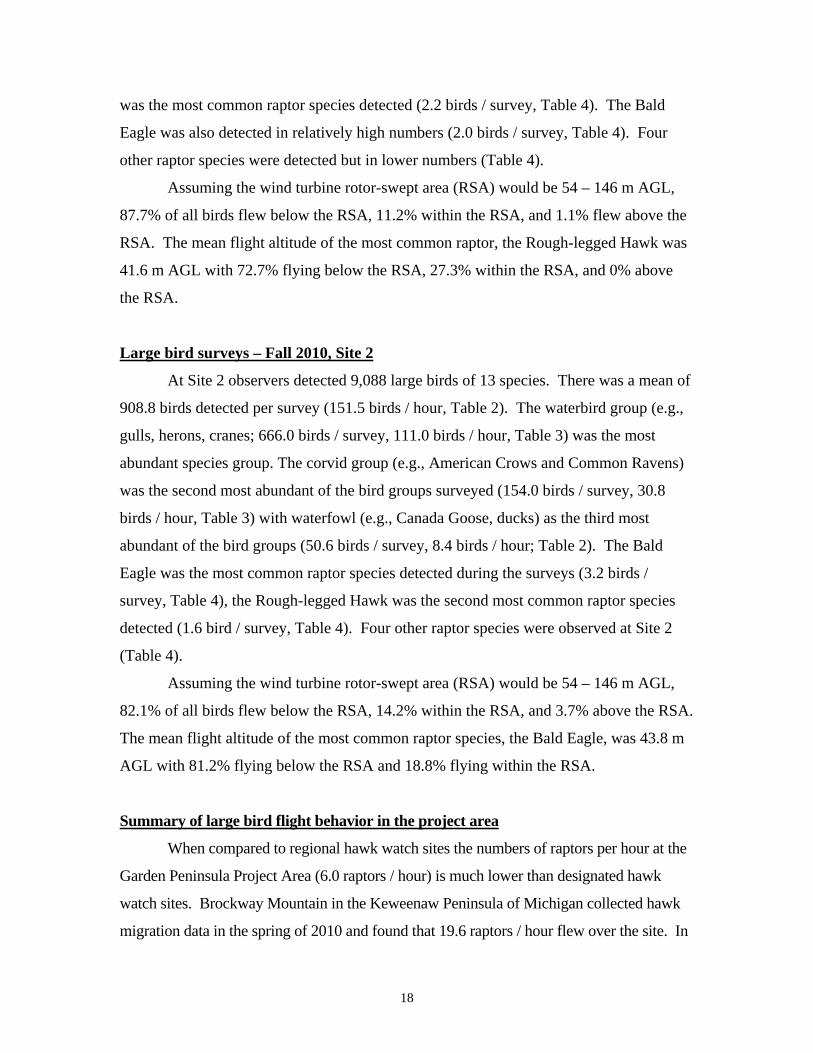
was the most common raptor species detected (2.2 birds / survey, Table 4). The Bald
Eagle was also detected in relatively high numbers (2.0 birds / survey, Table 4). Four
other raptor species were detected but in lower numbers (Table 4).
Assuming the wind turbine rotor-swept area (RSA) would be 54 – 146 m AGL,
87.7% of all birds flew below the RSA, 11.2% within the RSA, and 1.1% flew above the
RSA. The mean flight altitude of the most common raptor, the Rough-legged Hawk was
41.6 m AGL with 72.7% flying below the RSA, 27.3% within the RSA, and 0% above
the RSA.
Large bird surveys – Fall 2010, Site 2
At Site 2 observers detected 9,088 large birds of 13 species. There was a mean of
908.8 birds detected per survey (151.5 birds / hour, Table 2). The waterbird group (e.g.,
gulls, herons, cranes; 666.0 birds / survey, 111.0 birds / hour, Table 3) was the most
abundant species group. The corvid group (e.g., American Crows and Common Ravens)
was the second most abundant of the bird groups surveyed (154.0 birds / survey, 30.8
birds / hour, Table 3) with waterfowl (e.g., Canada Goose, ducks) as the third most
abundant of the bird groups (50.6 birds / survey, 8.4 birds / hour; Table 2). The Bald
Eagle was the most common raptor species detected during the surveys (3.2 birds /
survey, Table 4), the Rough-legged Hawk was the second most common raptor species
detected (1.6 bird / survey, Table 4). Four other raptor species were observed at Site 2
(Table 4).
Assuming the wind turbine rotor-swept area (RSA) would be 54 – 146 m AGL,
82.1% of all birds flew below the RSA, 14.2% within the RSA, and 3.7% above the RSA.
The mean flight altitude of the most common raptor species, the Bald Eagle, was 43.8 m
AGL with 81.2% flying below the RSA and 18.8% flying within the RSA.
Summary of large bird flight behavior in the project area
When compared to regional hawk watch sites the numbers of raptors per hour at the
Garden Peninsula Project Area (6.0 raptors / hour) is much lower than designated hawk
watch sites. Brockway Mountain in the Keweenaw Peninsula of Michigan collected hawk
migration data in the spring of 2010 and found that 19.6 raptors / hour flew over the site. In

19
Whitefish Point, MI 27.3 raptors / hour were observed in the spring of 2010. No fall 2010
raptor data were found for the either site; however, it is expected that the numbers of raptors
would be even fewer than in the spring due to the geography of the Keweenaw Peninsula
and Whitefish Point in relation to the direction of raptor migration.
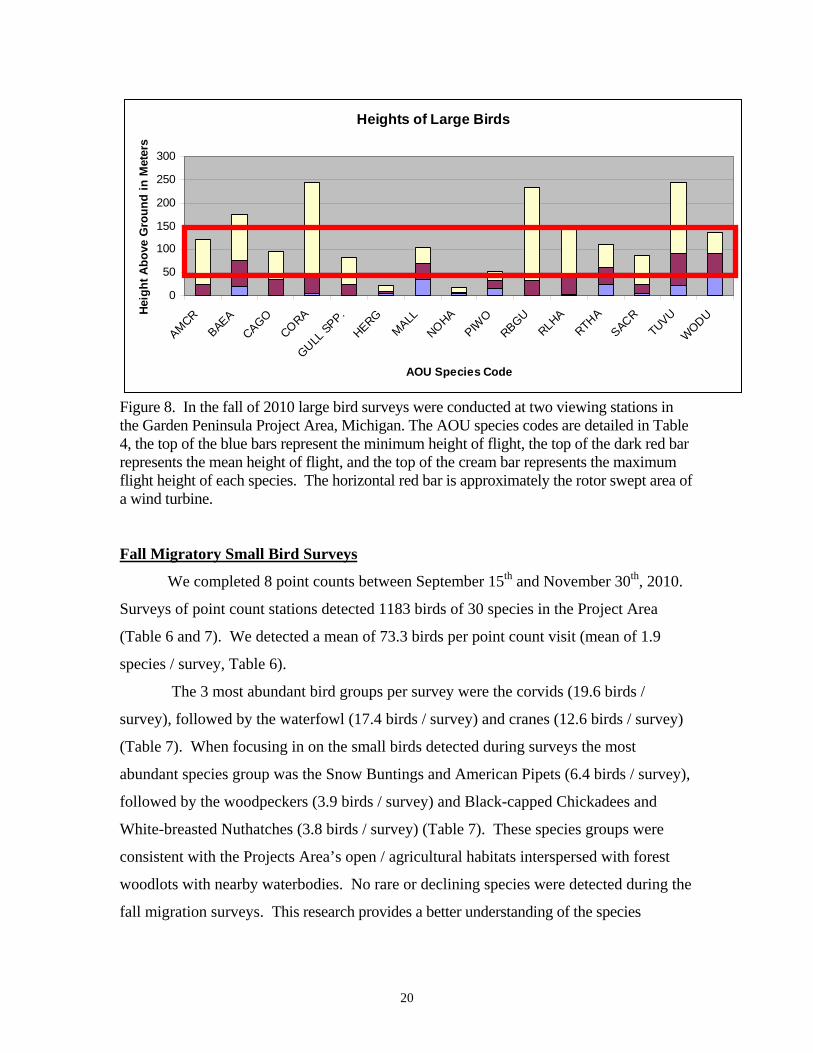
The fall 2010 large bird survey data demonstrated that the majority of birds flew
below the RSA. However, flight altitudes of several species were consistent with the
potential estimated RSA of the wind turbines suggesting that the risk of collisions for these
species may be higher than for the other species observed in the area (Fig. 8). This was the
case with Bald Eagles, Turkey Vultures, Mallards, and Wood Ducks. Site 1 had higher
numbers of Canada Goose detections and American Crows and Site 2 had more gulls
present. Often Canada Goose detections are related to the species loafing and foraging in
agricultural fields within the project area. While our collective understanding of avian
collision issues is always increasing, currently waterfowl are not believed to collide with
wind turbines as frequently as some other avian groups such as raptors. Some waterfowl
species have actually been documented to avoid turbines in their flight paths (Desholm
and Kahlert 2006). The high densities of gulls in the Project Area could lead to an
increased risk of collisions, however; most gull flights were at a lower altitude than the
RSA of the turbines.
The flight altitudes of large birds in the Project Area were generally lower than
many other sites studied in Michigan. This could be due to the predominance of high winds
which prevents birds from flying at higher altitudes due to the “blowing out” of thermal lift
from the ground and/or the birds utilizing mechanical lift created by winds striking and
directed up from surfaces on the ground. In addition, the future consideration of external,
ongoing research may be useful in determining the potential risk that wind turbine
construction would provide for avian species. This research provides a better understanding
of the species composition and densities of large birds moving through the Project Area as
well as the relative level of risk these species may experience if turbines are constructed.
20
Heights of Large Birds
0
50
100
150
200
250
300
AMCRBAEA
CAGOCORA
GULL SPP.
HERGMALL
NOHAPIW
ORBGU
RLHARTHA
SACRTUVU
WODU
AOU Species Code
Heig
ht A
bove
Gro
und
in M
eter
s
Figure 8. In the fall of 2010 large bird surveys were conducted at two viewing stations in the Garden Peninsula Project Area, Michigan. The AOU species codes are detailed in Table 4, the top of the blue bars represent the minimum height of flight, the top of the dark red bar represents the mean height of flight, and the top of the cream bar represents the maximum flight height of each species. The horizontal red bar is approximately the rotor swept area of a wind turbine. Fall Migratory Small Bird Surveys
We completed 8 point counts between September 15th and November 30th, 2010.
Surveys of point count stations detected 1183 birds of 30 species in the Project Area
(Table 6 and 7). We detected a mean of 73.3 birds per point count visit (mean of 1.9
species / survey, Table 6).
The 3 most abundant bird groups per survey were the corvids (19.6 birds /
survey), followed by the waterfowl (17.4 birds / survey) and cranes (12.6 birds / survey)
(Table 7). When focusing in on the small birds detected during surveys the most
abundant species group was the Snow Buntings and American Pipets (6.4 birds / survey),
followed by the woodpeckers (3.9 birds / survey) and Black-capped Chickadees and
White-breasted Nuthatches (3.8 birds / survey) (Table 7). These species groups were
consistent with the Projects Area’s open / agricultural habitats interspersed with forest
woodlots with nearby waterbodies. No rare or declining species were detected during the
fall migration surveys. This research provides a better understanding of the species

21
composition and densities of small birds migrating through the Project Area. These data
help us to assess the level of concern for potentially impacting small birds.
Table 6. Small bird abundance and richness in Delta County, MI in the Garden Peninsula Phase I Project Area proposed for the development of wind energy by Heritage Sustainable Energy. Data were collected in the fall of 2010 at 8 point count survey sites. Point Counts No. Species 30 Mean No. Individuals / Survey 73.3 Mean No. Species/Survey 1.9
22
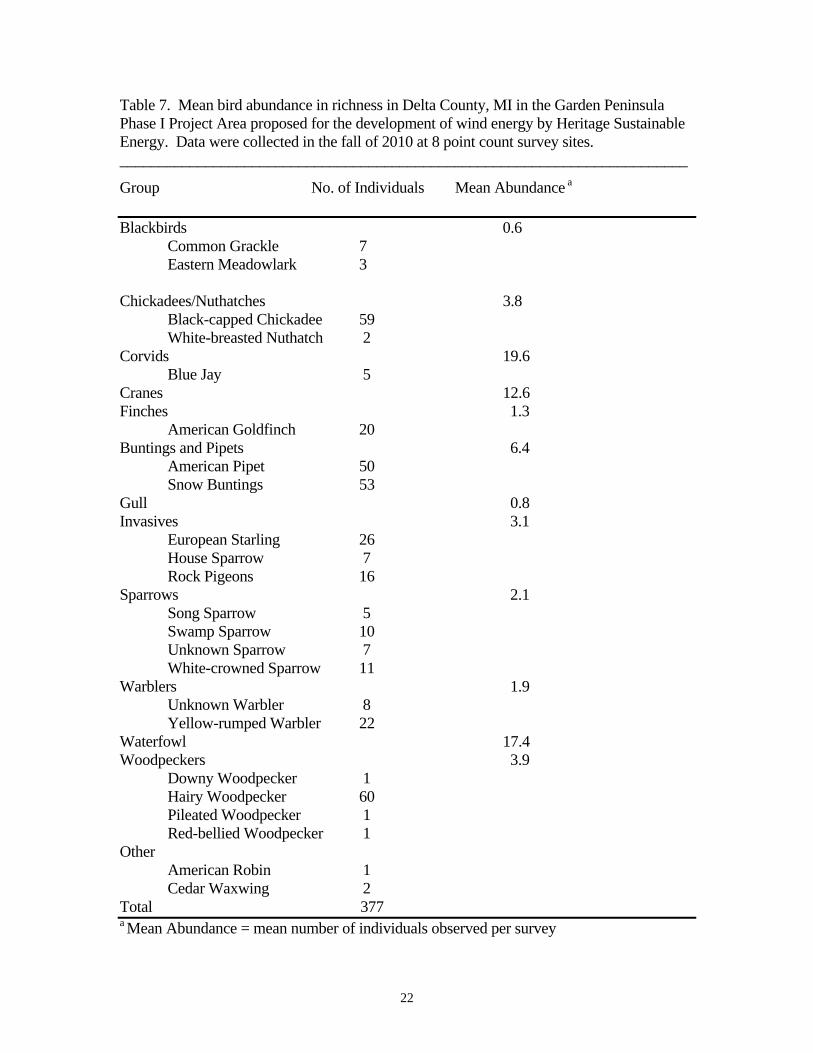
Table 7. Mean bird abundance in richness in Delta County, MI in the Garden Peninsula Phase I Project Area proposed for the development of wind energy by Heritage Sustainable Energy. Data were collected in the fall of 2010 at 8 point count survey sites. _________________________________________________________________________
Group No. of Individuals Mean Abundance a Blackbirds 0.6 Common Grackle 7 Eastern Meadowlark 3 Chickadees/Nuthatches 3.8 Black-capped Chickadee 59 White-breasted Nuthatch 2 Corvids 19.6 Blue Jay 5 Cranes 12.6 Finches 1.3 American Goldfinch 20 Buntings and Pipets 6.4 American Pipet 50 Snow Buntings 53 Gull 0.8 Invasives 3.1 European Starling 26 House Sparrow 7 Rock Pigeons 16 Sparrows 2.1 Song Sparrow 5 Swamp Sparrow 10 Unknown Sparrow 7 White-crowned Sparrow 11 Warblers 1.9 Unknown Warbler 8 Yellow-rumped Warbler 22 Waterfowl 17.4 Woodpeckers 3.9 Downy Woodpecker 1 Hairy Woodpecker 60 Pileated Woodpecker 1 Red-bellied Woodpecker 1 Other American Robin 1 Cedar Waxwing 2 Total 377 a Mean Abundance = mean number of individuals observed per survey
23
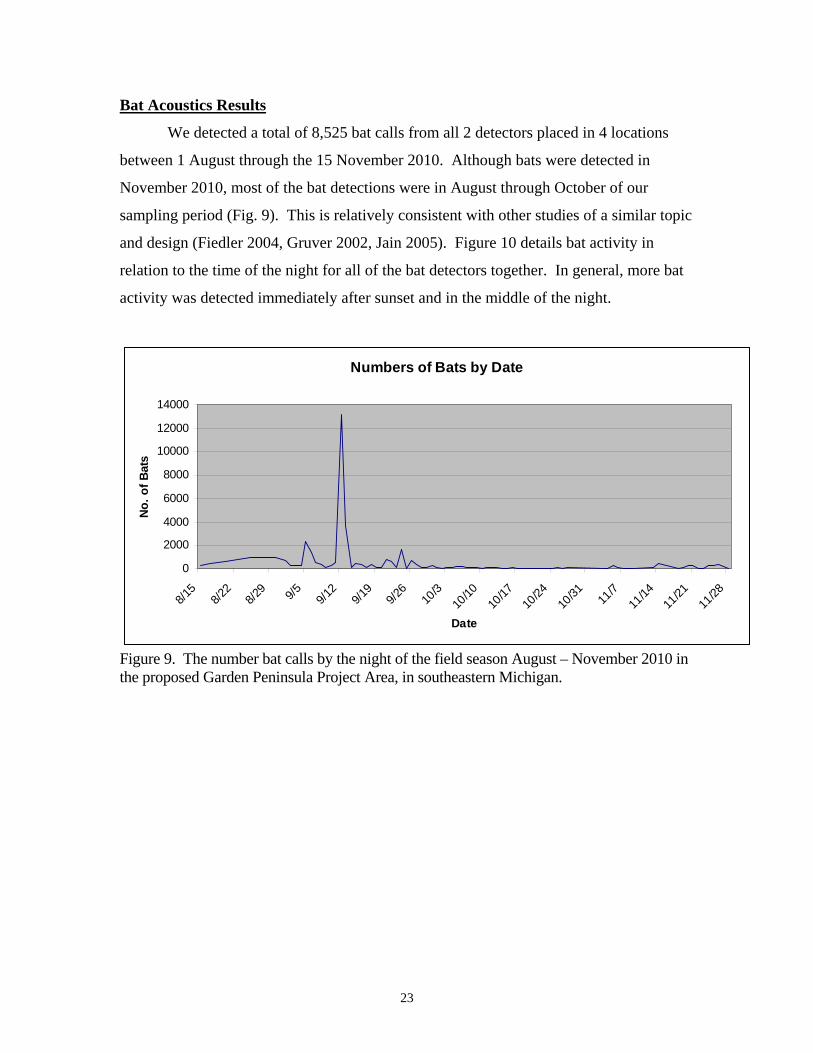
Bat Acoustics Results
We detected a total of 8,525 bat calls from all 2 detectors placed in 4 locations
between 1 August through the 15 November 2010. Although bats were detected in
November 2010, most of the bat detections were in August through October of our
sampling period (Fig. 9). This is relatively consistent with other studies of a similar topic
and design (Fiedler 2004, Gruver 2002, Jain 2005). Figure 10 details bat activity in
relation to the time of the night for all of the bat detectors together. In general, more bat
activity was detected immediately after sunset and in the middle of the night.
Numbers of Bats by Date
0
2000
4000
6000
8000
10000
12000
14000
8/15
8/22
8/29 9/5 9/1
29/1
99/2
610
/310
/1010
/1710
/2410
/31 11/7
11/14
11/21
11/28
Date
No.
of B
ats
Figure 9. The number bat calls by the night of the field season August – November 2010 in the proposed Garden Peninsula Project Area, in southeastern Michigan.

24
Bat Calls Over Time
0
200
400
600
800
1000
12000:
000:
240:
541:
221:
502:
273:
043:
434:
285:
166:
107:
088:
3619
:18
19:5
520
:13
20:3
420
:51
21:0
821
:29
21:4
722
:05
22:2
522
:43
23:0
523
:30
23:5
2
Time
No.
of B
ats
Figure 10. The number of bat calls by the time of night from August – November 2010 at all Anabat locations in the proposed Garden Peninsula Project Area. The red line delineates the break between early morning and evening data collection periods. Comparison of bat vocalization frequency
Low frequency bat calls made up 90% of the identified calls, whereas the high
frequency calls were only 9% of the calls. Consistent with those general classifications,
the general Myotis group was detected at a rate of 1.3 bats/ detector night. While we also
detected the big brown bat/sliver-haired bat group (0.3 bats/ detector night), and the
Eastern red bat (0.1 bats/ detector night). We expect that the Eastern pipistrelle may also
have been present in the area but they were not in high enough densities for our acoustic
sampling design to adequately detect and specifically classify them. The bat species
detected and classified were consistent with the open / disturbed / agricultural habitats
found in the Project Area.
Several of the species observed in or expected to be in the Project Area have been
detected as bat fatalities at existing wind farms in the United States (Fiedler 2004, Gruver
2002, Jain 2005). Those species expected to be in the Project Area that would be most
sensitive to wind turbine fatalities include: Eastern red bat, silver-haired bat, Eastern
pipistrelle, and hoary bat.
25
Summary of bat acoustic data collection
The species detected and classified were consistent with the Project Area land
cover type (i.e., predominantly agricultural fields). Preliminary data suggest that bat
fatalities at wind farms are positively correlated with seasonal densities of bats using the
wind farm; however, nightly variation in fatalities was not always correlated with the
numbers of detections at a particular turbine (Fiedler 2004, Gruver 2002, Jain 2005).
Therefore, these data were not presented in relation to the location of the bat detectors. In
addition, we did not analyze bat data in relation to the location of the Anabat due to the
correlation between the Anabat location and the time of year. Specifically, any
differences in bat densities at different locations may have been more related to the
timing of data collection and less related to the location of the Anabat instruments. If
interpreted incorrectly the data could have been misleading. Recent data suggest that
increasing the height above ground level of bat detectors results in more complete data
and an increased level of correlation between bat detections and bat fatalities. The data
collected for this Garden Peninsula project generally provide useful information on the
bat activity and species diversity in the Project Area.
Additional efforts to consider the potential impact of the Project on birds and bats
As the project plans progress, the estimated rotor-swept area presented in this
report should be revisited to validate that it is capturing the correct height estimate for the
specific turbines to be used in the project.
Heritage Sustainable Energy has continued to remain in contact with both the
United States Fish and Wildlife Service and the Department of Natural Resources and the
Environment to insure that their environmental studies are complete and acceptable to
these regulatory agencies.
26
Acknowledgments
J. Gehring, D. Morris, and S. Bridwell collected the majority of the data for this
project. I would like to express my gratitude to Heritage Sustainable Energy for their
efforts to incorporate natural resource issues into the development of wind energy
projects. My colleagues at the Michigan Natural Features Inventory provide logistical
and technical support; especially, B. Klatt, S. Ridge, N. Toben, and R. Rogers.
Literature Cited
Albert, D. 1995. Regional Landscape Ecosystems of Michigan, Minnesota, and
Wisconsin: a working map and classification. 4th Edition. General Technical
Report NC-178. United States Department of Agriculture, North Central Forest
Experimental Station. Saint Paul, MN.
Arnett, E, M. Huso, M. Schirmacher, J. Hayes. 2010. Altering turbine speed reduces bat
mortality at wind-energy facilities. Frontiers in Ecology and the Environment
101101071900096 DOI: 10.1890/100103
Betts, B. J. 1998. Effects of interindividual variation in echolocation calls on
identification of big brown and silver-haired bats. Journal of Wildlife
Management, 62:1003–1010.
Britzke, E. R., and K. L. Murray. 2000. A quantitative method for selection of
identifiable search-phase calls using the Anabat system. Bat Research News 41:
33–36.
Diehl, R., R. Larkin, and J. Black. 2003. Radar observations of bird migration over the
Great Lakes. Auk 120:278-290.
Desholm, M. and J. Kahlert. 2006. Avian collision risk at offshore wind farms. Journal
of Ornithology 147(Suppl. 5): 156.
Ewert, D. 2006. Migratory bird stopover site attributes in the western Lake Erie Basin.
The Nature Conservancy Report.
Fiedler, J. K. 2004. Assessment of bat mortality and activity at Buffalo Mountain
Windfarm, eastern Tennessee. M.S. Thesis, University of Tennessee, Knoxville,
Tennessee, USA.
Gannon, W. L., R. E. Sherwin, and S. Haymond. 2003. On the importance of articulating
27
assumptions when conducting acoustic studies of bats. Wildlife Society Bulletin
31: 45–61.
Gehring, J. L., P. Kerlinger, and A. Manville. 2009. Communication towers, lights, and
birds: successful methods of reducing the frequency of avian collisions.
Ecological Applications. 19: 505-514.
Gruver, J. C. 2002. Assessment of bat community structure and roosting habitat
preferences for the hoary bat (Lasiurus cinereus) near Foote Creek Rim,
Wyoming. Thesis, University of Wyoming, Laramie.
Hayes, J. P. 2000. Assumptions and practical considerations in the design and
interpretation of echolocation-monitoring studies. Acta Chiropterologica 2: 225–
236.
Jain, A. A. 2005. Bird and bat behavior and mortality at a northern Iowa windfarm.
Thesis. Iowa State University, Ames, Iowa.
Kerlinger, P. 1989. Flight Strategies of Migrating Hawks. University of Chicago Press.
Chicago, IL
Larson, D. J., and J. P. Hayes. 2000. Variability in sensitivity of Anabat II bat detectors
and a method of calibration. Acta Chiropterologica 2: 209–213.
Leddy, K.L., K.F. Higgins, and D.E. Naugle. 1999. Effects of wind turbines on upland
nesting birds in Conservation Reserve Program grasslands. Wilson Bull. 111:100-
104.
Michigan Natural Features Inventory. 2007. Rare Species Explorer (Web Application).
Available online at http://web4.msue.msu.edu/mnfi/explorer [Accessed Jan 20,
2010]
O’Farrell, M. J., and W. L. Gannon. 1999. A comparison of acoustic versus capture
technique for the inventory of bats. Journal of Mammalogy 80: 24–30.
O’Farrell, M. J., B. W. Miller, and W. L. Gannon. 1999. Qualitative identification of
freeflying bats using the Anabat detector. Journal of Mammalogy, 80:11–23.
Sherwin, R. E., W. L. Gannon, and S. Haymond. 2000. The efficacy of acoustic
techniques to infer differential use of habitat by bats. Acta Chiropterlogica 2:
145–153.

28
Strickland, D. 2004. Overview of non-collision related impacts from wind projects.
Pages 34-38 In Proceedings of the Wind Energy and Birds/Bats Workshop:
understanding and resolving bird and bat impacts. Washington, D.C. May 18-19,
2004. Prepared by RESOLVE, Inc. Washington, D.C., Susan Savitt Schwartz,
ed. September 2004.
Thomas, D. W. 1988. The distribution of bats in different ages of Douglas-fir forests.
Journal of Wildlife Management 52: 619–626.

29
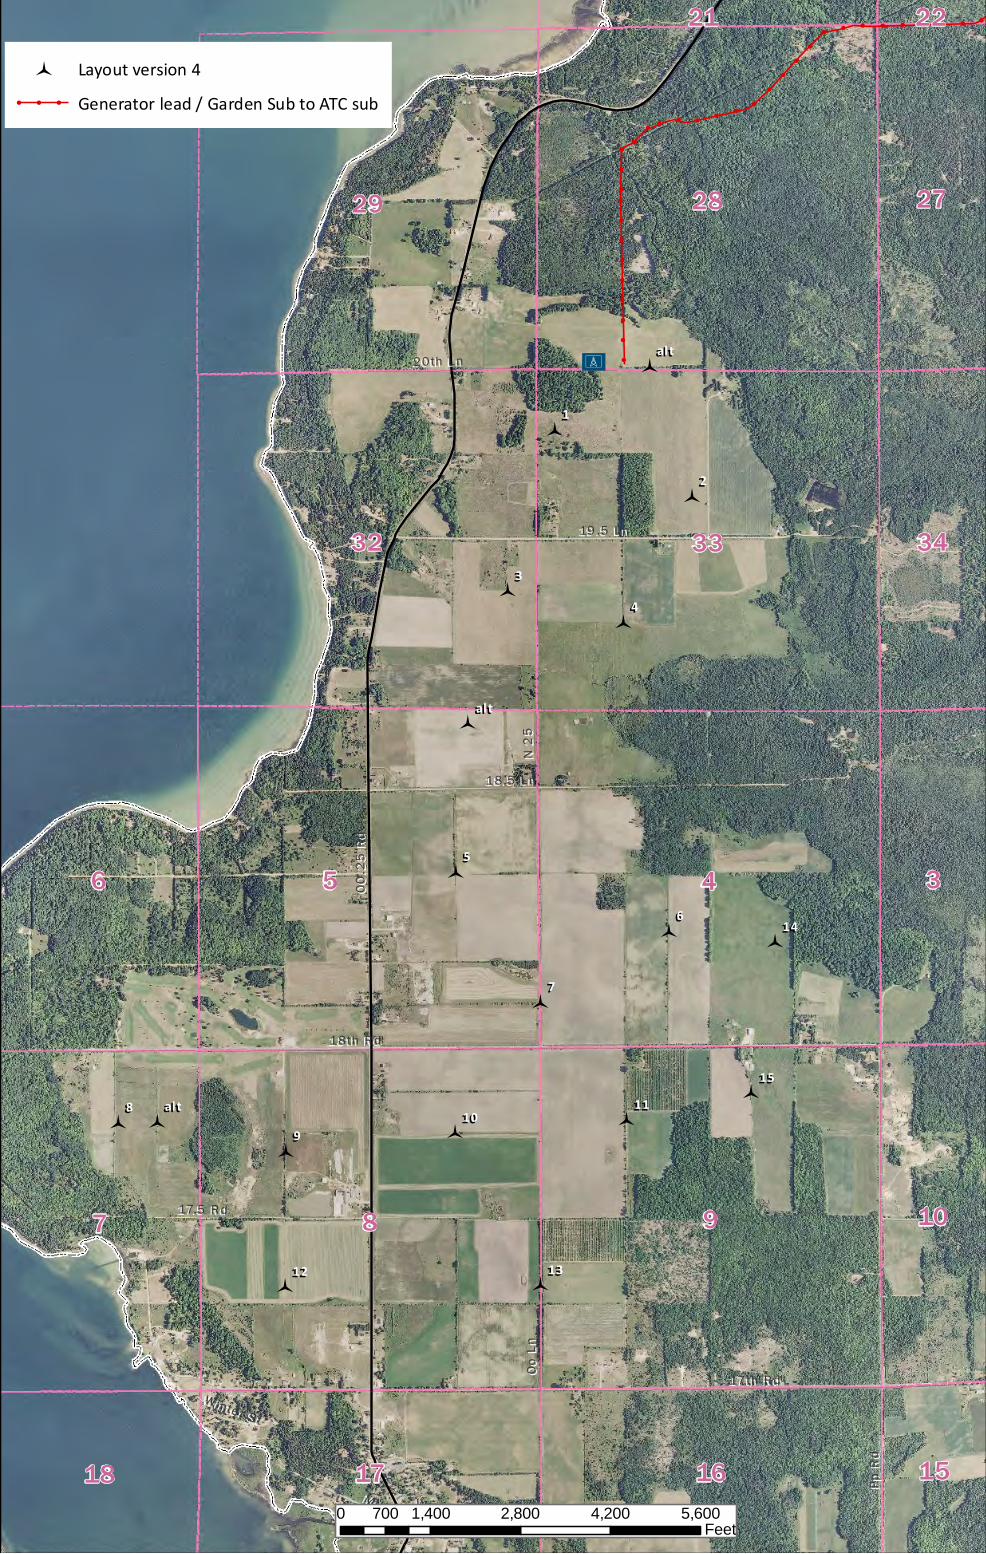
Appendix 1. The Delta County, MI, Garden Peninsula Phase I Project Area, is predominantly agricultural lands and hay fields with some interspersed grassland and forested areas.
!
!!
!!
!!
!
!
!
!!
!
!
!
!
!
!
!
!
!!!!!!!!
!
!
!
!
!
!
!!
!!!
!!
!
!
!!
!!
!!
!!
!!
!
G A R D E NG A R D E N
!b
88
11
55
99
66
77
4433
22
1515
1414
13131212
1010 1111altal t
al tal t
al tal t
9
5
8
46
7
28
33
29
32
3
17 16
27
34
10
18 15
21 22
OO.2
5 Rd
OO.2
5 Rd
17th R d17th R d
18th R d18th R d
Pp R
dPp
Rd
19 .5 L n19 .5 L n
18.5 L n18.5 L n
17.5 R d17.5 R d
20th L n20th L n
Mi ll S tMi ll S t
N 25
N 25
Wat er S tWat er S t
Oo L
nOo
Ln
W inte r S tWinte r S t
0 1,400 2,800 4,200 5,600700Feet
Layout version 4! ! ! Generator lead / Garden Sub to ATC sub
Recommended