Bakken and Permian: Deal Metrics in the Two Hottest Plays
Ward PolzinJuly 11, 2012

Industry Leading Investment Banking Practice
2010 - 2012 YTD
Firm Value ($MM)
Barclays $143,412
2010 - 2012 YTD
Firm # Deals
Tudor Pickering Holt & Co 63
Advisory
Sell-side & Buy-side
Joint Ventures
Opinions
S i l C itt
Capital Markets
Public Equity
Hybrids
Fixed income
P i t l t
Top Energy Advisor(1)
($ in millions)
Goldman Sachs 121,989
Tudor Pickering Holt & Co 76,902
Credit Suisse 71,046
Evercore Partners Inc 65,828
Citi 64,354
Morgan Stanley 60,881
J ff i & C 57 868
RBC Capital Markets 45
Barclays 44
Jefferies & Company 37
Bank of America Merrill Lynch 34
Goldman Sachs 30
JPMorgan 30
C dit S i 28
Special Committee
Strategic advisory
Restructuring
Private placements
QIU
Jefferies & Company 57,868
JPMorgan 50,179
Deutsche Bank 40,258
Credit Suisse 28
Citi 28
Deutsche Bank 20UpstreamMidstream/MLP OFS Power
Overview TPH combines banking expertise with engineering talent to deliver
Coverage of Midstream/MLP, OFS, Power and Upstream sectors
Senior execution expertise in M&A, Corporate Finance, A&D and Capital Markets
Banking Expertise Engineering Talent
high quality advice to energy clients
Managing Director
11Analyst
12
Capital Markets
Industry/engineering expertise integrated into IB effort across all sectors
Three-year old team achieved 25% market share(1) in 2010T t l T 40
Senior Advisor1
Director3
Vice President4
Associate9
2___________________________________(1) Source: Dealogic: United States Oil & Gas – Exploration & Development/Field Equipment & Services/Diversified/Pipeline and
Utility & Energy – Gas, pending and completed M&A transactions announced 1/1/2010 to 6/22/2012.
>25% market share(1) in 2010Total Team: 40

TPH Investment Banking TPH Research
TPH Resource Experience
Bakken
Current Sell-side: Helis Oil & GasCurrent Sell-side: Cornerstone Natural ResourceBuy-side: Crestview Partners acquisition of Samson Investment CompanyBuy-side: Statoil ASA acquisition of Brigham ExplorationSell-side: Citation Oil & Gas Corp. sale to multiple buyersSell-side: Kaiser Francis Oil CompanySell-side: TRZ Energy (Tracker) sale to HessS ll id A i Oil & G l t H
Upstream companies covered with Bakken exposure: 12□ Selected Bakken operator coverage: CLR, EOG, HES,
NFX, OAS, OXY, STO, WLL, XOMPublished detailed Williston Basin primer
Sell-side: American Oil & Gas sale to HessAtinum investment in Triangle PetroleumCapital markets: Oasis IPO/high yield & multiple BEXP follow-on offerings
Permian
Buy-side: Apollo & Riverstone acquisition of El Paso’s upstream businessBuy-side: Laredo Petroleum acquisition of Broad Oak EnergySell-side: OGX Resources sale to undisclosed buyerSell-side: Eagle Oil and Gas to Comstock ResourcesS ll id RKI E l ti & P d ti it i t t
Upstream companies covered with Permian exposure: 24□ Selected Permian operator coverage: APA, APC, BRY,
CXO, DVN, EOG, OXY, PXD, SD, WLL, XECPublished detailed Permian Basin primer focused on the S b T d i M h 2009e a Sell-side: RKI Exploration & Production equity investment
Sell-side: Yates Drilling Company to undisclosed buyerBuy-side: Crestview acquisition of equity in Select Energy ServicesSell-side: Arena Resources merger with SandRidge Energy
Spraberry Trend in March 2009
Eagle Ford
Sell-side: Antares Energy sale to ChesapeakeBuy-side: CNOOC/Chesapeake Joint VentureSell-side: Pioneer Joint Venture with RelianceB id L i t t d
Upstream companies covered with Eagle Ford exposure: 15□ Selected Eagle Ford operator coverage: APC, EOG,
GDP, HK, NFX, PXD, ROSE, SM R tl l d “Sh ll Di ” i t E l F d i 2010Buy-side: Large integrated
Buy-side: Potential $400MM private equity investmentRecently released “Shallow Dive” into Eagle Ford in 2010Continuing close coverage of well results in play
Haynesville
Sell-side: Ellora Energy sale to ExxonMobilSell-side: Undisclosed Private Company to undisclosed buyerBuy-side: Large public company seeking to establish E Tx positionRegency/GE/Alinda Haynesville Expansion Project (midstream)
Upstream companies covered with Hayesville exposure: 13□ Selected Haynesville operator coverage: APC, BG, CHK,
GDP, RRC, XCO, XOM Significant recent focus on midstream issues in basin
Marcellus
Buy-side: $400MM Private Equity Joint VentureBuy-side: Enerplus Joint Venture with Chief for $406MMBuy-side: Potential $500MM Private Equity investmentSell-side: Quest Resources Corp to Multi
Upstream companies covered with Marcellus exposure: 16□ Selected Marcellus operator coverage: CHK, COG, CRZ,
RRC, SWN, UPL, XCO Released in-depth report on the play simultaneously with initiation of Cabot in June
Ni b
Sell-side: DIA mineral lease saleSell-side: Undisclosed private company
Upstream companies covered with Niobrara exposure: 14□ Selected Niobrara operator coverage: APC, CHK, CLR, Niobrara p p y
Sell-side: Joint ResourcesBuy-side: CNOOC/Chesapeake Joint Venture
p g , , ,EOG, NBL, SM
UticaSell-side: Marquette sale to HessSell-side: PDC Energy Joint Venture
Upstream companies covered with Utica exposure: 8□ Selected Utica operator coverage: APC, CHK, HES
3

Commodity Prices Set the Stage

Long Term Oil Price is KeyToday’s Question: At what oil price do we drop rigs?Today s Question: At what oil price do we drop rigs?
$150
Historical WTI Spot
$150
Historical WTI Spot 1/1/2009 Strip
$150
Historical WTI Spot 1/1/2009 Strip 1/1/2010 Strip
$150
Historical WTI Spot 1/1/2009 Strip 1/1/2010 Strip 1/1/2011 Strip
$150
Historical WTI Spot 1/1/2009 Strip 1/1/2010 Strip 1/1/2011 Strip 1/1/2012 Strip
$150
Historical WTI Spot 1/1/2009 Strip 1/1/2010 Strip 1/1/2011 Strip 1/1/2012 Strip 7/2/2012 Strip
$110
$130
) $110
$130
) $110
$130
) $110
$130
) $110
$130
) $110
$130
)
$70
$90
WTI Pric
e ($/Bbl)
$70
$90
WTI Pric
e ($/Bbl)
$70
$90
WTI Pric
e ($/Bbl)
$70
$90
WTI Pric
e ($/Bbl)
$70
$90
WTI Pric
e ($/Bbl)
$70
$90
WTI Pric
e ($/Bbl)
$50
$70
$50
$70
$50
$70
$50
$70
$50
$70
$50
$70
$30$30$30$30$30$30
5___________________________________Source: Bloomberg as of 7/2/2012.

Negative Gas Outlook Impacting Deal Metrics
$15
Historic Henry Hub Spot
$15
Historic Henry Hub Spot 1/1/2009 Strip
$15
Historic Henry Hub Spot 1/1/2009 Strip 1/1/2010 Strip
$15
Historic Henry Hub Spot 1/1/2009 Strip 1/1/2010 Strip 1/1/2011 Strip
$15
Historic Henry Hub Spot 1/1/2009 Strip 1/1/2010 Strip 1/1/2011 Strip 1/1/2012 Strip 7/2/2012 Strip
$9
$12
ce ($/M
Mbtu)
$9
$12
ce ($/M
Mbtu)
$9
$12
ce ($/M
Mbtu)
$9
$12
ce ($/M
Mbtu)
$9
$12
ce ($/M
Mbtu)
$6
Natural G
as Pric
$6
Natural G
as Pric
$6
Natural G
as Pric
$6
Natural G
as Pric
$6
Natural G
as Pric
$0
$3
$0
$3
$0
$3
$0
$3
$0
$3
6___________________________________Source: Bloomberg as of 7/2/2012.

Recent Decline in NGL Prices
$160100%Representative NGL Barrel % of WTI WTI Spot Price ($/Bbl)
Ethane prices
~74%
$12075%
~74%
$8050%
WT
I Spot ($/Bbl)N
GL
% o
f W
TI
$4025%
NGL prices
~44%
$00%Jun-08 Sep-08 Dec-08 Mar-09 Jun-09 Sep-09 Dec-09 Mar-10 Jun-10 Sep-10 Dec-10 Mar-11 Jun-11 Sep-11 Dec-11 Mar-12 Jun-12
___________________________________Source: Bloomberg as of 7/2/2012.Note: Representative consists of barrel 40% ethane, 10% normal butane, 25% propane, 15% natural gasoline and 10% iso butane.
7

Liquids Rig Count Shift Has Been Dramatic
2,500
U.S. Onshore Rig Count
534
2,030 2,005 1,955 2,000
1,606
935
879 1,000
1,500 27%
1,070
1,421
700
879
500 73%
424 179
0
Peak3Q09
Trough2Q09
Near-Term Peak 3Q11 Current6/29/12
___________________________________Source: Baker Hughes as of 6/29/2012.Note: “Peak 3Q09” defined as 9/12/2008, “Trough 2Q09” defined as 6/5/2009, and “Near-Term Peak” as 10/7/2011.
GasLiquids
8

Permian and Bakken Driving Oily Rig Shift
Selected Gas Shales Permian Eagle Ford Bakken Granite Wash Niobrara Hz. Ms Lime
1,200
1,500
t
Selected Oily Rig Count: ~940
Bakken: ~215
900
cted
Rig
Cou
nt
300
600
Sele
c
0Q1'07 Q3'07 Q1'08 Q3'08 Q1'09 Q3'09 Q1'10 Q3'10 Q1'11 Q3'11 Q1'12
9___________________________________Source: TPH Research as of 7/2/2012.

Bakken Vaults North Dakota to #2 US Producer
March 2012 Production by State (Mbbl/d)
TX 1,790 240650
Monthly Avg. Rig Count
Bakken Production (Mboe/d)
Montana Bakken Production North Dakota Bakken Production Bakken Rig Count
AK
ND
,
587
579 180
200
220
450
500
550
600
CA
OK
548
226
100
120
140
160
300
350
400
450
40
60
80
100
100
150
200
250
0
20
0
50
100
Mar-01 Mar-02 Mar-03 Mar-04 Mar-05 Mar-06 Mar-07 Mar-08 Mar-09 Mar-10 Mar-11 Mar-12
10___________________________________Source: Baker Hughes Montana and North Dakota rig count, HPDI and EIA.Note: HPDI production data reported with a 3 month lag.Note: Texas, North Dakota and Alaska production per state industrial commissions.

Bakken Rig Count Close to a Peak?Has Bakken rig count peaked in the 200 – 225 rig range in light of the current commodity backdrop? Has Bakken rig count peaked in the 200 – 225 rig range in light of the current commodity backdrop?
$125250 Williston Basin Rig Count WTI Spot Price
$100
$125
200
250
$75150
WTI Spot Price ($/n
Basi
n Ri
g Co
unt
$25
$50
50
100
/bbl)W
ilist
on
$00 Jun-10 Sep-10 Dec-10 Mar-11 Jun-11 Sep-11 Dec-11 Mar-12 Jun-12
11__________________________________Source: HPDI and RigData as of 7/2/2012.
Deal Flow Follows Commodities

Gas Down, Oil Up: Shocking!
$60 40 $60
Resource Deal Volume Gas Deals
40 $60
Resource Deal Volume Gas Deals Oil Deals
$35 1
$40.6
$51.4
$45
me
($Bn
)
$35 1
$40.6
$51.4
30 $45
Resme
($Bn
)
$35 1
$40.6
$51.4
30 $45
Resme
($Bn
)
$22.7
$35.1
$18.4
$30
sour
ce D
eal V
olu
$22.7
$35.1
$18.4
20 $30
ource Deal Coun
sour
ce D
eal V
olu
$22.7
$35.1
$18.4
20 $30
ource Deal Coun
sour
ce D
eal V
olu
$6.9
$15
Res
$6.9
$
10 $15
ntRe
s
$6.9
$
10 $15
ntRe
s
$02007 2008 2009 2010 2011 2012
0 $02007 2008 2009 2010 2011 2012
0 $02007 2008 2009 2010 2011 2012
13_______________________________Source: IHS Herold as of 7/2/2012.

Deals Shifting to Oil/Liquids-Rich
2010 Deal Count 2011 - 2012 YTD Deal Count
Oil Deals47%
Gas Deals53% Oil Deals
68%
Gas Deals32%
14_______________________________Source: IHS Herold as of 7/2/2012. Includes transactions greater than $50 million in which United States is the primary country. Note: Oil and gas transactions are separated on the basis of reserve composition.
Gas Transactions Oil/Liquids-Rich Transactions

Diversity Among Oil/Liquids-Rich Deal Flow2011 Present Deal Count2011 – Present Deal Count
Permian Shale15%
Bakken29%
Niobrara8%
MS Lime6%
Uti
Granite Wash2%
Eagle Ford27%
Utica13%
____________________________________Source: IHS Herold as of 7/2/2012.Note: Deal value >$50 million. Reflects transactions where United States listed as primary country. Excludes JVs.
15

Conventional Oil Metrics Stable
$32
$/BoeReserves ($/Boe)
$160,000 $32
$/Boe/d$/BoeReserves ($/Boe) Production ($/Boe/d)
$23.58 $24
$32
$23.58 $120,000
$160,000
$24
$32
$20.10
$16.07
$20.06
$16.38
$19.16 $17.79 $17.63 $17.49
$16
$20.10
$16.07
$20.06
$16.38
$19.16 $17.79 $17.63 $17.49
$80,000
,
$16
$8 $40,000 $8
$0Q2 10 Q3 10 Q4 10 Q1 11 Q2 11 Q3 11 Q4 11 Q1 12 Q2 12
$0 $0Q2 10 Q3 10 Q4 10 Q1 11 Q2 11 Q3 11 Q4 11 Q1 12 Q2 12
16____________________________________Source: IHS Herold as of 7/2/2012.Note: Deal value >$50 million. Reflects transactions where United States listed as primary country. Excludes JVs.
Q2 10 Q3 10 Q4 10 Q1 11 Q2 11 Q3 11 Q4 11 Q1 12 Q2 12Q2 10 Q3 10 Q4 10 Q1 11 Q2 11 Q3 11 Q4 11 Q1 12 Q2 12

Bakken Deal Specifics

Strong Deal Market Throughout the BasinKodiak – Peak Magnum Hunter - Baytex Hess - American
Oxy - Cirque30K acres, 3Q 2010
Ursa
15K acres, $7,600/acre, 500 boe/d, 4Q 2010
g y50K acres, $5,200/acre, 1,300
boe/d, 2Q 2012
85K acres, $5,400/acre, 167 boe/d, 3Q 2010
Statoil - Brigham375K acres,
$12,500/acre, 16,800 boe/d, 3Q 2011
Crescent Point -
Linn - Cade & Holt4.6K acres, 800 boe/d
Petro-Hunt51K acres
Anschutz25k acres
HK – GEOI55k acres, Q2 2012
Nesson Anticline
Li l K if
Linn – Concho11K acres, $17,500/acre,
1,350 boe/d, 1Q 2010
Kodiak – North Plains50K acres, $11,800/acre,
3,500 boe/d, 4Q 2011
Oasis2 undisclosed transactions,
16.7K + 10K acres, $3,000/acre, 300 boe/d,
4Q 2010
Enerplus – Peak
Little KnifeAnticline
Williams – Dakota 385K acres, $10,800/acre, 3,300
boe/d, 4Q 2010
3,500 boe/d, 4Q 2011
Ursa100K acres
Petro-Hunt5K acres
Occidental – Anschutz180K acres, $7,800/acre, 5,500
boe/d, 4Q 2010
47K acres, $9,800/acre, 800 boe/d, 3Q 2010
GMXR-Undisclosed26K acres, $2,165, 1Q 2011
Petro-Hunt22K acres
18
Lower Bakken LimitHess - Tracker
167K acres, $8,000/acre, 4,400
boe/d, 4Q 2010
___________________________________Note: TPH estimates of current market conditions.
Petro-Hunt12K acres /
5K acres
Kodiak - BTA13.5K acres, $17,400/acre,
3,000 boe/d, 3Q 2011
Citation30K acres

Bakken Transactions Through Time
$10,068 $9 303$10 000
$12,000
$14,000 Average $/Acre
Deal Metrics Remain Stable(1)
$10,068 $9 303$10 000
$12,000
$14,000 Median $/Acre Median $/Acre
Constant ~$90/bbl price deck = Constant valuation
$7,118 $6,057
$3,047
$4,415
$9,303
$7,946
$5,233
$4,000
$6,000
$8,000
$10,000
Ad
just
ed $
/Acr
e
$7,118 $6,057
$3,047
$4,415
$9,303
$7,946
$5,579
$4,000
$6,000
$8,000
$10,000
Ad
just
ed $
/Acr
e
Median $/Acre = ~$6,600
$0
$2,000
Q3'10 Q4'10 Q1'11 Q2'11 Q3'11 Q4'11 Q1'12 Q2'12
Bakken Deal Flow Shaped by Large Transactions
$0
$2,000
Q3'10 Q4'10 Q1'11 Q2'11 Q3'11 Q4'11 Q1'12 Q2'12
$5,295
5
6
7
$5,000
$6,000
$7,000
Numbe
MM
)
Other Transaction Volume ($MM) Single Transaction Volume ($MM) Deal Count
Bakken Deal Flow Shaped by Large Transactions
Statoil / BEXP: $4.7 Bn OXY / Anschutz: $1.4 Bn
$914
$3,565
$638 $399$1,055
$1,326
1
2
3
4
$1 000
$2,000
$3,000
$4,000
er of TransactionsDe
al V
olu
me
($M
HES / Tracker: $1.0 BnHK/GEOI: $945 MM
$$251 $399
0
1
$0
$1,000
Q3'10 Q4'10 Q1'11 Q2'11 Q3'11 Q4'11 Q1'12 Q2'12
19___________________________________Source: Company Investor Presentations and press releases.(1) Adjusted $/acre estimate excludes PDP and does not correct for developed acres. PDP valued at $50,000 boe/d.

Strong Deal Metrics Throughout the BasinFactors Impacting Value:
$3,000 - $5,500/acre
Factors Impacting Value:Bakken and Three Forks present?Offset well performanceIs the area “de-risked”?# of wells/DSU?
$4,000 - $8,000/acre
>$10,000/acre
Deeper Three Forks?
$6,000 - $12,000/acre
$6,000 - $12,000/acre
$8,000 - $10,000/acre
20___________________________________Note: TPH estimates of current market conditions.
Acreage values are after subtracting current production at $50,000 boe/d

Bakken Pure Play Public Companies…A Tale of the Tape
2011 Performance 2012 YTD Performance
232% Bakken 1% Marcellus
74%
92%
166%
High G th Oil
Transition
Permian
(4%)
(3%)
Focused Gas Growth
Oily
43%
58%
74%
Marcellus
GoM / Gulf Coast
High Growth Oil
(10%)
(8%)
(6%)
Small Cap Gas
GoM / Gulf Coast
High Growth Oil
(18%)
(13%)
36%
F d G G th
Diversified Gas Growth
Oily
(14%)
(13%)
Diversified Gas Growth
Permian
___________________________________Source: FactSet as of 7/2/2012.Bakken: OAS, KOG, NOG, TPLM and BEXP (until acquired by STO).
(49%)
(18%)
Small Cap Gas
Focused Gas Growth
(18%)
(16%)
Transition
Bakken
21
Transition: AREX, EOG, ROSE, SD and SM.High Growth Oil: CLR, CXO, DNR and OAS.Oily: BRY, CWEI, PXD, PXP, REN, VQ and WLL.GOM / Gulf Coast: ATPG, CPE, CXPO, EPL, EXXI, MCF, PQ, SFY, SGY and WTI.Focused Gas Growth: COG, GDP, KWK, RRC, SWN and UPL.Diversified Gas Growth: CHK, DVN, ECA, EOG, FST, NFX, QEP, XCO, and XEC. Small Cap Gas: BBG, CRK, GMXR, PETD and PVA. Permian: AREX, CWEI, CXO, LPI and PXD.Marcellus: GOG, RRC and EQT.

Permian Deal Metrics
22

Stacked Oil Plays Drive the PermianCurrent Permian Drilling ActivityCurrent Permian Drilling Activity
Horizontal RigVertical Rig
Midland B i
Bone Spring Delaware
Basin
Central Platform
Basin
Wolfberry
Delaware Sands
Wolfberry
Cline
Avalon Shale
Spraberry
Wolfcamp / Wolfbone
Wolfcamp (University)(University)
__________________________________Source: HPDI and RigData.
23

Permian M&A Deal Flow
2009 - 2012 YTD Deal Flow
DelawareConventional22%
Conventional25%
75% of deals in“resource” playsresource plays
Wolfberry53%
24_______________________________Source: IHS.

Industry Weighted Towards Oily Production
Gas (Boe/d)Oil (Boe/d) Gas (Boe/d) Well Count
Wolfcamp and Bone Spring Production
100,000
120,000
oe/d
)
10-Yr gas production up ~20%
3,500
4,200
100,000
120,000
oe/d
)
10-Yr oil production up ~153%
60,000
80,000
Dai
ly P
rodu
ctio
n (B
o
2,100
2,800
60,000
80,000
Well Count
Dai
ly P
rodu
ctio
n (B
o
20,000
40,000
D
700
1,400
20,000
40,000
D
0Dec-01 Dec-02 Dec-03 Dec-04 Dec-05 Dec-06 Dec-07 Dec-08 Dec-09 Dec-10 Dec-11
00Dec-01 Dec-02 Dec-03 Dec-04 Dec-05 Dec-06 Dec-07 Dec-08 Dec-09 Dec-10 Dec-11
25___________________________________Source: HPDI.Note: Includes all Texas producing wells with Wolfcamp, Bone Spring or Trend Area as a target reservoir; Excludes wells with field reported as Spraberry.
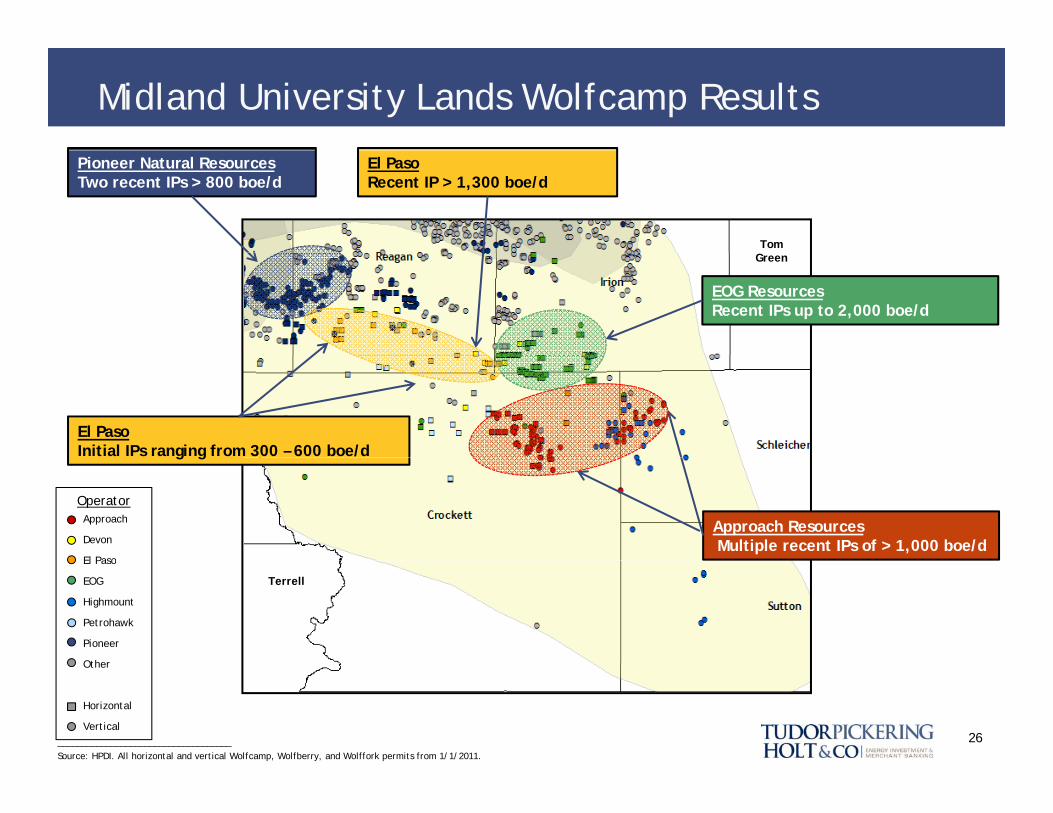
Midland University Lands Wolfcamp Results
Pioneer Natural ResourcesTwo recent IPs > 800 boe/d
El PasoRecent IP > 1,300 boe/d
Tom
EOG ResourcesRecent IPs up to 2,000 boe/d
Green
El PasoInitial IPs ranging from 300 – 600 boe/d
OperatorApproach
Devon
El Paso
Approach ResourcesMultiple recent IPs of > 1,000 boe/d
g g
El Paso
EOG
Highmount
Petrohawk
Pioneer
Other
Terrell
26____________________________________Source: HPDI. All horizontal and vertical Wolfcamp, Wolfberry, and Wolffork permits from 1/1/2011.
Other
Horizontal
Vertical

The Evolution of a Permian Play…Wolfberry 2009
Andrews CountryMax: $1,554/acreShaw Interest Inc
Concho / Terrace Petroleum11/23/2009$260 million
Shaw Interest, Inc.October 2009
Reagan CountyMax: $566/acreWindsor Permian, LLCApril 2009
Crane CountyMax: $207/acre April 2009
Upton CountyCrockett CountyMax: $301/acreWTG E l i
Max: $207/acreSan Luis EnergyOctober 2009
p yMax: $289/acrePioneer Nat. ResourcesOctober 2009
WTG ExplorationOctober 2009
Pioneer Southwest / PXD
M&A DealsLease Sales
d l
Pioneer Southwest / PXD8/31/2009$171 million
27
UT Lands 2009 Lease Sale157 Tracts Sold for average $287/acre
Highest bid $1,555/acre___________________________________Source: UT Lands, Company Investor Presentations and press releases.(1) $/acre estimate excludes PDP and does not correct for developed acres. PDP valued at $50,000/Boe/d.

The Evolution of a Permian Play…Wolfberry 2010
Andrews CountryMax: $3,587/acrePrivate Broker
Energen / Undisclosed8/23/2010$185 million; $18,678/acre(1)
Private BrokerSeptember 2010
Reagan CountyMax: $1,626/acreEl Paso E&PSeptember 2010
Crane CountyMax: $455/acre September 2010
Upton CountyCrockett CountyMax: $1,797/acreEl P E&P
Max: $455/acreSan Luis EnergySeptember 2010
p yMax: $1,610/acePrivate BrokerSeptember 2010
El Paso E&PSeptember 2010
Berry Petroleum / Undisclosed10/25/2012
Energen / Undisclosed8/23/2010
M&A DealsLease Sales
d l
10/25/2012$180 million; $12,903/acre(1) $75 million; $7,239/acre(1)
28
UT Lands 2010 Lease Sale510 Tracts Sold for average $985/acre
Highest bid $3,587/acre___________________________________Source: UT Lands, Company Investor Presentations and press releases.(1) $/acre estimate excludes PDP and does not correct for developed acres. PDP valued at $50,000/Boe/d.

The Evolution of a Permian Play…Wolfberry 2011Andrews CountryMax: $10,000/acrePDC EnergySeptember 2011
Berry Petroleum / Undisclosed4/28/2011$123 million; $16,333/acre(1)
Concho / PDC Energy12/23/2011$175 million; $11,765/acre(1) Laredo Petroleum / Broad Oak
6/16/2011$1.0 billion; $9,273/acre(1)
Reagan CountyMax: $5,580/aceConocoPhillipsSeptember 2011
Crane CountyMax: $511/acreSandRidge EnergySeptember 2011
p
Upton CountyMax: $5,580/aceConocoPhillipsSeptember 2011 Crockett County
Max: $5,580/aceC Philli
M&A DealsLease Sales
d l
ConocoPhillipsSeptember 2011
29___________________________________Source: UT Lands, Company Investor Presentations and press releases.(1) $/acre estimate excludes PDP and does not correct for developed acres. PDP valued at $50,000/Boe/d.
UT Lands 2011 Lease Sale496 Tracts Sold for average $2,245/acre
Highest bid $10,000/acre

The Evolution of a Permian Play…Wolfberry 2012
Andrews CountryMax: $3,000/acreWindsor PetroleumMarch 2012
Reagan CountyMax: $5,814/acePioneer Nat. ResourcesMarch 2012Crane County
Energen / Undisclosed2/10/2012$66 million; $20,563/acre(1)
March 2012
Crockett CountyMax: $2,507/aceP h k P i
Crane CountyMax: $525/acreHenry Energy LPMarch 2012
Upton CountyMax: $7,058/aceVeritas Energy PartnersMarch 2012
Petrohawk PropertiesMarch 2012
M&A DealsLease Sales
d h l
30
UT Lands March 2012 Lease Sale86 Tracts Sold for average $645/acre
Highest bid $7,123/acre___________________________________Source: UT Lands, Company Investor Presentations and press releases.(1) $/acre estimate excludes PDP and does not correct for developed acres. PDP valued at $50,000/Boe/d.

Wolfberry / Wolfcamp Acreage Now First In Class
$25,000
Lease Sales
$25,000
Lease Sales Highest Lease Sale Bid
$25,000
Lease Sales Highest Lease Sale Bid M&A Deals
$20,000$20,000
$20,563
$20,000
$15,000
erag
e $/
Acre
$10 000
$15,000
rage
$/A
cre
$10 000
$12,940$11,971
$15,000
erag
e $/
Acre
$5,000
$10,000Ave Average $/acre up ~10x since 2009
$3 587
$10,000
$7,123
$5,000
$10,000Ave
$3 587
$10,000
$7,123
$5,000
$10,000Ave
$287$985
$2,245
$645
$02009 2010 2011 2012
$287$985
$2,245
$645$1,555
$3,587
$02009 2010 2011 2012
$287$985
$2,245
$645$1,555
$3,587
$02009 2010 2011 2012
31___________________________________Source: Company Investor Presentations and press releases.Note: $/acre estimate excludes PDP and does not correct for developed acres. PDP valued at $50,000/Boe/d.

Avalon / Bone Spring Production Rapidly Increasing
1,50075,000
Oil (Boe/d) Gas (Boe/d) Well Count
1,20060,000
W (Boe
/d) First Avalon Shale Horizontal Producer
600
900
30,000
45,000
Well CountD
aily
Pro
duct
ion
30015,000
00Dec-01 Dec-02 Dec-03 Dec-04 Dec-05 Dec-06 Dec-07 Dec-08 Dec-09 Dec-10 Dec-11
32___________________________________Source: HPDI.

Recent Industry Results in the Delaware
Avalon ShaleDevon IP of 950 boe/d1st, 2nd, 3rd Bone Spring
Bone Spring (2nd/3rd)XEC: 7 recent wells IPs 560-1,100 boe/d
Hz Brushy/Cherry
Avalon ShaleCHK IP of 1,160 boe/d
Delaware SandsYates IPs of 794 - 1,067 boe/d
Avalon Shale (Loving)
Avalon Shale
Avalon ShaleCXO IP of 1,368 boe/d
3rd B S i (W d)
Avalon Shale (Loving)APC TC IP ~800 boe/d (60% liquids)
Wolfcamp
Avalon ShaleEOG IP of 1,474 boe/d
3rd Bone Spring (Ward)APC TC IP ~700 boe/d (85% liquids)
WolfboneCXO IPs of 200-450 boe/dCRK IPs of 150-300 boe/d
A d k C h EOG O
3rd Bone SpringCHK IP of 2,200 boe/d
33___________________________________Source: Company Investor Presentations, HPDI: Vertical Wolfbone and all horizontal permits since 7/1/2011.
Anadarko Concho EOG OxyChesapeake Devon Mewbourne WhitingCimarex Energen Clayton OtherComstock

Recent Notable Delaware Basin Transactions
June 2011 Land Auction$5,076 - $5,630/acreSeptember 2011 Land Auction$6,150/acre
August 2010 Land Auction$5,313/acre
August 2010 Land Auction$7,250/acre
$ ,
May 2010 Land Auction$3,957/acre July 2011 Land Auction
$6 000/acre$6,000/acre
April 2011 Land Auction$4,200/acre
Concho / Undisclosed: 11/2/2011$330 million; $2,237/acre(1)Comstock Resources / Eagle Oil & Gas:
12/5/2011$333 million: $5,970/acre(1)
Forest Oil Corp. / Undisclosed: 2/16/2012$103 million; $1 635/acre(1)
Clayton Williams$3,333/acreMarch 2012
M&A DealsLease Sales___________________________________Source: Company Investor Presentations and press releases.(1) $/acre estimate excludes PDP and does not correct for developed acres. PDP valued at $50,000/Boe/d.
34
$103 million; $1,635/acre( )

Conclusions

Metrics Should Increase With DrillingLittle to No Type Curve Being EstablishedType Curve Established
$18,000
$20,000
Little to No Horizontal Results
$18,000
$20,000
Type Curve Being EstablishedFocused Horizontal Results
$18,000
$20,000
Type Curve EstablishedWidespread Horizontal Results
$12 000
$14,000
$16,000
re)
$12 000
$14,000
$16,000
e) $12 000
$14,000
$16,000
e)
$8,000
$10,000
$12,000
Pric
e ($
/acr
$8,000
$10,000
$12,000
Pric
e ($
/acr
e
$8,000
$10,000
$12,000
Pric
e ($
/acr
e
$2 000
$4,000
$6,000
$2 000
$4,000
$6,000
$2 000
$4,000
$6,000
$0
$2,000
0.5 1.5 2.5 3.5 4.5 5.5 6.5$0
$2,000
0.5 1.5 2.5 3.5 4.5 5.5 6.5$0
$2,000
0.5 1.5 2.5 3.5 4.5 5.5 6.5
For
d ns
ate
kken
Uti
ca
ellu
s
mia
n ou
rce
brar
a
Lim
e
36_______________________________Source: IHS Herold and TPH research.
Eagl
e Co
nden Ba
U
Mar
c
Perm
Reso
Nio
b
Mis
s. L

Permian – Right Place at Right Time
Oil prices to remain strong
Liquids pricing strong enoughLiquids pricing strong enough
Oil deals increasing
Horizontal applicationsHorizontal applications
Vertical – accessing new pay
Scale running roomScale – running room
Multiple targets
O f b iOpen for business
37

Bakken Themes – Now and In The Future
Major Themes and Catalysts as the Bakken Continues to Evolve
1) Completion Technology 1) Continues to Advance1) Completion Technology
2) Well Performance
3) Infill Drilling/Spacing
1) Continues to Advance
2) IPs Define Sweet Spots
3) Denser Over Time with Pad Drilling
B kk V l ill 4) Three Forks
5) Deep Three Forks
4) Similar to Bakken and Contiguous
5) Emerging Value
Bakken Values will Rise
6) Drilling Costs
7) Western Rough Rider
6) Improve With Time
7) Core Extends West of the Nesson
38

Tudor, Pickering, Holt & Co. does not provide accounting, tax or legaladvice. In addition, we mutually agree that, subject to applicable law, you(and your employees, representatives and other agents) may disclose anyaspects of any potential transaction or structure described herein that are
Disclosure Statement
Tudor Pickering Holt & Co LLC is an integrated energy investment
p y pnecessary to support any U.S. federal income tax benefits, and all materialsof any kind (including tax opinions and other tax analyses) related to thosebenefits, with no limitations imposed by Tudor, Pickering, Holt & Co.
The information contained herein is confidential (except for informationrelating to United States tax issues) and may not be reproduced in whole orin part.
About The Firm
Tudor, Pickering, Holt & Co., LLC is an integrated energy investmentand merchant bank, providing high quality advice and services toinstitutional and corporate clients. Through the company’s two broker-dealer units, Tudor, Pickering, Holt & Co. Securities, Inc. (TPHCSI) andTudor, Pickering, Holt & Co. Advisors, LLC (TPHCA), the company offerssecurities and investment banking services to the energy community.TPH Asset Management, LLC (TPHAM) is an SEC registered investmentadviser that delivers a suite of energy investment strategies TPH
Tudor, Pickering, Holt & Co. assumes no responsibility for independentverification of third-party information and has relied on such informationbeing complete and accurate in all material respects. To the extent suchinformation includes estimates and forecasts of future financial performance(including estimates of potential cost savings and synergies) prepared by,reviewed or discussed with the managements of your company and/ or other
i l i i i b i d f bli hadviser that delivers a suite of energy investment strategies. TPHPartners Management, LLC is an SEC exempt reporting advisor. Certainemployees of TPHAM are also employees of TPHCSI.
The firm, headquartered in Houston, Texas, has approximately130 employees and offices in Denver, Colorado; and in New York, NewYork. Its affiliate, Tudor, Pickering Holt & Co. International, LLP, islocated in London, England.
potential transaction participants or obtained from public sources, we haveassumed that such estimates and forecasts have been reasonably preparedon bases reflecting the best currently available estimates and judgments ofsuch managements (or, with respect to estimates and forecasts obtainedfrom public sources, represent reasonable estimates). These materials weredesigned for use by specific persons familiar with the business and theaffairs of your company and Tudor, Pickering, Holt & Co. materials.
located in London, England.
Contact UsHouston (Research, Sales and Trading): 713-333-2960Houston (Investment Banking): 713-333-7100Denver (Sales): 303-300-1900Denver (Investment Banking): 303-300-1900New York (Research, Sales): 212-220-9254
Under no circumstances is this presentation to be used or considered as anoffer to sell or a solicitation of any offer to buy, any security. Prior tomaking any trade, you should discuss with your professional tax, accounting,or regulatory advisers how such particular trade(s) affect you. This briefstatement does not disclose all of the risks and other significant aspects ofentering into any particular transaction.
( , )London: +011 44(0) 20 3008 6428
www.TudorPickeringHolt.com
Tudor, Pickering, Holt & Co. International, LLP is authorized and regulatedby the Financial Services Authority and is the United Kingdom affiliate ofTudor, Pickering, Holt & Co., LLC.
39
Recommended