Microfinance is experiencing an unprecedented
investment boom. The past five years have seen
remarkable increases in the volume of global
microfinance investments. Between 2004 and 2006,
the stock of foreign capital investment—covering both
debt and equity—more than tripled to US$4 billion.
The entry of private investors is the most notable
change in the microfinance investment marketplace.
New players arrive on the scene every month. Forty
specialized microfinance investment funds have been
established in the past three years alone. Individuals
and institutional investors—including international
retail banks, investment banks, pension funds, and
private equity funds—are all looking for ways to
channel capital into microfinance, and investment
banking techniques are being introduced to create
investment vehicle alternatives that appeal to an
increasingly broad range of investors.
This new investment stream is good news for
microfinance providers. Microfinance needs a broader
capital market to secure the funding required to scale-
up outreach and serve a greater number of financially
excluded, low-income people.
It is tempting to believe that this investment boom
signals the entrance of mainstream commercial
investors seeking to maximize, risk-adjusted returns.
“Hedge funds, VCs and other big investors are seeing
huge profit potential in tiny loans” reads a headline
from a recent Business Week. However, the reality is
that, so far, the bulk of private investment in
microfinance has come from investors with a social
orientation alongside their financial motivations.
Microfinance is a very attractive proposition for a
growing segment of socially responsible investors.
The socially responsible investment (SRI) market is
huge, with over US$4 trillion in assets. The emerging
markets share accounts for a meager US$5 billion, but
this is growing fast. The SRI world comprises a wide
spectrum of investors with differing expectations,
from those willing to receive below-market returns to
those seeking competitive returns within the context
of a social mandate. SRIs are attracted to
microfinance institutions (MFIs) because MFIs are
“double bottom-line” institutions that seek to have a
positive social impact alongside financial returns.
That said, a few mainstream investors with no
particular social focus also are beginning to invest in
MFIs, although on a very small scale. This raises an
important question: Will purely commercial, return-
maximizing investors allow microfinance to uphold the
social mission that has been at the heart of its success?
This Focus Note builds on CGAP’s earlier industry
research on foreign capital investment presented in
Ivatury and Reille (2004) and Ivatury and Abrams (2005).
Foreign Capital Investment in MicrofinanceBalancing Social and Financial Returns
This new investment stream is good newsfor microfinance providers. Microfinanceneeds a broader capital market to secure thefunding required to scale-up outreach andserve a greater number of financiallyexcluded, low-income people.
11627WBCGAP_Newsletter:Layout 1 3/3/08 1:27 PM Page 1
FOC
US
NO
TE
No. 44February 2008
Xavier Reille and Sarah Forster, with research assistance from Tanya Surendra

2
• It describes the new landscape of cross-border
investments and presents an overview of who is
investing and why.
• It presents the first ever published data on the
performance of microfinance investment vehicles
(MIVs).
• It provides an analysis of the latest developments
and issues confronting both the microfinance debt
and equity markets.
• Finally, it explores how the influx of private-sector
investment might influence the social focus of
microfinance development.
The landscape of foreign investment in microfinance
There are three main categories of microfinance
investors: public investors, also known as international
or development finance institutions (DFIs); individual
investors, whether retail or high net worth; and insti-
tutional investors. See Figure 1.
Fixed income: Money market return. Theaverage net return for fixed-income funds is closeto money market, 5.8% in U.S. dollars and 3.2% ineuros. —CGAP survey, 2006
Equity: Too soon to tell. Equity investment inmicrofinance is surging, and MFI valuations are up,but it’s too soon to value the average net return formicrofinance equity funds. —CGAP survey, 2006
DFIs
Microfinance Institutions
Government &Networks
Microfinance Investment
Vehicles
Individuals Institutional Investors
Figure 1: Foreign investment microfinance landscape
US$ 3.9 billioninvested in total
n/a $1.5 billion $2 billion
$1.5 billion$800 million$150 million $700 million
$50 million $350 million
Source: CGAP survey, 2006.
11627WBCGAP_Newsletter:Layout 1 3/3/08 1:27 PM Page 2

3
Public investors
DFIs—the private-sector investment arms of govern-
ment-owned development institutions—provide just
over half of the total foreign investment into microfi-
nance today.1 There are 19 DFIs, including multilateral
organizations, such as EBRD, IADB, and IFC, and
bilateral organizations, such as AECI-ICO (Spain), KfW
(Germany), and OPIC (United States).
DFIs invest in microfinance as part of their official
mission to support sustainable private-sector develop-
ment in developing countries. Most DFIs started
financing microfinance in the late 1990s, following on
the grant funding of donor agencies for microfinance
since the 1970s. DFIs brought a more commercial
approach to the industry, providing quasi-commercial
loans, equity, and guarantees to MFIs capable of scale
and profitability.
DFIs have more than doubled their investment in
microfinance over the past two years, from US$1
billion in 2004 to US$2.5 billion as of the end of
December 2006 (CGAP DFI Survey 2006). This trend
looks set to continue. Between 2005 and 2006 alone,
DFI investment grew by 37 percent and is expected to
exceed US$3 billion by the end of 2007. Five DFIs
hold 72 percent of all DFI-related investments: German
KfW (29 percent), EBRD (13 percent), IFC (12 percent),
Spanish AECI-ICO (11 percent), and Dutch FMO (7
percent). See Figure 2.
The official role of DFIs is to foster private investment
in developing countries. In the early years of their
involvement, DFIs played an important role as funders
of today’s leading MFIs. They assumed financial risks
at a time when microfinance was less proven as a sector
and private funders were much less willing to engage.
Now that these MFIs have proven their commercial
1 DFI investment in this survey includes only public investments in privately run MFIs. It does not include bilateral or multilateral credit lines or grants togovernments in developing countries for microfinance projects.
0
500
1,000
1,500
2,000
2,500
3,000
3,500 2007 Forecast
$1,787 MM
$2,481 MM
$3,000 MMStructured Finance
Guarantee
Equity
Debt
2005 2006 2007
US$
Mill
ions
Figure 2: DFI Microfinance Investment Growth since 2004
Source: CGAP DFI Microfinance Portfolio (2006).
11627WBCGAP_Newsletter:Layout 1 3/3/08 1:27 PM Page 3

4
viability, private investors are often willing to provide
capital. Public investors have not always been quick to
respond to the growing appetite of private investors by
exiting the most commercially viable markets. Rather,
there has been competition and, in some cases,
crowding out of private investors with DFIs offering
lower interest rates and more flexible terms.
Individual investors
Socially motivated individual “retail” investors play an
important, though often unrecognized, role in funding
microfinance. Oikocredit, a Dutch cooperative society
established in 1975 by the World Council of Churches,
was one of the first organizations to raise retail
investment for microfinance. It has over 27,000
members from its social and faith-based networks.
Other microfinance investment funds that raise capital
from individuals include the Calvert Foundation in the
United States and specialized mutual funds registered
in Europe, such as Dexia Microcredit, responsAbility,
and the Triodos Fair Share Fund. Over 80 percent of
retail investors in these funds are based in Europe,
mainly in Holland, Switzerland, and Germany.
In recent years, high net worth individuals have started
to engage in microfinance investing as venture
philanthropists. These are typically successful entre-
preneurs looking to make good use of both their
money and business skills to help scale-up microfi-
nance. Examples include Pierre Omidyar, founder of
eBay, who gave US$100 million to Tufts University to
create the Omidyar-Tufts Microfinance Fund, and Bob
Patillo, the real estate entrepreneur who founded the
Gray Ghost Fund. Grameen Foundation has raised
guarantee commitments of over US$30 million from
nine high net worth individuals, which has succeeded
in directly leveraging US$112 million in local currency
financing for MFIs.
Today it is also possible for more individuals to engage
in microfinance investing through online, peer-to-peer
lending initiatives, such as Kiva. Kiva enables MFIs to
raise interest-free debt capital directly from social
investors via the Internet. Kiva investors fund
microentrepreneurs of their choice and receive regular
updates on their projects. Since launching in October
2005, over 50 MFIs in 30 countries have raised debt
from more than 180,000 individual social investors
via Kiva.org.
Other online investment organizations are emerging,
such as MicroPlace and Globe Funder. MicroPlace is
the first broker-dealer registered with the Securities
and Exchange Commission that specializes in micro-
finance securities for retail investors in the United
States. Unlike Kiva, this fund provides some returns to
investors. Such business models tap into both the
growing participation in online social communities
and the desire of individuals to make a difference.
Procredit Bank in Germany also plans to raise capital
online for its microfinance bank affiliates.
Institutional investors
Over the past two years, institutional investors, including
international banks, pension funds, and insurance
companies, have begun to take a keen interest in
microfinance investment. Many are responding to signif-
icant retail client demand for investment in this sector.
The first institutional investors in microfinance were
international banks, which initially acted through their
philanthropic departments. Deutsche Bank was the
first commercial bank to establish a fund for MFIs in
1998 through its philanthropic arm, Deutsche Bank
Americas Foundation. Today, wholesale services to
MFIs, in the form of loans, guarantees, and technical
assistance, are the most widespread form of interna-
11627WBCGAP_Newsletter:Layout 1 3/3/08 1:27 PM Page 4

5
tional bank engagement in microfinance. Lending to
MFIs by international banks reached nearly US$550
million in 2006—an increase of US$100 million over
2005 (ING 2006).
International banks have played an important role in
introducing mainstream financing techniques to MFIs.
In 2005, Citigroup established a microfinance group
that spurred financial innovation for local currency
financing. For example, it arranged the first wholly
privately placed MFI bond for Mibanco in Peru and
the first investment-grade local currency bond issues
for MFIs with Compartamos in Mexico. It also
arranged and invested in the groundbreaking securi-
tization of BRAC in Bangladesh and structured the first
local currency loan syndication for ProCredit Bank in
Romania. Citigroup is a banker to a number of
microfinance funds providing foreign exchange hedging
and agency services.
Large global investment banks form the second wave
of institutional investors. They offer MFIs investment
banking and fund distribution services and act as
intermediaries between securities issuers and the
investment community. Credit Suisse, for example,
distributes the responsAbility Global Microfinance
Fund. Morgan Stanley arranged and distributed the
BlueOrchard Loans for Development (BOLD) I and II
bond offerings and is now building a business unit to
offer a full range of investment banking services to the
microfinance industry.
Global insurance companies and pension funds are
also starting to look at microfinance investment as part
of their SRI investment portfolio. Socially responsible
funds run by insurance companies, such as Morley in
the United Kingdom and AXA in France, have made
small investments in microfinance. Some of the larger
pension funds, such as TIAA-CREF in the United States,
have made more significant allocations (up to US$100
million) to microfinance.2
The latest investors to be drawn to high-growth MFIs
are private equity investors that focus on emerging
markets. A few, such as Sequoia, Blackstone Group,
Carlyle Group, and Dubai-based Legatum, have each
made investments in the US$20 million to US$40 million
range in highly profitable MFIs in the most developed
microfinance markets, such as Mexico and India.
These investors are focused on a narrow niche market
of high-growth MFIs that are capable of offering
competitive market returns.
The interest of global banking groups, such as Citi-
group, Morgan Stanley, Deutsche Bank, ABN AMRO,
and Societé Générale, and private equity investors
signals the increasing credibility of microfinance as an
attractive investment proposition.3
MIV Performance
Approximately half of all microfinance investment
from DFIs, individuals, and institutions is channeled
through specialized financial intermediaries. These
MIVs comprise a diverse range of organizations in
terms of origin, investor base, philosophy, instruments,
and targeted return rates.4
The number and size of MIVs have grown exponentially.
Over 80 MIVs are now in operation, with US$3 billion
under management. MIV investment levels have dou-
bled between 2005 and 2006, reaching US$2 billion
in 2006.
Individual investors and foundations were early back-
ers of MIVs and continue to form the mainstay of
their funding at 50 percent. DFIs were early sub-
scribers as well and drove several MIV start ups, such
as the equity fund ProFund. However, their share of
MIV funding has declined from 36 percent in 2005 to
30 percent in 2006. Institutional investors are rapidly
2 TIAA-CREF created a US$100 million Global Microfinance Investment Program within its SRI allocation; its first investment is a US$43 million privateequity stake in ProCredit Holding AG.
3 Domestic banks are also aggressively moving into microfinance. More than 300 local universal banks provide loans and banking services to existing MFIsor offer microfinance services to low-income clients.
4 A majority of MIVs are private companies (69 percent), followed by nonprofit/nongovernmental organizations/foundations (15 percent), and cooperatives(8 percent); a further 8 percent are not a separate legal entity (MIV 2005 Survey).
11627WBCGAP_Newsletter:Layout 1 3/3/08 1:27 PM Page 5
6
catching up, having doubled their investment share
during the past two years to 20 percent.
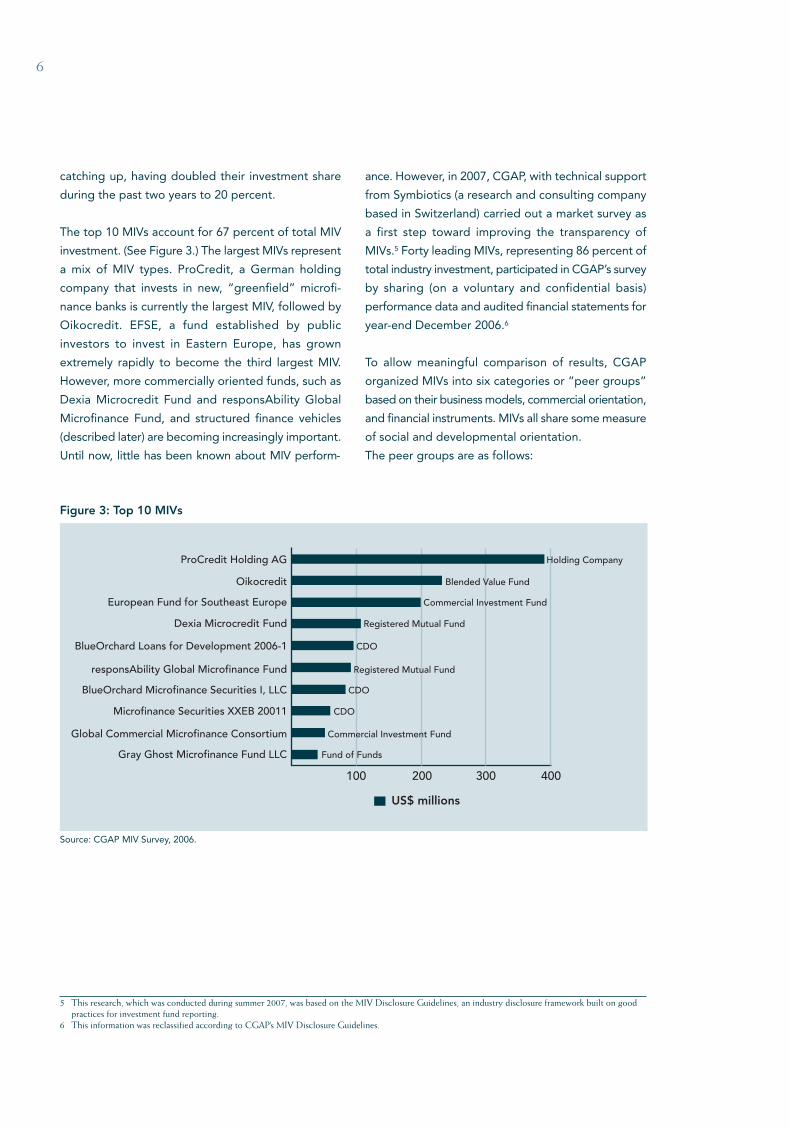
The top 10 MIVs account for 67 percent of total MIV
investment. (See Figure 3.) The largest MIVs represent
a mix of MIV types. ProCredit, a German holding
company that invests in new, “greenfield” microfi-
nance banks is currently the largest MIV, followed by
Oikocredit. EFSE, a fund established by public
investors to invest in Eastern Europe, has grown
extremely rapidly to become the third largest MIV.
However, more commercially oriented funds, such as
Dexia Microcredit Fund and responsAbility Global
Microfinance Fund, and structured finance vehicles
(described later) are becoming increasingly important.
Until now, little has been known about MIV perform-
ance. However, in 2007, CGAP, with technical support
from Symbiotics (a research and consulting company
based in Switzerland) carried out a market survey as
a first step toward improving the transparency of
MIVs.5 Forty leading MIVs, representing 86 percent of
total industry investment, participated in CGAP’s survey
by sharing (on a voluntary and confidential basis)
performance data and audited financial statements for
year-end December 2006.6
To allow meaningful comparison of results, CGAP
organized MIVs into six categories or “peer groups”
based on their business models, commercial orientation,
and financial instruments. MIVs all share some measure
of social and developmental orientation.
The peer groups are as follows:
5 This research, which was conducted during summer 2007, was based on the MIV Disclosure Guidelines, an industry disclosure framework built on goodpractices for investment fund reporting.
6 This information was reclassified according to CGAP’s MIV Disclosure Guidelines.
ProCredit Holding AG Holding Company
Oikocredit Blended Value Fund
European Fund for Southeast Europe Commercial Investment Fund
Dexia Microcredit Fund Registered Mutual Fund
BlueOrchard Loans for Development 2006-1 CDO
responsAbility Global Microfinance Fund Registered Mutual Fund
BlueOrchard Microfinance Securities I, LLC CDO
Microfinance Securities XXEB 20011 CDO
Global Commercial Microfinance Consortium Commercial Investment Fund
Gray Ghost Microfinance Fund LLC Fund of Funds
100
US$ millions
200 300 400
Figure 3: Top 10 MIVs
Source: CGAP MIV Survey, 2006.
11627WBCGAP_Newsletter:Layout 1 3/3/08 1:27 PM Page 6

7
1. Registered mutual funds targeting primarily retail
investors and seeking near a money market returns
from primarily fixed-income investment
2. Commercial fixed-income investment funds tar-
geting public and private institutional investors and
seeking close to a market return
3. Structured finance vehicles offering a range of
asset-backed securities with different risk and return
profiles to microfinance investors
4. Blended-value funds offering below-market returns
to socially focused investors and providing a mix of
debt and equity finance to MFIs
5. Holding companies of microfinance banks
providing mainly equity finance and technical
assistance to start-up microfinance banks
6. Private equity funds seeking a market return
(See Table 1 and a list of participating MIVs in Annex 1)
Registered Mutual Funds
CommercialInvestment
Funds
Structured Finance Vehicles
Blended-Value Funds
Holding Companies
Private Equity Funds
Number of FundsSurveyed
6 5 4 7 4 6
Total Assets(US$ million)
391 437 279 146 62 84
Total MicrofinanceInvestments(US$ million)
293 280 268 111 44 70
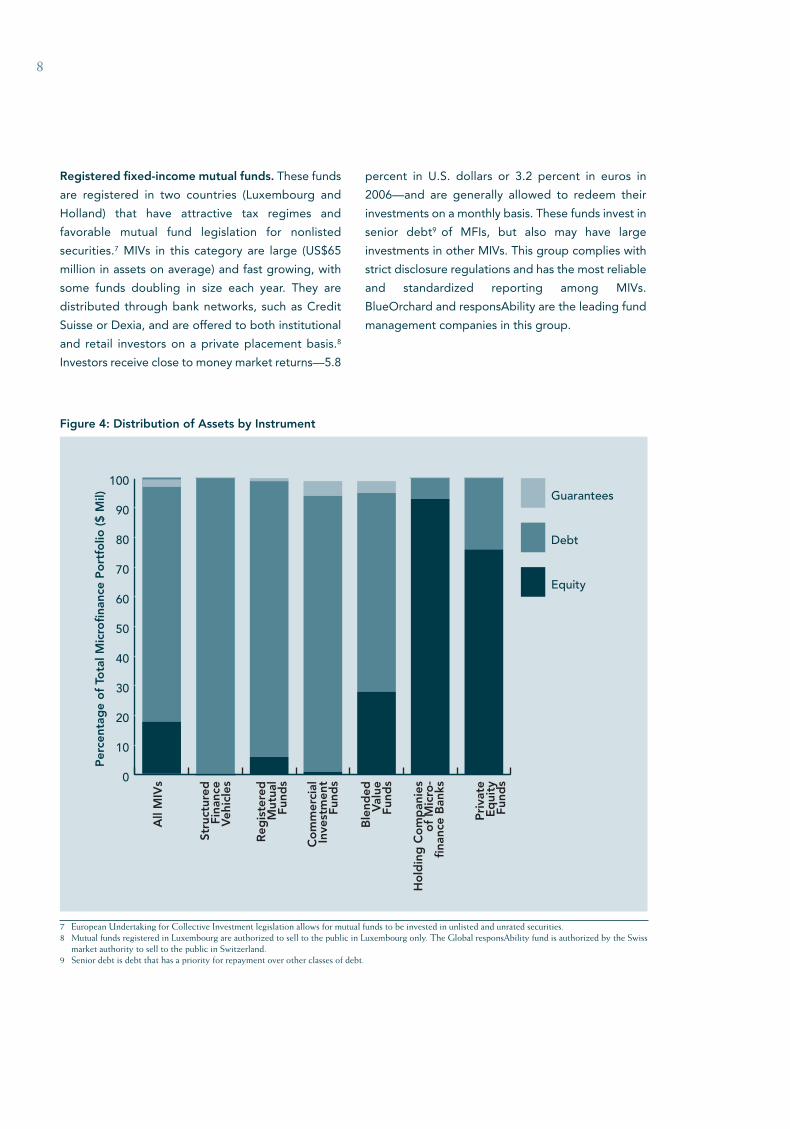
Equity as Percent-age of Microfi-nance Portfolio
6% 1% 0% 28% 93% 76%
Debt as Percent-age of Microfi-nance Portfolio
93% 93% 100% 67% 7% 24%
Average Fund Size(US$ million)
65.1 87.2 69.7 21 15.5 14
Return in US$ 5.80% 4.8% (euro)
5.3% (AA)
1.5% NA NA
Average Total Ex-pense Ratio**
2.7% 2.0% 1.3% 6.1% 8.4% 4.1%
Table 1: MIV Peer Groups*
FIXED INCOME MIXED EQUITY
*The following eight MIVs could not be categorized and included in one of the six peer groups because of lack of data, business model, size, ortrack record: Oikocredit, Calvert Social Investment Foundation, Finethic Microfinance SCA SICAR, responsAbility SICAV Microfinance LeadersFund, Gray Ghost Microfinance Fund LLC, Unitus, ProCredit Holding, and BBA Codespa Microfinanzas.**Average total expense ratio, including management fees, administration, and custody costs Source: CGAP MIV Benchmark Project
11627WBCGAP_Newsletter:Layout 1 3/3/08 1:27 PM Page 7
8
Registered fixed-income mutual funds. These funds
are registered in two countries (Luxembourg and
Holland) that have attractive tax regimes and
favorable mutual fund legislation for nonlisted
securities.7 MIVs in this category are large (US$65
million in assets on average) and fast growing, with
some funds doubling in size each year. They are
distributed through bank networks, such as Credit
Suisse or Dexia, and are offered to both institutional
and retail investors on a private placement basis.8
Investors receive close to money market returns—5.8
percent in U.S. dollars or 3.2 percent in euros in
2006—and are generally allowed to redeem their
investments on a monthly basis. These funds invest in
senior debt9 of MFIs, but also may have large
investments in other MIVs. This group complies with
strict disclosure regulations and has the most reliable
and standardized reporting among MIVs.
BlueOrchard and responsAbility are the leading fund
management companies in this group.
7 European Undertaking for Collective Investment legislation allows for mutual funds to be invested in unlisted and unrated securities.8 Mutual funds registered in Luxembourg are authorized to sell to the public in Luxembourg only. The Global responsAbility fund is authorized by the Swiss
market authority to sell to the public in Switzerland.9 Senior debt is debt that has a priority for repayment over other classes of debt.
0
10
20
30
40
50
60
70
80
90
100 Guarantees
Debt
Equity
Pri
vate
Eq
uity
Fund
s
Ho
ldin
g C
om
pan
ies
of
Mic
ro-
fina
nce
Ban
ks
Ble
nded
Val
ueFu
nds
Co
mm
erci
alIn
vest
men
tFu
nds
Reg
iste
red
Mut
ual
Fund
s
Stru
ctur
ed F
inan
ceV
ehic
les
All
MIV
s
Per
cent
age
of
Tota
l Mic
rofi
nanc
e P
ort
folio
($
Mil)
Figure 4: Distribution of Assets by Instrument
11627WBCGAP_Newsletter:Layout 1 3/3/08 1:27 PM Page 8

9
Commercial fixed-income investment funds. This
group is composed of commercially oriented funds
that provide senior debt to high-growth MFIs. They
are subscribed mainly by high net worth and institu-
tional investors and are not regulated and supervised
by capital market authorities.10 They include both
debt funds, such as Microvest in the United States,
and structured funds, such as the Global Microfinance
Consortium. This group is one of the most highly
leveraged, with external debt representing 30 percent
of assets. MIVs in this group tend to make large
investments (three times the mutual fund average)
and have, as a result, relatively low operating cost
ratios. The average net return in euros for this group
is 4.8 percent, above that for mutual funds, although
their track record remains too short (less than two
years) to provide meaningful comparisons.
Structured Finance Vehicles. Structured finance
vehicles represent one of the newest forms of financing
in microfinance. Most structured finance instruments
pool and repackage microfinance loan assets as mar-
ketable securities. A majority of structured finance
vehicles are collateralized debt obligations (CDOs).11
The first formal CDO,12 BlueOrchard Microfinance
Securities I (BOMS), was structured in 2004–2005 by
BlueOrchard in partnership with OPIC and Developing
World Markets (a private U.S. company set up by
emerging market banking professionals). Fourteen
MFIs received loans with a seven-year maturity, and
investors were offered five risk classes of the same
maturity.13 Since then, seven CDOs have been struc-
tured, and over US$525 million in microfinance securities
have been issued (see Annex 2 for details).
Four CDOs participated in the CGAP survey. The
vehicles are invested in leading MFIs in just two
regions—Latin America and the Caribbean (LAC) and
Eastern Europe and Central Asia (ECA). This group
provides MFIs with larger loans (three times the MIV
average) and longer maturities (one-and-a-half times
the MIV average).
Total expense ratios are relatively low compared to
other funds (half) because deals are large and the
portfolio is not actively managed. However, CDOs
are costly to set up and involve expensive due
10 With the exception of EFSE, which is registered as a SICAV and regulated by CSSF, the Luxembourg market authority.11 Microfinance CDOs (also known as collateralized loan obligations) are funds that pool and repackage loans to MFIs and divide the credit risk among
different tranches according to relative risk and return: senior tranches, mezzanine tranches, and equity tranches. Repayments to investors follow a“waterfall” structure: holders of senior tranches are paid first, followed by mezzanine tranches, and then junior tranches. Thus senior note holders receivethe lowest returns to reflect a high certainty of payment. Equity investors are paid on maturity only if there is residual cash left after all other investorshave been paid. CDOs serve as an important funding vehicle for portfolio investments in credit-risky, fixed-income assets.
12 The Latin American Challenge Investment Fund, set up in 1999, was the first microfinance structured fund to provide various “risk tranches” to investorswith a waterfall structure.
13 One senior, three subordinated, and one class of equity.
Registered mutual funds
Average asset size: US$65 millionAverage age: 4 yearsAverage deal size: US$1 millionMain instruments: 93% debtGeographic focus: 77% in LAC and ECA Main subscribers: 59% individuals,
32% institutional investors
Commercial fixed-income funds
Average asset size: US$87 millionAverage age: 1.4 yearsAverage deal size: US$2.5 millionMain instruments: 93% debtGeographic focus: 96% LAC and ECAMain subscribers: 48% individuals and foundations,
44% institutional investors
Structured finance vehicles
Average asset size: US$70 millionAverage age: 0.8 yearAverage deal size: US$4.1 millionMain instruments: 100% debtGeographic focus: 93% LAC and ECAMain subscribers: 61% institutional investors,
27% DFIs
11627WBCGAP_Newsletter:Layout 1 3/3/08 1:27 PM Page 9

10
diligence processes and legal fees that are not always
priced in at full cost.
Because of their credit ratings and the well-covered
default risk, senior tranches of structured finance
vehicles offer the most viable investment opportunities
for commercial investors. The BOLD II two senior
tranches, for example, were rated AA and BBB by
Standard & Poor’s and were offered to private
investors at a premium of up to 40 basis points and 95
basis points above three months Euribor, respectively.
So far junior and equity tranches have been purchased
by public investors and MIVs.14 Junior tranches are
attractive investment opportunities for knowledgeable
investors, with an average yield in U.S. dollars close to
8 percent in 2006.
Blended value fixed-income and equity funds.
Blended value fixed-income and equity funds include
long-established funds, such as Triodos Doen Founda-
tion, and newer funds, such as Micro-Credit
Enterprises. Blended value funds are the most heavily
mission driven and offer a mix of social and financial
returns, with target financial returns typically below
market rates. Their average return is 1.5 percent.
Eighty-five percent of investments come from individ-
uals, foundations, or nongovernmental organizations.
These MIVs have significant investments in
underserved regions, such as Africa and East Asia, and
tend to invest in small and medium-size MFIs. Not sur-
prisingly, this category has one of the highest total
expense ratios for debt funds explained by the small
average deal size (one-third the MIV average) and
the high cost of due diligence and legal work for such
small deals.
Holding companies of microfinance banks. This
group comprises holding companies of microfinance
banks established by leading microfinance consulting
companies and DFIs. They provide equity finance to
start-up, greenfield microfinance banks replicating the
successful model developed by ProCredit Holding.15
With the exception of ProCredit,16 the track record
of holding companies is too short to assess their
performance. Holding companies receive the highest
share of public investment and benefit from additional
public subsidies through DFI-supported technical
assistance. This group effectively serves as the
investment arm of DFIs set up to create new MFIs in
underserved markets. Together, they have a pipeline
of more than 25 new microfinance banks in frontier
markets, such as Congo, Yemen, and Algeria. This group
has the highest share of investment in Sub-Saharan
Africa (31 percent).
Equity funds. This group comprises equity firms and
venture capital companies offering a blend of equity
and convertible debt to high-growth MFIs in emerging
markets. MIVs in this category include first-generation
venture capital funds (set up by DFIs or networks,
14 Structured finance vehicles is the group with the largest amount of funding coming from other MIVs.15 ProCredit Holding is a holding of microfinance banks; it did not participate in CGAP’s survey.16 Not included in the peer group results.
Blended value investment funds
Average asset size: US$20.8 millionAverage age: 10.4 yearsAverage deal size: US$0.6 million Main instruments: 67% debtGeographic focus: 39% LAC and 26% Sub Saharan
Africa, and 17% AsiaMain subscribers: 85% individuals and foundations
Holding companies
Average asset size: US$15.5 millionAverage age: 2.3 yearsAverage deal size: US$1.8 millionMain instruments: 93% equityGeographic focus: 48% ECA and 31% Sub-Saharan
AfricaMain subscribers: 63% DFIs, 30% institutional
investors
11627WBCGAP_Newsletter:Layout 1 3/3/08 1:27 PM Page 10

11
such as ACCION) and second-generation equity funds
with a more commercial or regional focus, with private
backers (e.g., Bellwether in India). This group of MIVs
has the highest share of investments in Asia and large
commitments in Sub-Saharan Africa. Although DFIs
are the major investors in equity funds, their share is
decreasing, as foreign and local private institutional
investors raise their commitments. This peer group
has the smallest asset size but the highest growth rate.
Results are challenging to analyze, given different
accounting practices, notably portfolio valuation prin-
ciples. Because of the absence of historic data, there
is also insufficient evidence to develop relevant
performance benchmarks. Private equity funds are
expensive to operate, with total expense ratios ranging
from 3 to 6 percent, and have costs ratios similar to
that of blended value funds.
Latest trends and issues in debtand equity funding
Fixed income: From a sellers to a buyers market17
For leading MFIs, the supply of credit is abundant and
growing. More and more lenders, both foreign and
local, are entering the market each month.
Fixed-income investment—the provision of debt-
based products—has so far been the mainstay of
microfinance investment. Debt accounts for 78 percent
of all MIV investment. In 2006 alone, foreign investors
lent a total of US$1 billion. However, the pool of MFIs
seeking, and able to service, commercial debt finance
is relatively small, and most of the debt is concen-
trated in the largest 150 MFIs.
The outlook for fixed-income investment is looking
less bullish than a few years ago. Gearing—the ratio
of long-term debt to total capital—has increased
significantly. With the average debt-to-equity ratio
now at 7-to-1 for large MFIs,18 further borrowing will
be limited by capital adequacy limits and prudential
financial management. Moreover, most foreign debt
is denominated in hard currency. As MFI managers
become increasingly aware of the risks of borrowing
in hard currency and the costs and difficulty of hedging
that risk, the appetite for more hard currency debt
may decline, with a growing shift in currency risk to-
ward investors.
Competition for good credit is becoming fierce with the
entry of new funds and local banks, together with DFIs,
aggressively seeking new opportunities to expand their
own portfolios. High-performing MFIs now have the
upper hand. They are making lenders compete and
driving hard bargains on terms. In some markets,
such as Bosnia, pricing has been cut by as much as 250
basis points in just three years. As one Bosnian MFI
manager put it: “There is a lot of competition among
foreign lenders to provide us capital. This means we’re
in a position to negotiate hard with investors and ask for
lower interest rates. We need to reduce our own interest
rate to clients to remain competitive, so we are seeking
as low cost funds as possible.”
As loan pricing is coming down, and gearing
increases, risk-adjusted returns appear less and less
attractive in many markets.
17 A buyer’s market is a market that has more sellers than buyers. Low prices result from this excess of supply over demand. It is the opposite of a seller’s market. 18 MIX research conducted by Adrian Gonzalez for CGAP.
Private equity funds
Average asset size: US$14 millionAverage age: 2.7 yearsAverage deal size: US$1.5 millionMain instruments: 76% EquityGeographic focus: 39% LAC and 27% Sub-Saharan
AfricaMain subscribers: 47% DFI, 32% institutional
investors
11627WBCGAP_Newsletter:Layout 1 3/3/08 1:27 PM Page 11

12
What has been the investor’s response?
Larger amounts, longer maturities. Investors are
responding to MFIs’ demand for larger and longer
term loans to support their growth plans. The MIV
average fixed-income transaction size has increased
by 30 percent in just one year. The result is further risk
concentration toward large MFIs, known as the
“bunching effect.” MIVs have, on average, 40 percent
of their investment in only five MFIs.19 DFIs also have
a high level of direct credit exposure to leading MFIs,
such as Alamana or Banco Solidario. Managing credit
exposure limits is becoming an issue.
Loan maturities are increasing. DFIs offer loan maturities
of up to 15 years, and some structured finance vehicles
are lending up to seven to eight years. Registered
mutual funds, which used to lend short term, now
have an average maturity of close to two years. MFI
managers are attracted by such longer term finance,
which is not available on the local market.
Greater appetite for risk: Moving down market.
MIVs and DFIs are trying hard to reach down market
and lend to smaller MFIs. DFIs have supported the
creation of local funds, such as Jaida in Morocco and
Bellwether in India, to provide capital to emerging
MFIs. But their absorption capacity is limited.
According to the MIX, 300 medium-size MFIs account
for only 11 percent of total MFI assets. Their leverage
is almost as high as the largest 150 MFIs, even though
they are, on average, 12 times smaller. Many medium-
size MFIs need equity (and, in some cases, technical
assistance) more than debt.
Local currency lending. Eighty-five percent of debt
financing to MFIs is in foreign currency.20 However,
investors are increasingly developing hedging instru-
ments to enable more local currency lending. Some
large funds, particularly registered funds and CDOs,
have already adopted hedging mechanisms to lend in
local currency. ResponsAbility now offers loans in 15
currencies with the ambition to reach 40 in the next
three to five years. DFIs, too, are developing hedging
instruments.21 Yet, most MIVs are still small and unable
to afford the cost of hedging required for
local currency loans.
Thus far, the foreign fixed-income picture has been
dominated by a few funds investing in hard currency in
a small number of high-growth, large-cap MFIs, mainly
regulated institutions, in Latin America and Eastern
Europe. But it is a very active and quickly changing
market. Competition has triggered product diversifica-
tion and innovation. The range of debt products avail-
able to MFIs today is broad and includes subordinated
loans, long-term loans, local currency loans, and guar-
antees, among others. Debt providers are also moving
down market, increasing the flow of capital to medium-
size MFIs. However, in many places, the debt market
is overheated, and pricing does not reflect credit and
country risks.
Equity, from social bear to commercialbull…22
Equity investment has naturally lagged behind fixed-
income investment and was long the domain of
socially motivated and public investors.
At first glance, the investment opportunities for equity
investors look very attractive. Market-oriented MFIs
can combine high growth rates and double-digit
returns on equity with plenty of room for upside,
given the absence of competition among microfi-
nance providers in most markets and the potential for
improved economies of scale, product diversification,
and higher leverage.
19 Simple average top five credit exposure of 40 funds participating in the CGAP MIV 2006 survey.20 See Featherston, Littlefield, and Mwangi (2006) and CGAP (2006).21 In 2007, FMO, in partnership with private and public investors, launched the TCX Currency Exchange Fund to offer currency products, such as interest
swaps, for emerging markets. 22 A bear market is a period during which investment prices fall. It is the opposite of a “bull market” when investment prices rise faster than their historical
averages.
11627WBCGAP_Newsletter:Layout 1 3/3/08 1:27 PM Page 12

13
However, there are challenges for private equity
investing, such as the restricted pool of “investable”
MFIs capable of hosting shareholder investment, the
lack of standards and benchmarks for valuation,23 the
lack of a secondary market, and limited exit options.
These factors depressed equity pricing until 2006.24
ProFund is the first microfinance private equity fund,
created by socially oriented investors and DFIs,
to complete a cycle of investment and liquidation.
It invested US$20 million in 10 MFIs in Latin America
during a 10-year period (1995–2005) with an average
annual return of 6 percent. Most transactions were
structured as convertible debt rather than common
equity, and sales on exit were made to management
or sponsors, rather than to third parties.
However, the market is evolving quickly. More mature
MFIs are making the decision to transform into “for
profit” social businesses and shareholder models and
exit options are increasing. These trends all point to-
ward improved equity investment opportunities in
the future.
More shareholder-owned MFIs. According to a
recent survey by Council of Microfinance Equity
Funds, there are 222 regulated commercial and share-
holder-owned MFIs today as compared with 124 two
years ago (Rhyne and Busch, 2006). Returns are also im-
proving for large MFIs.25 Microcredit portfolio quality
remains excellent, and MFIs have access to an abun-
dant pool of low-cost debt that they can leverage to
boost profits further.
MFI valuations are up. The dramatic initial public
offering (IPO) of Compartamos in Mexico with a val-
uation at 13 times book value caught many market
participants by surprise. This has encouraged other
MFIs to raise capital through this route: the ProCredit
Group in Germany, SKS in India, and Independencia
(a consumer lending company) in Mexico are all taking
steps to pursue IPOs in their local markets. These
landmark transactions are driving up MFI valuations.
Recent private placement transactions have been
reported at one-and-a-half to three times book value.
The MFI multiplier is approaching the level of the
emerging market bank multiplier, where banks consis-
tently sell at two to three times book value. This is de-
spite MFIs’ younger age, smaller size, and relative lack
of product diversification (DiLeo and Fitzherbert 2007).
Exit options emerging in some markets. The IPOs
described above are the first real exits the
microfinance market has recorded, beyond sales to
existing shareholders or specialized microfinance
investors. In large markets like India and Mexico, with
sufficient depth to allow for an eventual public offer,
some private equity funds are beginning to take
notice of MFIs. For example, Sequoia Capital, a venture
capital firm that backed Google and You Tube among
others, has invested in SKS Microfinance in India with
the explicit expectation that an IPO will yield significant
capital gains.
Overall, the supply of private equity finance has
increased significantly, with eight specialized equity
funds established in the past two years and institu-
tional
23 IFRS or GAAP rules of marking-to-market become illusory in most emerging markets because of the absence of mark-to-market transactions. 24 According to research conducted by the Council of Microfinance Equity Fund and Opportunity International, equity transactions through private
placements over 2002–2005 were priced on average at only 1.1 times book value.25 The top 50 MicroRate MFIs have increased their median return on equity from 14 to 23 percent over the past five years, according to Microrate.
11627WBCGAP_Newsletter:Layout 1 3/3/08 1:27 PM Page 13

14
investors also investing directly in MFIs. Established
private equity funds, such as Blackstone or Legatum,
are also investigating microfinance opportunities and
taking equity positions in a few MFIs with high returns
and growth potential. Other players, such as banks
(both local and foreign) and mobile network operators,
are also beginning to assess potential acquisitions in
microfinance to gain access to MFIs’ large and loyal
customer base and attractive delivery infrastructure.
Such players could emerge as significant strategic
investors in large MFIs.
Is there a microequity bubble? Will microfinance equity
valuations outstrip emerging market commercial bank
averages? What will happen if microfinance banks
don’t meet return expectations? The equity market is
indeed showing some signs of exuberance. We are in
a growth cycle. However, our view is that we are likely
to see a period of consolidation in market prices, but
not a collapse, because microfinance business funda-
mentals are still good.
In the most developed microfinance markets, publicand private investors are increasingly competing forthe same microfinance investment opportunities.When this happens, DFIs often undercut privateinvestors by offering lower interest rates or moreflexible terms. This retards the pace of capital marketdevelopment.
Not all DFIs and socially oriented MIVs can be put inthe same basket however. Some offer low interestrates and are prepared to accept below market returnswhile others charge higher rates and expect higherreturns (with the social return as an added benefit),much like private investors. For this reason, the public–private angle is not the most helpful to understandbehavior; a more relevant distinction to make isbetween purely commercial profit-seeking capital asopposed to blended value funds—both public andprivate.
Although several DFIs recognize that they should exitthe most developed markets by, for example, sellingtheir microfinance assets in large, profitable MFIs toprivate investors, it is not always clear when and howto exit. Exiting from mature investments cansignificantly reduce DFIs’ overall investment portfolios,
conflicting with management incentives that oftenfavor a high-growth strategy. From the MFIs’perspective, the long-term commitment and brandvalue of DFI investors can be crucial to protect theirsocial mission and provide comfort given the relativelyunstable political and socioeconomic contexts withinwhich they operate. Many fear that private investmentwill be the first to flee in times of crisis. However, withgrowing investor appetite for microfinance, DFIs havemore exit options and greater opportunities todemonstrate their added value by investing whereother investors will not.
DFIs’ most important role is investing in lessdeveloped and frontier markets, such as Yemen orSudan, and building new MFIs that will eventuallyattract private investment. Some are already playingthis role. Dutch FMO, for example, has engaged withand developed joint ventures with private investorsand has participated in local bond offerings for MFIs toencourage local private investors to follow on purelycommercial terms. The Microfinance Initiative for Sub-Saharan Africa program supported by KfW and IFC isalso helping to create new MFIs in Africa.
From competition to collaboration: Public and private investors
11627WBCGAP_Newsletter:Layout 1 3/3/08 1:27 PM Page 14

15
Conclusions
Microfinance investing occupies a very small, but rapidly
growing niche in both socially responsible and emerging
markets investments. Public investors have been at
the forefront of this investment trend. However, today
there is an increasingly sophisticated network of
international private investors looking for ways to
invest in microfinance on an ever larger scale. Public
investors need to respond to fast-paced evolutions in
market changes by redefining where they have
the most added value to avoid crowding out private
investment.
How will private-sector investors affect the future de-
velopment of microfinance? Clearly, private investors
are already playing a significant role in certain markets,
bringing in not only important capital but, equally
important, crucial governance capacity and much-
needed skills in growing and managing professional
businesses. But, this exciting trend of increasing foreign
private-sector investment must be kept in perspective.
The reality is that the bulk of foreign investment is
going to the top 150 MFIs in about 30 countries and
two regions: Latin America and Eastern Europe and
Central Asia account for 75 percent of cross-border
capital flows. Africa and Asia, where poverty and
potential microfinance demand is highest, receive
only 6 and 7 percent of foreign investment, respectively.
Moreover, foreign investment is quite appropriately
just one source of funding. In Asia, many large and
rapidly growing MFIs have the ability to self-finance
their operations through savings intermediation, local
bank loans, and bond issuance. For example, BRI Unit
Desa in Indonesia, the largest MFI in the world, has 10
savers for each borrower. Even Grameen Bank, which
used to borrow heavily from foreign sources, now has
excess liquidity from client deposits. In many African
countries, the predominant microfinance model is
savings-led financial cooperatives that do not even
take foreign investment. In other countries, local
banks are the main source of external funding. In yet
other markets, MFIs are in their early stages and depend
on government donor agencies, foundations, NGOs,
or apex institutions for funding.
So what impact is foreign investment likely to have on
the social focus of microfinance? Whereas local
sources of funding—deposits, local bank financing,
and bond issues—are generally commercially driven,
most foreign investment has come from investors with
a double bottom line seeking financial and social returns.
As would be hoped for, MFIs that have received such
foreign investment are remaining focused on their
double bottom line.
Socially responsible investors are likely to become
more demanding about social and environmental
performance than other investors. Triodos is already
pushing MFIs to be more transparent about their social
impact, lending practices, and environmental policies
and promotes Global Reporting Initiative standards.
Others are pushing for the development of screening
services that can help socially responsible investors
identify “best in class” MFIs in key areas, such as
poverty outreach, gender, or responsible lending.
These services will screen out institutions that do not
have a clear social dimension to their operations or
those that have predatory lending practices. In this
way, socially responsible investors can be a major
force in improving transparency and accountability
on social performance in microfinance.
However, the market is also beginning to see the entry
of foreign investors that are investing in microfinance
on purely commercial terms with higher financial
return expectations. Some emerging market private
equity players are starting to invest in high-growth
MFIs with target returns in the 20–30 percent range.
Although the share of this type of investment is still
extremely low, it raises important questions about
11627WBCGAP_Newsletter:Layout 1 3/3/08 1:27 PM Page 15
16
whether a profit-maximizing investor base will allow
microfinance to uphold its social mission. Will profits
be reinvested for the benefit of the clients through, for
example, lower interest rates or more remote service
provision, or will the focus be on maximizing share-
holders’ financial returns at the clients’ expense? It is
too early to tell whether such market pressures will
force MFIs into mission drift. However, these questions
are already generating tensions in MFI board rooms.
MFI directors need to understand the nature,
consequences, and trade offs of the financing
options open to them. Private equity investment is
attractive but it comes with high and fast return
expectations (within five years) and requires a clear
focus on business profitability—sometimes at the
expense of clients’ concerns. Some MFIs, such as SKS
in India, have taken on private venture capital financing
and are confident they can both maximize profits and
add social value for poor clients through a high-
growth business model. Other MFIs seek to reach
financial sustainability while focusing on maximizing
their social impact by deepening outreach, expanding
into remote areas, or expanding the range and quality
of services. These MFIs are looking for more socially
driven investors.
Better information on social and financial performance
of both MFIs and MIVs is needed to allow for the most
effective allocation of financing. A more efficient capital
market that integrates social and financial decision-
making can help develop a robust microfinance
industry that achieves the overall goal of sustainable
and responsible financial services for all.
11627WBCGAP_Newsletter:Layout 1 3/3/08 1:27 PM Page 16

Annex 1. MIVs that participated in the CGAP and Symbiotics survey
Annex 2. Collateralized Debt Obligation Transactions to Date
Annex 3. Abbreviations and Acronyms
Annex 4. Bibliography
Annex 5. CGAP MIV Benchmarks: MIVs Balance Sheet and MIVs
P&L and Performance
Annexes
11627WBCGAP_Newsletter:Layout 1 3/3/08 1:27 PM Page 17

18
Registered Mutual Funds
ASN-Novib Fonds
Dexia Microcredit Fund
Dual Return Fund SICAV
responsAbility Global Microfinance Fund
St. Honoré Microfinance
Triodos Fair Share Fund
Commercial Investment Funds
Global Microfinance Consortium
European Fund for South East Europe
Impulse Microfinance Investment Fund NV
MicroCredit Enterprises
MicroVest I, LP
Triodos-Doen Foundation
Structured Finance Vehicles
BlueOrchard Loans for Development 2006-1 (BOLDI)
BlueOrchard Microfinance Securities-1 (BOMS1)
Microfinance Loan Obligations SA,
Compartment Opportunity Eastern Europe 2005-1
Microfinance Securities XXEB
Blended Value Funds
The Dignity Fund, L.P.
Fonds International de Garantie
Hivos-Triodos Fund Foundation
Incofin cvso
Opportunity Loan Guarantee Fund I, LLC
International Solidarity For
Development and Investment
Holding Companies of Microfinance Banks
Global Microfinance Group SA
Advans
MicroCred
Opportunity Transformation Investments, Inc.
Private Equity Funds
ACCION Investments in Microfinance SPC
Africap Microfinance Fund Ltd
Bellwether Microfinance Fund
Balkan Financial Sector Equity Fund C.V.
Investisseur et Partenaire pour le Développement
ShoreCap International, Ltd.
Funds not categorized
Calvert Social Investment Foundation
BBA Codespa Microfinanzas
Finethic Microfinance SCA SICAR
Gray Ghost Microfinance Fund LLC
Oikocredit
Procredit Holding
responsAbility SICAV Microfinance Leaders Fund
Unitus
Annex 1. MIVs that participated in the CGAP and Symbiotics survey
11627WBCGAP_Newsletter:Layout 1 3/3/08 1:27 PM Page 18

19
2004 2005 2006 2007 2008
BlueOrchard Microfinance Securities LLC
Microfinance LoanObligations –
Opportunity East-ern Europe 2005-1
BlueOrchard Loans for
Development I
BlueOrchard Loans for
Development II
Global Microfi-nance Facility
Jul-04 Nov-05 Apr-06 May-07 TBD
$87 MM $60 MM $99.21 MM $110.2 MM US$165 MM
5 risk profiles, 7-yearmaturity, senior noteguarantee by OPIC
3 risk profiles, seniornote guaranteed byEIF
2 risk profiles 3 risk profiles, 7-yearmaturity
Portfolio to be ac-tively managed until2014
— Senior note ratedAAA/Aaa/AAA (withEIF wrap)
— Class A rated AA(S&P), Class B ratedBBB (S&P) Class C unrated
Senior notes ratedAA (Fitch)
14 MFIs, 9 countries MFIs, 7 countries 21 MFIs, 13 countries 20 MFIs, 12 countries 30 MFIs, 13 countries
Sponsored by BlueOrchard FinanceS.A. & DevelopingWorld Markets
Sponsored by Oppor-tunity International.Co-arranged by Sym-biotics & EuropeanInvestment Fund
Structured by MorganStanley. Sponsoredby BlueOrchard
Structured by MorganStanley. Sponsoredby BlueOrchard
Structured by Citigroup
Microfinance Secu-rities XXEB 2011
MicroAccess Trust
Jun-06 Jul-07
$60 MM US$39 MM
4 risk profiles, 5-yearmaturity
1 risk profile
Senior notes rated A1by MicroRate(Moody's scale)
—
26 MFIs, 17 countries 10 MFIs, 8 countries
Sponsored by Devel-oping World Markets.Serviced by Symbi-otics & Global Part-nerships.
Structured by LehmanBrothers for MicroVest CapitalManagement
Microfinance-Invest Nr. 1
Sep-07
€60 MM
3 risk profiles, c.7-year maturity
Senior notes ratedAAA (Fitch)
21 MFIs, 15 countries
Structured byDeutscheBank
Annex 2. Collateralized Debt Obligation Transactions to Date
11627WBCGAP_Newsletter:Layout 1 3/3/08 1:27 PM Page 19

20
AECI Agencia Española De Cooperación Internacional
AUM assets under management
BOLD Blue Orchard Loans for Development I and II
BOMS Blue Orchard Microfinance Securities LLC
CDO collateralized debt obligation
CLO collateralized loan obligation
CMEF Council for Microfinance Equity Funds
CGAP Consultative Group to Assist the Poor
DFI development finance institutions
EBRD European Bank for Reconstruction and Development
EFSE European Fund for Southeast Europe
FMO The Netherlands Finance Development Company
IADB Inter-American Development Bank
IFC International Finance Corporation
IPO Initial Public Offering
KfW Kreditanstalt für Wiederaufbau
OPIC Overseas Private Investment Corporation
MFI microfinance institution
MIV microfinance investment vehicle
MIX Microfinance Information Exchange Inc.
NGO nongovernmental organization
SRI socially responsible investment
S&P Standard and Poor’s (rating service)
VC venture capitalist
Annex 3. Abbreviations and Acronyms
11627WBCGAP_Newsletter:Layout 1 3/3/08 1:27 PM Page 20

21
Abrams, J., and D. von Stauffenberg. 2007. Role Re-
versal. Are Public Development Institutions Crowding
Out Private Investment in Microfinance? MicroRate.
http://www.microrate.com/pdf/rolereversal.pdf.
Barclay, O’Brien. 2006. “Valuing Microfinance Institu-
tions.” Savings and Development (3):275–96.
CGAP. 2006. “Foreign Exchange Risk Mitigation Tech-
niques: Structure and Documentation.” A Technical
Guide for Microfinance Institutions. Washington, D.C.:
CGAP.
DiLeo, P., and D. Fitzherbert. 2007. The Investment
Opportunity in Microfinance. An Overview of Current
Trends and Issues. Grassroots Capital Management
LLC., June.
http://www.grayghostfund.com/industry_insights/view
points/the_investment_opportunity_in_microfinance
Featherston, Scott, Elizabeth Littlefield, and Patricia
Mwangi. 2006. “Foreign Exchange Rate Risk in Micro-
finance: What Is It and How Can It Be Managed?” Fo-
cus Note 31. Washington, D.C.: CGAP.
Forum for the Future. 2007. New Horizons. Creating
Value, Enabling Livelihoods. London: Forum for the
Future.
Goodman, P. 2004. “Microfinance Investment Funds:
Objectives, Players, Potential.” 2004 KfW Financial
Sector Development Symposium. Luxembourg: Appui
au Développement Autonome.
———. 2005. Microfinance Investment Funds: Key
Features. Luxembourg: Appui au Développement
Autonome.
ING. 2006. A Billion to Gain. A study on global financial
institutions and microfinance. The Netherlands: ING.
Ivatury, G., and J. Abrams. 2005. “The Market for
Foreign Investment in Microfinance: Opportunities
and Challenges.” Focus Note 30. Washington, D.C.:
CGAP, August. http://www.cgap.org/portal/binary/
com.epicentric.contentmanagement.servlet.Content-
DeliveryServlet/Documents/FocusNote_30.pdf
Ivatury, G., and X. Reille. 2004. “Foreign Investment in
Microfinance: Debt and Equity from Quasi-Commer-
cial Investors.” Focus Note 25. Washington, D.C.:
CGAP, January. http://www.cgap.org/portal/
binary/com.epicentric.contentmanagement.servlet.Co
ntentDeliveryServlet/Documents/FocusNote_25.pdf
MIXMarket. http://www.mixmarket.org/.
Poulliot, R. 2007. “Governance, Transparency and
Accountability in the Microfinance Investment Fund
Industry.” In Microfinance Investment Funds. Springer
Berlin Heidelberg, Part II, pp. 147–74. Berlin: Kredi-
tanstalt fur Wiederaufbau
Rhyne, B., and B. Busch. 2006. The Growth of Com-
mercial Microfinance: 2004-2006. Council of Microfi-
nance Equity Funds.
Swanson, B. 2007. “The Role of International Capital
Markets in Microfinance.” http://www.dwmarkets.
com/Resources.htm.
Annex 4. Bibliography
11627WBCGAP_Newsletter:Layout 1 3/3/08 1:27 PM Page 21

22>
MIV
ave
rag
e B
alan
ce s
heet
($ m
illio
n)%
TA%
TA%
TA%
TA%
TA%
TA%
TATo
tal A
sset
s (T
A)
66.3
(40)
100.
0%65
.1(6
)10
0.0%
14.0
(6)
100.
0%15
.5(4
)10
0.0%
87.3
(5)
100.
0%20
.8(7
)10
0.0%
69.7
(4)
100.
0%N
et A
sset
Val
ue (N
AV
)51
.8(4
0)78
.1%
63.3
(6)
97.3
%13
.4(6
)95
.9%
11.9
(4)
77.0
%67
.0(5
)76
.7%
11.7
(7)
55.9
%68
.9(4
)98
.8%
Mic
rofin
ance
Por
tfol
io (M
P)43
.9(4
0)66
.3%
48.9
(6)
75.1
%11
.7(6
)83
.5%
11.0
(4)
70.8
%56
.0(5
)64
.1%
15.8
(7)
75.9
%67
.0(4
)96
.1%
Tota
l Liq
uid
Ass
ets
8.9
(40)
13.4
%8.
0(6
)12
.3%
1.7
(6)
11.8
%4.
3(4
)27
.7%
5.9
(5)
6.8%
3.8
(7)
18.5
%2.
0(4
)2.
9%
Mic
rofi
nanc
e P
ort
folio
(M
P) ($
Mill
ion)
%M
P%
MP
%M
P%
MP
%M
P%
MP
%M
PM
icro
finan
ce In
vest
men
ts43
.9(4
0)48
.9(6
)11
.7(6
)11
.0(4
)56
.0(5
)15
.8(7
)67
.0(4
)M
icro
finan
ce P
ortf
olio
in E
qui
ty
9.3
(40)
21.1
%3.
1(6
)6.
4%8.
8(6
)75
.6%
10.2
(4)
92.8
%0.
6(5
)1.
0%4.
4(7
)28
.1%
-(4
)M
icro
finan
ce P
ortf
olio
in F
ixed
inco
me
34.0
(40)
77.4
%45
.5(6
)93
.1%
2.9
(6)
24.4
%0.
8(4
)7.
2%52
.0(5
)92
.8%
10.6
(7)
66.8
%67
.0(4
)10
0.0%
Mic
rofin
ance
Por
tfol
io in
Gua
rant
ees
0.7
(40)
1.5%
0.3
(6)
0.5%
-(6
)-
(4)
3.4
(5)
6.1%
0.8
(7)
5.0%
-(4
)M
atur
ities
of f
ixed
inco
me
inve
stm
ents
(Mon
ths)
38(1
7)19
(4)
44(3
)-
44(4
)21
(1)
50(2
)D
irect
Inve
stm
ents
in M
FIs
41.5
(40)
94.4
%43
.6(6
)89
.2%
11.6
(6)
99.3
%11
.0(4
)99
.8%
54.9
(5)
98.1
%14
.8(7
)93
.4%
67.0
(4)
100.
0%In
vest
men
ts in
oth
er M
IVs
2.5
(40)
5.6%
5.3
(6)
10.8
%0.
1(6
)0.
7%0.
02(4
)0.
2%1.
1(5
)1.
9%1.
0(7
)6.
6%-
(4)
Geo
gra
phi
c D
istr
ibut
ion
%M
P%
MP
%M
P%
MP
%M
P%
MP
%M
PEa
ster
n Eu
rop
e an
d C
entr
al A
sia
20.0
(40)
45.4
%16
.1(6
)32
.9%
0.6
(6)
4.8%
5.2
(4)
47.8
%44
.8(5
)79
.9%
2.4
(7)
15.3
%25
.6(4
)38
.2%
Latin
Am
eric
a15
.5(4
0)35
.3%
21.6
(6)
44.1
%4.
5(6
)38
.8%
1.3
(4)
11.4
%9.
0(5
)16
.1%
6.1
(7)
38.5
%36
.8(4
)54
.9%
East
Asi
a &
Pac
ific
2.3
(40)
5.3%
1.6
(6)
3.3%
1.7
(6)
14.3
%0.
3(4
)2.
5%1.
0(5
)1.
7%2.
0(7
)12
.7%
2.5
(4)
3.7%
Sout
h A
sia
1.2
(40)
2.7%
1.9
(6)
3.8%
1.8
(6)
15.7
%0.
1(4
)0.
6%0.
2(5
)0.
3%0.
8(7
)5.
1%1.
0(4
)1.
5%M
idd
le E
ast
and
Nor
th A
fric
a0.
1(4
0)0.
2%0.
1(6
)0.
2%-
(6)
-(4
)-
(5)
0.2
(7)
1.1%
0.3
(4)
0.4%
Sub
-Sah
aran
Afr
ica
3.1
(40)
6.9%
1.9
(6)
3.8%
3.1
(6)
26.5
%3.
4(4
)31
.1%
0.8
(5)
1.5%
4.1
(7)
25.9
%-
(4)
Oth
er1.
8(4
0)4.
2%5.
9(6
)12
.0%
-(6
)0.
7(4
)6.
5%0.
2(5
)0.
4%0.
2(7
)1.
5%0.
9(4
)1.
3%
Ris
k In
dic
ato
rs, co
ncen
trat
ion
and
cur
renc
y%
MP
%M
P%
MP
%M
P%
MP
%M
P%
MP
Top
One
Cou
ntry
Exp
osur
e8.
3(4
0)18
.8%
8.0
(6)
16.3
%4.
2(6
)36
.0%
3.6
(4)
33.2
%15
.4(5
)27
.6%
2.5
(7)
16.0
%12
.0(4
)17
.8%
Tota
l Top
Fiv
e C
ount
ry E
xpos
ure
26.9
(40)
61.3
%25
.6(6
)52
.4%
9.0
(6)
76.6
%7.
9(4
)72
.1%
46.6
(5)
83.1
%9.
1(7
)57
.4%
48.5
(4)
72.4
%To
p O
ne M
icro
finan
ce In
vest
men
t Ex
pos
ure
7.1
(40)
16.2
%5.
6(6
)11
.4%
3.5
(6)
30.3
%3.
6(4
)33
.2%
13.6
(5)
24.3
%2.
0(7
)12
.4%
9.5
(4)
14.1
%To
tal T
op F
ive
Mic
rofin
ance
Inve
stm
ent
Exp
osur
e20
.8(4
0)47
.4%
16.8
(6)
34.4
%8.
7(6
)74
.3%
7.9
(4)
72.1
%30
.2(5
)54
.0%
6.1
(7)
38.6
%35
.8(4
)53
.4%
Top
One
Unh
edg
ed C
urre
ncy
Exp
osur
e3.
9(3
9)11
.2%
0.3
(6)
0.5%
3.1
(6)
26.7
%3.
4(4
)30
.6%
0.1
(5)
0.1%
1.7
(7)
10.5
%2.
6(4
)3.
8%To
tal T
op F
ive
Unh
edg
ed C
urre
ncy
Exp
osur
e6.
8(3
9)19
.6%
0.7
(6)
1.5%
6.8
(6)
57.8
%7.
6(4
)69
.5%
0.1
(5)
0.1%
4.6
(7)
29.2
%3.
2(4
)4.
8%
Inve
sto
r Ty
pe
(IT)
%IT
%IT
%IT
%IT
%IT
%IT
%IT
Pub
lic In
stitu
tions
20
.2(3
3)30
.1%
0.5
(6)
0.8%
10.6
(4)
46.5
%5.
8(3
)63
.2%
1.4
(4)*
4.4%
0.02
(6)
0.1%
12.8
(2)
27.2
%Pr
ivat
e In
stitu
tions
19.0
(33)
28.4
%20
.7(6
)32
.4%
7.5
(4)
32.8
%2.
8(3
)30
.4%
13.5
(4)*
43.5
%1.
8(6
)12
.5%
28.6
(2)
60.7
%M
IVs
2.3
(33)
3.4%
5.0
(6)
7.8%
1.5
(4)
6.6%
-(3
)1.
3(4
)*4.
3%0.
4(6
)2.
9%4.
3(2
)9.
1%O
ther
(NG
Os,
Fou
ndat
ions
, Ind
ivid
uals
)25
.5(3
3)38
.1%
37.7
(6)
59.0
%3.
2(4
)14
.1%
0.6
(3)
6.4%
14.8
(4)*
47.8
%12
.4(6
)84
.5%
1.4
(2)
3.0%
Nam
e o
f M
IVs
Ave
rag
e P
eer
Gro
up D
ata
Rat
ing
1= d
ata
pro
vid
ed b
y M
IV a
nd v
alid
ated
with
1.
91.
52.
02.
01.
61.
02.
8au
dite
d fi
nanc
ial s
tate
men
ts, 2
= d
ata
pro
vid
ed
by
MIV
and
val
idat
ed w
ith u
naud
ited
fina
ncia
l st
atem
ents
, 3=
dat
a p
rovi
ded
by
MIV
with
out
finan
cial
sta
tem
ents
*EFS
E no
t in
clud
ed
All
pee
r g
roup
s' M
IVs
and
BB
VA, C
alve
rt S
ocia
l Inv
est-
men
t Fo
und
atio
n, F
inet
hic
Mic
rofin
ance
SC
A S
ICA
R,G
ray
Gho
st M
icro
finan
ceFu
nd L
LC, O
ikoc
red
it,
Proc
red
it H
old
ing
, res
pon
s-A
bili
ty S
ICA
V M
icro
finan
ceLe
ader
s Fu
nd, U
nitu
s Eq
uity
Fund
.
ASN
-Nov
ib F
ond
s,
Dex
ia M
icro
cred
it Fu
nd,
Dua
l Ret
urn
Fund
SIC
AV,
re
spon
sAb
ility
Glo
bal
Mic
ro-
finan
ce F
und
, St.
Hon
oré
Mic
rofin
ance
, Trio
dos
Fai
rSh
are
Fund
.
AC
CIO
N In
vest
men
ts in
M
icro
finan
ce S
PC, A
fric
apM
icro
finan
ce F
und
Ltd
, B
ellw
ethe
r M
icro
finan
ceFu
nd, B
alka
n Fi
nanc
ial
Sect
or E
qui
ty F
und
C.V
., In
vest
isse
ur e
t Pa
rten
aire
pou
r le
Dév
elop
pem
ent
(I&P)
, Sho
reC
ap In
tern
a-tio
nal,
Ltd
.
Glo
bal
Mic
rofin
ance
Gro
upSA
, Ad
vans
, Mic
roC
red
, O
pp
ortu
nity
Tra
nsfo
rmat
ion
Inve
stm
ents
, Inc
.
Glo
bal
Mic
rofin
ance
C
onso
rtiu
m, T
he D
igni
tyFu
nd, L
.P.,
Euro
pea
n Fu
ndfo
r So
uth
East
Eur
ope,
Im
pul
se M
icro
finan
ce
Inve
stm
ent
Fund
NV,
M
icro
Vest
I, L
P.
Fond
s In
tern
atio
nal d
eG
aran
tie, H
ivos
-Trio
dos
Fu
nd F
ound
atio
n, In
cofin
cvso
, Mic
roC
redi
t Ent
erpr
ises
,O
pp
ortu
nity
Loa
n G
uara
ntee
Fund
I, L
LC, I
nter
natio
nal
Solid
arity
For
Dev
elop
men
tan
d In
vest
men
t, T
riod
os-
Doe
n Fo
und
atio
n.
Blu
eOrc
hard
Loa
ns fo
r D
evel
opm
ent
2006
-1, B
lue-
Orc
hard
Mic
rofin
ance
Sec
uri-
ties-
1 (B
OM
S1),
Mic
rofin
ance
Loan
Ob
ligat
ions
SA
-
Com
par
tmen
t O
pp
ortu
nity
East
ern
Euro
pe
2005
-1,
Mic
rofin
ance
Sec
uriti
esX
XEB
.
CG
AP
MIV
ben
chm
arks
MIV
s B
alan
ce S
heet
Peer
gro
up t
able
pow
ered
by
Sym
bio
tics
All
curr
ency
fig
ures
are
pop
ulat
ion'
s av
erag
e in
mill
ion
US
Dol
lars
as
of 2
006-
12-3
1. T
he n
umb
er in
bra
cket
s in
dic
ates
the
sam
ple
siz
e.
Surv
eyU
nive
rse
(act
ive
MV
Is 2
006,
CG
AP)
Sam
ple
Nb
re o
f MIV
s
64 4062
.5%
Tota
l Ass
ets
3,04
9
2,65
186
.9%
Tota
l Ass
ets
3,04
9
2,65
186
.9%
Ass
ets
Mic
rofin
ance
1,98
7
1,75
888
.5%
All
MIV
s,
N=
40
Reg
iste
red
Mut
ual F
unds
, N=
6P
rivat
e E
quity
Fun
ds, N
=6
Hol
ding
Com
pani
es, N
=4
Com
mer
cial
Inve
stm
ent F
unds
, N=
5B
lend
ed V
alue
Fun
ds,
N=
7S
truc
ture
d F
inan
ce V
ehic
les,
N=
4
11627WBCGAP_Newsletter:Layout 1 3/3/08 1:27 PM Page 22

Size
Tota
l Ass
ets
(TA
) ($
mill
ion)
66.3
(40)
65.1
(6)
14.0
(6)
15.5
(4)
87.3
(5)
20.8
(7)
69.7
(4)
Ann
ual T
A g
row
th (f
or M
IVs
exis
ting
in 2
005)
68.4
%(2
8)60
.7%
(5)
76.0
%(5
)45
.0%
(3)
139.
8%(3
)25
.0%
(6)
130.
4%(2
)
Ag
eN
bre
of y
ears
sin
ce re
gis
trat
ion
4.6
(40)
4.0
(6)
2.7
(6)
2.3
(4)
1.4
(5)
10.4
(7)
0.8
(4)
Ave
rag
e D
eal s
ize
($ m
illio
n)A
vera
ge
Equi
ty In
vest
men
t Si
ze2.
2(4
0)3.
1(6
)1.
5(6
)1.
9(4
)0.
7(5
)0.
6(7
)-
(4)
Ave
rag
e Fi
xed
Inco
me
Inve
stm
ent
Size
1.3
(40)
0.9
(6)
0.6
(6)
0.5
(4)
2.6
(5)
0.5
(7)
4.1
(4)
Ave
rag
e Si
ze o
f Dire
ct In
vest
men
ts in
MFI
s1.
5(4
0)1.
0(6
)1.
5(6
)1.
8(4
)2.
5(5
)0.
6(7
)4.
1(4
)A
vera
ge
Size
of I
nves
tmen
ts in
oth
er M
IVs
1.0
(40)
1.7
(6)
0.5
(6)
0.1
(4)
1.4
(5)
0.3
(7)
-(4
)
Ret
urn
Cla
ss V
alua
tion
Cur
renc
y-
EUR
USD
-EU
REU
R-
Net
Ass
et v
alue
-38
.0(4
)48
.7(2
)-
-7.
4(3
)-
Ann
ual T
otal
Ret
urn
-3.
2%(5
)5.
8%(2
)-
4.8%
(2)
1.5%
(2)
-Sp
read
ab
ove
Eurib
or/L
ibor
3 M
onth
s-
10 B
PS(5
)60
BPS
(2)
--
--
Ann
ualiz
ed A
vera
ge
Retu
rn s
ince
Ince
ptio
n-
2.3%
(5)
4.1%
(2)
--
--
Cla
ss R
isk
(sen
ior,
mez
zani
ne, j
unio
r, ...
)-
--
--
Seni
orJu
nior
% o
f int
eres
t su
bor
din
ated
--
--
-0.
0%(4
)81
.4%
(4)
% o
f int
eres
t to
whi
ch s
enio
r-
--
--
40.1
%(4
)3.
3%(3
)Sp
read
ab
ove
refe
renc
e ra
te-
--
--
20 B
PS(4
)40
0BPS
(4)
Ave
rag
e Li
fe, Y
ears
--
--
-5.
4(4
)5.
5.4
(4)
Eff
icie
ncy
and
Co
st S
truc
ture
%%
TA%
TA%
TA%
TA%
No
tes
Tota
l Exp
ense
Rat
io-
2.7%
(5)
4.1%
(4)
8.4%
(3)
2.0%
(5)
6.1%
(7)
1.3%
(3)
Eq
uity
Lev
erag
eD
ebt/
Equi
ty45
.0%
(38)
2.8%
(6)
4.3%
(6)
29.9
%(4
)30
.4%
(5)
18.3
%(5
)-
(4)
MIV
Jur
isd
icti
on
(by
TA)
%TA
%TA
%TA
%TA
%TA
%TA
Wes
tern
Eur
ope
86.4
(25)
81.5
%65
.1(6
)10
0.0%
0.2
(1)
0.2%
4.5
(3)
21.8
%17
5.1
(2)
80.2
%25
.8(5
)88
.5%
65.0
(3)
69.9
%N
orth
Am
eric
a41
.9(9
)14
.2%
-27
.1(1
)32
.2%
48.5
(1)
78.2
%15
.4(2
)7.
0%8.
4(2
)11
.5%
84.0
(1)
30.1
%C
entr
al A
mer
ica,
Mex
ico
& C
arib
bea
n25
.9(3
)2.
9%-
19.9
(1)
23.7
%-
55.8
(1)
12.8
%-
-A
fric
a15
.4(2
)1.
2%-
15.4
(2)
36.8
%-
--
-So
uth
Asi
a6.
0(1
)0.
2%-
6.0
(1)
7.2%
--
--
Nam
e o
f M
IVs
Ave
rag
e P
eer
Gro
up
Dat
a R
atin
g1=
dat
a p
rovi
ded
by
MIV
and
val
idat
ed w
ith
1.9
1.5
2.0
2.0
1.6
1.0
2.8
aud
ited
fina
ncia
l sta
tem
ents
, 2=
dat
a p
rovi
ded
b
y M
IV a
nd v
alid
ated
with
una
udite
d fi
nanc
ial
stat
emen
ts, 3
= d
ata
pro
vid
ed b
y M
IV w
ithou
t fin
anci
al s
tate
men
ts
All
pee
r g
roup
s' M
IVs
and
BB
VA, C
alve
rt S
ocia
l Inv
est-
men
t Fo
und
atio
n, F
inet
hic
Mic
rofin
ance
SC
A S
ICA
R,G
ray
Gho
st M
icro
finan
ceFu
nd L
LC, O
ikoc
red
it,
Proc
red
it H
old
ing
, res
pon
s-A
bili
ty S
ICA
V M
icro
finan
ceLe
ader
s Fu
nd, U
nitu
s Eq
uity
Fund
.
ASN
-Nov
ib F
ond
s,
Dex
ia M
icro
cred
it Fu
nd,
Dua
l Ret
urn
Fund
SIC
AV,
re
spon
sAb
ility
Glo
bal
Mic
ro-
finan
ce F
und
, St.
Hon
oré
Mic
rofin
ance
, Trio
dos
Fai
rSh
are
Fund
.
AC
CIO
N In
vest
men
ts in
M
icro
finan
ce S
PC, A
fric
apM
icro
finan
ce F
und
Ltd
, B
ellw
ethe
r M
icro
finan
ceFu
nd, B
alka
n Fi
nanc
ial
Sect
or E
qui
ty F
und
C.V
., In
vest
isse
ur e
t Pa
rten
aire
pou
r le
Dév
elop
pem
ent
(I&P)
, Sho
reC
ap In
tern
a-tio
nal,
Ltd
.
Glo
bal
Mic
rofin
ance
Gro
upSA
, Ad
vans
, Mic
roC
red
, O
pp
ortu
nity
Tra
nsfo
rmat
ion
Inve
stm
ents
, Inc
.
Glo
bal
Mic
rofin
ance
C
onso
rtiu
m, T
he D
igni
tyFu
nd, L
.P.,
Euro
pea
n Fu
ndfo
r So
uth
East
Eur
ope,
Im
pul
se M
icro
finan
ce
Inve
stm
ent
Fund
NV,
M
icro
Vest
I, L
P.
Fond
s In
tern
atio
nal d
eG
aran
tie, H
ivos
-Trio
dos
Fu
nd F
ound
atio
n, In
cofin
cvso
, Mic
roC
redi
t Ent
erpr
ises
,O
pp
ortu
nity
Loa
n G
uara
ntee
Fund
I, L
LC, I
nter
natio
nal
Solid
arity
For
Dev
elop
men
tan
d In
vest
men
t, T
riod
os-
Doe
n Fo
und
atio
n.
Blu
eOrc
hard
Loa
ns fo
r D
evel
opm
ent
2006
-1, B
lue-
Orc
hard
Mic
rofin
ance
Sec
uri-
ties-
1 (B
OM
S1),
Mic
rofin
ance
Loan
Ob
ligat
ions
SA
-
Com
par
tmen
t O
pp
ortu
nity
East
ern
Euro
pe
2005
-1,
Mic
rofin
ance
Sec
uriti
esX
XEB
.
CG
AP
MIV
ben
chm
arks
MIV
s P
&L
and
Per
form
ance
Peer
gro
up t
able
pow
ered
by
Sym
bio
tics
All
curr
ency
fig
ures
are
pop
ulat
ion'
s av
erag
e in
mill
ion
US
Dol
lars
as
of 2
006-
12-3
1. T
he n
umb
er in
bra
cket
s in
dic
ates
the
sam
ple
siz
e.
Surv
eyU
nive
rse
(act
ive
MV
Is 2
006,
CG
AP)
Sam
ple
Nb
re o
f MIV
s
64 4062
.5%
Tota
l Ass
ets
3,04
9
2,65
186
.9%
Tota
l Ass
ets
3,04
9
2,65
186
.9%
Ass
ets
Mic
rofin
ance
1,98
7
1,75
888
.5%
All
MIV
s,
N=
40
Reg
iste
red
Mut
ual F
unds
Priv
ate
Equ
ity F
unds
Hol
ding
Com
pani
esC
omm
erci
al In
vest
men
t Fun
dsB
lend
ed v
alue
Fun
dsS
truc
ture
d F
inan
ce V
ehic
les
%TA
11627WBCGAP_Newsletter-R1:Layout 1 3/4/08 9:45 PM Page 23

The Authors of this Focus Note are Xavier Reille, lead microfinancespecialist for CGAP, and Sarah Forster, director of Geoeconomics, anindependent consultancy. The authors wish to thank Tanya Surendra, as wellas Adrian Gonzalez from the MIX and Yannis Berthouzoz from Symbioticsfor their research assistance. They express their appreciation to AlexiaLatortue, Elizabeth Littlefield, Kate McKee, and Jeannette Thomas for theirinput. The authors are also grateful for the contributions of investors, MFIs,and analysts interviewed during this research:
Fouad Abdelmoumni, AlamanaDeborah Burand, Grameen FoundationAlice Chapple and Vedant Walia, Forum for the Future
Ian Callaghan, Morgan StanleyRoland Dominice and Patrick Goodman, SymbioticsBraco Erceg, Microfin BosniaDavid Fitzherbert, Gray GhostSusan Johnson, Bath UniversityAnn Miles, BlueOrchardNejira Nalic, Mi-BospoRobert Pouliot, RCPAlex Silva, Omnitrix
CGAP materials are frequently cited in other works. The following is a suggested citation for this Focus Note:
Reille, Xavier, and Sarah Forster. 2008. “Foreign Capital Investment in Microfinance: Balancing Social and Financial Returns.” Focus Note 44. Washington, D.C.: CGAP.
11627WBCGAP_Newsletter:Layout 1 3/3/08 1:27 PM Page 24
No.44February 2008
Please share thisFocus Note with yourcolleagues or request
extra copies of thispaper or others in
this series.
CGAP welcomes your comments on
this paper.
All CGAP publicationsare available on the
CGAP Web site atwww.cgap.org.
CGAP1818 H Street, NW
MSN P3-300Washington, DC
20433 USA
Tel: 202-473-9594Fax: 202-522-3744
Email:[email protected]
© CGAP, 2008
Recommended