8-1
IsProcessCapable
?TheQualityImprovementModel
Use SPC to Maintain Current Process
Collect & Interpret
Data
Select Measures
Define Process
IsProcessCapable
?
Improve Process
Capability
IsProcessStable
?
Investigate & Fix
Special Causes
No
Yes
No
Yes
Is Process Capable?
Purpose:Determine the adequacy of the process with respect to customer /management needs.

8-2
IsProcessCapable
?Capable Process
A stable process that meets customer requirements.
8 22 242 4 6 10 12 14 16 18 20 26 28 30 32
Run Order
UCL
CL
LCL
Control Chart
Lower Spec Upper SpecTarget
Histogram
Capability assessments for unstable processes, may not be indicative of how the process is actually performing.
8-3
IsProcessCapable
?
Assessing Process Capability
Counting Measures The average percent defectives. The average number of defects.
Instrument Measures Comparing both the center of the process and the
process variation

8-4
IsProcessCapable
?
Capability Assessment for Counting Measures
“Order Entry Process”
Is this process adequate as is?Should it be improved?
Week123456789
1011121314151617181920
Total
# Errors15221810139
2712242288
26162010169
1520
320
05
101520253035
5 10 15 20
Avg=16.0
LCL=4.0
UCL=28.0
Week
Numberof Errors
Control Chart

8-5
IsProcessCapable
?
Measures of Process CapabilityCp = Specification Range
True Process Range = USL - LSL
6c
Cpk = Distance from process averageto closest specification limit
12 True Process Range
= min (USL - x , x - LSL)3c
Problem: We are assuming the process has a target that is in the center of the specification range, and that the process is in fact centered on that target.
Note: a negative result is possible if the process average is outside specifications
Benefits: • Optimal values are attained by running exactly between specs. • Can (must) be used for 1-sided specifications
Cp < 1.0 Process is not capable of meeting specsCp = 1.0 Process is marginally capableCp > 1.0 Process is capable of meeting specs
Cpk < 1.0 Process is not capable of meeting specsCpk = 1.0 Process is marginally capableCpk > 1.0 Process is capable of meeting specs
Warning: Capability assessments for unstable processes, may not be indicative of how the process is actually performing.

8-6
IsProcessCapable
?
How much material is out of spec? In the short term? In the long term?
USLLSL
Process Capability

8-7
IsProcessCapable
?Process Capability Ratios
Voice of The Customer
Voice of The Process
USLLSL

8-8
IsProcessCapable
?

8-9
IsProcessCapable
?Process Capability - The Strategy
Centering –The Process Is On Target
Spread – Reduce The Variation
LSL USL
DefectsDefects
8-10
IsProcessCapable
?
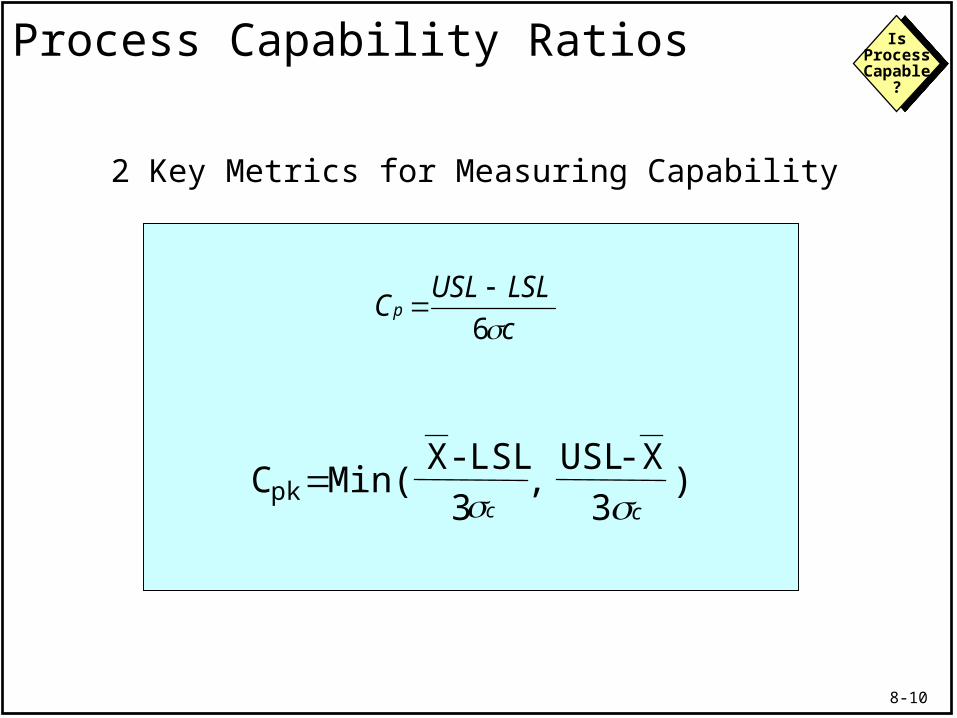
2 Key Metrics for Measuring Capability
C Min( X-LSL
3USL- X
3pk
, )
cLSLUSLCp
6
c c
Process Capability Ratios

8-11
IsProcessCapable
?Process Capability Ratios - Concept
Total ToleranceC
Process Spreadp
cLSLUSLCp
6
8-12
IsProcessCapable
?
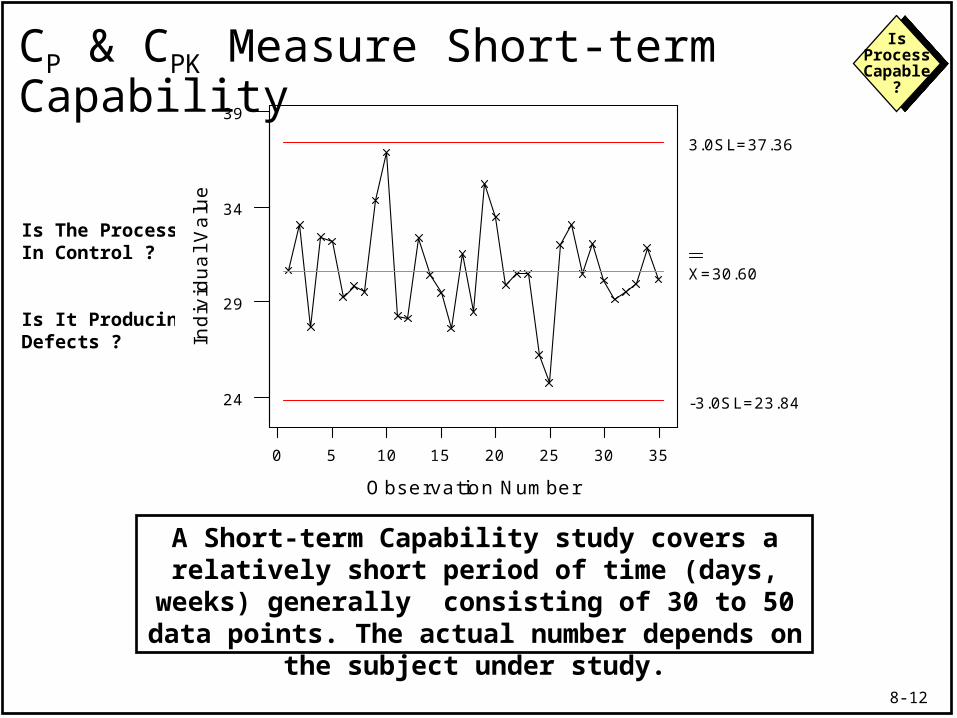
A Short-term Capability study covers a relatively short period of time (days, weeks) generally consisting of 30 to 50 data points. The actual number depends on the subject under study.
Is The ProcessIn Control ?
Is It Producing Defects ?
35302520151050
39
34
29
24
Observation Number
Indi
vidu
al V
alue
I Chart for C1
X=30.60
3.0SL=37.36
-3.0SL=23.84
CP & CPK Measure Short-term Capability
8-13
IsProcessCapable
?
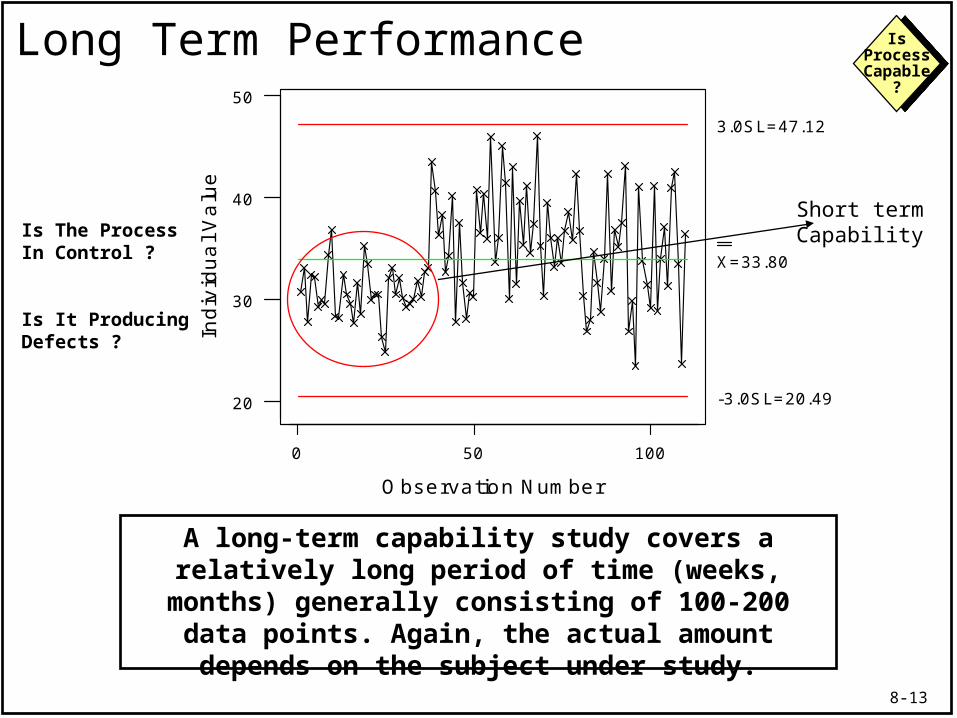
A long-term capability study covers a relatively long period of time (weeks, months) generally consisting of 100-200 data points. Again, the actual amount depends
on the subject under study.
Is The ProcessIn Control ?
Is It Producing Defects ?
100500
50
40
30
20
Observation Number
Indi
vidu
al V
alue
I Chart for C3
X=33.80
3.0SL=47.12
-3.0SL=20.49
Long Term Performance
Short term Capability

8-14
IsProcessCapable
?
A Further Look at Capability
Compare the estimates of the process deviations from the short-term and long-term data
What is the difference between the short-term and the long-term data?
What implication does this have in doing capability studies?
Descriptive Statistics
Variable N Mean StdDev short term 30 30.6 2.23 long term 180 33.8 4.44

8-15
IsProcessCapable
?
Measures of Process PerformanceP p = Specification Range
True Process Range = USL - LSL
6s
Ppk =
Distance from process averageto closest specification limit
12 True Process Range
= min (USL - x , x - LSL)3s
Problem: We are assuming the process has a target that is in the center of the specification range, and that the process is in fact centered on that target.
Note: a negative result is possible if the process average is outside specifications
Benefits: • Optimal values are attained by running exactly between specs. • Can (must) be used for 1-sided specifications
P p < 1.0 Process Performance is not meeting specsP p = 1.0 Process Performance is marginally meeting specsP p > 1.0 Process Performance is meeting specs
Ppk < 1.0 Process Performance is not meeting specsPpk = 1.0 Process Performance is marginally meeting specsPpk > 1.0 Process Performance is meeting specs

8-16
IsProcessCapable
?
Performance vs. Capability
These data show that the process, if well controlled can perform much better than it currently is
5040302010
14
13
12
11
10
Index
CO
2-S
hrt
CO2 Levels for 55 Time PointsDays Sales Outstanding for 55 Days
DS
O

8-17
IsProcessCapable
?Capability vs. Performance
5040302010
14
13
12
11
10
Index
CO
2-S
hrt
CO2 Levels for 55 Time PointsDays Sales Outstanding for 55 Days
DS
O
Process Performance: Total Variation including
shifts and drifts
(Pp & Ppk)
Capability: Only random or short term variability
(Cp & Cpk)
8-18
IsProcessCapable
?
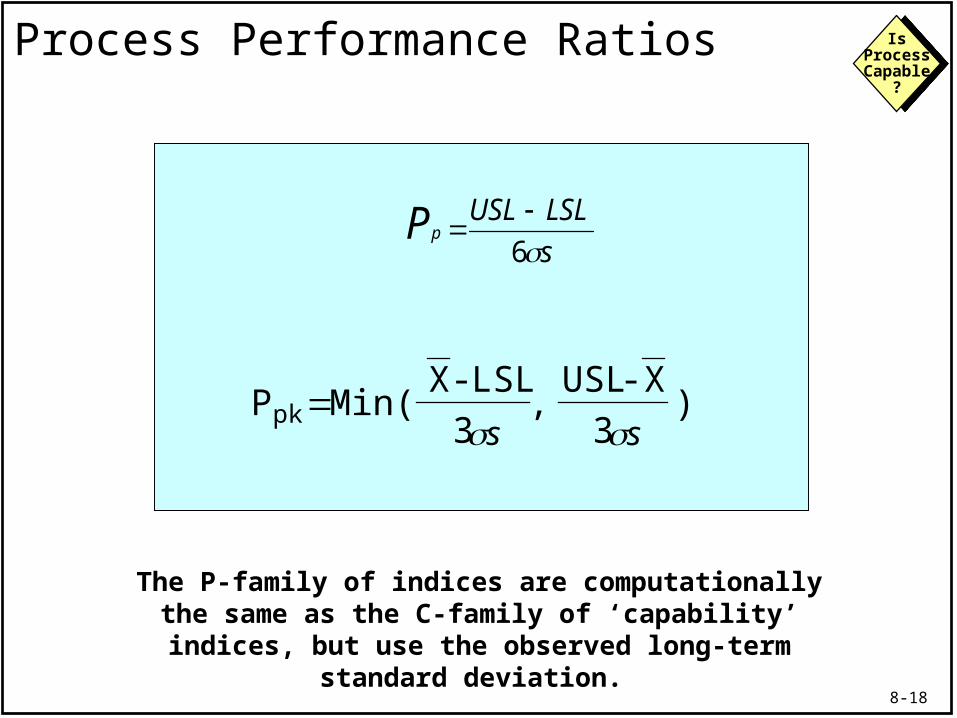
Process Performance Ratios
The P-family of indices are computationally the same as the C-family of ‘capability’ indices, but use the observed
long-term standard deviation.
P Min( X-LSL
3USL- X
3pk
, )
sLSLUSL
pP6
s s

8-19
IsProcessCapable
?WARNING!!!WARNING!!!
Statistical Assumptions Made In Capability Studies
1. Data Comes From a Stable ProcessData Comes From a Stable Process If not, work towards getting the process in
control Don’t despair, you can still make some
assumptions about your process in the mean time
Recommended