Presented at the 127th Convention of Battery Council International May 3-5, 2015
North American Industrial Battery Forecast 2015-2017
Mitch Bregman Division President Energy and Industrial Systems
Thank You Industry Experts
• Sean Blayloch - Exide
• Doug Bouquard – East Penn
• Bruce Cole – Exide
• Taylor Frederickson - Exide
• John Gagge – EnerSys
• Jim Garcia – Exide
• Gary Gray – EnXergy
• Vincent Halma – Kion
• Jerry Hoffman – NorthStar
• Sam Jaffe – Cairn ERA
• Mark Jesko – Exide
• Scott Johnson – Clark
• Mark Kelley – Crown Battery
• John Kleba – Midtronics
• Manfred Kleinert – Exide Europe
• François Linck – Saft
• Jeff Long – EnerSys
• Saeed Mahramnia – Schneider Electric
• Jim Marshall – Emerson
• Chuck Mathias – East Penn
• Mike Nispel – C&D Tech
• Jay Northey – GS Battery
• Doug Pierce –Yuasa
• Chad Uplinger – EnerSys
• Steve Vechy – EnerSys
• Mark Wels – East Penn
• Brett Wood – Toyota
• John Wood - Ecoult
1
Data Collection Methodology
• Sales data include lead-acid battery sales of reporting BCI members
• Imports from non-reporting companies are not included
• Stationary products include batteries 25Ah and above
• Lead prices assumed to be stable during forecast period
• Stationary 2013 market segment data corrected, total market remains unchanged
• 3-Year industry forecast is an accumulation of the forecast from individual reporting members
2
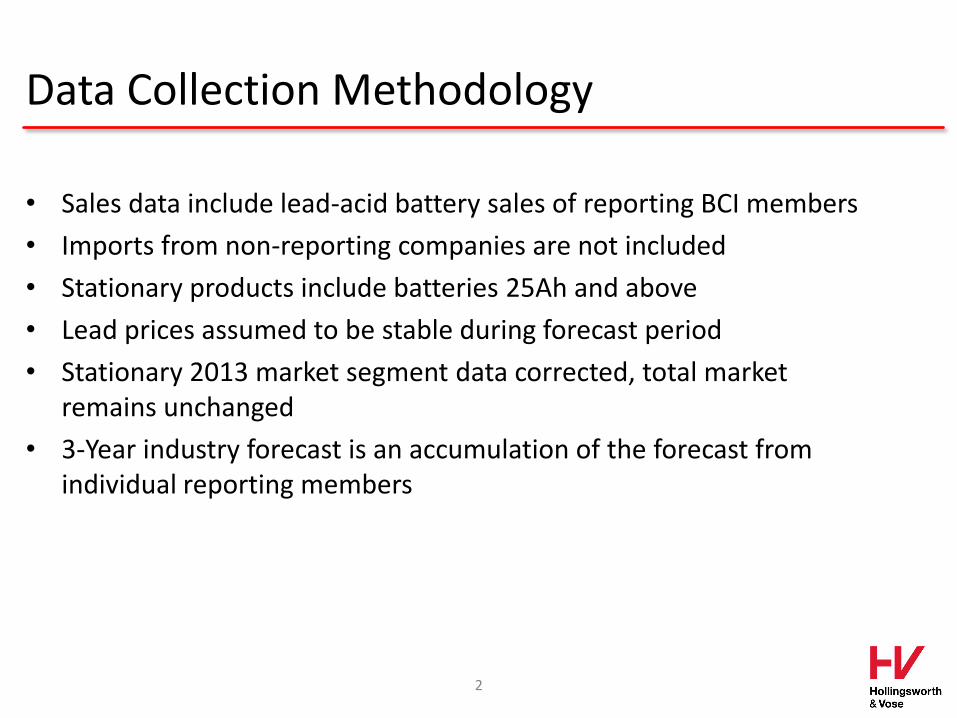
Macro Industrial Battery Market Drivers
Source: Industry Experts 3
Environmental Awareness
Global Economy
Alternative Technologies

Motive Power
4
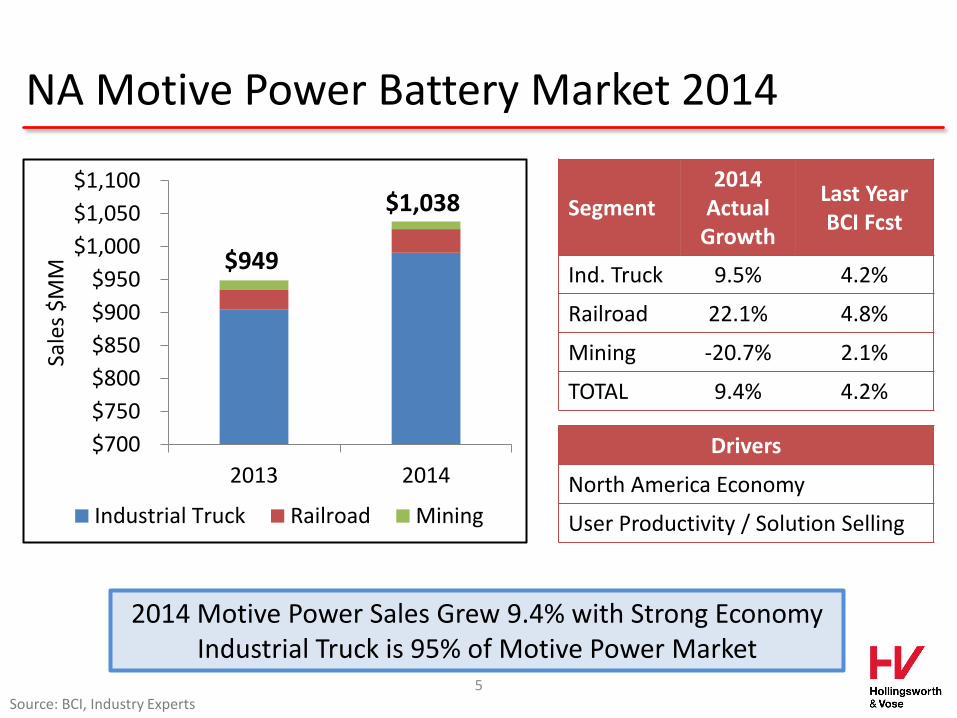
NA Motive Power Battery Market 2014
$700
$750
$800
$850
$900
$950
$1,000
$1,050
$1,100
2013 2014
Sale
s $
MM
Industrial Truck Railroad Mining
Segment 2014
Actual Growth
Last Year BCI Fcst
Ind. Truck 9.5% 4.2%
Railroad 22.1% 4.8%
Mining -20.7% 2.1%
TOTAL 9.4% 4.2%
2014 Motive Power Sales Grew 9.4% with Strong Economy Industrial Truck is 95% of Motive Power Market
Drivers
North America Economy
User Productivity / Solution Selling
Source: BCI, Industry Experts
$949
$1,038
5
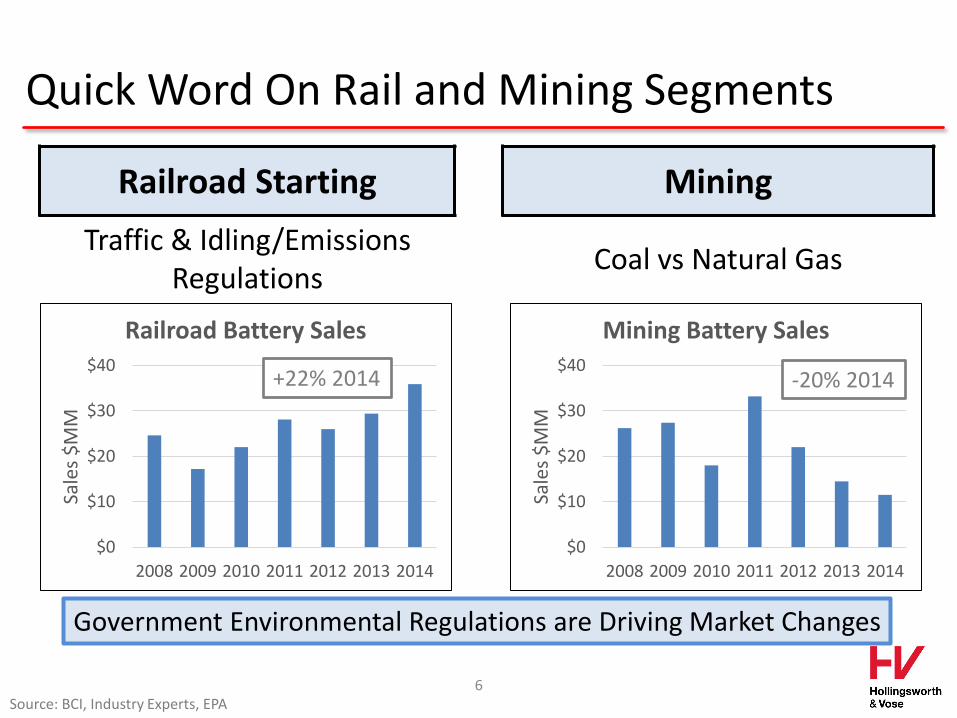
Quick Word On Rail and Mining Segments
Government Environmental Regulations are Driving Market Changes
Source: BCI, Industry Experts, EPA 6
Railroad Starting Mining
Traffic & Idling/Emissions Regulations
Coal vs Natural Gas
$0
$10
$20
$30
$40
2008 2009 2010 2011 2012 2013 2014
Sale
s $
MM
Railroad Battery Sales
$0
$10
$20
$30
$40
2008 2009 2010 2011 2012 2013 2014
Sale
s $
MM
Mining Battery Sales
+22% 2014 -20% 2014
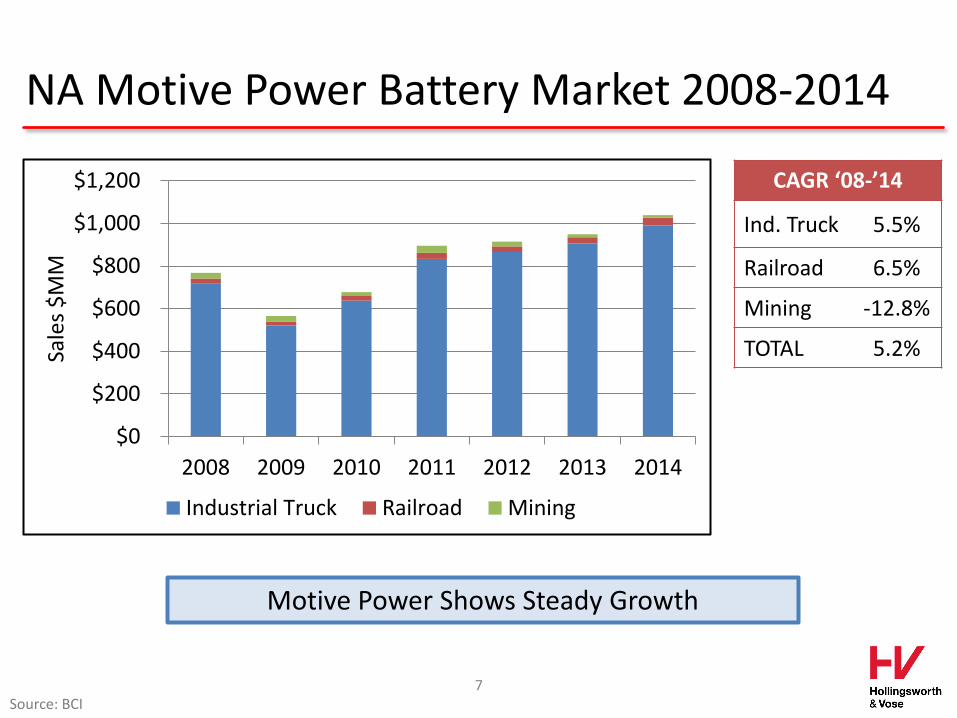
NA Motive Power Battery Market 2008-2014
$0
$200
$400
$600
$800
$1,000
$1,200
2008 2009 2010 2011 2012 2013 2014
Sale
s $
MM
Industrial Truck Railroad Mining
CAGR ‘08-’14
Ind. Truck 5.5%
Railroad 6.5%
Mining -12.8%
TOTAL 5.2%
Motive Power Shows Steady Growth
Source: BCI 7
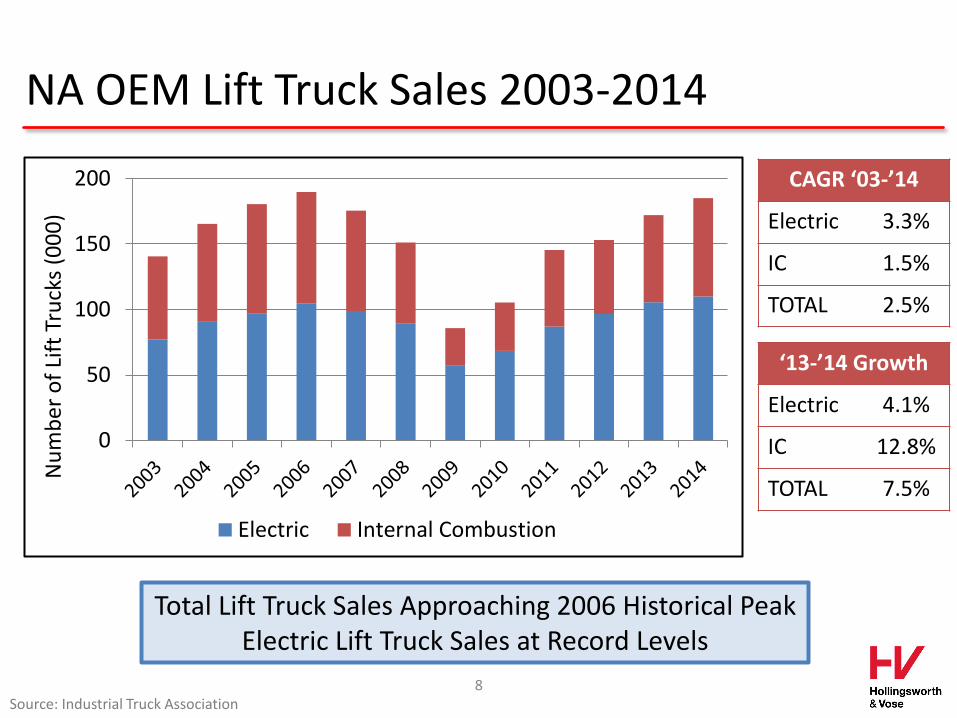
NA OEM Lift Truck Sales 2003-2014
0
50
100
150
200
Nu
mb
er
of
Lift
Tru
cks
(00
0)
Electric Internal Combustion
CAGR ‘03-’14
Electric 3.3%
IC 1.5%
TOTAL 2.5%
Total Lift Truck Sales Approaching 2006 Historical Peak Electric Lift Truck Sales at Record Levels
Source: Industrial Truck Association 8
‘13-’14 Growth
Electric 4.1%
IC 12.8%
TOTAL 7.5%
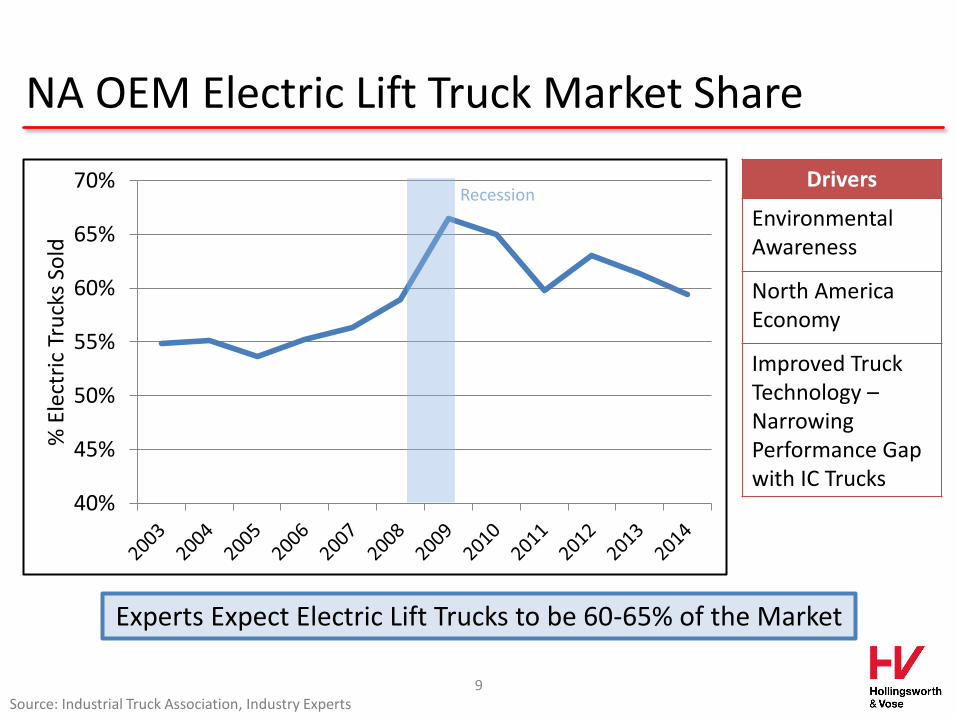
NA OEM Electric Lift Truck Market Share
40%
45%
50%
55%
60%
65%
70%
% E
lect
ric
Tru
cks
Sold
Drivers
Environmental Awareness
North America Economy
Improved Truck Technology – Narrowing Performance Gap with IC Trucks
Experts Expect Electric Lift Trucks to be 60-65% of the Market
Source: Industrial Truck Association, Industry Experts 9
Recession
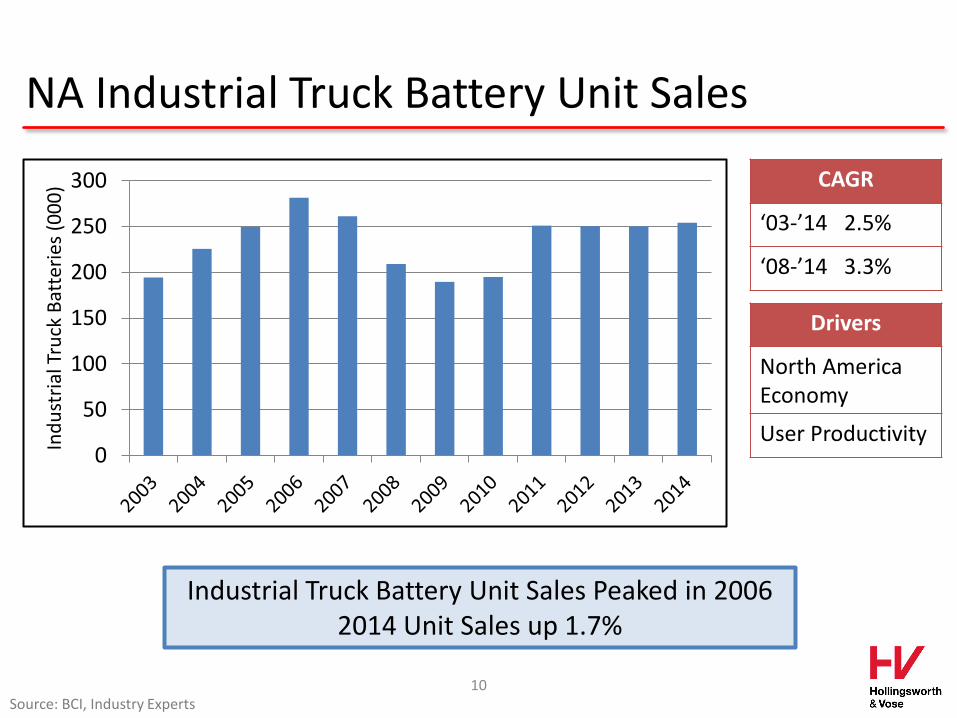
CAGR
‘03-’14 2.5%
‘08-’14 3.3%
NA Industrial Truck Battery Unit Sales
0
50
100
150
200
250
300
Ind
ust
rial
Tru
ck B
atte
ries
(0
00
)
Industrial Truck Battery Unit Sales Peaked in 2006 2014 Unit Sales up 1.7%
Source: BCI, Industry Experts 10
Drivers
North America Economy
User Productivity
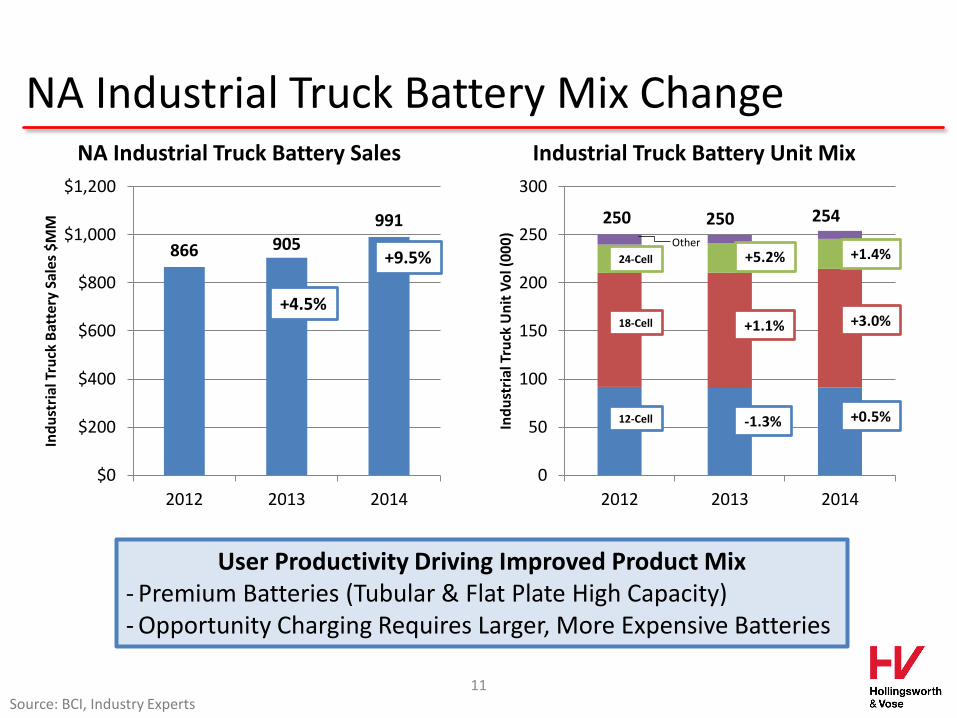
NA Industrial Truck Battery Mix Change
User Productivity Driving Improved Product Mix - Premium Batteries (Tubular & Flat Plate High Capacity) - Opportunity Charging Requires Larger, More Expensive Batteries
Source: BCI, Industry Experts 11
866 905
991
$0
$200
$400
$600
$800
$1,000
$1,200
2012 2013 2014
Ind
ust
rial
Tru
ck B
atte
ry S
ales
$M
M
NA Industrial Truck Battery Sales
0
50
100
150
200
250
300
2012 2013 2014In
du
stri
al T
ruck
Un
it V
ol (
00
0)
Industrial Truck Battery Unit Mix
250 250
12-Cell
18-Cell
24-Cell
Other
254
-1.3%
+1.1%
+5.2%
+0.5%
+3.0%
+1.4%
+4.5%
+9.5%
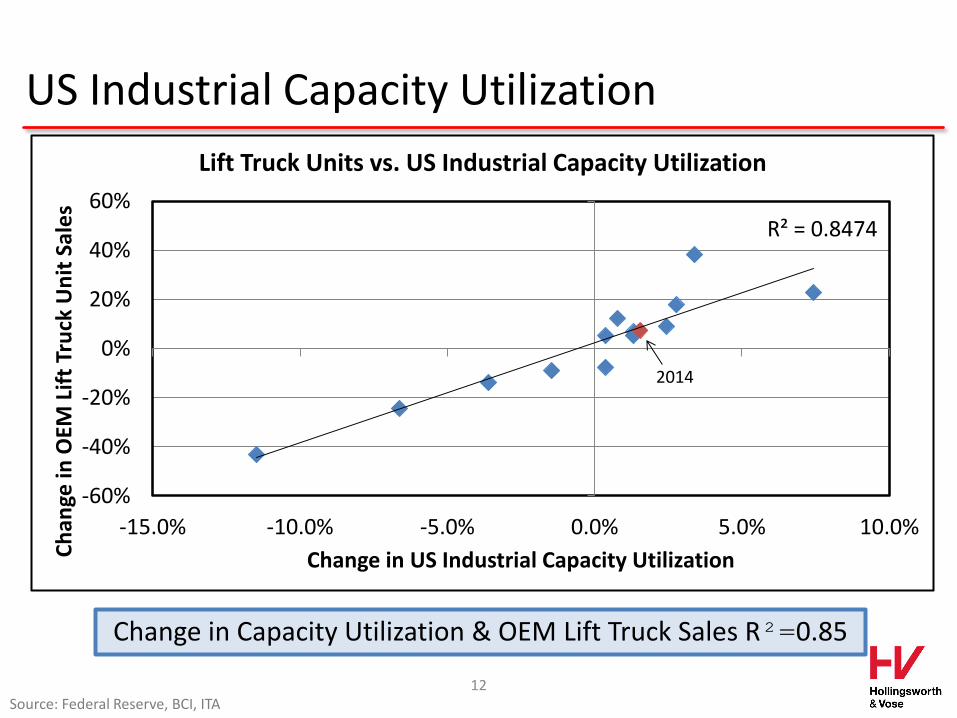
US Industrial Capacity Utilization
Source: Federal Reserve, BCI, ITA
Change in Capacity Utilization & OEM Lift Truck Sales R²=0.85
12
R² = 0.8474
-60%
-40%
-20%
0%
20%
40%
60%
-15.0% -10.0% -5.0% 0.0% 5.0% 10.0%
Ch
ange
in O
EM L
ift
Tru
ck U
nit
Sal
es
Change in US Industrial Capacity Utilization
Lift Truck Units vs. US Industrial Capacity Utilization
2014
US Industrial Capacity Utilization
Source: Federal Reserve, BCI, ITA
60
65
70
75
80
85
0
50
100
150
200
250
300
US
Ind
ust
rial
% C
apac
ity
Uti
lizat
ion
MP
Bat
tery
an
d O
EM L
ift
Tru
ck U
nit
s (0
00
)
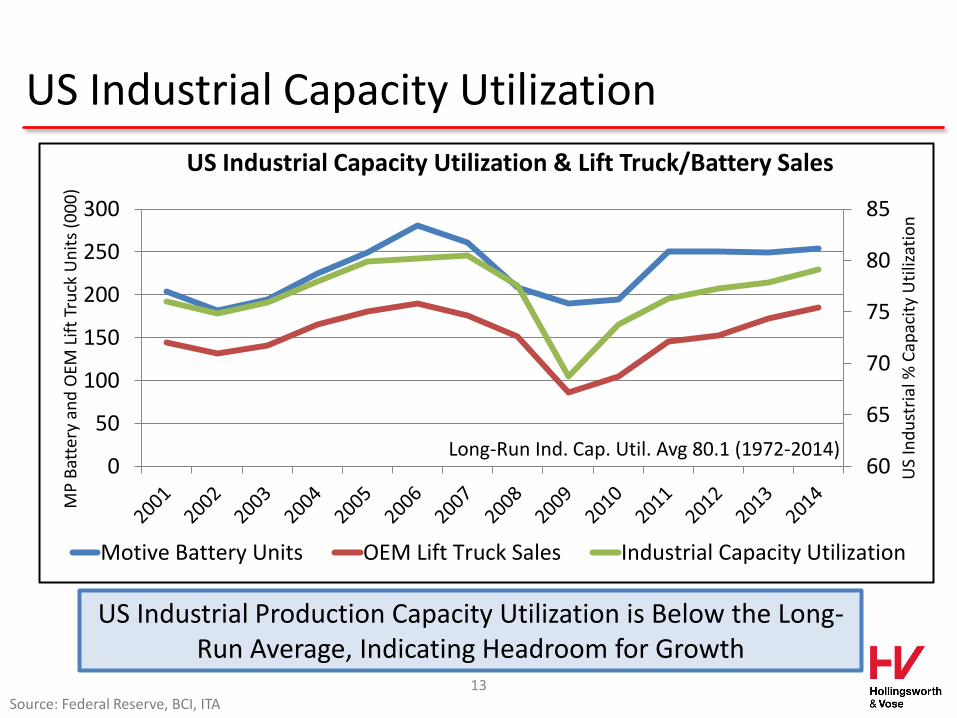
US Industrial Capacity Utilization & Lift Truck/Battery Sales
Motive Battery Units OEM Lift Truck Sales Industrial Capacity Utilization
US Industrial Production Capacity Utilization is Below the Long-Run Average, Indicating Headroom for Growth
13
Long-Run Ind. Cap. Util. Avg 80.1 (1972-2014)
NA Motive Power Sales Forecast 2015-2017
$0
$200
$400
$600
$800
$1,000
$1,200
$1,400
Sale
s $
MM
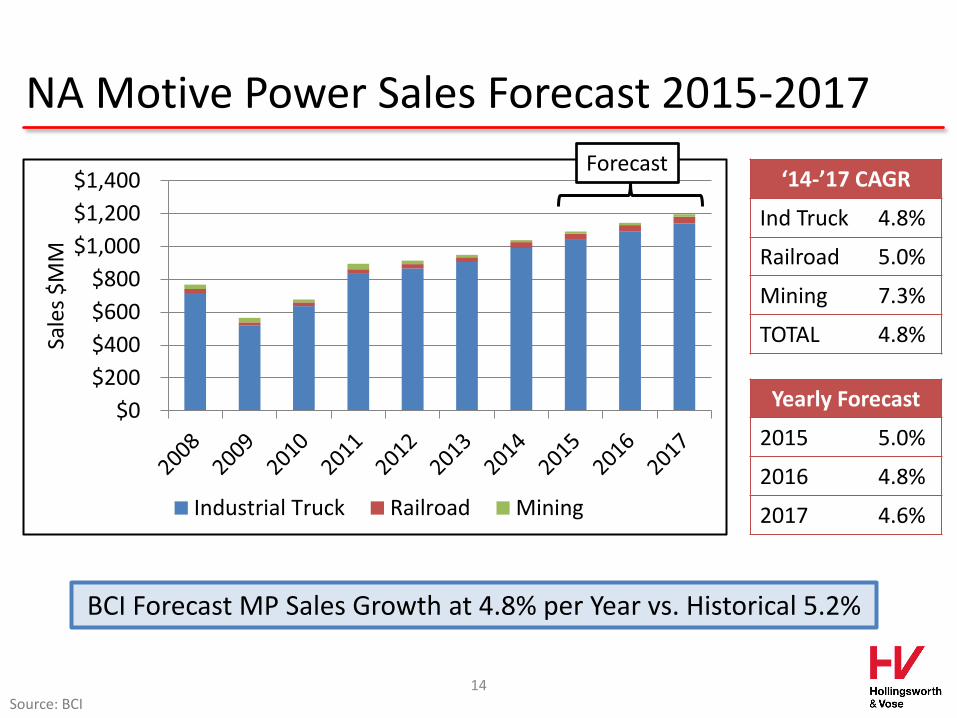
Industrial Truck Railroad Mining
‘14-’17 CAGR
Ind Truck 4.8%
Railroad 5.0%
Mining 7.3%
TOTAL 4.8%
BCI Forecast MP Sales Growth at 4.8% per Year vs. Historical 5.2%
Yearly Forecast
2015 5.0%
2016 4.8%
2017 4.6%
Source: BCI 14
Forecast

Stationary
15
NA Stationary Market 2014
$0
$200
$400
$600
$800
$1,000
$1,200
2013 2014
Sale
s $
MM
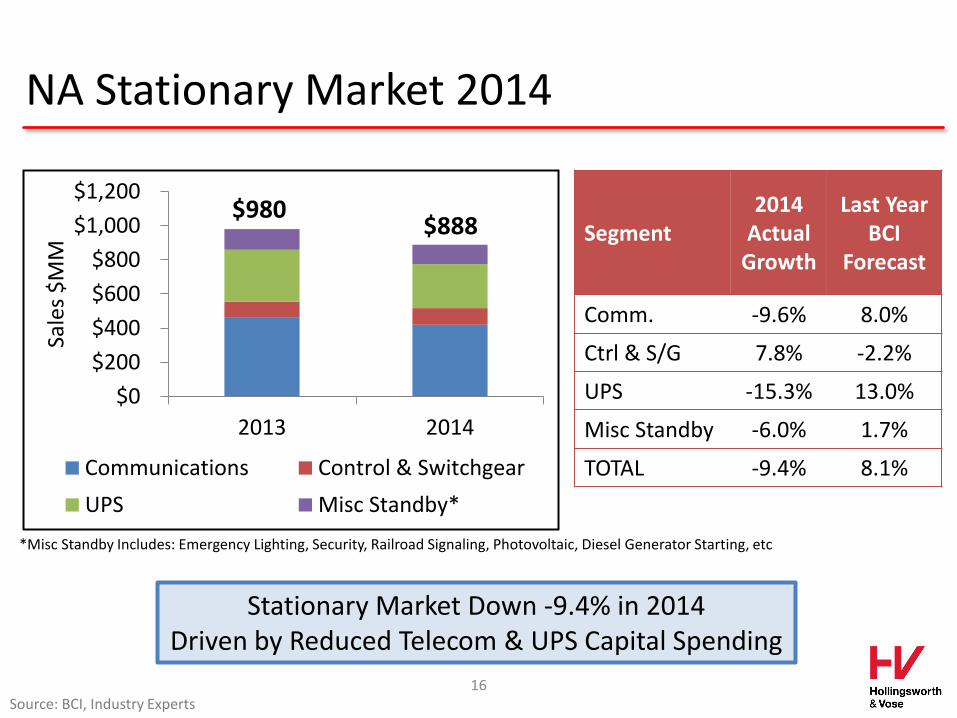
Communications Control & Switchgear
UPS Misc Standby*
Segment 2014
Actual Growth
Last Year BCI
Forecast
Comm. -9.6% 8.0%
Ctrl & S/G 7.8% -2.2%
UPS -15.3% 13.0%
Misc Standby -6.0% 1.7%
TOTAL -9.4% 8.1%
Stationary Market Down -9.4% in 2014 Driven by Reduced Telecom & UPS Capital Spending
Source: BCI, Industry Experts
$980 $888
*Misc Standby Includes: Emergency Lighting, Security, Railroad Signaling, Photovoltaic, Diesel Generator Starting, etc
16
NA Stationary Market 2008-2014
$0
$200
$400
$600
$800
$1,000
$1,200
2008 2009 2010 2011 2012 2013 2014
Sale
s $
MM
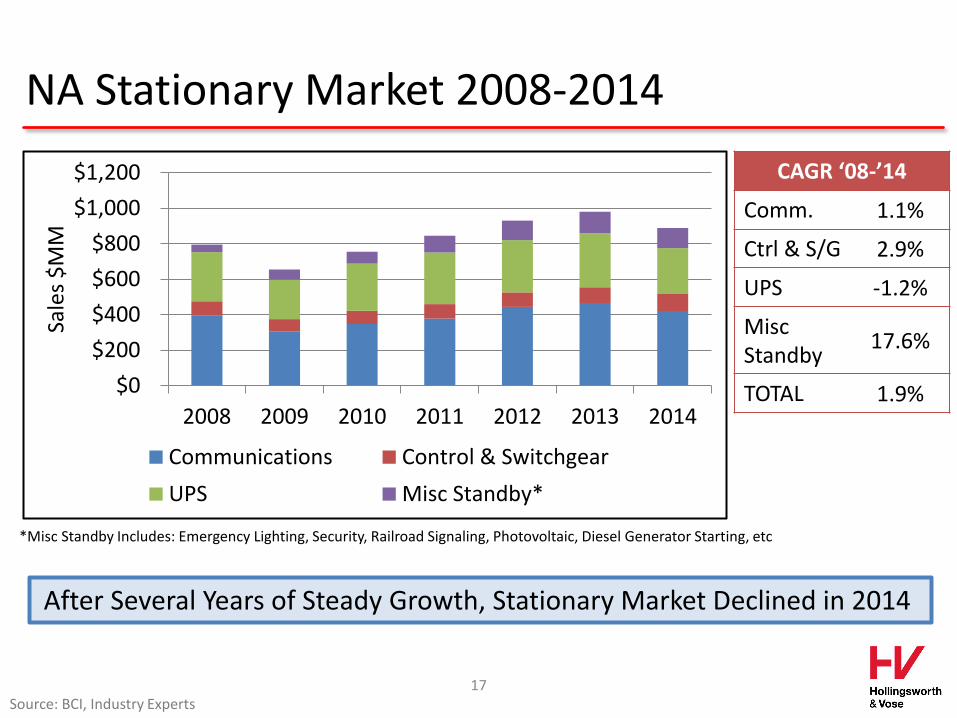
Communications Control & Switchgear
UPS Misc Standby*
CAGR ‘08-’14
Comm. 1.1%
Ctrl & S/G 2.9%
UPS -1.2%
Misc Standby
17.6%
TOTAL 1.9%
After Several Years of Steady Growth, Stationary Market Declined in 2014
Source: BCI, Industry Experts 17
*Misc Standby Includes: Emergency Lighting, Security, Railroad Signaling, Photovoltaic, Diesel Generator Starting, etc
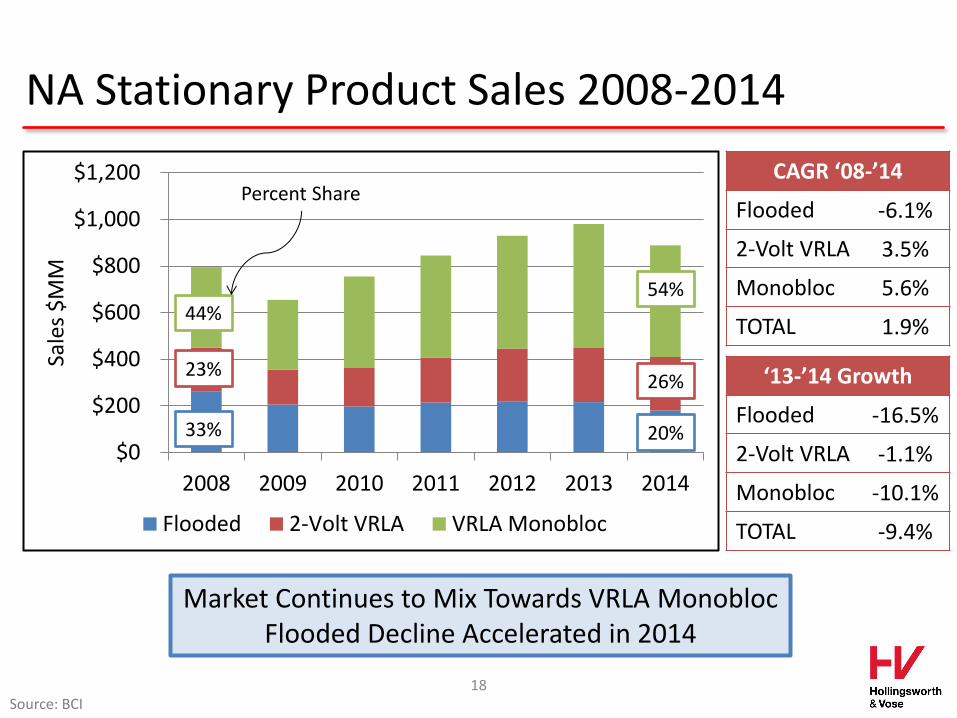
NA Stationary Product Sales 2008-2014
$0
$200
$400
$600
$800
$1,000
$1,200
2008 2009 2010 2011 2012 2013 2014
Sale
s $
MM
Flooded 2-Volt VRLA VRLA Monobloc
CAGR ‘08-’14
Flooded -6.1%
2-Volt VRLA 3.5%
Monobloc 5.6%
TOTAL 1.9%
Market Continues to Mix Towards VRLA Monobloc Flooded Decline Accelerated in 2014
Source: BCI 18
‘13-’14 Growth
Flooded -16.5%
2-Volt VRLA -1.1%
Monobloc -10.1%
TOTAL -9.4%
44%
23%
33%
54%
26%
20%
Percent Share

Communications Market Growth & Trends
$0
$100
$200
$300
$400
$500
2008 2009 2010 2011 2012 2013 2014
Sale
s $
MM
Flooded 2-Volt VRLA VRLA Monobloc
Segment ‘08-’14 CAGR
2014 Growth
Flooded -4.8% -0.5%
2-Volt VRLA 2.1% -2.3%
Monobloc 2.4% -16.7%
TOTAL 1.1% -9.6%
Telecom Market Uncertainty and Evolution Impacting Battery Sales
Drivers
Telecom Capex Spending
Regulatory Environment
Carrier System Architecture Changes
Source: BCI, Industry Experts 19

Why Mobile Data Didn’t Drive Battery Sales
20 Source: Industry Experts, AT&T/Verizon Annual Reports
Keep Engaged in the Market During Uncertainty and Change
Uncertainty Changing Industry
Dynamics
AT&T Spending Spree Network Build-Out Changing
Acquisition Paralysis Software vs Hardware (AT&T Domain 2.0)
‘Net Neutrality’ Increasing Competition (Incumbents & Disrupters)

Communications Quarterly Sales 2011-2014
Communications Sales Remain Soft, Five Straight Quarters of Year/Year Quarterly Sales Decline
Source: BCI, Industry Experts 21
Drivers
Large Telecoms Influencing Market
Capital Spending Mix Change
Uncertainty
-30%
-20%
-10%
0%
10%
20%
30%
Q1 Q2 Q3 Q4 Q1 Q2 Q3 Q4 Q1 Q2 Q3 Q4
2012/2011 2013/2012 2014/2013
Telecom Year/Year Quarterly Sales Change
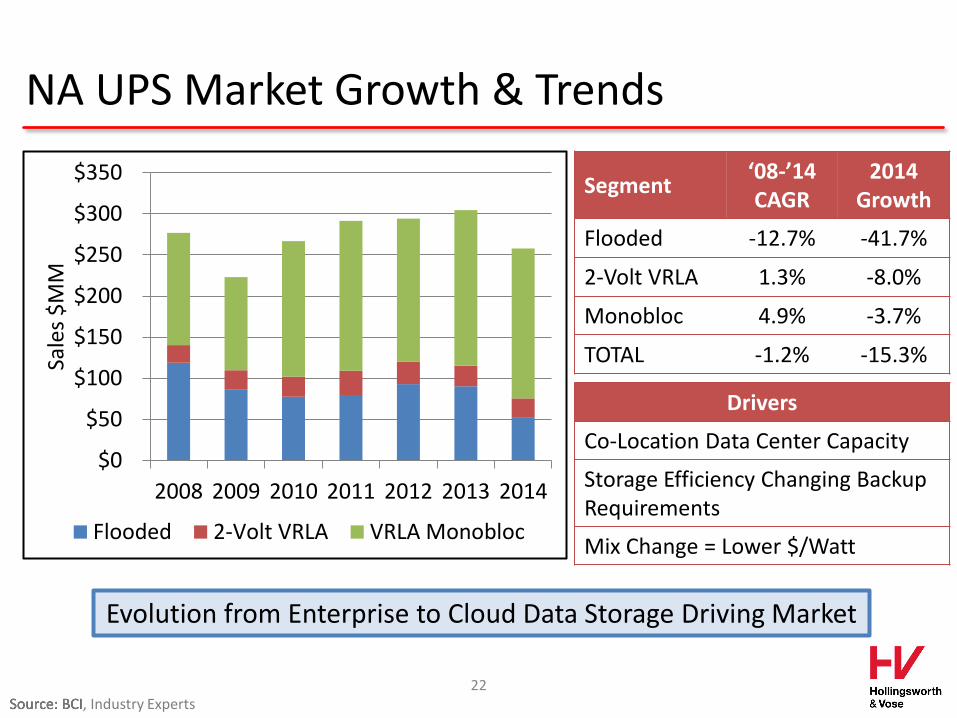
NA UPS Market Growth & Trends
$0
$50
$100
$150
$200
$250
$300
$350
2008 2009 2010 2011 2012 2013 2014
Sale
s $
MM
Flooded 2-Volt VRLA VRLA Monobloc
Segment ‘08-’14 CAGR
2014 Growth
Flooded -12.7% -41.7%
2-Volt VRLA 1.3% -8.0%
Monobloc 4.9% -3.7%
TOTAL -1.2% -15.3%
Evolution from Enterprise to Cloud Data Storage Driving Market
Source: BCI
Drivers
Co-Location Data Center Capacity
Storage Efficiency Changing Backup Requirements
Mix Change = Lower $/Watt
Source: BCI, Industry Experts 22
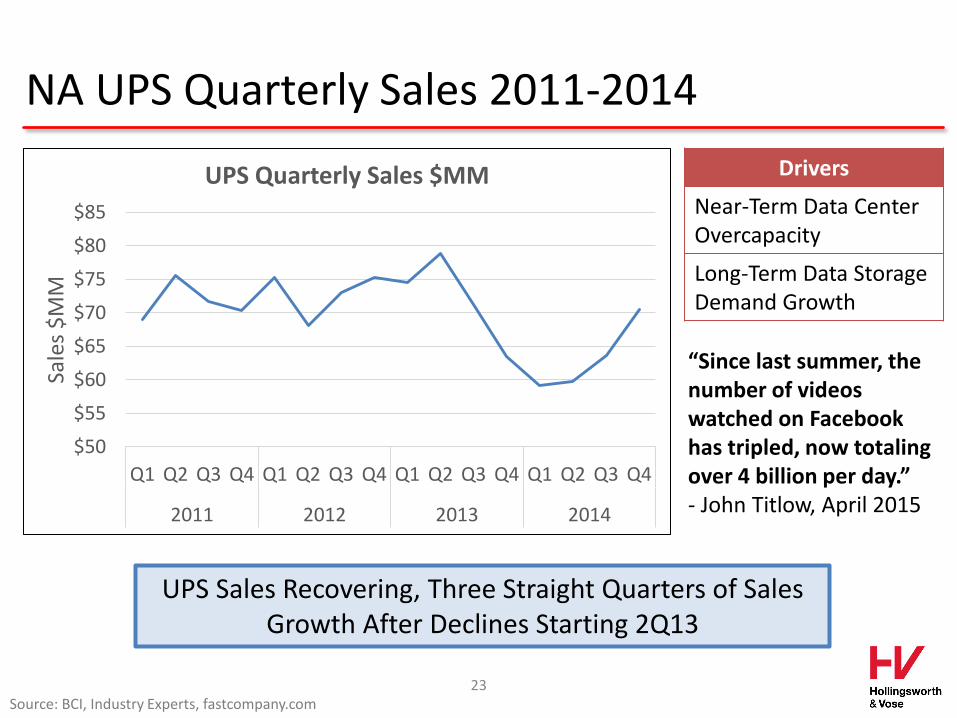
NA UPS Quarterly Sales 2011-2014
UPS Sales Recovering, Three Straight Quarters of Sales Growth After Declines Starting 2Q13
Source: BCI, Industry Experts, fastcompany.com 23
$50
$55
$60
$65
$70
$75
$80
$85
Q1 Q2 Q3 Q4 Q1 Q2 Q3 Q4 Q1 Q2 Q3 Q4 Q1 Q2 Q3 Q4
2011 2012 2013 2014
Sale
s $
MM
UPS Quarterly Sales $MM Drivers
Near-Term Data Center Overcapacity
Long-Term Data Storage Demand Growth
“Since last summer, the number of videos watched on Facebook has tripled, now totaling over 4 billion per day.” - John Titlow, April 2015
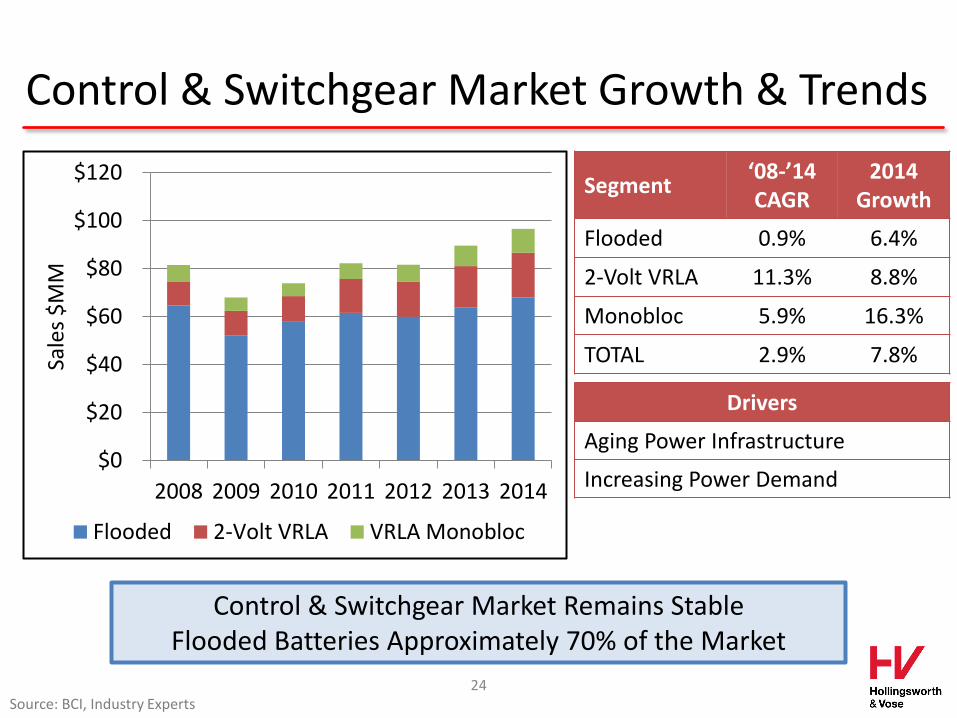
Control & Switchgear Market Growth & Trends
$0
$20
$40
$60
$80
$100
$120
2008 2009 2010 2011 2012 2013 2014
Sale
s $
MM
Flooded 2-Volt VRLA VRLA Monobloc
Segment ‘08-’14 CAGR
2014 Growth
Flooded 0.9% 6.4%
2-Volt VRLA 11.3% 8.8%
Monobloc 5.9% 16.3%
TOTAL 2.9% 7.8%
Control & Switchgear Market Remains Stable Flooded Batteries Approximately 70% of the Market
Source: BCI, Industry Experts 24
Drivers
Aging Power Infrastructure
Increasing Power Demand
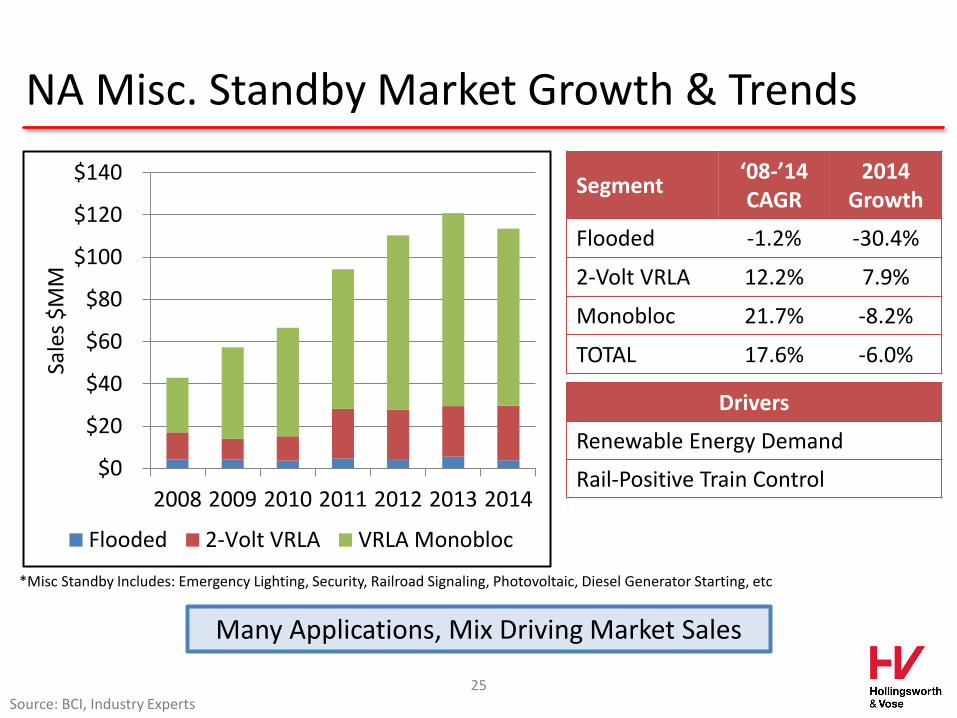
NA Misc. Standby Market Growth & Trends
$0
$20
$40
$60
$80
$100
$120
$140
2008 2009 2010 2011 2012 2013 2014
Sale
s $
MM
Flooded 2-Volt VRLA VRLA Monobloc
Segment ‘08-’14 CAGR
2014 Growth
Flooded -1.2% -30.4%
2-Volt VRLA 12.2% 7.9%
Monobloc 21.7% -8.2%
TOTAL 17.6% -6.0%
Many Applications, Mix Driving Market Sales
Drivers
Renewable Energy Demand
Rail-Positive Train Control
Source: BCI, Industry Experts
*Misc Standby Includes: Emergency Lighting, Security, Railroad Signaling, Photovoltaic, Diesel Generator Starting, etc
25
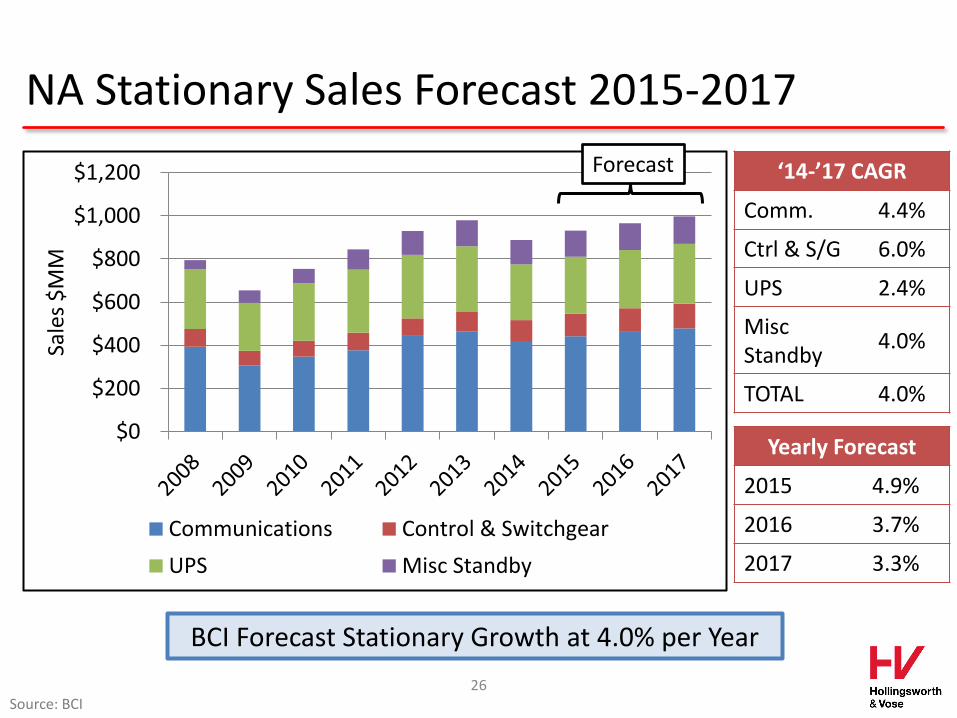
NA Stationary Sales Forecast 2015-2017
$0
$200
$400
$600
$800
$1,000
$1,200
Sale
s $
MM
Communications Control & Switchgear
UPS Misc Standby
‘14-’17 CAGR
Comm. 4.4%
Ctrl & S/G 6.0%
UPS 2.4%
Misc Standby
4.0%
TOTAL 4.0%
BCI Forecast Stationary Growth at 4.0% per Year
Yearly Forecast
2015 4.9%
2016 3.7%
2017 3.3%
Source: BCI 26
Forecast
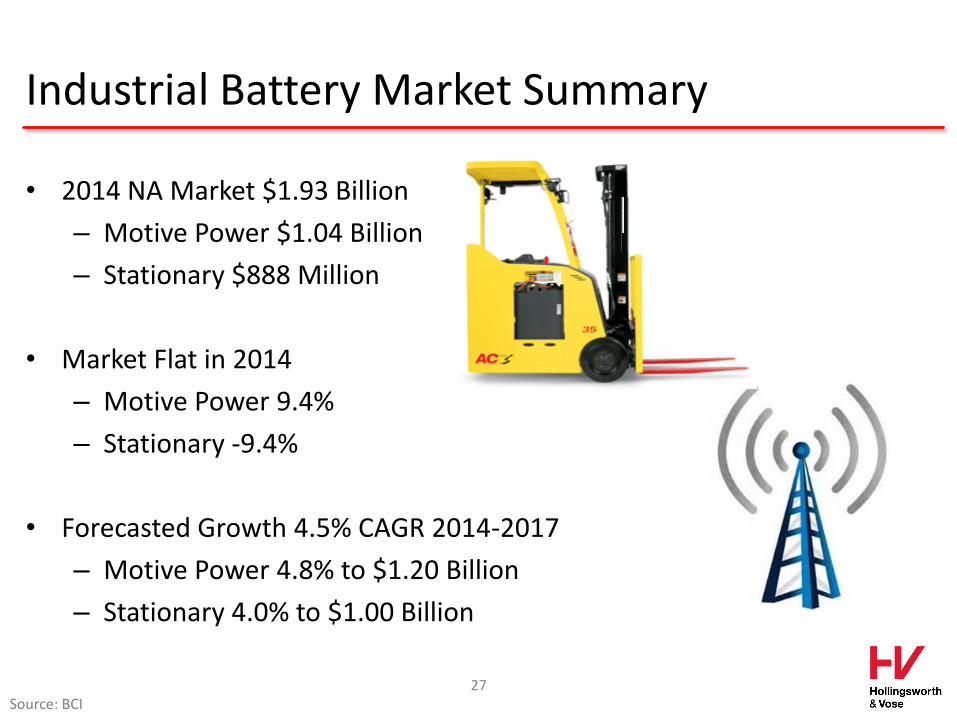
Industrial Battery Market Summary
• 2014 NA Market $1.93 Billion
– Motive Power $1.04 Billion
– Stationary $888 Million
• Market Flat in 2014
– Motive Power 9.4%
– Stationary -9.4%
• Forecasted Growth 4.5% CAGR 2014-2017
– Motive Power 4.8% to $1.20 Billion
– Stationary 4.0% to $1.00 Billion
Source: BCI 27
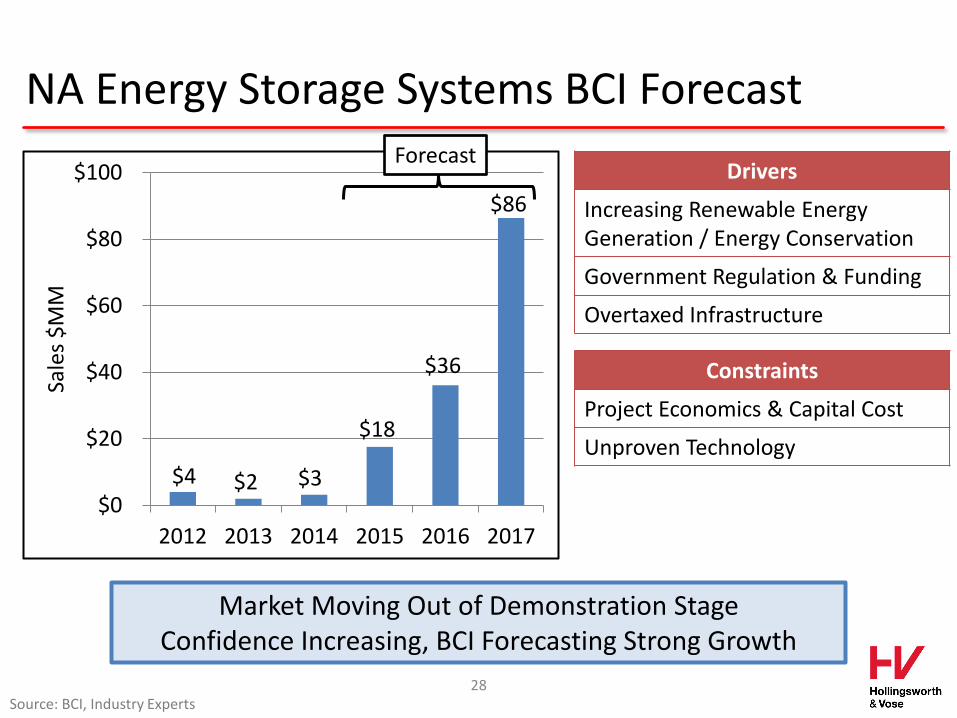
NA Energy Storage Systems BCI Forecast
$4 $2 $3
$18
$36
$86
$0
$20
$40
$60
$80
$100
2012 2013 2014 2015 2016 2017
Sale
s $
MM
Market Moving Out of Demonstration Stage Confidence Increasing, BCI Forecasting Strong Growth
Constraints
Project Economics & Capital Cost
Unproven Technology
Drivers
Increasing Renewable Energy Generation / Energy Conservation
Government Regulation & Funding
Overtaxed Infrastructure
Source: BCI, Industry Experts 28
Forecast
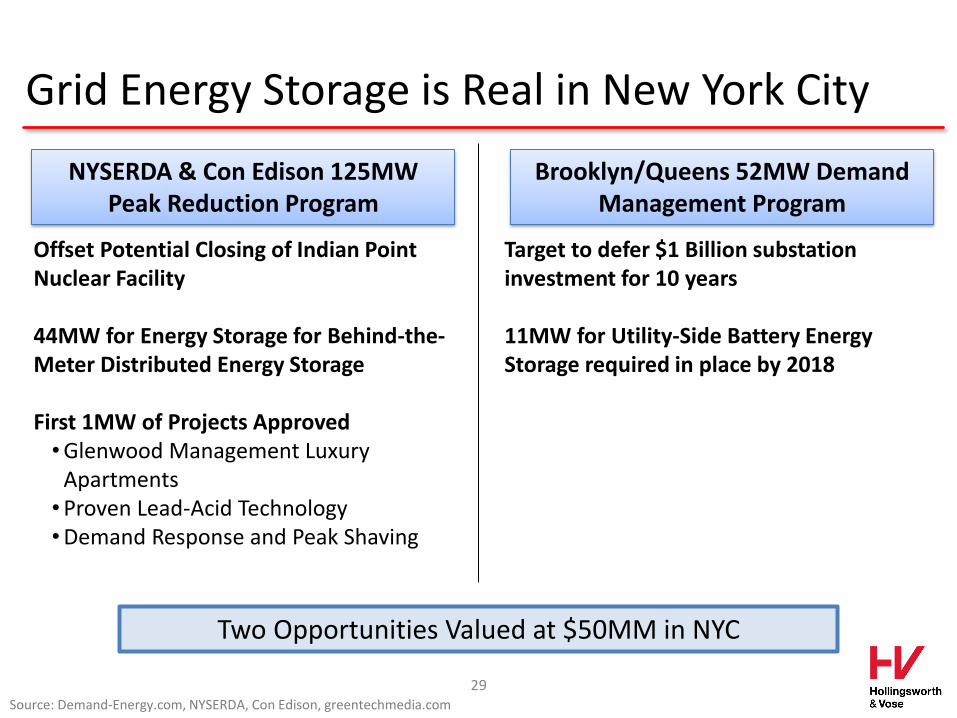
Grid Energy Storage is Real in New York City
29 Source: Demand-Energy.com, NYSERDA, Con Edison, greentechmedia.com
NYSERDA & Con Edison 125MW Peak Reduction Program
Offset Potential Closing of Indian Point Nuclear Facility 44MW for Energy Storage for Behind-the-Meter Distributed Energy Storage First 1MW of Projects Approved •Glenwood Management Luxury
Apartments •Proven Lead-Acid Technology •Demand Response and Peak Shaving
Brooklyn/Queens 52MW Demand Management Program
Target to defer $1 Billion substation investment for 10 years 11MW for Utility-Side Battery Energy Storage required in place by 2018
Two Opportunities Valued at $50MM in NYC
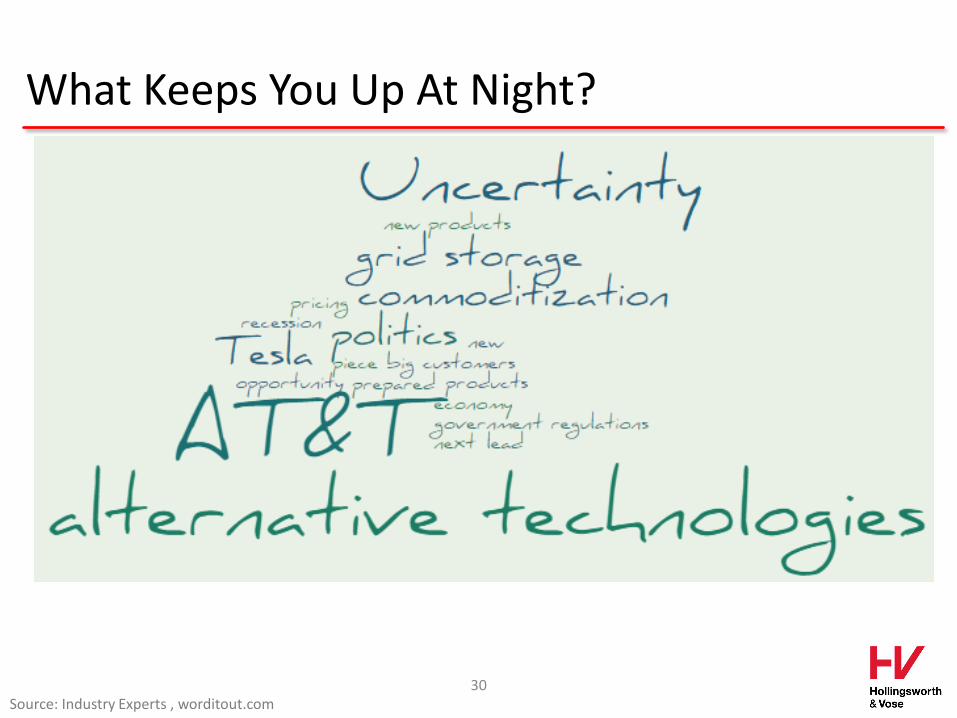
Source: Industry Experts , worditout.com 30
What Keeps You Up At Night?
Fuel Cell Lithium
Lithium NiCd
Fly Wheels
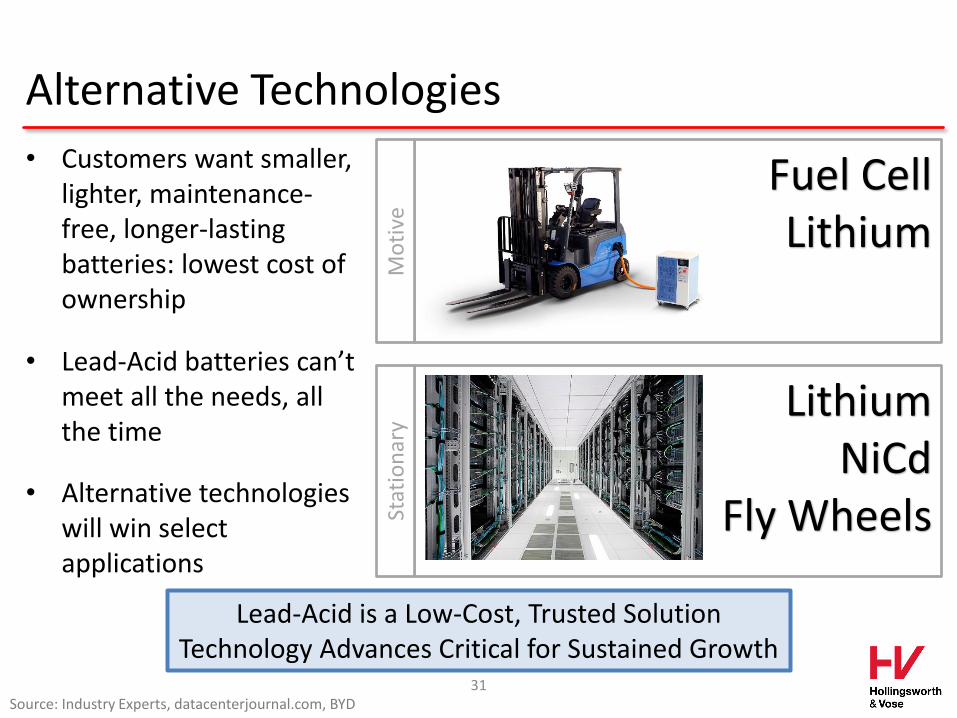
Alternative Technologies
Source: Industry Experts, datacenterjournal.com, BYD 31
• Customers want smaller, lighter, maintenance-free, longer-lasting batteries: lowest cost of ownership
• Lead-Acid batteries can’t meet all the needs, all the time
• Alternative technologies will win select applications
Lead-Acid is a Low-Cost, Trusted Solution Technology Advances Critical for Sustained Growth
Mo
tive
St
atio
nar
y
Presented at the 127th Convention of Battery Council International May 3-5, 2015
North American Industrial Battery Forecast 2015-2017
Mitch Bregman Division President Energy and Industrial Systems
Recommended


![2014년 5월 13일 - true Friendfile.truefriend.com/Storage/research/research04/20140513... · 2014. 5. 12. · 투자전략 2014.05.13 2 [그림 1] 환율 추이 1,000 1,050 1,100](https://img.pdfslide.net/doc/110x75/60cdd89e9e1d4414ba3cfb0d/2014e-5-13-true-2014-5-12-e-20140513-2-ee-1-oe.jpg)