Stock Code : 3387
Year Ended February 29, 2016
B E C O M I N G T H E W O R L D ' S M O S T C O M P E T I T I V E R E S T A U R A N T S E R V I C E C O M P A N Y
CONTENTS
02 Financial and Non-financial Highlights
04 Message from the President and CEO
05 Business Strategy
08 Our Brands
10 Corporate Governance
12 Management’s Discussion and Analysis
14 Consolidated Financial Statements
17 Corporate Data
JAPAN
New York
HONG KONG
SHANGHAI
TAIWAN
SINGAPORE
* Number of restaurants includes licensed businesses, franchised stores and overseas joint ventures.
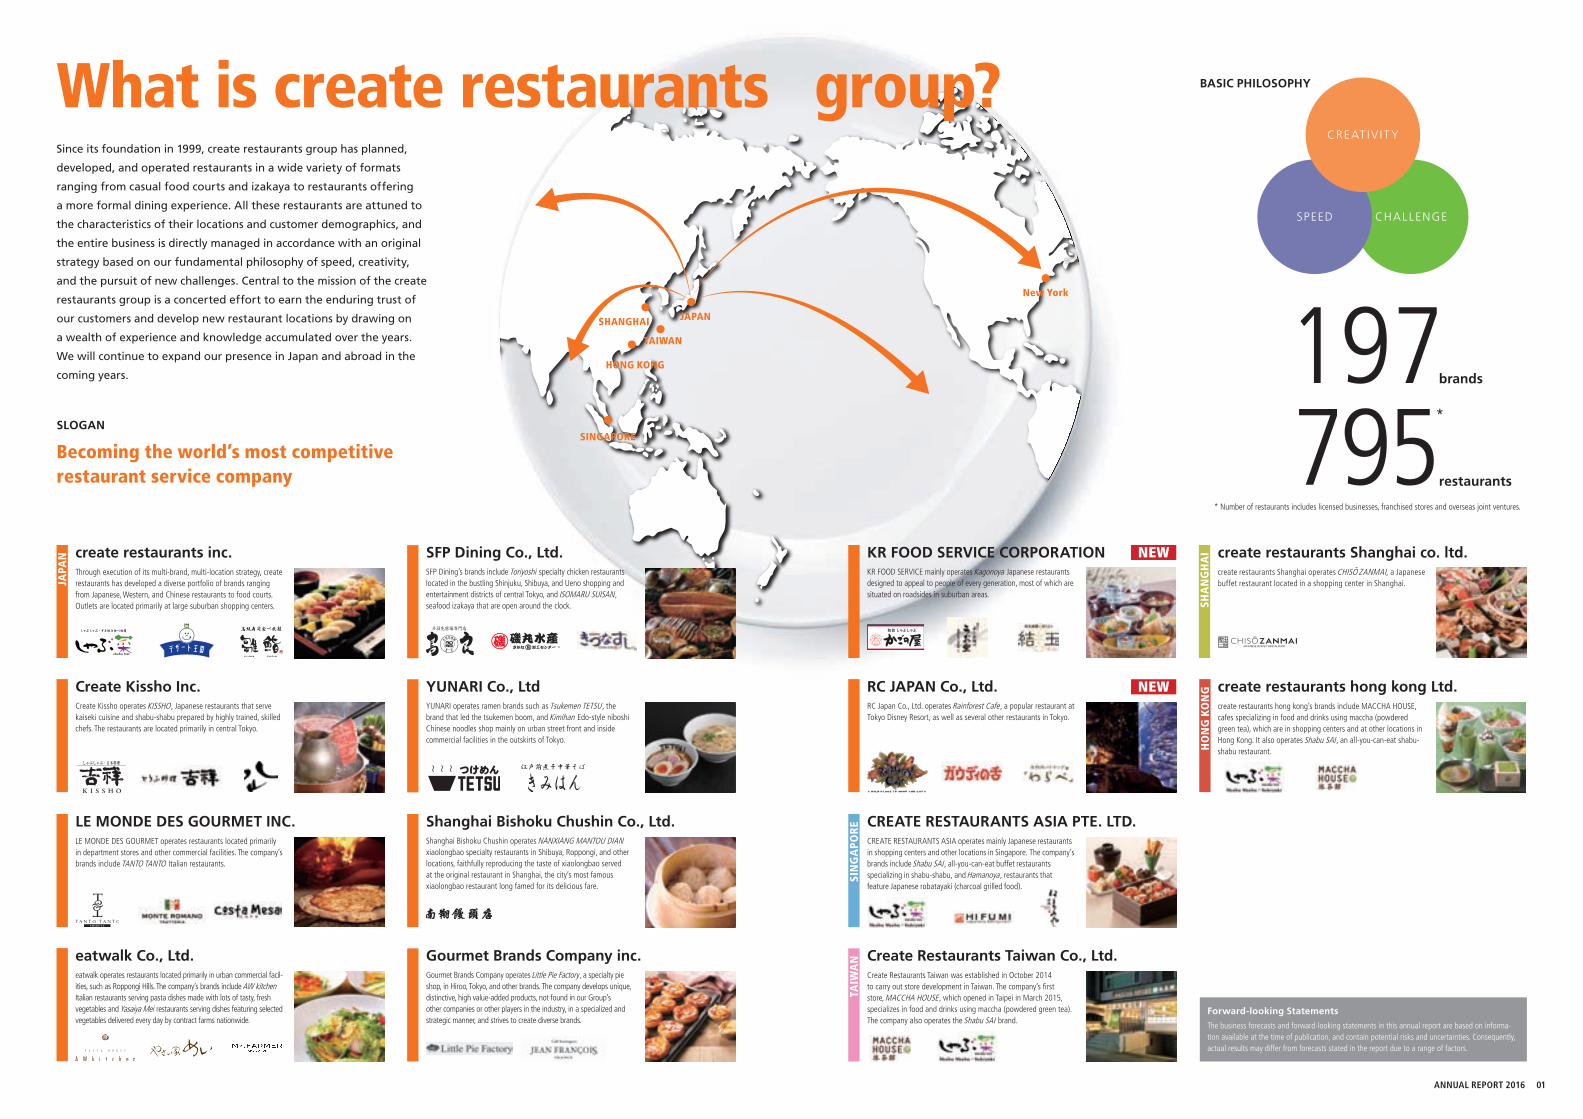
What is create restaurants group?Since its foundation in 1999, create restaurants group has planned,
developed, and operated restaurants in a wide variety of formats
ranging from casual food courts and izakaya to restaurants offering
a more formal dining experience. All these restaurants are attuned to
the characteristics of their locations and customer demographics, and
the entire business is directly managed in accordance with an original
strategy based on our fundamental philosophy of speed, creativity,
and the pursuit of new challenges. Central to the mission of the create
restaurants group is a concerted effort to earn the enduring trust of
our customers and develop new restaurant locations by drawing on
a wealth of experience and knowledge accumulated over the years.
We will continue to expand our presence in Japan and abroad in the
coming years.
Forward-looking Statements
The business forecasts and forward-looking statements in this annual report are based on informa-tion available at the time of publication, and contain potential risks and uncertainties. Consequently, actual results may differ from forecasts stated in the report due to a range of factors.
Becoming the world’s most competitive restaurant service company
SLOGAN 795*
restaurants
197brands
SFP Dining’s brands include Toriyoshi specialty chicken restaurants located in the bustling Shinjuku, Shibuya, and Ueno shopping and entertainment districts of central Tokyo, and ISOMARU SUISAN, seafood izakaya that are open around the clock.
SFP Dining Co., Ltd.
YUNARI operates ramen brands such as Tsukemen TETSU, the brand that led the tsukemen boom, and Kimihan Edo-style niboshi Chinese noodles shop mainly on urban street front and inside commercial facilities in the outskirts of Tokyo.
YUNARI Co., Ltd
LE MONDE DES GOURMET operates restaurants located primarily in department stores and other commercial facilities. The company’s brands include TANTO TANTO Italian restaurants.
LE MONDE DES GOURMET INC.Shanghai Bishoku Chushin operates NANXIANG MANTOU DIAN xiaolongbao specialty restaurants in Shibuya, Roppongi, and other locations, faithfully reproducing the taste of xiaolongbao served at the original restaurant in Shanghai, the city’s most famous xiaolongbao restaurant long famed for its delicious fare.
Shanghai Bishoku Chushin Co., Ltd.
eatwalk operates restaurants located primarily in urban commercial facil-ities, such as Roppongi Hills. The company’s brands include AW kitchen Italian restaurants serving pasta dishes made with lots of tasty, fresh vegetables and Yasaiya Mei restaurants serving dishes featuring selected vegetables delivered every day by contract farms nationwide.
eatwalk Co., Ltd.
create restaurants hong kong’s brands include MACCHA HOUSE, cafes specializing in food and drinks using maccha (powdered green tea), which are in shopping centers and at other locations in Hong Kong. It also operates Shabu SAI , an all-you-can-eat shabu-shabu restaurant.
create restaurants hong kong Ltd.
HO
NG
KO
NG
create restaurants Shanghai operates CHISO ZANMAI, a Japanese buffet restaurant located in a shopping center in Shanghai.
create restaurants Shanghai co. ltd.
SHA
NG
HA
I
CREATE RESTAURANTS ASIA operates mainly Japanese restaurants in shopping centers and other locations in Singapore. The company’s brands include Shabu SAI, all-you-can-eat buffet restaurants specializing in shabu-shabu, and Hamanoya, restaurants that feature Japanese robatayaki (charcoal grilled food).
CREATE RESTAURANTS ASIA PTE. LTD.
SIN
GA
POR
E
Gourmet Brands Company operates Little Pie Factory, a specialty pie shop, in Hiroo, Tokyo, and other brands. The company develops unique, distinctive, high value-added products, not found in our Group’s other companies or other players in the industry, in a specialized and strategic manner, and strives to create diverse brands.
Gourmet Brands Company inc.
KR FOOD SERVICE mainly operates Kagonoya Japanese restaurants designed to appeal to people of every generation, most of which are situated on roadsides in suburban areas.
KR FOOD SERVICE CORPORATION NEW
RC Japan Co., Ltd. operates Rainforest Cafe, a popular restaurant at Tokyo Disney Resort, as well as several other restaurants in Tokyo.
RC JAPAN Co., Ltd. NEW
CHALLENGESPEED
CREAT IV IT Y
BASIC PHILOSOPHY
Through execution of its multi-brand, multi-location strategy, create restaurants has developed a diverse portfolio of brands ranging from Japanese, Western, and Chinese restaurants to food courts. Outlets are located primarily at large suburban shopping centers.
create restaurants inc.
JAPA
N
Create Kissho operates KISSHO, Japanese restaurants that serve kaiseki cuisine and shabu-shabu prepared by highly trained, skilled chefs. The restaurants are located primarily in central Tokyo.
Create Kissho Inc.
Create Restaurants Taiwan was established in October 2014 to carry out store development in Taiwan. The company’s first store, MACCHA HOUSE, which opened in Taipei in March 2015, specializes in food and drinks using maccha (powdered green tea). The company also operates the Shabu SAI brand.
Create Restaurants Taiwan Co., Ltd.
TAIW
AN
01ANNUAL REPORT 2016
Financial and Non-financial Highlights
Operating incomeNumber of outlets
Cash dividends Per share (Millions of Yen) (Yen)
Operating margin Dividend payout ratio (%) (%)
Net incomeNumber of brands
(Millions of Yen)
Net income per share (Yen)
2013 201420120
20,000
60,000
80,000
40,000
100,000
120,000
2015 2016 2013 201420120
6.00
3.00
12.00
9.00
15.00
2015 20160
10.0
20.0
30.0
40.0
50.0
2013 201420120
2,000
4,000
6,000
8,000
2015 20160
2.0
4.0
6.0
8.0
10.0
2013 201420120
100
200
400
300
500
800
700
600
2015 20162013 201420120
2,000
6,000
4,000
8,000
2015 20160
20.00
60.00
40.00
80.00
100.00
2013 201420120
50
100
150
200
2015 2016
Net sales (Millions of Yen)
Operating income Cash dividends Per shareNet income
Operating margin Dividend payout ratioNet income per share
Millions of Yen,except for Number of brands, Number of restaurants and Number of employees
Thousands of U.S. Dollars
(Note)
2012 2013 2014 2015 2016 2016
For the year
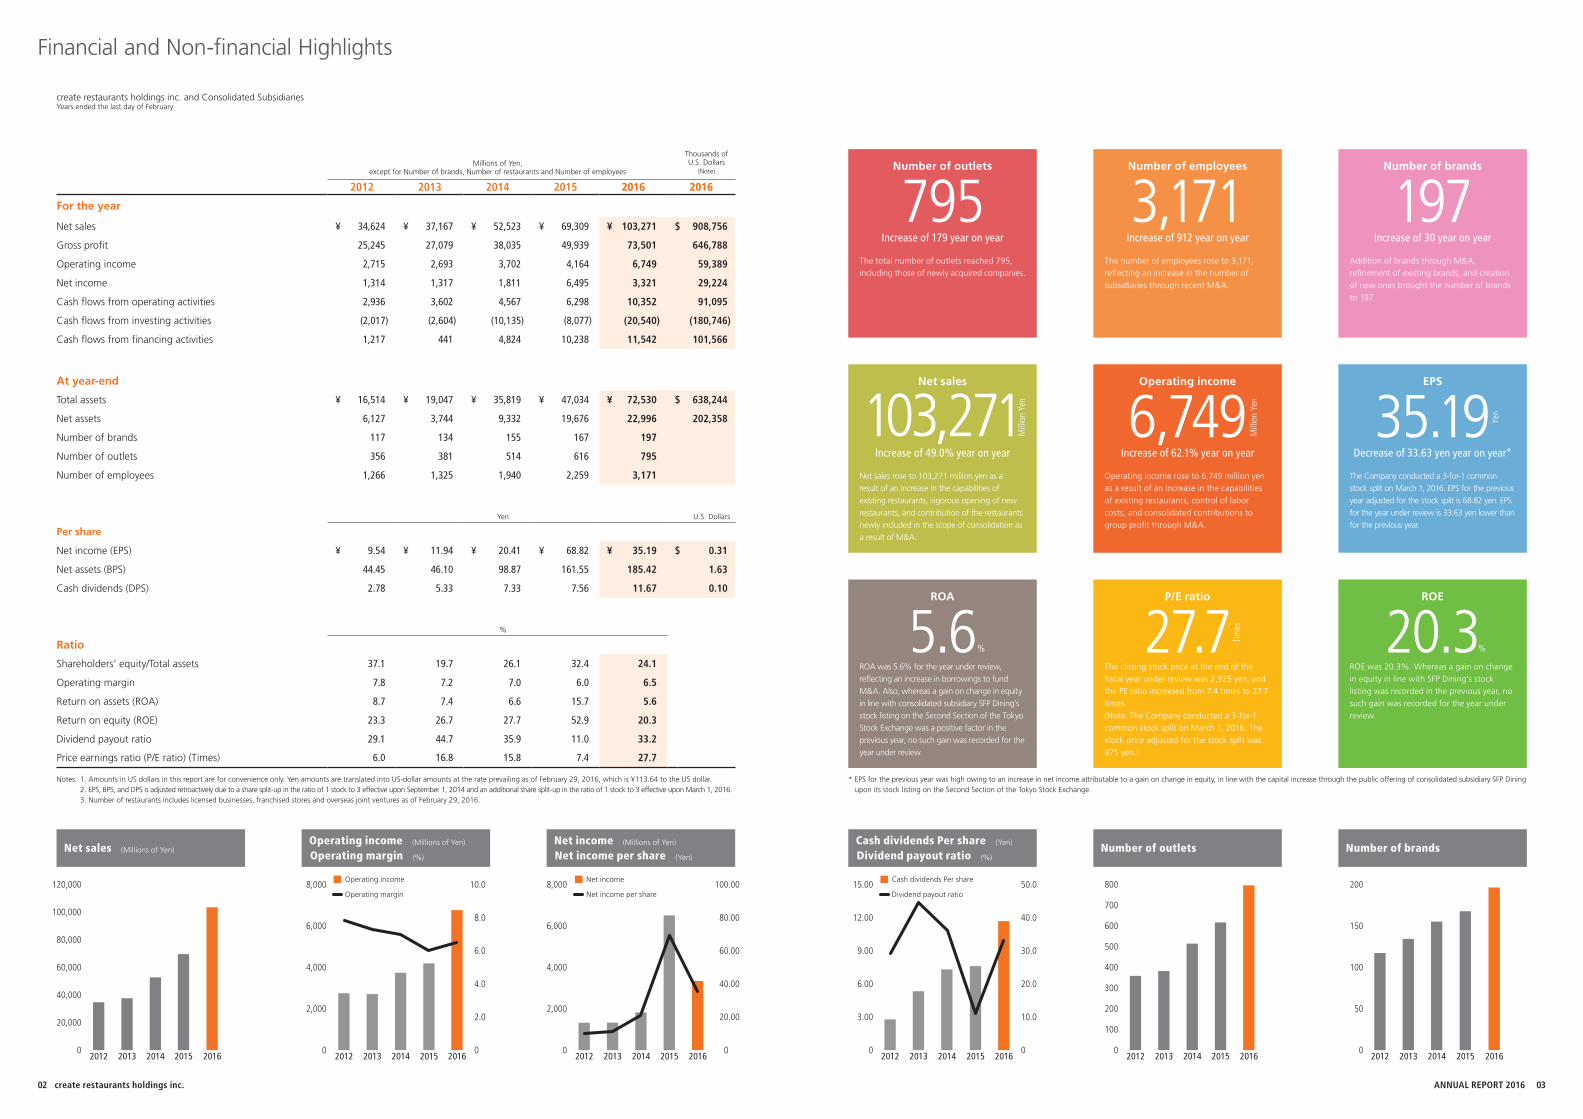
Net sales ¥ 34,624 ¥ 37,167 ¥ 52,523 ¥ 69,309 ¥ 103,271 $ 908,756
Gross profit 25,245 27,079 38,035 49,939 73,501 646,788
Operating income 2,715 2,693 3,702 4,164 6,749 59,389
Net income 1,314 1,317 1,811 6,495 3,321 29,224
Cash flows from operating activities 2,936 3,602 4,567 6,298 10,352 91,095
Cash flows from investing activities (2,017) (2,604) (10,135) (8,077) (20,540) (180,746)
Cash flows from financing activities 1,217 441 4,824 10,238 11,542 101,566
At year-end
Total assets ¥ 16,514 ¥ 19,047 ¥ 35,819 ¥ 47,034 ¥ 72,530 $ 638,244
Net assets 6,127 3,744 9,332 19,676 22,996 202,358
Number of brands 117 134 155 167 197
Number of outlets 356 381 514 616 795
Number of employees 1,266 1,325 1,940 2,259 3,171
Yen U.S. Dollars
Per share
Net income (EPS) ¥ 9.54 ¥ 11.94 ¥ 20.41 ¥ 68.82 ¥ 35.19 $ 0.31
Net assets (BPS) 44.45 46.10 98.87 161.55 185.42 1.63
Cash dividends (DPS) 2.78 5.33 7.33 7.56 11.67 0.10
%
Ratio
Shareholders’ equity/Total assets 37.1 19.7 26.1 32.4 24.1
Operating margin 7.8 7.2 7.0 6.0 6.5
Return on assets (ROA) 8.7 7.4 6.6 15.7 5.6
Return on equity (ROE) 23.3 26.7 27.7 52.9 20.3
Dividend payout ratio 29.1 44.7 35.9 11.0 33.2
Price earnings ratio (P/E ratio) (Times) 6.0 16.8 15.8 7.4 27.7
Notes: 1. Amounts in US dollars in this report are for convenience only. Yen amounts are translated into US-dollar amounts at the rate prevailing as of February 29, 2016, which is ¥113.64 to the US dollar. 2. EPS, BPS, and DPS is adjusted retroactively due to a share split-up in the ratio of 1 stock to 3 effective upon September 1, 2014 and an additional share split-up in the ratio of 1 stock to 3 effective upon March 1, 2016. 3. Number of restaurants includes licensed businesses, franchised stores and overseas joint ventures as of February 29, 2016.
* EPS for the previous year was high owing to an increase in net income attributable to a gain on change in equity, in line with the capital increase through the public offering of consolidated subsidiary SFP Dining upon its stock listing on the Second Section of the Tokyo Stock Exchange.
create restaurants holdings inc. and Consolidated SubsidiariesYears ended the last day of February
Number of outlets
795Increase of 179 year on year
The total number of outlets reached 795, including those of newly acquired companies.
Number of employees
3,171Increase of 912 year on year
The number of employees rose to 3,171, reflecting an increase in the number of subsidiaries through recent M&A.
Number of brands
197Increase of 30 year on year
Addition of brands through M&A, refinement of existing brands, and creation of new ones brought the number of brands to 197.
Operating income
6,749Increase of 62.1% year on year
Operating income rose to 6,749 million yen as a result of an increase in the capabilities of existing restaurants, control of labor costs, and consolidated contributions to group profit through M&A.
Mill
ion
Yen
P/E ratio
27.7The closing stock price at the end of the fiscal year under review was 2,925 yen, and the PE ratio increased from 7.4 times to 27.7 times.(Note: The Company conducted a 3-for-1 common stock split on March 1, 2016. The stock price adjusted for the stock split was 975 yen.)
Tim
es
Net sales
103,271Increase of 49.0% year on year
Net sales rose to 103,271 million yen as a result of an increase in the capabilities of existing restaurants, vigorous opening of new restaurants, and contribution of the restaurants newly included in the scope of consolidation as a result of M&A.
Mill
ion
Yen
ROA
5.6ROA was 5.6% for the year under review, reflecting an increase in borrowings to fund M&A. Also, whereas a gain on change in equity in line with consolidated subsidiary SFP Dining’s stock listing on the Second Section of the Tokyo Stock Exchange was a positive factor in the previous year, no such gain was recorded for the year under review.
%
ROE
20.3ROE was 20.3%. Whereas a gain on change in equity in line with SFP Dining’s stock listing was recorded in the previous year, no such gain was recorded for the year under review.
%
EPS
35.19Decrease of 33.63 yen year on year*
Yen
The Company conducted a 3-for-1 common stock split on March 1, 2016. EPS for the previous year adjusted for the stock split is 68.82 yen. EPS for the year under review is 33.63 yen lower than for the previous year.
02 03create restaurants holdings inc. ANNUAL REPORT 2016
Basic Philosophy
Message from the President and CEO Business Strategy
The restaurant business environment in Japan has changed
dramatically during the past few decades. During the rapid
growth period of the Japanese economy, restaurant chains
formed and expanded, and family restaurants and fast food chains
grew swiftly. Subsequently, consumer preferences diversified and
the variety of restaurant formats began to increase.
In August 1999 we opened our first restaurant, the Italian
buffet restaurant Portofino, in a commercial facility in Daiba,
Tokyo. Riding the wave of the development and opening of many
large-scale commercial facilities in the 2000s, we have expanded
our business by operating restaurants and food courts in locations
that attract large numbers of customers, mainly suburban
shopping centers and urban commercial facilities. We have grown
by pioneering the practice of creating a variety of brands, seizing
opportunities, and accumulating experience under our unique
multi-brand, multi-location strategy, which involves the planning
and developing of a variety of restaurant formats and opening
outlets attuned to specific locations. For instance, in 2005 we
opened and solely operated a 1,600-seat food court at the EXPO
2005 Aichi.
Our key strength is that we accumulate expertise that can be
obtained only from a multi-format operation, not a single-brand
operation. By combining “flexible adaptability to change” with
our “high level of expertise,” we are able to plan, develop, and
operate restaurants that meet evolving consumer needs and win
long-term customer support.
In recent years, the number of subsidiaries has increased as we
proactively conducted high-quality M&As, and our restaurant
formats and locations have diversified. We no longer open
restaurants only in shopping centers, which have long been our
main locations , but have expanded our strategic options. For
instance, we are increasingly selecting street-level and downtown
locations and have begun opening suburban roadside outlets.
Additionally, SFP Dining Co., Ltd., a subsidiary which the
Company acquired through M&A, listed its stock on the Second
Section of the Tokyo Stock Exchange in December 2014. Going
forward, we will make a group-wide effort to achieve further
growth and enhancement of corporate value.
The create restaurants group was founded in 1999 out of the
desire to always create restaurants appropriate to the times, taking
customer satisfaction as the starting point. Ever since, the group
has planned and developed restaurants in a wide variety of formats
attuned to their locations, ranging from casual food courts and
izakaya to restaurants offering a more formal dining experience.
As our business grew, in 2005 we listed the Company’s
shares on the Mothers section of the Tokyo Stock Exchange.
Subsequently, in 2012 we acquired all shares held by Mitsubishi
Corporation, which had been the parent company since the
Company was founded, and in 2013 changed the stock market
listing to the First Section of the Tokyo Stock Exchange.
In recent years, we have been active in M&A and have grown to
be a group consisting of 20 companies, eleven in Japan and nine
overseas, operating over 800 restaurants and foodservice outlets
nationally and internationally, striving to grow further as a group.
The restaurant industry needs to flexibly respond to change in
light of the diversification of consumer needs, and it is becoming
increasingly difficult to seek growth just by operating a single brand
chain-store development based on a conventional business model.
The create restaurants Group has been promoting “Group
Federation Management” since 2013 in order to respond to the
change. Specifically, While we will continue pursuing high-quality
M&A, having multiple operating companies within the Group
that have diverse corporate cultures and implement distinctive
strategies, we pursue growth as a group. We are also expanding
our presence overseas and introducing the brands we have
cultivated in Japan in overseas markets. In addition to the ASEAN
and Greater China regions, we are also taking North America in
account as another avenue for our global expansion in pursuit of
further growth.
The management and employees of our group will continue
to contribute to society by embracing the frontier spirit, taking
on difficult challenges without fear of failure, and proposing fine
food and satisfying dining experiences to as many customers as
possible around the world.
Further Enhance Corporate Value by Promoting “Group Federation Management”
We are always beside our customers. Our joy is to gain long-lasting trust from our customers
by offering a professional service, cuisine, and atmosphere with always feeling grateful for
our customers. To accomplish this, we value small ideas that spring in front of us, pursue
speed, creativity, and new challenges, and develop multi-brand management strategically
and scientifically. In this way, we aim to become the world’s most competitive restaurants
services company.
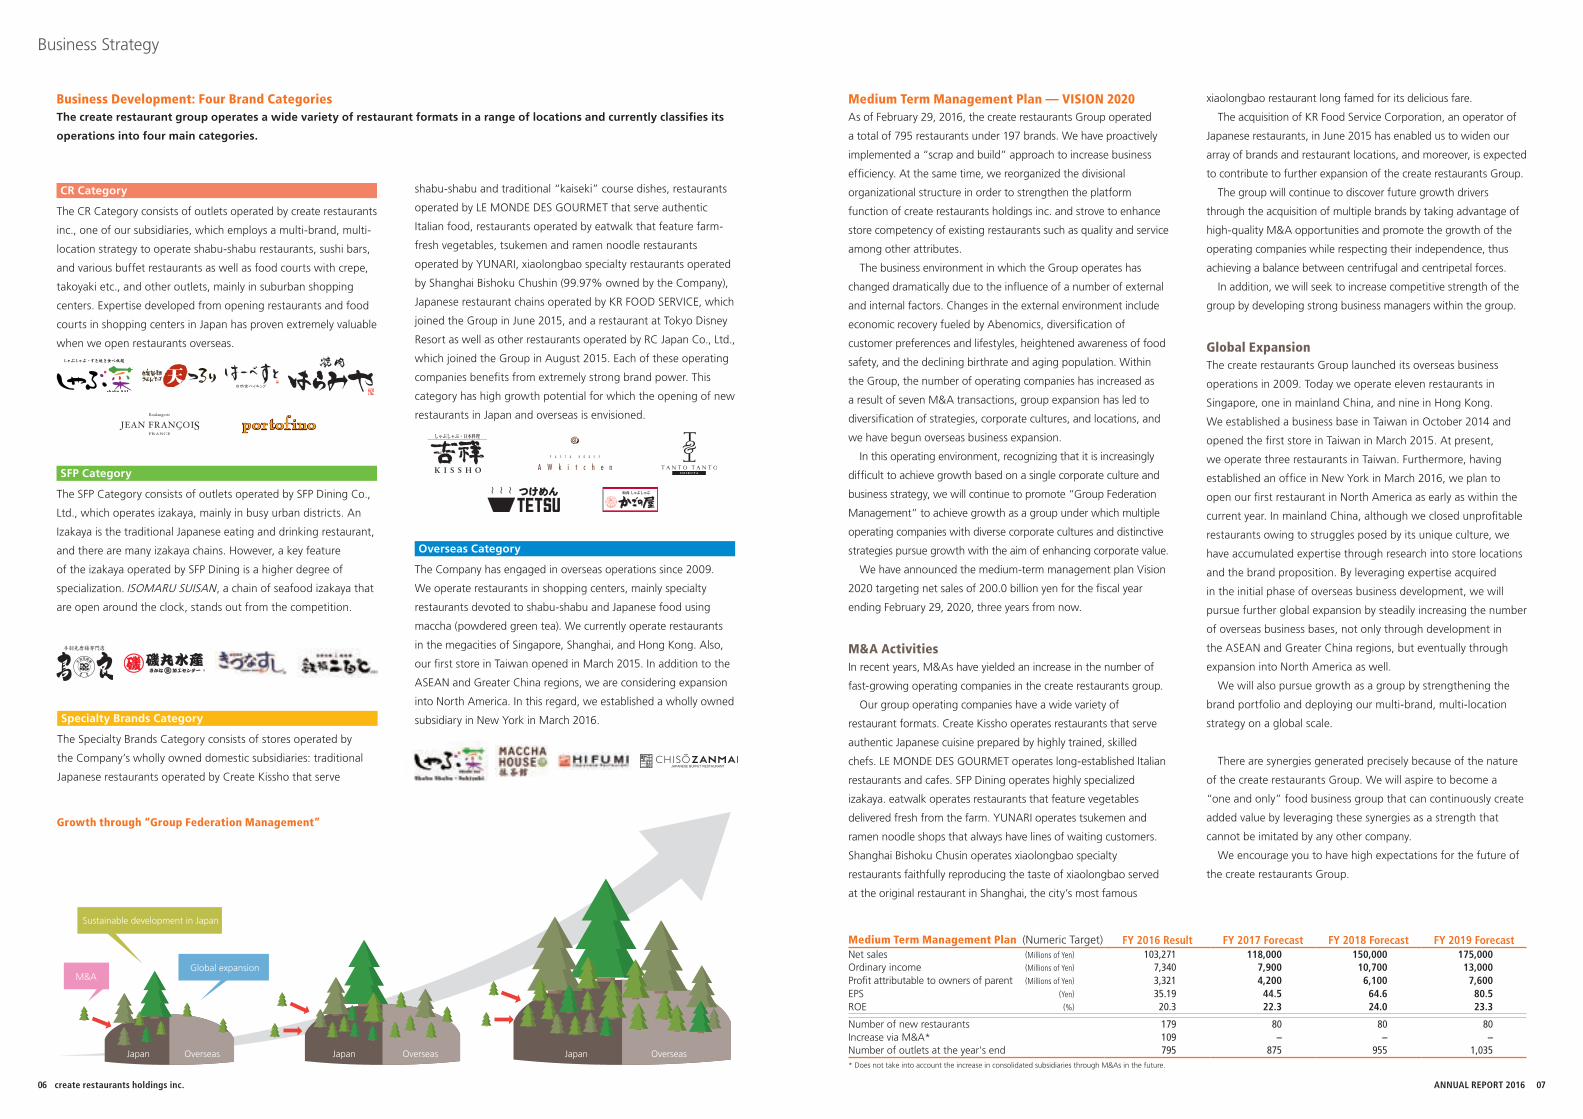
Our Unique Strategy
Positioning of Group Subsidiaries
High-end
Casual
Speciality Variety
Create Kissho Inc.
SFP Dining Co., Ltd.
SFP Dining Co., Ltd.
YUNARI Co., Ltd YUNARI Co., Ltd
eatwalk Co., Ltd.
eatwalk Co., Ltd.
KR FOOD SERVICE CORPORATION
LE MONDE DES GOURMET INC.
create restaurants inc.
create restaurants inc.
LE MONDE DES GOURMET INC.
Restaurants inside commercial facilities
Food courts inside commercial facilities
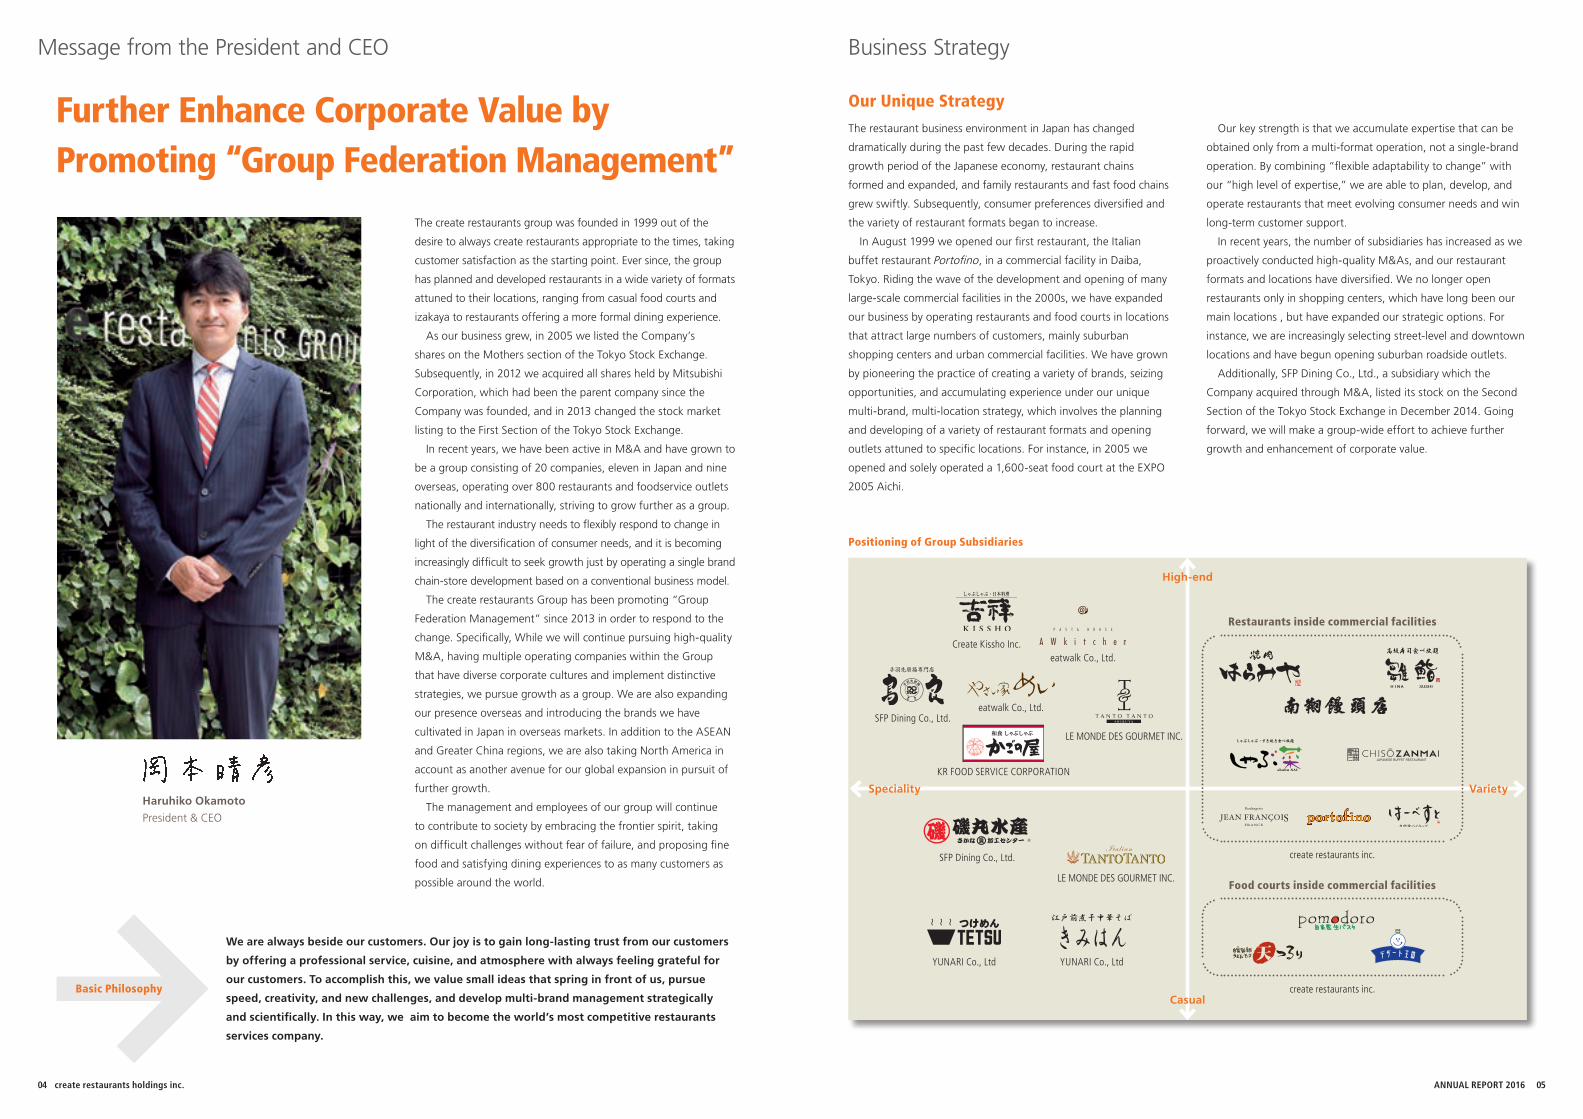
Haruhiko Okamoto
President & CEO
04 05create restaurants holdings inc. ANNUAL REPORT 2016
Business Strategy
Sustainable development in Japan
Global expansion
Japan Overseas Japan Overseas Japan Overseas
M&A
Growth through “Group Federation Management”
xiaolongbao restaurant long famed for its delicious fare.
The acquisition of KR Food Service Corporation, an operator of
Japanese restaurants, in June 2015 has enabled us to widen our
array of brands and restaurant locations, and moreover, is expected
to contribute to further expansion of the create restaurants Group.
The group will continue to discover future growth drivers
through the acquisition of multiple brands by taking advantage of
high-quality M&A opportunities and promote the growth of the
operating companies while respecting their independence, thus
achieving a balance between centrifugal and centripetal forces.
In addition, we will seek to increase competitive strength of the
group by developing strong business managers within the group.
The create restaurants Group launched its overseas business
operations in 2009. Today we operate eleven restaurants in
Singapore, one in mainland China, and nine in Hong Kong.
We established a business base in Taiwan in October 2014 and
opened the first store in Taiwan in March 2015. At present,
we operate three restaurants in Taiwan. Furthermore, having
established an office in New York in March 2016, we plan to
open our first restaurant in North America as early as within the
current year. In mainland China, although we closed unprofitable
restaurants owing to struggles posed by its unique culture, we
have accumulated expertise through research into store locations
and the brand proposition. By leveraging expertise acquired
in the initial phase of overseas business development, we will
pursue further global expansion by steadily increasing the number
of overseas business bases, not only through development in
the ASEAN and Greater China regions, but eventually through
expansion into North America as well.
We will also pursue growth as a group by strengthening the
brand portfolio and deploying our multi-brand, multi-location
strategy on a global scale.
There are synergies generated precisely because of the nature
of the create restaurants Group. We will aspire to become a
“one and only” food business group that can continuously create
added value by leveraging these synergies as a strength that
cannot be imitated by any other company.
We encourage you to have high expectations for the future of
the create restaurants Group.
In recent years, M&As have yielded an increase in the number of
fast-growing operating companies in the create restaurants group.
Our group operating companies have a wide variety of
restaurant formats. Create Kissho operates restaurants that serve
authentic Japanese cuisine prepared by highly trained, skilled
chefs. LE MONDE DES GOURMET operates long-established Italian
restaurants and cafes. SFP Dining operates highly specialized
izakaya. eatwalk operates restaurants that feature vegetables
delivered fresh from the farm. YUNARI operates tsukemen and
ramen noodle shops that always have lines of waiting customers.
Shanghai Bishoku Chusin operates xiaolongbao specialty
restaurants faithfully reproducing the taste of xiaolongbao served
at the original restaurant in Shanghai, the city’s most famous
M&A Activities
Global Expansion
Medium Term Management Plan — VISION 2020
The CR Category consists of outlets operated by create restaurants
inc., one of our subsidiaries, which employs a multi-brand, multi-
location strategy to operate shabu-shabu restaurants, sushi bars,
and various buffet restaurants as well as food courts with crepe,
takoyaki etc., and other outlets, mainly in suburban shopping
centers. Expertise developed from opening restaurants and food
courts in shopping centers in Japan has proven extremely valuable
when we open restaurants overseas.
The SFP Category consists of outlets operated by SFP Dining Co.,
Ltd., which operates izakaya, mainly in busy urban districts. An
Izakaya is the traditional Japanese eating and drinking restaurant,
and there are many izakaya chains. However, a key feature
of the izakaya operated by SFP Dining is a higher degree of
specialization. ISOMARU SUISAN, a chain of seafood izakaya that
are open around the clock, stands out from the competition.
The create restaurant group operates a wide variety of restaurant formats in a range of locations and currently classifies its
operations into four main categories.
Business Development: Four Brand Categories
The Company has engaged in overseas operations since 2009.
We operate restaurants in shopping centers, mainly specialty
restaurants devoted to shabu-shabu and Japanese food using
maccha (powdered green tea). We currently operate restaurants
in the megacities of Singapore, Shanghai, and Hong Kong. Also,
our first store in Taiwan opened in March 2015. In addition to the
ASEAN and Greater China regions, we are considering expansion
into North America. In this regard, we established a wholly owned
subsidiary in New York in March 2016.
shabu-shabu and traditional “kaiseki” course dishes, restaurants
operated by LE MONDE DES GOURMET that serve authentic
Italian food, restaurants operated by eatwalk that feature farm-
fresh vegetables, tsukemen and ramen noodle restaurants
operated by YUNARI, xiaolongbao specialty restaurants operated
by Shanghai Bishoku Chushin (99.97% owned by the Company),
Japanese restaurant chains operated by KR FOOD SERVICE, which
joined the Group in June 2015, and a restaurant at Tokyo Disney
Resort as well as other restaurants operated by RC Japan Co., Ltd.,
which joined the Group in August 2015. Each of these operating
companies benefits from extremely strong brand power. This
category has high growth potential for which the opening of new
restaurants in Japan and overseas is envisioned.
The Specialty Brands Category consists of stores operated by
the Company’s wholly owned domestic subsidiaries: traditional
Japanese restaurants operated by Create Kissho that serve
CR Category
SFP Category
Specialty Brands Category
Overseas Category
As of February 29, 2016, the create restaurants Group operated
a total of 795 restaurants under 197 brands. We have proactively
implemented a “scrap and build” approach to increase business
efficiency. At the same time, we reorganized the divisional
organizational structure in order to strengthen the platform
function of create restaurants holdings inc. and strove to enhance
store competency of existing restaurants such as quality and service
among other attributes.
The business environment in which the Group operates has
changed dramatically due to the influence of a number of external
and internal factors. Changes in the external environment include
economic recovery fueled by Abenomics, diversification of
customer preferences and lifestyles, heightened awareness of food
safety, and the declining birthrate and aging population. Within
the Group, the number of operating companies has increased as
a result of seven M&A transactions, group expansion has led to
diversification of strategies, corporate cultures, and locations, and
we have begun overseas business expansion.
In this operating environment, recognizing that it is increasingly
difficult to achieve growth based on a single corporate culture and
business strategy, we will continue to promote “Group Federation
Management” to achieve growth as a group under which multiple
operating companies with diverse corporate cultures and distinctive
strategies pursue growth with the aim of enhancing corporate value.
We have announced the medium-term management plan Vision
2020 targeting net sales of 200.0 billion yen for the fiscal year
ending February 29, 2020, three years from now.
FY 2016 Result FY 2017 Forecast FY 2018 Forecast FY 2019 ForecastNet sales (Millions of Yen) 103,271 118,000 150,000 175,000 Ordinary income (Millions of Yen) 7,340 7,900 10,700 13,000 Profit attributable to owners of parent (Millions of Yen) 3,321 4,200 6,100 7,600 EPS (Yen) 35.19 44.5 64.6 80.5ROE (%) 20.3 22.3 24.0 23.3
Number of new restaurants 179 80 80 80Increase via M&A* 109 – – –Number of outlets at the year's end 795 875 955 1,035* Does not take into account the increase in consolidated subsidiaries through M&As in the future.
Medium Term Management Plan (Numeric Target)
06 07create restaurants holdings inc. ANNUAL REPORT 2016
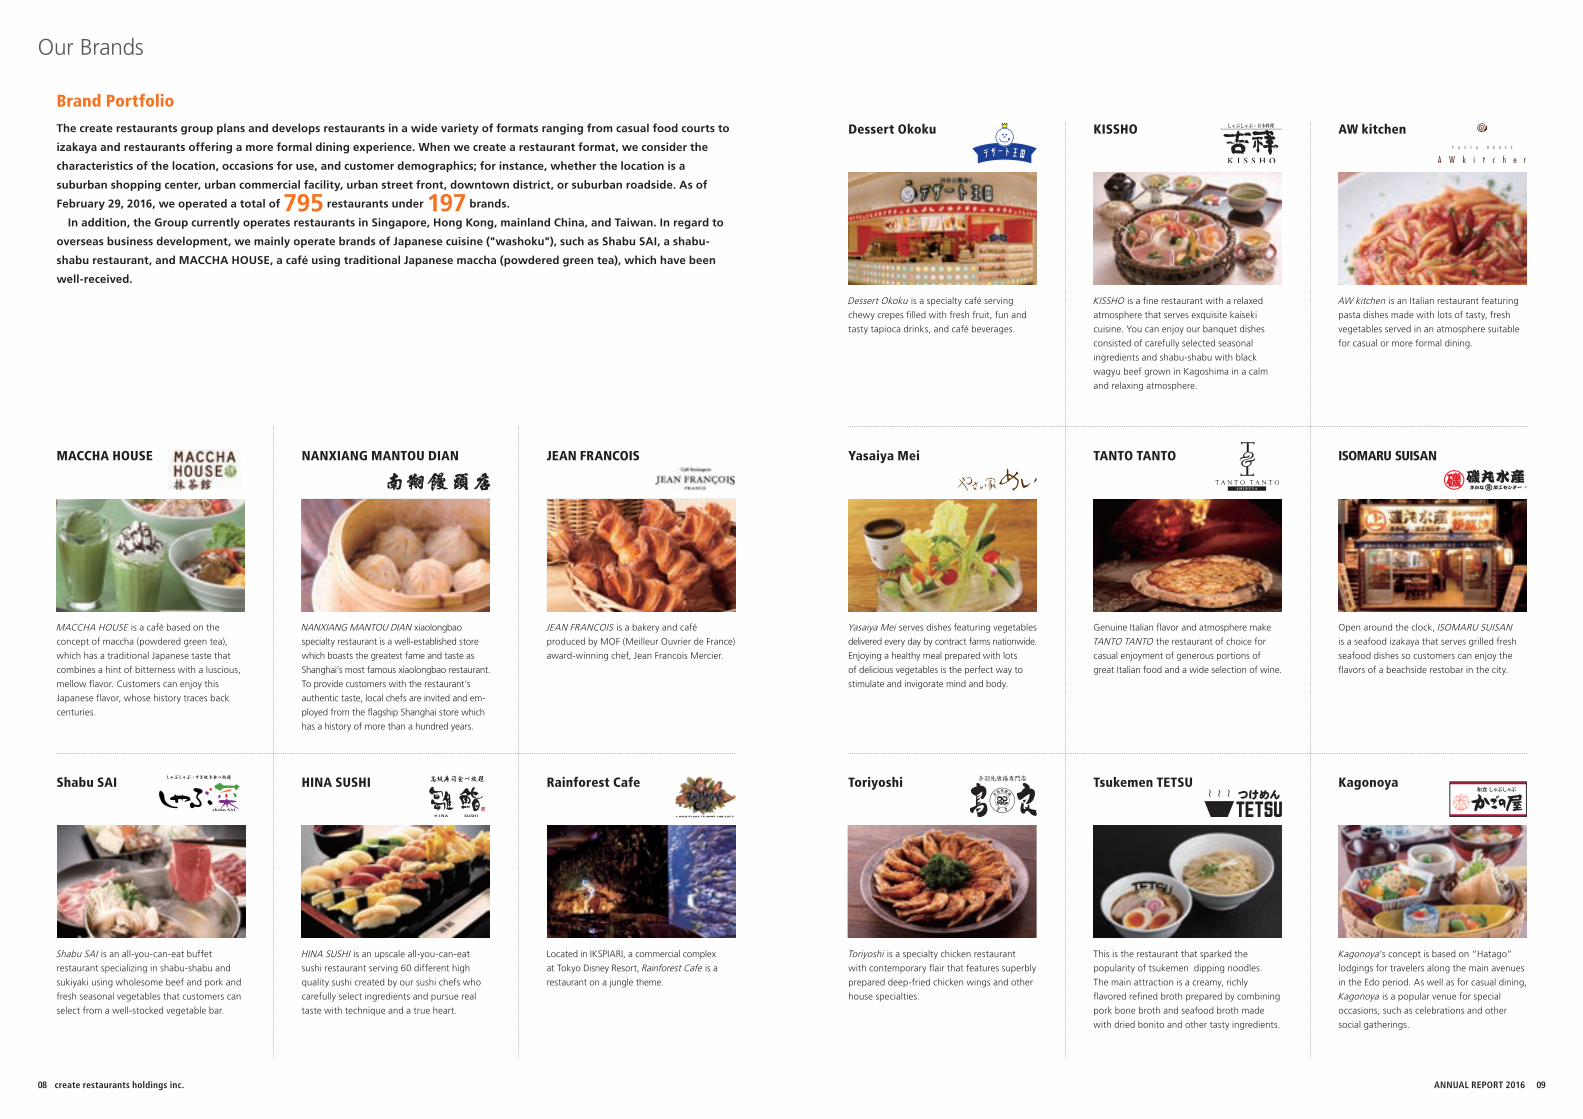
The create restaurants group plans and develops restaurants in a wide variety of formats ranging from casual food courts to
izakaya and restaurants offering a more formal dining experience. When we create a restaurant format, we consider the
characteristics of the location, occasions for use, and customer demographics; for instance, whether the location is a
suburban shopping center, urban commercial facility, urban street front, downtown district, or suburban roadside. As of
February 29, 2016, we operated a total of 795 restaurants under 197 brands.
In addition, the Group currently operates restaurants in Singapore, Hong Kong, mainland China, and Taiwan. In regard to
overseas business development, we mainly operate brands of Japanese cuisine ("washoku"), such as Shabu SAI, a shabu-
shabu restaurant, and MACCHA HOUSE, a café using traditional Japanese maccha (powdered green tea), which have been
well-received.
Shabu SAI is an all-you-can-eat buffet
restaurant specializing in shabu-shabu and
sukiyaki using wholesome beef and pork and
fresh seasonal vegetables that customers can
select from a well-stocked vegetable bar.
Dessert Okoku is a specialty café serving
chewy crepes filled with fresh fruit, fun and
tasty tapioca drinks, and café beverages.
HINA SUSHI is an upscale all-you-can-eat
sushi restaurant serving 60 different high
quality sushi created by our sushi chefs who
carefully select ingredients and pursue real
taste with technique and a true heart.
This is the restaurant that sparked the
popularity of tsukemen dipping noodles.
The main attraction is a creamy, richly
flavored refined broth prepared by combining
pork bone broth and seafood broth made
with dried bonito and other tasty ingredients.
Toriyoshi is a specialty chicken restaurant
with contemporary flair that features superbly
prepared deep-fried chicken wings and other
house specialties.
Shabu SAI
Dessert Okoku
HINA SUSHI Tsukemen TETSUToriyoshi
Our Brands
Brand Portfolio
KISSHO is a fine restaurant with a relaxed
atmosphere that serves exquisite kaiseki
cuisine. You can enjoy our banquet dishes
consisted of carefully selected seasonal
ingredients and shabu-shabu with black
wagyu beef grown in Kagoshima in a calm
and relaxing atmosphere.
KISSHO
AW kitchen is an Italian restaurant featuring
pasta dishes made with lots of tasty, fresh
vegetables served in an atmosphere suitable
for casual or more formal dining.
AW kitchen
Located in IKSPIARI, a commercial complex
at Tokyo Disney Resort, Rainforest Cafe is a
restaurant on a jungle theme.
Rainforest Cafe
Kagonoya’s concept is based on “Hatago”
lodgings for travelers along the main avenues
in the Edo period. As well as for casual dining,
Kagonoya is a popular venue for special
occasions, such as celebrations and other
social gatherings.
Kagonoya
Yasaiya Mei serves dishes featuring vegetables
delivered every day by contract farms nationwide.
Enjoying a healthy meal prepared with lots
of delicious vegetables is the perfect way to
stimulate and invigorate mind and body.
MACCHA HOUSE is a café based on the
concept of maccha (powdered green tea),
which has a traditional Japanese taste that
combines a hint of bitterness with a luscious,
mellow flavor. Customers can enjoy this
Japanese flavor, whose history traces back
centuries.
Yasaiya MeiMACCHA HOUSE
Open around the clock, ISOMARU SUISAN
is a seafood izakaya that serves grilled fresh
seafood dishes so customers can enjoy the
flavors of a beachside restobar in the city.
JEAN FRANCOIS is a bakery and café
produced by MOF (Meilleur Ouvrier de France)
award-winning chef, Jean Francois Mercier.
ISOMARU SUISANJEAN FRANCOIS
Genuine Italian flavor and atmosphere make
TANTO TANTO the restaurant of choice for
casual enjoyment of generous portions of
great Italian food and a wide selection of wine.
NANXIANG MANTOU DIAN xiaolongbao
specialty restaurant is a well-established store
which boasts the greatest fame and taste as
Shanghai’s most famous xiaolongbao restaurant.
To provide customers with the restaurant’s
authentic taste, local chefs are invited and em-
ployed from the flagship Shanghai store which
has a history of more than a hundred years.
TANTO TANTONANXIANG MANTOU DIAN
08 09create restaurants holdings inc. ANNUAL REPORT 2016
The Company is keenly aware of the need for business to fulfill its social responsibility and considers the pursuit of
transparent corporate activities that reflect awareness of compliance to be one of the important tasks of management.
Recognizing that enhancing and maximizing enterprise value is the fundamental objective of corporate governance for
a listed company, the Company is developing a corporate governance structure that enables fair, transparent, prompt
and appropriate management and executive decisions that accord importance to shareholder value and the fulfillment of
corporate responsibility, promoting management efficiency and continuously enhancing enterprise value. For this purpose,
the Company intends to enhance corporate governance by focusing on further enhancing and developing not only the
management structure, but also organizations and systems.
Overview of Corporate Governance
Response to operational risks
Since the Company operates a restaurant business, we recognize
that restaurant sanitation management is an important priority.
Therefore, the Food Safety Promotion Office monitors the status
of sanitation management at all restaurants and is developing a
restaurant sanitation management system by various means, such
as the commissioning of an independent third-party organization
to conduct periodic sanitation audits.
Response to compliance risks
The Company has formed the Compliance Committee, consisting
of the Chief Compliance Officer and a number of compliance
officers, which holds periodic meetings and discusses ad
hoc compliance measures as necessary. The Company is also
developing a system to control compliance risks and has set up
a compliance consultation desk for employees and an internal
whistleblowing hotline to the Company’s legal advisor.
Management of other risks and comprehensive
risk management
The Company places importance on the effectiveness of the
Board of Directors as the Company’s highest body for business
execution. Specifically, the Board of Directors monitors the
accounting figures on the basis of the monthly closing and,
in accordance with the Board of Directors Regulations and
Administrative Authority Regulations, has business divisions
bring before the Board of Directors important matters pertaining
to business execution, obtain resolutions, and implement
those resolutions.
Risk Management Structure
The Company has two Outside Directors, both of whom are Audit
& Supervisory Committee Members and independent officers.
The Outside Directors attend meetings of the Board of
Directors and of the Audit & Supervisory Committee and provide
guidance and recommendations from their respective specialist
perspectives. They also audit and oversee management and
business execution to ensure management transparency and
compliance. In this way, the Company’s corporate governance
is enhanced.
Outside Directors
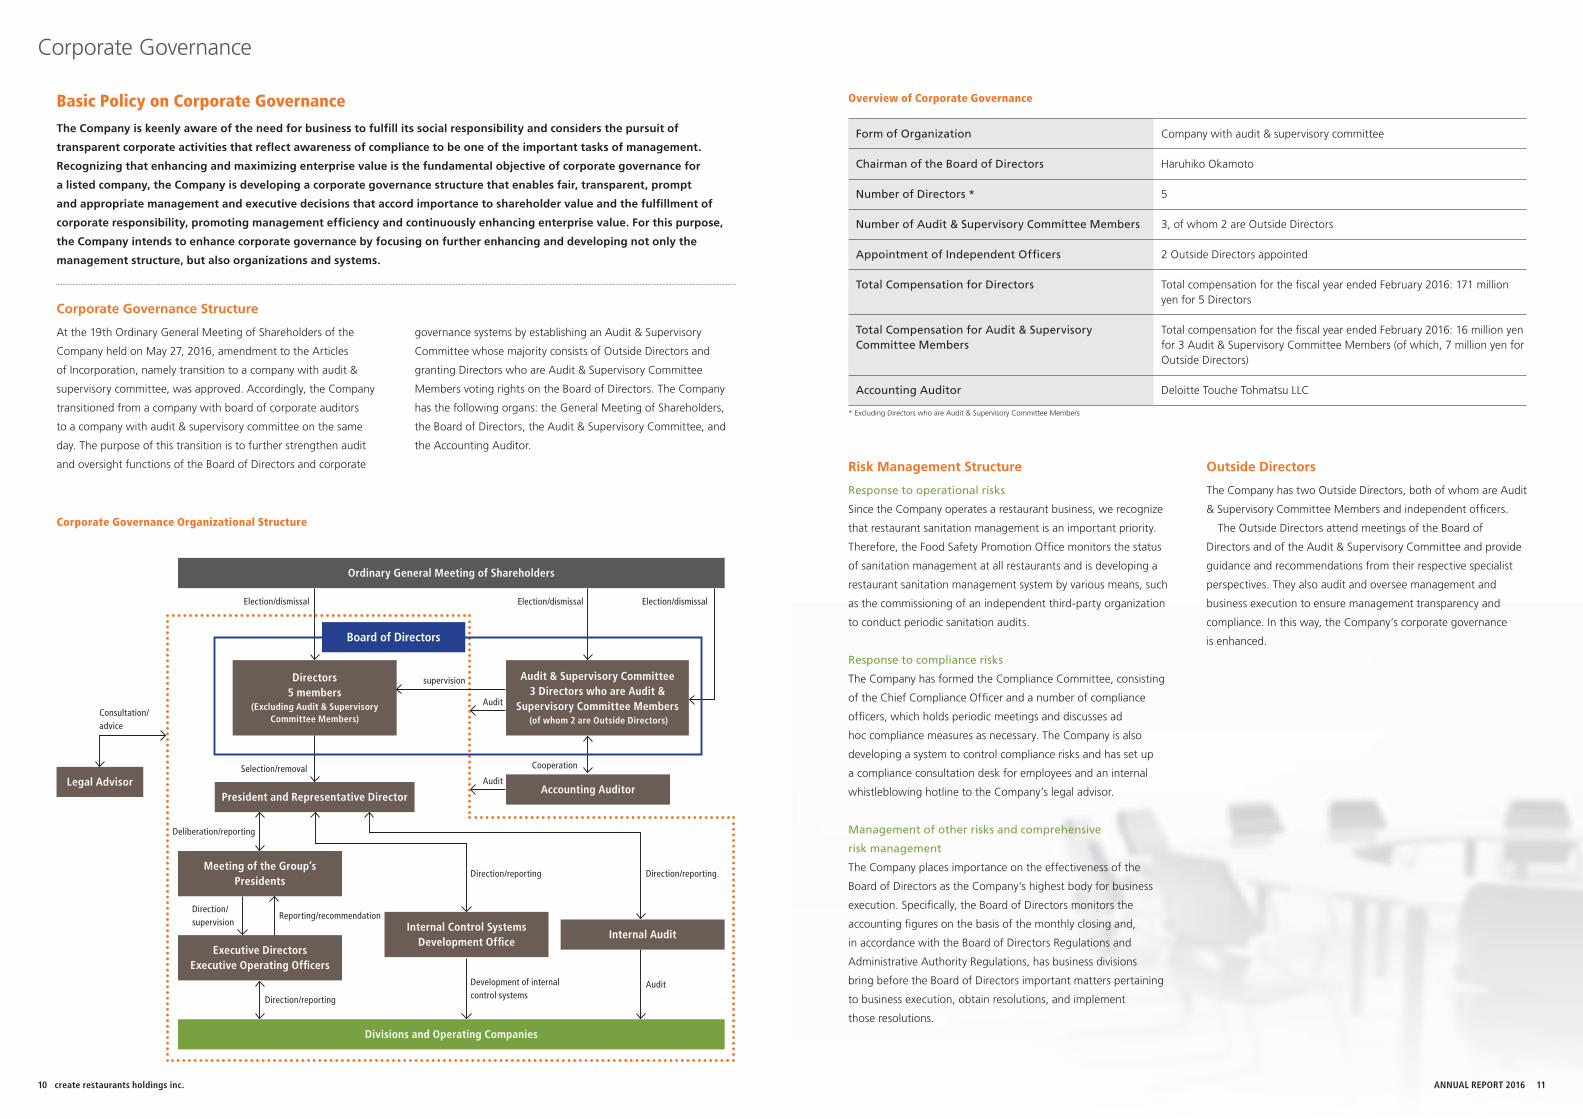
At the 19th Ordinary General Meeting of Shareholders of the
Company held on May 27, 2016, amendment to the Articles
of Incorporation, namely transition to a company with audit &
supervisory committee, was approved. Accordingly, the Company
transitioned from a company with board of corporate auditors
to a company with audit & supervisory committee on the same
day. The purpose of this transition is to further strengthen audit
and oversight functions of the Board of Directors and corporate
Corporate Governance Structure
governance systems by establishing an Audit & Supervisory
Committee whose majority consists of Outside Directors and
granting Directors who are Audit & Supervisory Committee
Members voting rights on the Board of Directors. The Company
has the following organs: the General Meeting of Shareholders,
the Board of Directors, the Audit & Supervisory Committee, and
the Accounting Auditor.
Corporate Governance
Basic Policy on Corporate Governance
Form of Organization Company with audit & supervisory committee
Chairman of the Board of Directors Haruhiko Okamoto
Number of Directors * 5
Number of Audit & Supervisory Committee Members 3, of whom 2 are Outside Directors
Appointment of Independent Officers 2 Outside Directors appointed
Total Compensation for Directors Total compensation for the fiscal year ended February 2016: 171 million yen for 5 Directors
Total Compensation for Audit & Supervisory Committee Members
Total compensation for the fiscal year ended February 2016: 16 million yen for 3 Audit & Supervisory Committee Members (of which, 7 million yen for Outside Directors)
Accounting Auditor Deloitte Touche Tohmatsu LLC
Corporate Governance Organizational Structure
Ordinary General Meeting of Shareholders
Divisions and Operating Companies
Audit & Supervisory Committee3 Directors who are Audit &
Supervisory Committee Members (of whom 2 are Outside Directors)
Directors5 members
(Excluding Audit & Supervisory Committee Members)
Executive DirectorsExecutive Operating Officers
Internal Control Systems Development Office
Accounting AuditorPresident and Representative Director
Legal Advisor
Meeting of the Group’s Presidents
Internal Audit
Election/dismissal
Selection/removal
Consultation/advice
Deliberation/reporting
Direction/supervision
Direction/reporting
Direction/reporting Direction/reporting
Reporting/recommendation
AuditDevelopment of internal control systems
Election/dismissal
Audit
Audit
Cooperation
Election/dismissal
supervision
Board of Directors
* Excluding Directors who are Audit & Supervisory Committee Members
10 11create restaurants holdings inc. ANNUAL REPORT 2016
Management’s Discussion and Analysis
The following is an analysis of the Company’s financial position and operating performance in the consolidated fiscal year
ended February 29, 2016. Forward-looking statements contained herein represent the judgment of the create restaurants
group as of the date of issuance of this annual report.
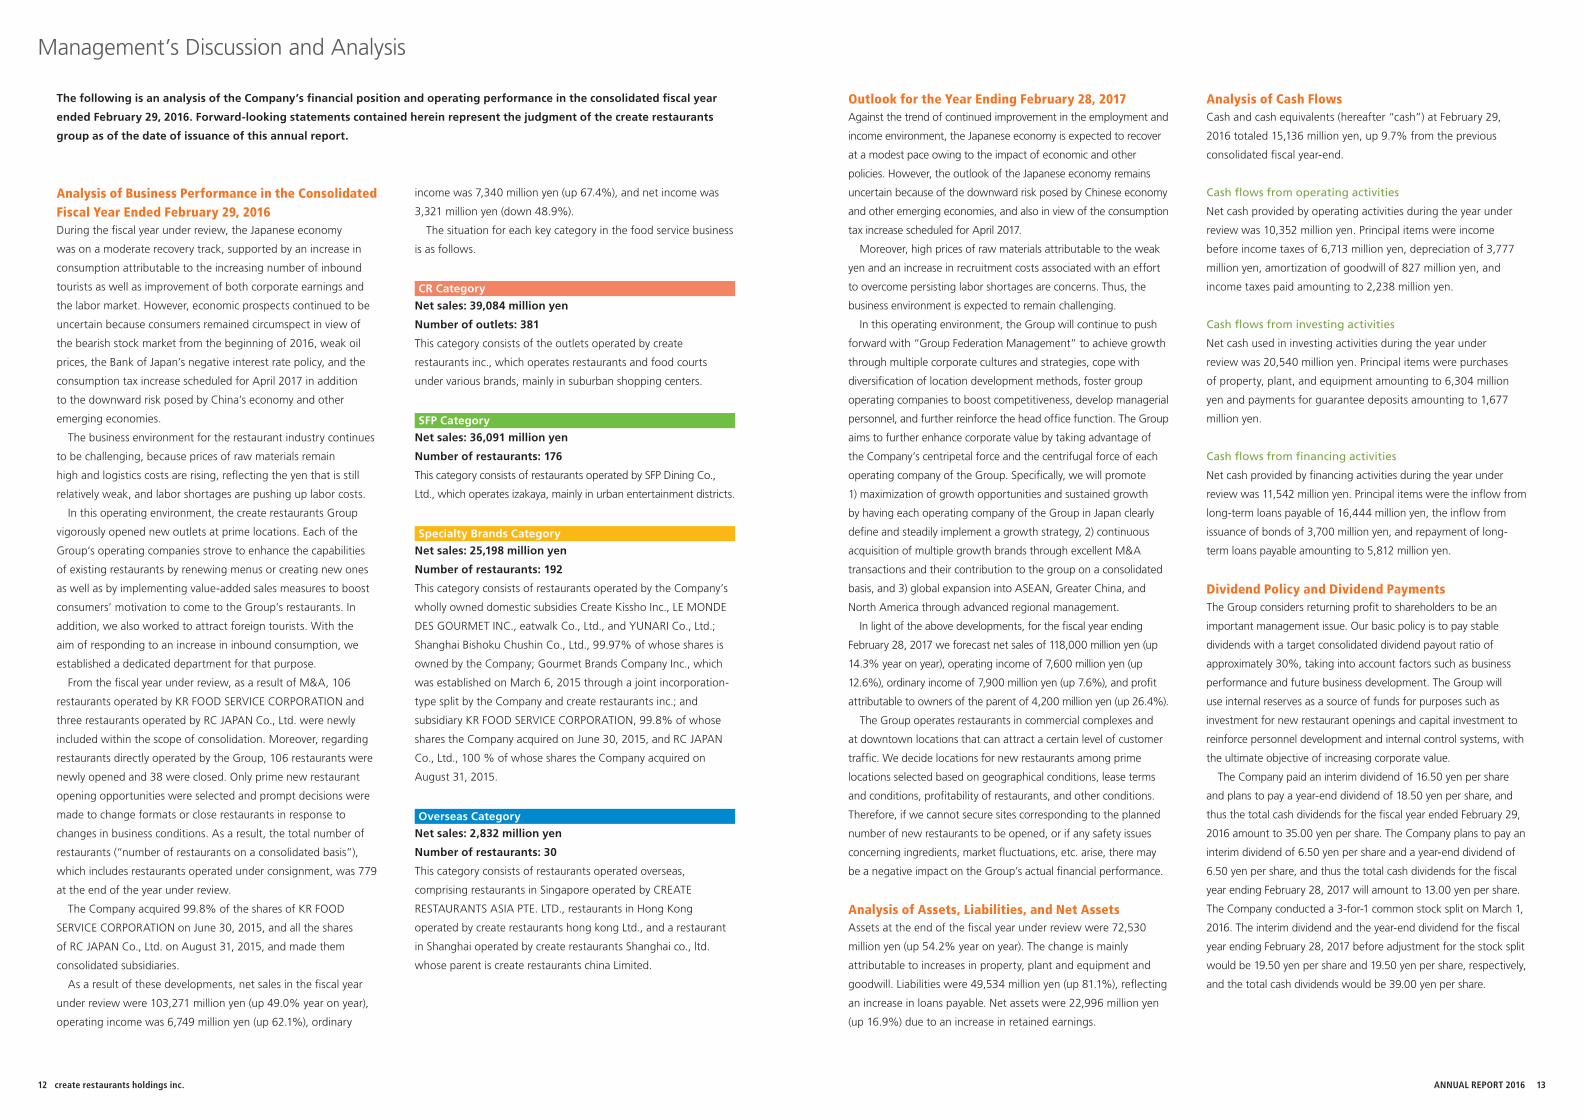
Analysis of Business Performance in the Consolidated Fiscal Year Ended February 29, 2016During the fiscal year under review, the Japanese economy
was on a moderate recovery track, supported by an increase in
consumption attributable to the increasing number of inbound
tourists as well as improvement of both corporate earnings and
the labor market. However, economic prospects continued to be
uncertain because consumers remained circumspect in view of
the bearish stock market from the beginning of 2016, weak oil
prices, the Bank of Japan’s negative interest rate policy, and the
consumption tax increase scheduled for April 2017 in addition
to the downward risk posed by China’s economy and other
emerging economies.
The business environment for the restaurant industry continues
to be challenging, because prices of raw materials remain
high and logistics costs are rising, reflecting the yen that is still
relatively weak, and labor shortages are pushing up labor costs.
In this operating environment, the create restaurants Group
vigorously opened new outlets at prime locations. Each of the
Group’s operating companies strove to enhance the capabilities
of existing restaurants by renewing menus or creating new ones
as well as by implementing value-added sales measures to boost
consumers’ motivation to come to the Group’s restaurants. In
addition, we also worked to attract foreign tourists. With the
aim of responding to an increase in inbound consumption, we
established a dedicated department for that purpose.
From the fiscal year under review, as a result of M&A, 106
restaurants operated by KR FOOD SERVICE CORPORATION and
three restaurants operated by RC JAPAN Co., Ltd. were newly
included within the scope of consolidation. Moreover, regarding
restaurants directly operated by the Group, 106 restaurants were
newly opened and 38 were closed. Only prime new restaurant
opening opportunities were selected and prompt decisions were
made to change formats or close restaurants in response to
changes in business conditions. As a result, the total number of
restaurants (“number of restaurants on a consolidated basis”),
which includes restaurants operated under consignment, was 779
at the end of the year under review.
The Company acquired 99.8% of the shares of KR FOOD
SERVICE CORPORATION on June 30, 2015, and all the shares
of RC JAPAN Co., Ltd. on August 31, 2015, and made them
consolidated subsidiaries.
As a result of these developments, net sales in the fiscal year
under review were 103,271 million yen (up 49.0% year on year),
operating income was 6,749 million yen (up 62.1%), ordinary
income was 7,340 million yen (up 67.4%), and net income was
3,321 million yen (down 48.9%).
The situation for each key category in the food service business
is as follows.
Net sales: 39,084 million yen
Number of outlets: 381
This category consists of the outlets operated by create
restaurants inc., which operates restaurants and food courts
under various brands, mainly in suburban shopping centers.
CR Category
Net sales: 36,091 million yen
Number of restaurants: 176
This category consists of restaurants operated by SFP Dining Co.,
Ltd., which operates izakaya, mainly in urban entertainment districts.
SFP Category
Net sales: 25,198 million yen
Number of restaurants: 192
This category consists of restaurants operated by the Company’s
wholly owned domestic subsidies Create Kissho Inc., LE MONDE
DES GOURMET INC., eatwalk Co., Ltd., and YUNARI Co., Ltd.;
Shanghai Bishoku Chushin Co., Ltd., 99.97% of whose shares is
owned by the Company; Gourmet Brands Company Inc., which
was established on March 6, 2015 through a joint incorporation-
type split by the Company and create restaurants inc.; and
subsidiary KR FOOD SERVICE CORPORATION, 99.8% of whose
shares the Company acquired on June 30, 2015, and RC JAPAN
Co., Ltd., 100 % of whose shares the Company acquired on
August 31, 2015.
Specialty Brands Category
Net sales: 2,832 million yen
Number of restaurants: 30
This category consists of restaurants operated overseas,
comprising restaurants in Singapore operated by CREATE
RESTAURANTS ASIA PTE. LTD., restaurants in Hong Kong
operated by create restaurants hong kong Ltd., and a restaurant
in Shanghai operated by create restaurants Shanghai co., ltd.
whose parent is create restaurants china Limited.
Overseas Category
Outlook for the Year Ending February 28, 2017Against the trend of continued improvement in the employment and
income environment, the Japanese economy is expected to recover
at a modest pace owing to the impact of economic and other
policies. However, the outlook of the Japanese economy remains
uncertain because of the downward risk posed by Chinese economy
and other emerging economies, and also in view of the consumption
tax increase scheduled for April 2017.
Moreover, high prices of raw materials attributable to the weak
yen and an increase in recruitment costs associated with an effort
to overcome persisting labor shortages are concerns. Thus, the
business environment is expected to remain challenging.
In this operating environment, the Group will continue to push
forward with “Group Federation Management” to achieve growth
through multiple corporate cultures and strategies, cope with
diversification of location development methods, foster group
operating companies to boost competitiveness, develop managerial
personnel, and further reinforce the head office function. The Group
aims to further enhance corporate value by taking advantage of
the Company’s centripetal force and the centrifugal force of each
operating company of the Group. Specifically, we will promote
1) maximization of growth opportunities and sustained growth
by having each operating company of the Group in Japan clearly
define and steadily implement a growth strategy, 2) continuous
acquisition of multiple growth brands through excellent M&A
transactions and their contribution to the group on a consolidated
basis, and 3) global expansion into ASEAN, Greater China, and
North America through advanced regional management.
In light of the above developments, for the fiscal year ending
February 28, 2017 we forecast net sales of 118,000 million yen (up
14.3% year on year), operating income of 7,600 million yen (up
12.6%), ordinary income of 7,900 million yen (up 7.6%), and profit
attributable to owners of the parent of 4,200 million yen (up 26.4%).
The Group operates restaurants in commercial complexes and
at downtown locations that can attract a certain level of customer
traffic. We decide locations for new restaurants among prime
locations selected based on geographical conditions, lease terms
and conditions, profitability of restaurants, and other conditions.
Therefore, if we cannot secure sites corresponding to the planned
number of new restaurants to be opened, or if any safety issues
concerning ingredients, market fluctuations, etc. arise, there may
be a negative impact on the Group’s actual financial performance.
Analysis of Assets, Liabilities, and Net AssetsAssets at the end of the fiscal year under review were 72,530
million yen (up 54.2% year on year). The change is mainly
attributable to increases in property, plant and equipment and
goodwill. Liabilities were 49,534 million yen (up 81.1%), reflecting
an increase in loans payable. Net assets were 22,996 million yen
(up 16.9%) due to an increase in retained earnings.
Analysis of Cash FlowsCash and cash equivalents (hereafter “cash”) at February 29,
2016 totaled 15,136 million yen, up 9.7% from the previous
consolidated fiscal year-end.
Cash flows from operating activities
Net cash provided by operating activities during the year under
review was 10,352 million yen. Principal items were income
before income taxes of 6,713 million yen, depreciation of 3,777
million yen, amortization of goodwill of 827 million yen, and
income taxes paid amounting to 2,238 million yen.
Cash flows from investing activities
Net cash used in investing activities during the year under
review was 20,540 million yen. Principal items were purchases
of property, plant, and equipment amounting to 6,304 million
yen and payments for guarantee deposits amounting to 1,677
million yen.
Cash flows from financing activities
Net cash provided by financing activities during the year under
review was 11,542 million yen. Principal items were the inflow from
long-term loans payable of 16,444 million yen, the inflow from
issuance of bonds of 3,700 million yen, and repayment of long-
term loans payable amounting to 5,812 million yen.
Dividend Policy and Dividend PaymentsThe Group considers returning profit to shareholders to be an
important management issue. Our basic policy is to pay stable
dividends with a target consolidated dividend payout ratio of
approximately 30%, taking into account factors such as business
performance and future business development. The Group will
use internal reserves as a source of funds for purposes such as
investment for new restaurant openings and capital investment to
reinforce personnel development and internal control systems, with
the ultimate objective of increasing corporate value.
The Company paid an interim dividend of 16.50 yen per share
and plans to pay a year-end dividend of 18.50 yen per share, and
thus the total cash dividends for the fiscal year ended February 29,
2016 amount to 35.00 yen per share. The Company plans to pay an
interim dividend of 6.50 yen per share and a year-end dividend of
6.50 yen per share, and thus the total cash dividends for the fiscal
year ending February 28, 2017 will amount to 13.00 yen per share.
The Company conducted a 3-for-1 common stock split on March 1,
2016. The interim dividend and the year-end dividend for the fiscal
year ending February 28, 2017 before adjustment for the stock split
would be 19.50 yen per share and 19.50 yen per share, respectively,
and the total cash dividends would be 39.00 yen per share.
12 13create restaurants holdings inc. ANNUAL REPORT 2016
Consolidated Financial Statements
Millions of YenThousands ofU.S. Dollars
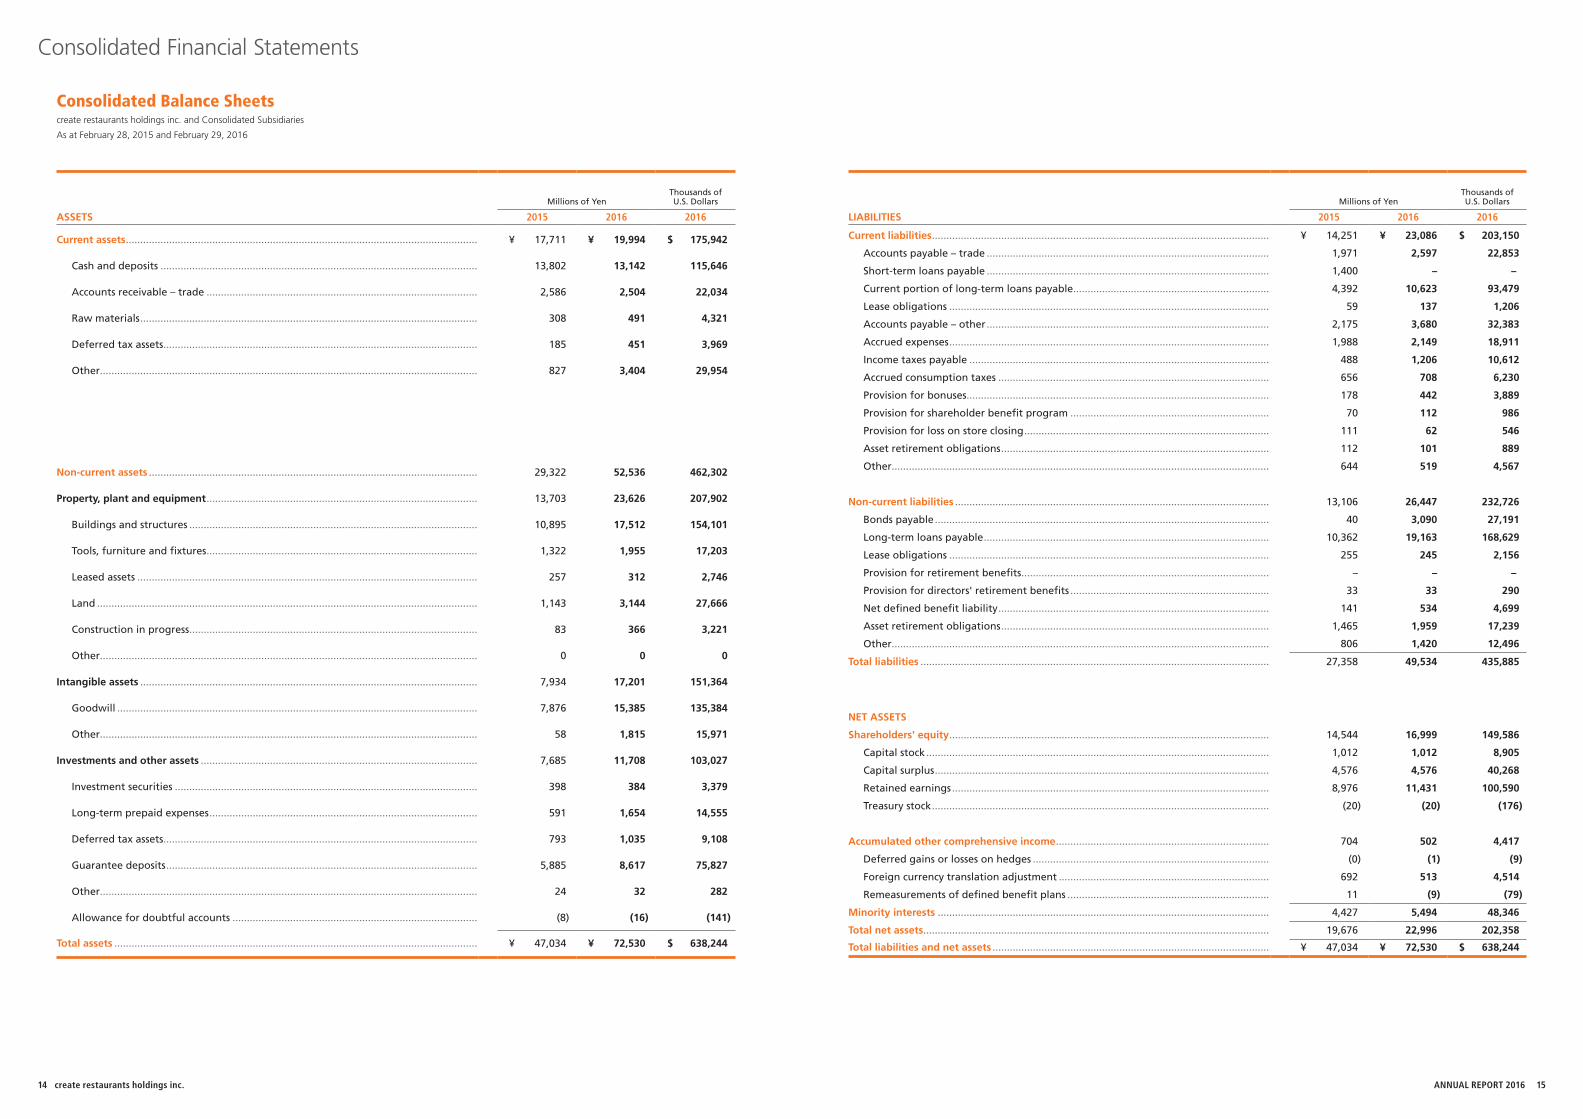
ASSETS 2015 2016 2016
Current assets .......................................................................................................................... ¥ 17,711 ¥ 19,994 $ 175,942
Cash and deposits .............................................................................................................. 13,802 13,142 115,646
Accounts receivable – trade .............................................................................................. 2,586 2,504 22,034
Raw materials ..................................................................................................................... 308 491 4,321
Deferred tax assets............................................................................................................. 185 451 3,969
Other................................................................................................................................... 827 3,404 29,954
Non-current assets .................................................................................................................. 29,322 52,536 462,302
Property, plant and equipment .............................................................................................. 13,703 23,626 207,902
Buildings and structures .................................................................................................... 10,895 17,512 154,101
Tools, furniture and fixtures .............................................................................................. 1,322 1,955 17,203
Leased assets ...................................................................................................................... 257 312 2,746
Land .................................................................................................................................... 1,143 3,144 27,666
Construction in progress.................................................................................................... 83 366 3,221
Other................................................................................................................................... 0 0 0
Intangible assets ..................................................................................................................... 7,934 17,201 151,364
Goodwill ............................................................................................................................. 7,876 15,385 135,384
Other................................................................................................................................... 58 1,815 15,971
Investments and other assets ................................................................................................ 7,685 11,708 103,027
Investment securities ......................................................................................................... 398 384 3,379
Long-term prepaid expenses ............................................................................................. 591 1,654 14,555
Deferred tax assets............................................................................................................. 793 1,035 9,108
Guarantee deposits ............................................................................................................ 5,885 8,617 75,827
Other................................................................................................................................... 24 32 282
Allowance for doubtful accounts ..................................................................................... (8) (16) (141)
Total assets .............................................................................................................................. ¥ 47,034 ¥ 72,530 $ 638,244
Millions of YenThousands ofU.S. Dollars
LIABILITIES 2015 2016 2016
Current liabilities ..................................................................................................................... ¥ 14,251 ¥ 23,086 $ 203,150
Accounts payable – trade .................................................................................................. 1,971 2,597 22,853
Short-term loans payable .................................................................................................. 1,400 – –
Current portion of long-term loans payable .................................................................... 4,392 10,623 93,479
Lease obligations ............................................................................................................... 59 137 1,206
Accounts payable – other .................................................................................................. 2,175 3,680 32,383
Accrued expenses ............................................................................................................... 1,988 2,149 18,911
Income taxes payable ........................................................................................................ 488 1,206 10,612
Accrued consumption taxes .............................................................................................. 656 708 6,230
Provision for bonuses......................................................................................................... 178 442 3,889
Provision for shareholder benefit program ..................................................................... 70 112 986
Provision for loss on store closing ..................................................................................... 111 62 546
Asset retirement obligations ............................................................................................. 112 101 889
Other................................................................................................................................... 644 519 4,567
Non-current liabilities ............................................................................................................. 13,106 26,447 232,726
Bonds payable .................................................................................................................... 40 3,090 27,191
Long-term loans payable ................................................................................................... 10,362 19,163 168,629
Lease obligations ............................................................................................................... 255 245 2,156
Provision for retirement benefits...................................................................................... – – –
Provision for directors' retirement benefits ..................................................................... 33 33 290
Net defined benefit liability .............................................................................................. 141 534 4,699
Asset retirement obligations ............................................................................................. 1,465 1,959 17,239
Other................................................................................................................................... 806 1,420 12,496
Total liabilities ......................................................................................................................... 27,358 49,534 435,885
NET ASSETS
Shareholders' equity ............................................................................................................... 14,544 16,999 149,586
Capital stock ....................................................................................................................... 1,012 1,012 8,905
Capital surplus .................................................................................................................... 4,576 4,576 40,268
Retained earnings .............................................................................................................. 8,976 11,431 100,590
Treasury stock ..................................................................................................................... (20) (20) (176)
Accumulated other comprehensive income .......................................................................... 704 502 4,417
Deferred gains or losses on hedges .................................................................................. (0) (1) (9)
Foreign currency translation adjustment ......................................................................... 692 513 4,514
Remeasurements of defined benefit plans ...................................................................... 11 (9) (79)
Minority interests ................................................................................................................... 4,427 5,494 48,346
Total net assets ........................................................................................................................ 19,676 22,996 202,358
Total liabilities and net assets ................................................................................................ ¥ 47,034 ¥ 72,530 $ 638,244
Consolidated Balance Sheetscreate restaurants holdings inc. and Consolidated Subsidiaries
As at February 28, 2015 and February 29, 2016
14 15create restaurants holdings inc. ANNUAL REPORT 2016
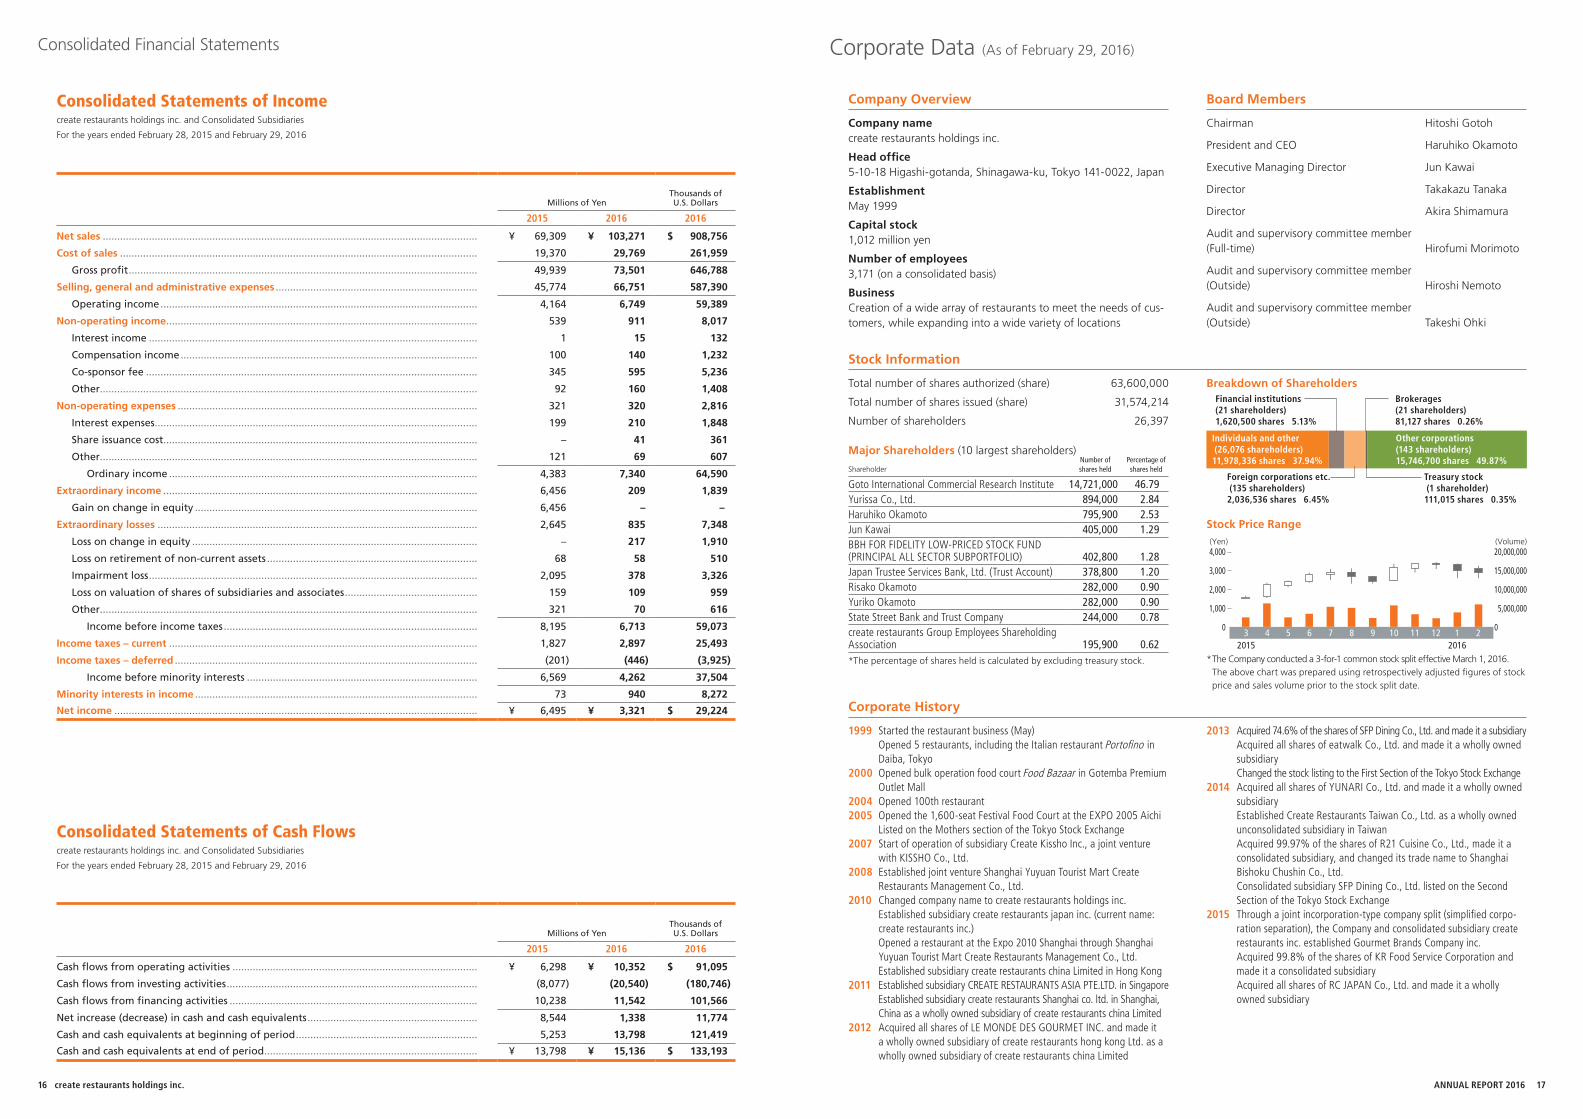
Company Overview
Company namecreate restaurants holdings inc.
Head office5-10-18 Higashi-gotanda, Shinagawa-ku, Tokyo 141-0022, Japan
EstablishmentMay 1999
Capital stock1,012 million yen
Number of employees3,171 (on a consolidated basis)
BusinessCreation of a wide array of restaurants to meet the needs of cus-tomers, while expanding into a wide variety of locations
Corporate History
Started the restaurant business (May)Opened 5 restaurants, including the Italian restaurant Portofino in Daiba, TokyoOpened bulk operation food court Food Bazaar in Gotemba Premium Outlet MallOpened 100th restaurantOpened the 1,600-seat Festival Food Court at the EXPO 2005 AichiListed on the Mothers section of the Tokyo Stock Exchange Start of operation of subsidiary Create Kissho Inc., a joint venture with KISSHO Co., Ltd.Established joint venture Shanghai Yuyuan Tourist Mart Create Restaurants Management Co., Ltd.Changed company name to create restaurants holdings inc.Established subsidiary create restaurants japan inc. (current name: create restaurants inc.)Opened a restaurant at the Expo 2010 Shanghai through Shanghai Yuyuan Tourist Mart Create Restaurants Management Co., Ltd.Established subsidiary create restaurants china Limited in Hong KongEstablished subsidiary CREATE RESTAURANTS ASIA PTE.LTD. in SingaporeEstablished subsidiary create restaurants Shanghai co. ltd. in Shanghai, China as a wholly owned subsidiary of create restaurants china LimitedAcquired all shares of LE MONDE DES GOURMET INC. and made it a wholly owned subsidiary of create restaurants hong kong Ltd. as a wholly owned subsidiary of create restaurants china Limited
Acquired 74.6% of the shares of SFP Dining Co., Ltd. and made it a subsidiaryAcquired all shares of eatwalk Co., Ltd. and made it a wholly owned subsidiaryChanged the stock listing to the First Section of the Tokyo Stock ExchangeAcquired all shares of YUNARI Co., Ltd. and made it a wholly owned subsidiary Established Create Restaurants Taiwan Co., Ltd. as a wholly owned unconsolidated subsidiary in Taiwan Acquired 99.97% of the shares of R21 Cuisine Co., Ltd., made it a consolidated subsidiary, and changed its trade name to Shanghai Bishoku Chushin Co., Ltd.Consolidated subsidiary SFP Dining Co., Ltd. listed on the Second Section of the Tokyo Stock Exchange Through a joint incorporation-type company split (simplified corpo-ration separation), the Company and consolidated subsidiary create restaurants inc. established Gourmet Brands Company inc.Acquired 99.8% of the shares of KR Food Service Corporation and made it a consolidated subsidiaryAcquired all shares of RC JAPAN Co., Ltd. and made it a wholly owned subsidiary
1999
2000
20042005
2007
2008
2010
2011
2012
2013
2014
2015
Board Members
Chairman Hitoshi Gotoh
President and CEO Haruhiko Okamoto
Executive Managing Director Jun Kawai
Director Takakazu Tanaka
Director Akira Shimamura
Audit and supervisory committee member (Full-time) Hirofumi Morimoto
Audit and supervisory committee member (Outside) Hiroshi Nemoto
Audit and supervisory committee member (Outside) Takeshi Ohki
Consolidated Financial Statements Corporate Data (As of February 29, 2016)
Millions of YenThousands ofU.S. Dollars
2015 2016 2016
Cash flows from operating activities ..................................................................................... ¥ 6,298 ¥ 10,352 $ 91,095
Cash flows from investing activities ....................................................................................... (8,077) (20,540) (180,746)
Cash flows from financing activities ...................................................................................... 10,238 11,542 101,566
Net increase (decrease) in cash and cash equivalents ........................................................... 8,544 1,338 11,774
Cash and cash equivalents at beginning of period ............................................................... 5,253 13,798 121,419
Cash and cash equivalents at end of period .......................................................................... ¥ 13,798 ¥ 15,136 $ 133,193
Consolidated Statements of Cash Flowscreate restaurants holdings inc. and Consolidated Subsidiaries
For the years ended February 28, 2015 and February 29, 2016
Millions of YenThousands ofU.S. Dollars
2015 2016 2016
Net sales .................................................................................................................................. ¥ 69,309 ¥ 103,271 $ 908,756
Cost of sales ............................................................................................................................ 19,370 29,769 261,959
Gross profit ......................................................................................................................... 49,939 73,501 646,788
Selling, general and administrative expenses ...................................................................... 45,774 66,751 587,390
Operating income .............................................................................................................. 4,164 6,749 59,389
Non-operating income ............................................................................................................ 539 911 8,017
Interest income .................................................................................................................. 1 15 132
Compensation income ....................................................................................................... 100 140 1,232
Co-sponsor fee ................................................................................................................... 345 595 5,236
Other................................................................................................................................... 92 160 1,408
Non-operating expenses ........................................................................................................ 321 320 2,816
Interest expenses................................................................................................................ 199 210 1,848
Share issuance cost............................................................................................................. – 41 361
Other................................................................................................................................... 121 69 607
Ordinary income ........................................................................................................... 4,383 7,340 64,590
Extraordinary income ............................................................................................................. 6,456 209 1,839
Gain on change in equity .................................................................................................. 6,456 – –
Extraordinary losses ............................................................................................................... 2,645 835 7,348
Loss on change in equity ................................................................................................... – 217 1,910
Loss on retirement of non-current assets ......................................................................... 68 58 510
Impairment loss .................................................................................................................. 2,095 378 3,326
Loss on valuation of shares of subsidiaries and associates .............................................. 159 109 959
Other................................................................................................................................... 321 70 616
Income before income taxes ........................................................................................ 8,195 6,713 59,073
Income taxes – current ........................................................................................................... 1,827 2,897 25,493
Income taxes – deferred ......................................................................................................... (201) (446) (3,925)
Income before minority interests ................................................................................ 6,569 4,262 37,504
Minority interests in income .................................................................................................. 73 940 8,272
Net income .............................................................................................................................. ¥ 6,495 ¥ 3,321 $ 29,224
Consolidated Statements of Incomecreate restaurants holdings inc. and Consolidated Subsidiaries
For the years ended February 28, 2015 and February 29, 2016
Stock Information
Total number of shares authorized (share) 63,600,000
Total number of shares issued (share) 31,574,214
Number of shareholders 26,397
*The percentage of shares held is calculated by excluding treasury stock.
Major Shareholders (10 largest shareholders)
ShareholderNumber ofshares held
Percentage of shares held
Goto International Commercial Research Institute 14,721,000 46.79Yurissa Co., Ltd. 894,000 2.84Haruhiko Okamoto 795,900 2.53Jun Kawai 405,000 1.29BBH FOR FIDELITY LOW-PRICED STOCK FUND (PRINCIPAL ALL SECTOR SUBPORTFOLIO) 402,800 1.28Japan Trustee Services Bank, Ltd. (Trust Account) 378,800 1.20Risako Okamoto 282,000 0.90Yuriko Okamoto 282,000 0.90State Street Bank and Trust Company 244,000 0.78create restaurants Group Employees Shareholding Association 195,900 0.62
Breakdown of Shareholders
Individuals and other (26,076 shareholders)11,978,336 shares 37.94%
Financial institutions (21 shareholders)1,620,500 shares 5.13%
Foreign corporations etc. (135 shareholders)2,036,536 shares 6.45%
Other corporations (143 shareholders)15,746,700 shares 49.87%
Brokerages (21 shareholders)81,127 shares 0.26%
Treasury stock (1 shareholder)111,015 shares 0.35%
Stock Price Range
32015
4 5 6 7 8 9 10 11 12 12016
2
4,000 20,000,000
3,000 15,000,000
(Yen) (Volume)
1,000 5,000,000
2,000 10,000,000
0 0
* The Company conducted a 3-for-1 common stock split effective March 1, 2016. The above chart was prepared using retrospectively adjusted figures of stock
price and sales volume prior to the stock split date.
16 17create restaurants holdings inc. ANNUAL REPORT 2016

5-10-18 Higashigotanda, Shinagawa-ku, Tokyo 141-0022, Japan
Tel. +81-3-5488-8001
http://www.createrestaurants.com
Recommended