Beyond Null Hypothesis Testing
Supplementary Statistical Techniques
PSYC 6130, PROF. J. ELDER 2
Limitations of NHT
• Criticisms of NHT date from the 1930s.
– Null hypothesis is rarely true.
– The real question is not about the existence of an effect, but about the nature of the effect:
• What is the direction of the effect?
• What is the size of the effect?
• How important is it?
• What are the underlying mechanisms (theory)?
PSYC 6130, PROF. J. ELDER 3
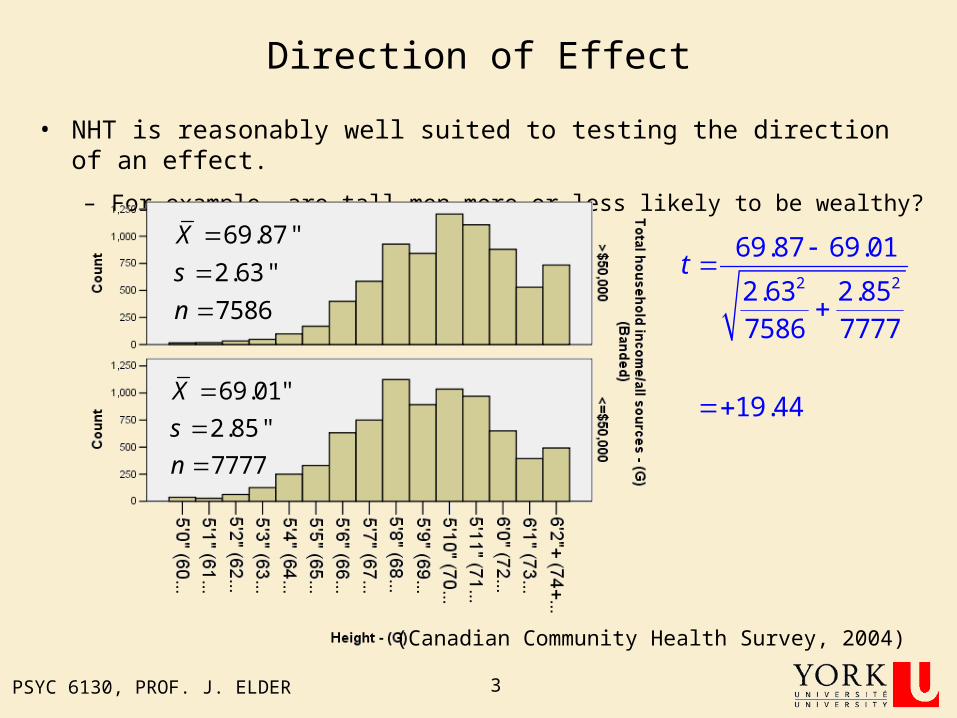
Direction of Effect
• NHT is reasonably well suited to testing the direction of an effect.
– For example, are tall men more or less likely to be wealthy?
2 2
69.87 69.01
2.63 2.857586 7777
19.44
t
69.01"
2.85"
7777
X
s
n
69.87"
2.63"
7586
X
s
n
(Canadian Community Health Survey, 2004)
PSYC 6130, PROF. J. ELDER 4
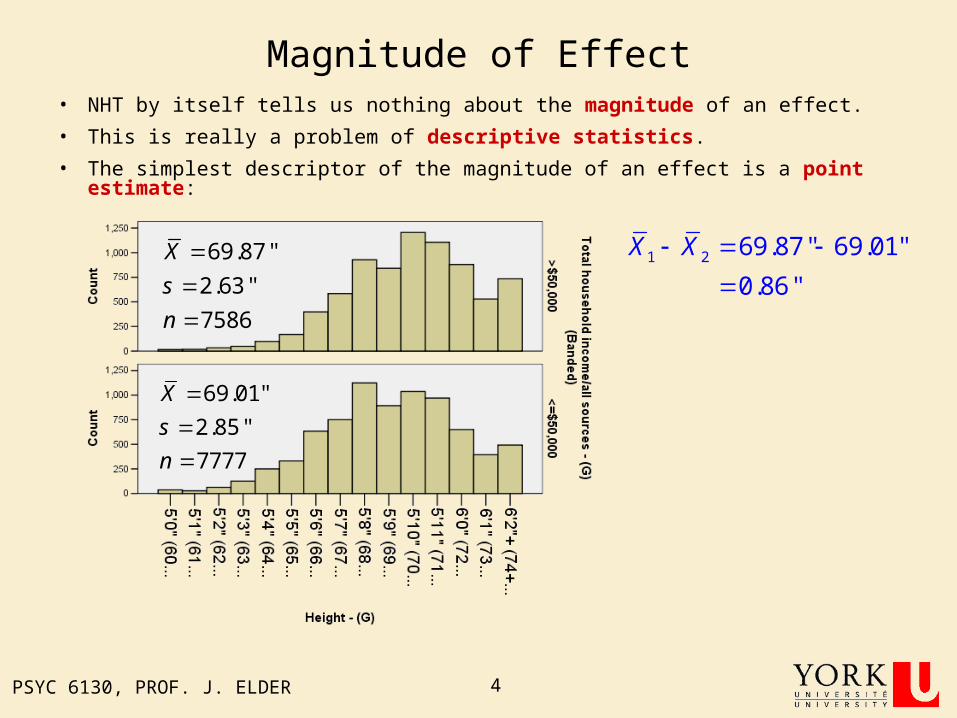
Magnitude of Effect• NHT by itself tells us nothing about the magnitude of an effect.
• This is really a problem of descriptive statistics.
• The simplest descriptor of the magnitude of an effect is a point estimate:
69.01"
2.85"
7777
X
s
n
69.87"
2.63"
7586
X
s
n
1 2 69.87" 69.01"
0.86"
X X

PSYC 6130, PROF. J. ELDER 5
Magnitude of Effect• A problem with a point estimate is that it suggests a certainty we do not really have.
• A more complete and useful description of the magnitude of the effect is provided by a confidence interval.
69.01"
2.85"
7777
X
s
n
69.87"
2.63"
7586
X
s
n
1 2
2 22.63 2.85e.g., s 0.044"
7586 7777X X
1 2 1 2
1 2
1 2 .05 1 2 .05
The 95% confidence interval for -
,X X X X
X X z s X X z s
0.86" 1.96 0.044",0.86" 1.96 0.044"
[0.77",0.95"]
PSYC 6130, PROF. J. ELDER 6
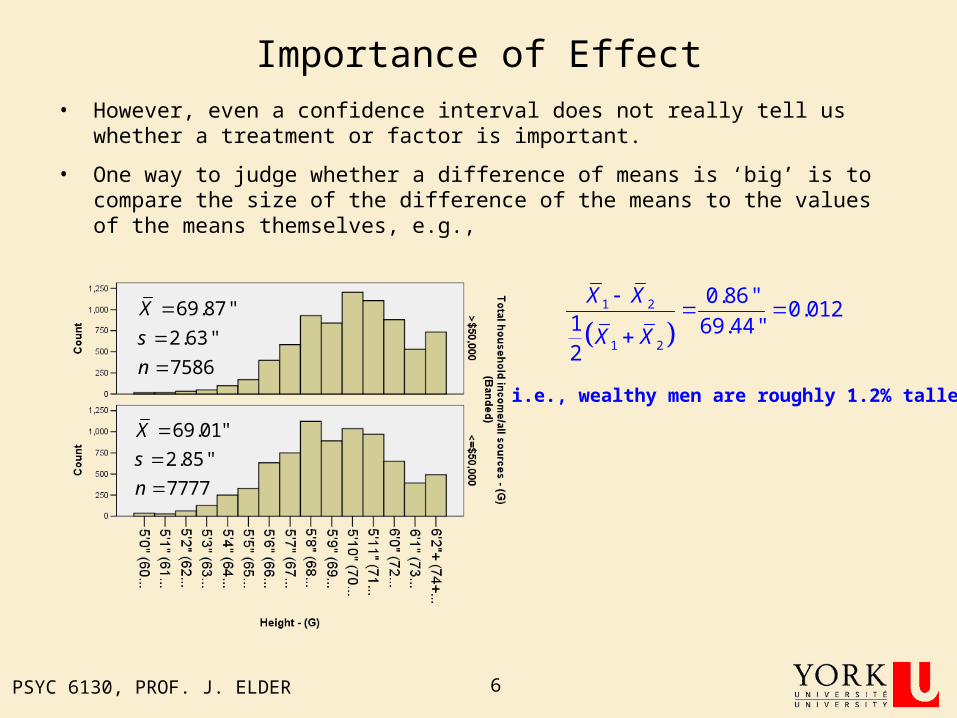
Importance of Effect• However, even a confidence interval does not really tell us whether a treatment or
factor is important.
• One way to judge whether a difference of means is ‘big’ is to compare the size of the difference of the means to the values of the means themselves, e.g.,
69.01"
2.85"
7777
X
s
n
69.87"
2.63"
7586
X
s
n
1 2
1 2
0.86"0.012
1 69.44"2
X X
X X
i.e., wealthy men are roughly 1.2% taller.
PSYC 6130, PROF. J. ELDER 7
Importance of Effect
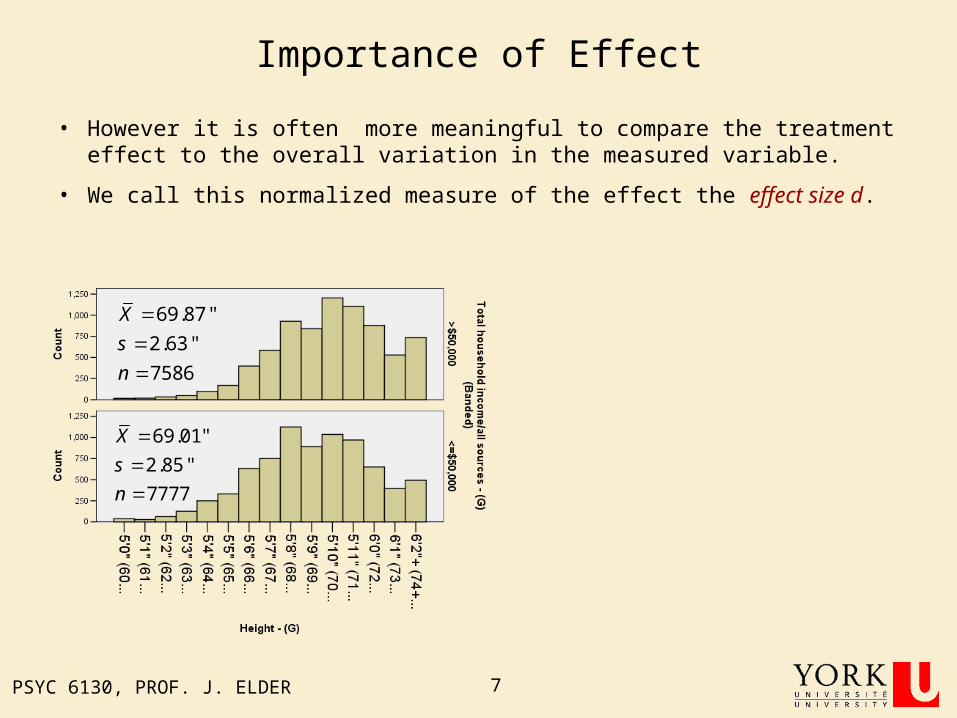
• However it is often more meaningful to compare the treatment effect to the overall variation in the measured variable.
• We call this normalized measure of the effect the effect size d.
69.01"
2.85"
7777
X
s
n
69.87"
2.63"
7586
X
s
n
PSYC 6130, PROF. J. ELDER 8
Importance of Effect
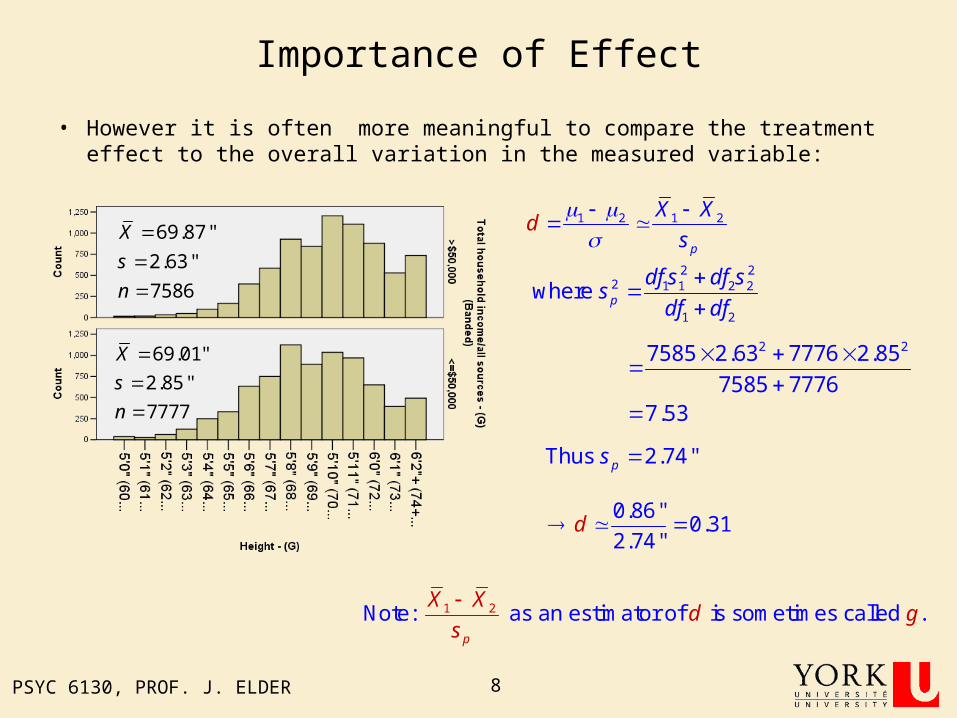
• However it is often more meaningful to compare the treatment effect to the overall variation in the measured variable:
69.01"
2.85"
7777
X
s
n
69.87"
2.63"
7586
X
s
n
1 2 1 2
p
X X
sd
2 22 1 1 2 2
1 2
where p
df s df ss
df df
0.86"0.31
2.74"d
1 2Note: as an estimator of is sometimes called .p
X Xd g
s
2 27585 2.63 7776 2.85
7585 77767.53
Thus 2.74"ps

PSYC 6130, PROF. J. ELDER 9
Example Effect Sizes
-5 0 50
0.2
0.4
d=.5-5 0 50
0.2
0.4
d=1
-5 0 50
0.2
0.4
d=2-5 0 50
0.2
0.4
d=4
Group 1
Group 2

PSYC 6130, PROF. J. ELDER 10
Importance of Effect
• d provides a sense of how much of the variation in the dependent variable is due to the ‘treatment’.
69.01"
2.85"
7777
X
s
n
69.87"
2.63"
7586
X
s
n
is related to the point-biserial coefficient .pbd r
2 measures the proportion of variance in the due to the trsampl eatme ent.pbr
2 2is an estimator of , the proportion of va populat riance in the due to the treation ment:pbr
We will cover these topics later in the term.
22
2 4
d
d
End of Lecture 6
Oct 22, 2008
PSYC 6130, PROF. J. ELDER 12
Theory
• Even when augmented with measures of effect size, NHT does not directly tell us about the mechanism by which the treatment impacts the dependent variable.
• e.g., Wealthy men are taller because…– Tall men attract wealthy women?
– Wealthy men come from wealthy families that provided better care (e.g., nutrition).
• To understand these relationships, it is not enough to test the significance of and quantify effects.
• Ultimately, we require detailed, mechanistic (causal), testable theories, and experiments that test these theories.
• These theories should generate quantitative predictions, that can be compared against experimental outcomes.
• The theory that provides the closest quantiative account of the data should be considered our current ‘working hypothesis’ about how the system under study operates.
• When comparing theories, we must beware of “Occam’s Razor”.
• This process is less dependent on NHT, and more dependent upon model fitting, analysis of variance and cross-validation techniques.
Planning Experiments: Statistical Power

PSYC 6130, PROF. J. ELDER 14
Planning a Study
• There are many considerations that go into planning an experiment or study.
• Here we focus on the statistical considerations.
• Some possible questions:
– How many samples (e.g., subjects) will I need for my study?
– I already know that I will only have access to n samples (subjects). Will this be enough?
• Answering these questions depends on understanding the relationship between sample size, effect size, and statistical power.

PSYC 6130, PROF. J. ELDER 15
Sample Size and Effect Size Codetermine Power
Sample size n
Power 1
Effect Size d
+
+

PSYC 6130, PROF. J. ELDER 16
Statistical Power
• Power is defined as the complement of the Type II error rate.
• Thus understanding power means understanding Type II errors.

PSYC 6130, PROF. J. ELDER 17
Type I Errors and the Null Hypothesis Distribution (NHD)
• To understand Type I errors, we considered the situation where the null hypothesis is true, and modeled the null hypothesis distribution.
/2t
( )p t
0/2t
1 2
1 2
X X
X Xt
s

PSYC 6130, PROF. J. ELDER 18
Understanding Type II Errors
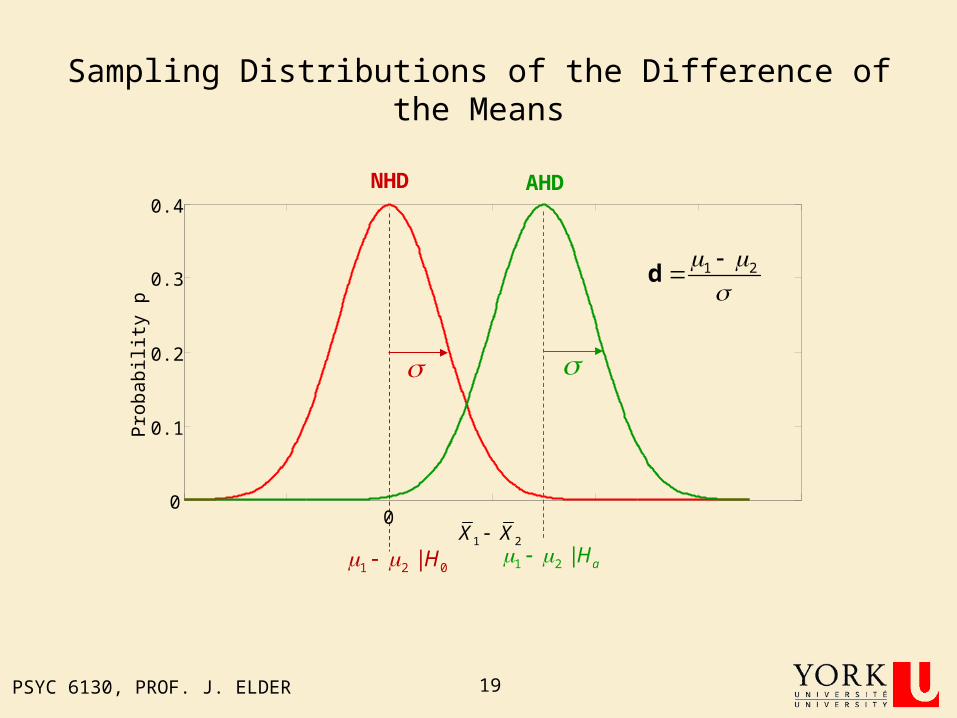
• To understand the factors that determine Type II errors, we need to model the situation when the null hypothesis is false and the alternative hypothesis is true.
• The difficulty is that the alternative hypothesis typically encompasses a range of possible population means, and we do not know which one is the correct mean.
• But suppose for the moment we did. This defines the alternative hypothesis distribution (AHD), which follows a non-central t distribution.
• We will often approximate this as a normal distribution, in order to compute rough estimates of power.
PSYC 6130, PROF. J. ELDER 19
Sampling Distributions of the Difference of the Means
0
0.1
0.2
0.3
0.4
Pro
bab
ility
p
NHD AHD
1 2X X
1 2 0| H 1 2 | aH
0
1 2
d
PSYC 6130, PROF. J. ELDER 20
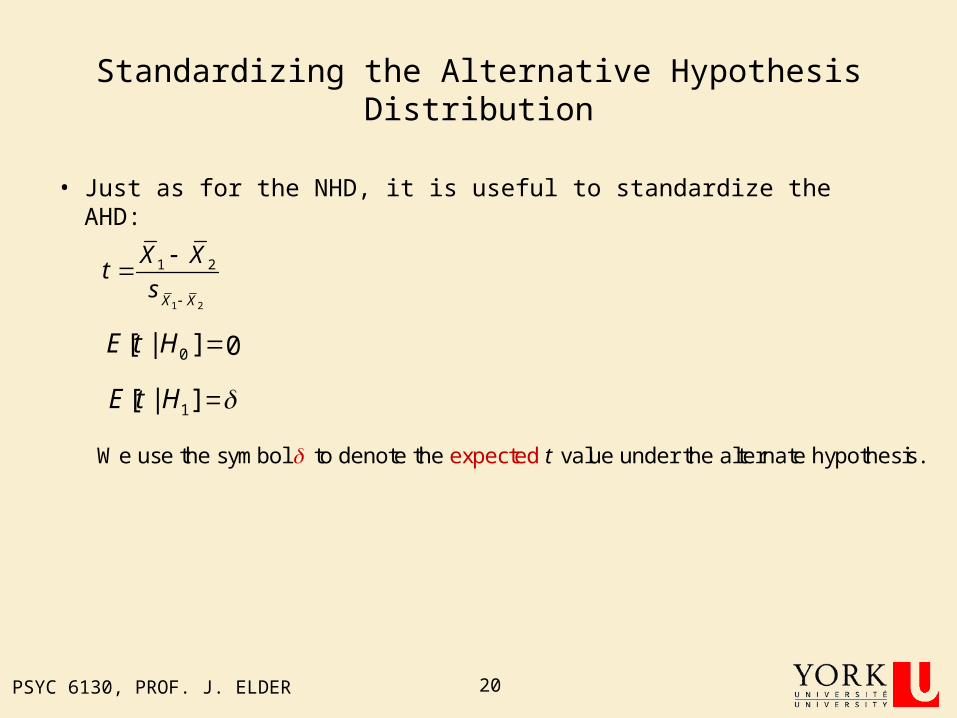
Standardizing the Alternative Hypothesis Distribution
• Just as for the NHD, it is useful to standardize the AHD:
1 2
1 2
X X
X Xt
s
0[ | ] ?E t H
1[ | ] ?E t H
0
expectedWe use the symbol to denote the value under the alternate hypothesis.t
PSYC 6130, PROF. J. ELDER 21
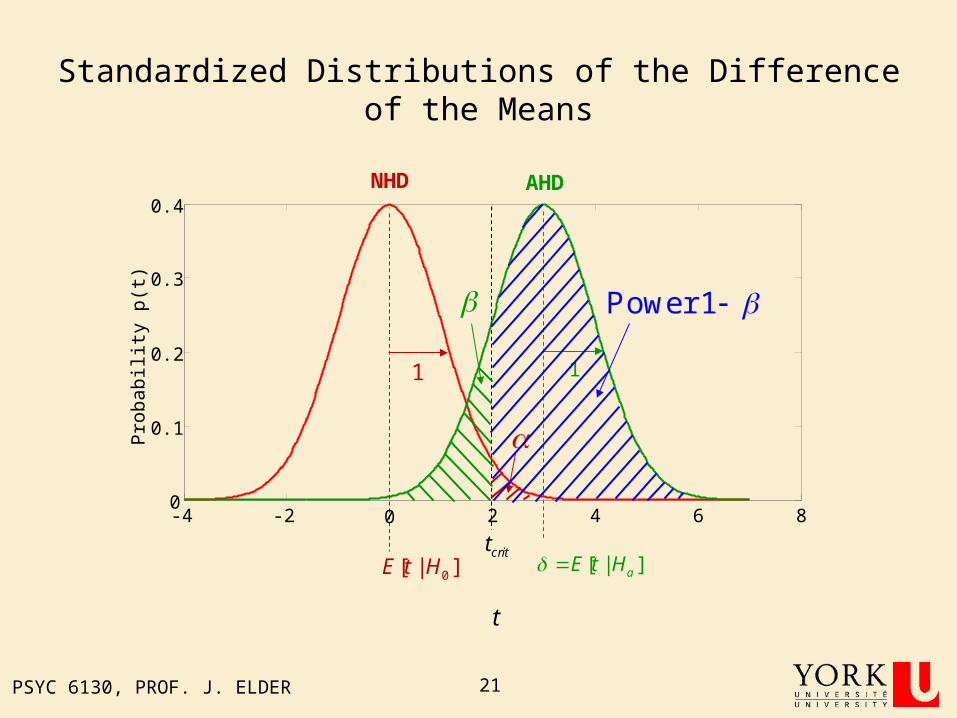
Standardized Distributions of the Difference of the Means
0
0.1
0.2
0.3
0.4
Pro
bab
ility
p(t
)
NHD AHD
0[ | ]E t H
11
-4 -2 0 2 4 6 8
t
[ | ]aE t H critt
Power 1

PSYC 6130, PROF. J. ELDER 22
Planning an Experiment: Approximations
• Estimates of effect size are always approximate, and so it is reasonable to make approximations when planning a study.
• For example:
1 2Homogeneity of variance:
1 2Balanced samples: n n n
Large samples s t z
PSYC 6130, PROF. J. ELDER 23
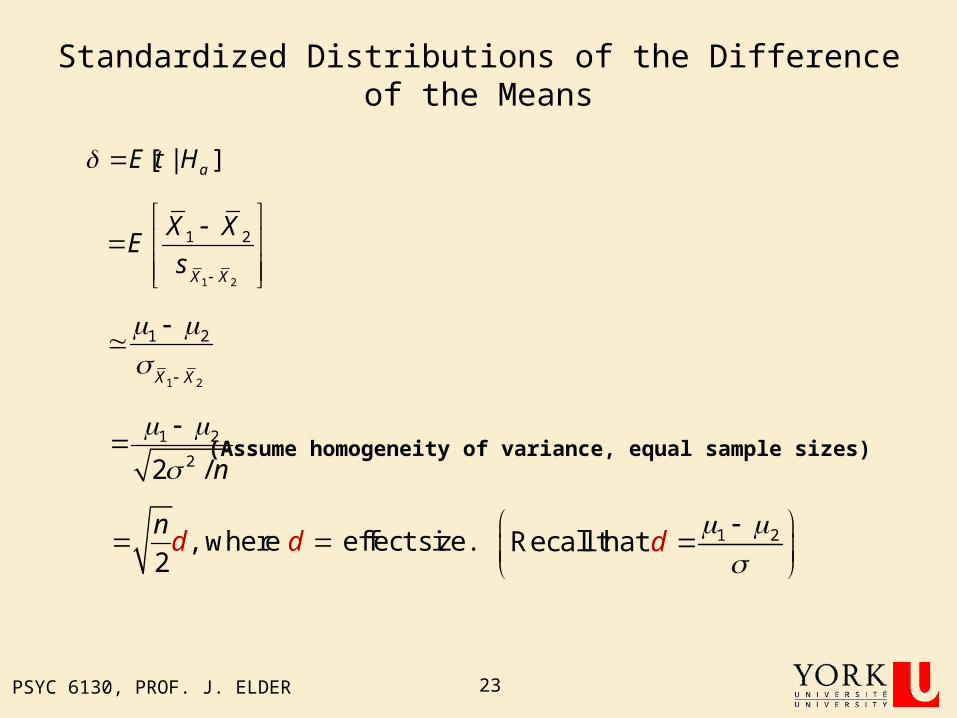
Standardized Distributions of the Difference of the Means
[ | ]aE t H
1 2
1 2
X X
X XE
s
(Assume homogeneity of variance, equal sample sizes)
1 2
1 2
X X
1 2
22 / n
, where effect size.2
d dn
1 2Recall that d

PSYC 6130, PROF. J. ELDER 24
Standardized Distributions of the Difference of the Means
0
0.1
0.2
0.3
0.4
Pro
bab
ility
p(t
)
NHD AHD
0[ | ]E t H
1
-4 -2 0 2 4 6 8
t
critt
2
nd
Power 1

PSYC 6130, PROF. J. ELDER 25
Estimating Power
If we have an estimate of the expected value ,
we can esti pma owte th er 1e
t
Pr( | [ ] )1 critt t E t Pr( | [ ] 0)critt t E t
(Non-central t distribution) (Central t distribution)
critt
1
0
Pr(
t)
critt
1
Expected t value
Pr(
t)

PSYC 6130, PROF. J. ELDER 26
critt
Calculating Power from Sample Size and Effect Size
Sample size n
Power 1
Effect Size d
[ ]E t
+
++
2
nd
-
-

PSYC 6130, PROF. J. ELDER 27
Planning Experiments
• Planning experiments may involve estimating any one of these variables given knowledge or assumptions about the other two:
, power:n d
, power :d n
, power :n d
You have already decided on the size of your sample, and you have an estimate of the effect size.
What is the power of your experiment?
You have an estimate of the effect size, and know the minimum power you want.
What sample size do you need?
You have already decided on the size of your sample, and you know the power you want.
What does the size of the effect have to be to give you this power?
2
nd
2
2nd
2d
n
PSYC 6130, PROF. J. ELDER 28
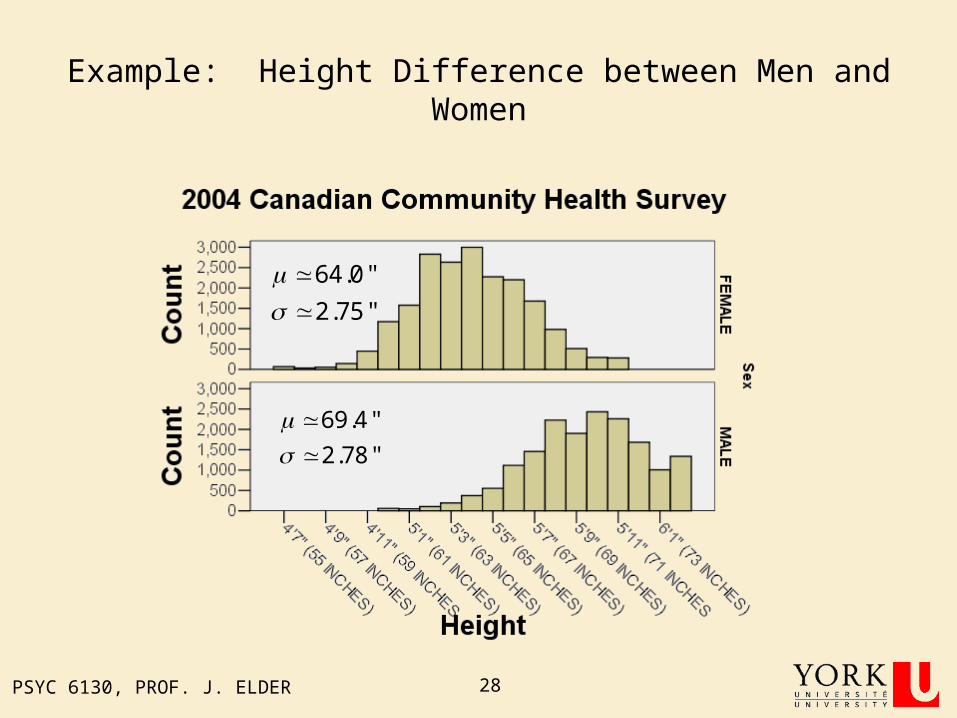
Example: Height Difference between Men and Women
69.4"
2.78"
64.0"
2.75"
PSYC 6130, PROF. J. ELDER 29
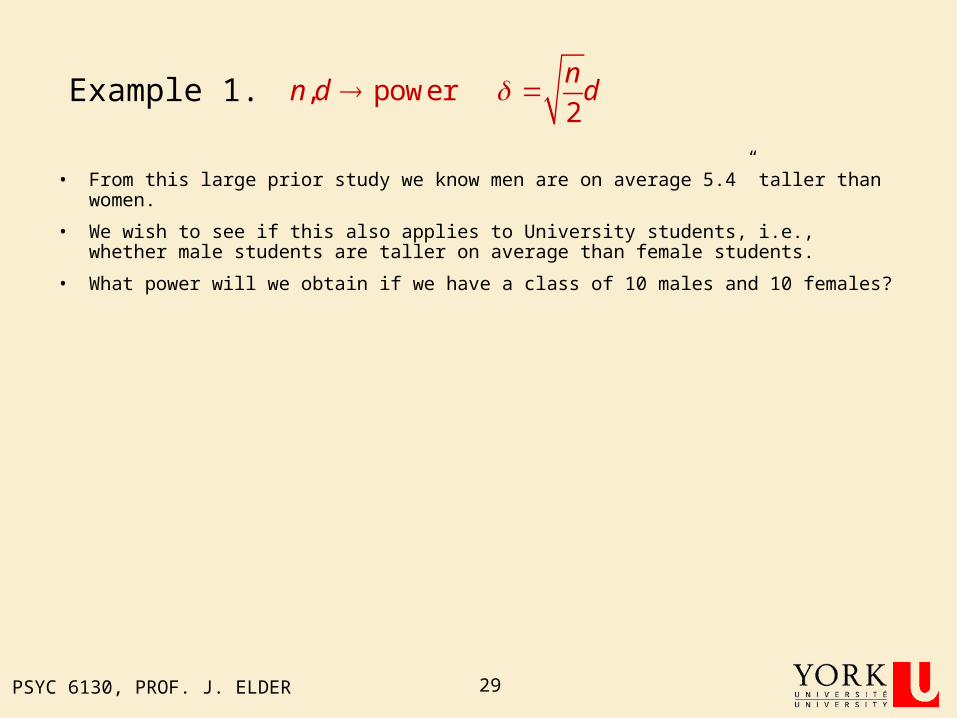
Example 1. , powern d 2
nd
• From this large prior study we know men are on average 5.4” taller than women.
• We wish to see if this also applies to University students, i.e., whether male students are taller on average than female students.
• What power will we obtain if we have a class of 10 males and 10 females?
PSYC 6130, PROF. J. ELDER 30
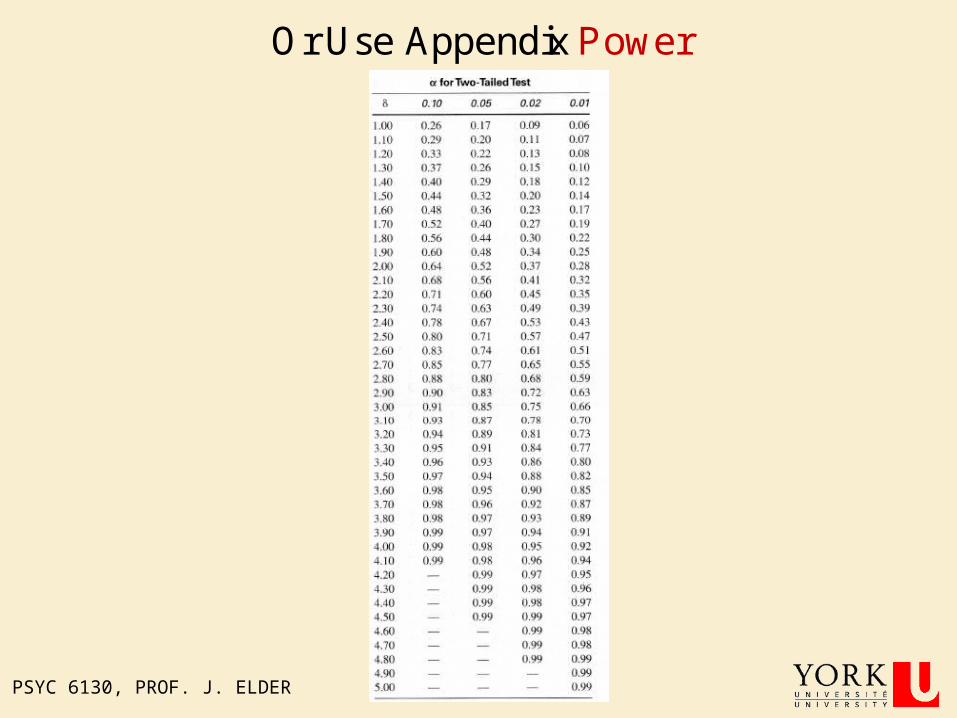
Or Use Appe Pndix ower

PSYC 6130, PROF. J. ELDER 31
Example 2a.
• From this large prior study we know men are on average 5.4” taller than women.
• We wish to see if this also applies to University students, i.e., whether male students are taller on average than female students.
• What sample size do we need to obtain power of 0.8?
69.4"
2.78"
64.0"
2.75"
, powerd n2
2nd

PSYC 6130, PROF. J. ELDER 32
Example 2b.
• Suppose we only care about differences greater than 1”
• Suppose also that we wish to have power of at least .8 (i.e., 80% chance of rejecting the null hypothesis, given it is false) for a 2-tailed test with =.05.
• What is the maximum sample size worth collecting?
2
2nd
, powerd n
1 0.8 0.2 0.85critt
0.05, 2 tailed 1.96critt 2.8
10.36
2.76d
22.8
2 1210.36
n

PSYC 6130, PROF. J. ELDER 33
Example 3.
• Suppose we are stuck with a sample size of 10 (i.e., 10 men and 10 women). Is it worth doing the study?
• Let’s decide that it is not worth doing the study unless we have power of at least .8 (i.e., 80% chance of rejecting the null hypothesis, given it is false) for a 2-tailed test with =.05.
, powern d 2d
n
PSYC 6130, PROF. J. ELDER 34
Manipulating Power
• In theory, power can be manipulated by changing
– Sample size
– Alpha level
– Effect size
• Increase strength of treatment
• Decrease variability
– Control of nuisance variables
– Matched designs

PSYC 6130, PROF. J. ELDER 35
One-Sample Tests
1 2 1 2
/X
nn
d
2
Thus
n
d
Note the greater power of one-sample tests, relative to two-sample tests!

PSYC 6130, PROF. J. ELDER 36
Unequal Sample Sizes
• When samples are of different size, apply same formulas for estimating power, using average sample size.
• Most accurate method is to use the harmonic mean:
1 21 2
1 2
2harmonic mean of and
n nn n
n n
1 2
Example:
=10, 10n n 1 2
Example:
=10, 2n n
PSYC 6130, PROF. J. ELDER 37
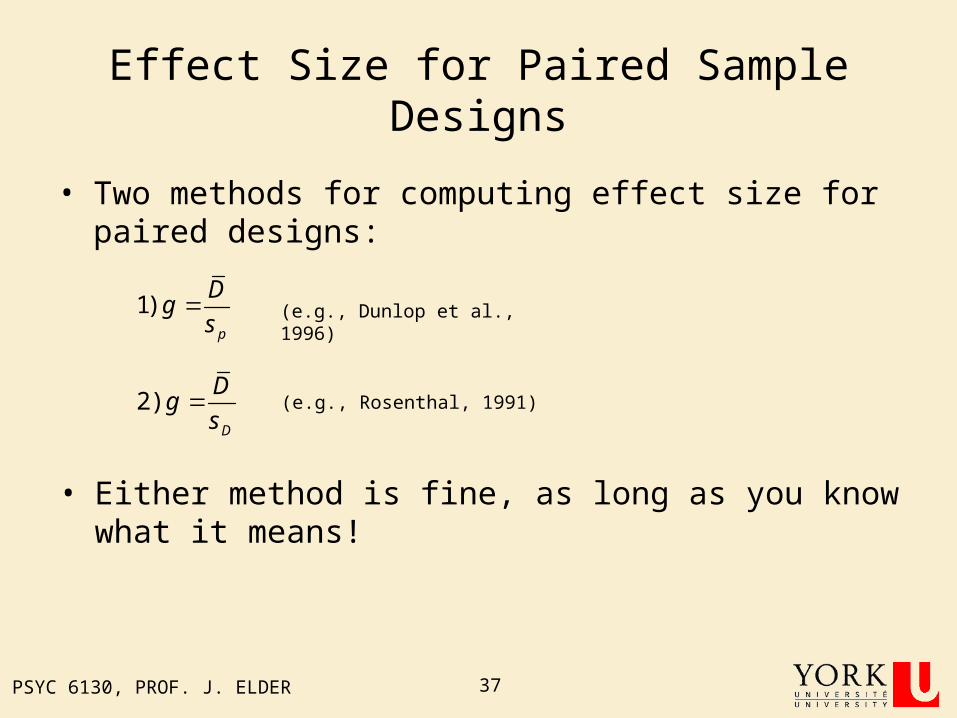
Effect Size for Paired Sample Designs
• Two methods for computing effect size for paired designs:
1) p
Dg
s (e.g., Dunlop et al., 1996)
2) D
Dg
s (e.g., Rosenthal, 1991)
• Either method is fine, as long as you know what it means!
Recommended