BI-NATIONAL BURNS
REGISTRY
ANNUAL REPORT
1st July 2009 – 30th June 2010
BI-NATIONAL BURNS REGISTRY ANNUAL REPORT
1 JULY 2009 TO 30 JUNE 2010 page 2
Report prepared by:
Bi-National Burns Registry Project Team
Prof Peter Cameron, A/Prof Belinda Gabbe, Dina Watterson, Natalie Picton and Andrew Hannaford
Department of Epidemiology and Preventive Medicine
Monash University
Alfred Hospital
Commercial Rd
Melbourne Victoria 3004
Phone: 03 9903 0001
The Bi-NBR Chief Investigators and members of the Bi-NBR Steering and Reference Committees are
listed at the end of the report.
For further information, contact the Bi-NBR Project Coordinator (Natalie Picton):
Email: [email protected]
BI-NATIONAL BURNS REGISTRY ANNUAL REPORT
1 JULY 2009 TO 30 JUNE 2010 page 3
Table of contents
Table of contents .......................................................................................................................................... 3
Introduction .................................................................................................................................................. 5
Executive Summary ....................................................................................................................................... 6
About this report........................................................................................................................................... 8
About The Bi-National Burns Registry........................................................................................................... 9
What is the Bi-National Burns Registry? ....................................................................................................... 9
Participating Burns Units .............................................................................................................................. 9
Aims .............................................................................................................................................................. 9
Project Achievements ................................................................................................................................. 10
How does the Bi-NBR operate? .................................................................................................................. 12
Inclusion / Exclusion criteria ....................................................................................................................... 12
Data Capture ............................................................................................................................................... 12
Registry Data Quality Assurance ................................................................................................................. 12
Data Analysis ............................................................................................................................................... 13
The number of burn cases .......................................................................................................................... 13
Demographic profile of hospitalised burn patients .................................................................................... 15
What was the cause and location of the events leading to a burn injury? ................................................ 17
Burn injury severity ..................................................................................................................................... 25
How were the burns patients managed prior to admission to the burns unit? ......................................... 28
Burn unit performance ............................................................................................................................... 30
In-hospital outcomes of burn injury ........................................................................................................... 34
Limitations and data caveats ...................................................................................................................... 41
BI-NATIONAL BURNS REGISTRY ANNUAL REPORT
1 JULY 2009 TO 30 JUNE 2010 page 4
Conclusion ................................................................................................................................................... 42
References .................................................................................................................................................. 43
Glossary ....................................................................................................................................................... 46
Appendix 1: Data Completeness ................................................................................................................. 48
Appendix 2: Steering Committee Membership .......................................................................................... 52
Appendix 3: Reference Committee Membership ....................................................................................... 53
Appendix 4: Hospitals with ethics committee approval ............................................................................. 54
Appendix 5: Report of structural quality indicators ................................................................................... 56
Appendix 6: Methodology for developing the co-morbidity categories .................................................... 57
Appendix 7: ANZBA Referral Criteria .......................................................................................................... 58
Appendix 8: Remoteness Areas .................................................................................................................. 59

BI-NATIONAL BURNS REGISTRY ANNUAL REPORT
1 JULY 2009 TO 30 JUNE 2010 page 5
Introduction
The Australian and New Zealand Burns Association (ANZBA) was formed in 1976 and incorporated in
1991 with the principal objective to encourage higher standards of both burn injury prevention and
patient care through research and education. Australia and NZ have regionalised burns care with 17
designated burns units across the two countries (Figure 1). The initial Bi-National Burns Registry (Bi-
NBR) was launched in 2004 with strong support from the ANZBA community. The registry was
predominately an epidemiological data repository and was not able to meet the association’s primary
aim for the registry of improving quality of care.
As a result of the limitations identified, ANZBA collaborated with Monash University in late 2007, to
assist with registry enhancements. In 2008, an opportunity was provided to participate in a project
funded by the Australian Commission on Safety and Quality in Health Care (ACSQHC) to test and validate
the ‘Draft Operating Principles and Technical Standards for Australian Clinical Quality Registries’[1].
Participation in this project came at a critical time and enabled the development of the registry as a
clinical quality registry. The Bi-NBR clinical quality registry was launched in July 2009.
Figure 1: Designated burns units across Australia and New Zealand
BI-NATIONAL BURNS REGISTRY ANNUAL REPORT
1 JULY 2009 TO 30 JUNE 2010 page 6
Executive Summary
This is the first annual report from the revised Bi-National Burns Registry (Bi-NBR.) The Bi-NBR provides
valuable information on the incidence and aetiology of burn injury across Australia and New Zealand.
The overall goal of the registry is to collect data on all burn patients admitted to a Bi-NBR burns unit who
meet the inclusion criteria.
Data are presented for 2103 burn patients treated at 11 burns units over the 12 month period from 1
July 2009 to 30 June 2010. It is estimated this corresponds to 97 per cent of all admissions for the ten
out of 11 sites that submitted hospital admission data for this reporting period.
Consistent with data reported by the American Burn Association, National Burn Repository, 74 per cent
of cases overall were adults with males accounting for 69 per cent of all cases. Children aged 12 to 24
months accounted for 37 per cent of paediatric cases while 20 to 29 year olds accounted for 25 per cent
of adult cases. Flame (35.7 per cent) and scald burns (35 per cent) were the primary cause of burn injury
for all age groups. For paediatric patients 10 years and under, scald burns were the predominant cause
of burn. For 11 to 15 years old paediatrics and 16 to 59 year old adults, flame burn was the
predominant cause. In the 60 and over age groups, scald burns was the predominant cause. Nearly all
burns were considered accidental (93 per cent).
The data presented indicates that for cases admitted to Australian burns units, 79 per cent were born in
Australia, with 9.3 per cent Australian Aboriginal. For New Zealand cases, 40 per cent were considered a
New Zealander with 40 per cent of these identified as a New Zealand Maori. Most Australian cases were
funded by the Australian Health Care Agreement (83 per cent) with ten per cent of cases classified as
work cover. Nearly all New Zealand cases (98 per cent) were funded under the Accident Compensation
Corporation.
A burn of less than ten per cent Total Body Surface Area (TBSA) was recorded for 74 per cent of all cases.
Seventy four per cent of paediatric cases and 80 per cent of adult cases underwent a burn wound
management procedure in theatre. Approximately 65 per cent of all cases going to theatre required
skin grafting, signifying the importance of adequate initial burn assessment, management and referral to
the appropriate burns units for definitive treatment of burns that meet the ANZBA endorsed referral
criteria (Appendix 7).
BI-NATIONAL BURNS REGISTRY ANNUAL REPORT
1 JULY 2009 TO 30 JUNE 2010 page 7
The initial burn management data suggests that cool running water (considered the most appropriate
technique) is the primary burn cooling strategy used in the majority of cases at the scene of injury (89
per cent). Cool running water was documented as being applied for ten to twenty minutes within three
hours of the burn for 27 per cent of all cases. Alternative techniques that are considered ineffective or
detrimental to burn wound recovery such as application of ice, aloe vera, butter and toothpaste which
continue to be used at the scene of the burn injury for burn cooling.
Nearly 50 per cent of paediatric and adult cases were transferred to the burns unit from another
hospital. The median length of stay (LOS) for paediatric patients (where LOS is > 24 hours and excluding
deaths) was four days (range 2-9) and seven days (range 3-13) for adults. The overall death rate was 1.6
per cent amongst the hospitalised burn patients. The majority of cases (82 per cent) were discharged to
their usual residence.
One hundred and ten paediatric cases (20 per cent) were readmitted within 28 days of discharge and
the majority (96.4 per cent) were reported as planned readmissions with only four unplanned re-
admissions. The readmission rate was less for adults where only 69 (4.5 per cent) cases recorded a re-
admission, however nearly half (48 per cent) of these cases were reported as ‘unplanned’.
The results of this annual report suggest most burn injuries are preventable and injury prevention
campaigns should be tailored to specific age groups and mechanisms of injury. Injury prevention
campaigns tailored to the indigenous populations across the region should also be considered. The data
suggest that while there appears to be a community understanding that water is the most appropriate
cooling technique, whether water is used adequately as a cooling technique is unclear. Further
community education on adequate burn cooling is an ongoing requirement.
The hospital process and quality of care data presented in this report provides a baseline from which
future monitoring of care can be undertaken. During 2011 and 2012, the focus for the registry will be to
increase registry participation to ensure near complete case capture and the ability to provide definitive
data for monitoring and benchmarking the quality of burn care across Australia and New Zealand.

BI-NATIONAL BURNS REGISTRY ANNUAL REPORT
1 JULY 2009 TO 30 JUNE 2010 page 8
About this report
This is the first annual report of the revised Bi-National Burns Registry (Bi-NBR) and it is a significant
milestone for the registry.
Data collected during the first year of the registry implementation (1st July 2009 – 30th June 2010) is
summarised in this report. During this period 11 of the 17 Bi-NBR sites (10 out of 14 Australian sites and
one out of four New Zealand sites) contributed data with 2,103 cases entered during the 12-month
period. Of the 11 sites, eight burn units admit adult patients and six burn units admit paediatric
patients. Two of these sites commenced data collection mid-way through the year. Only sites with
Institutional Ethics Committee (IEC) approval to participate and a local data collector were able to
contribute data to the registry.
The report describes the registry and its achievements and summarises the epidemiology of burns unit
admissions from 1 July 2009 to 30 June 2010. Quality of care data related to processes of care is also
provided. Where possible, data has been compared with the American Burn Association’s National
Burn Repository (NBR) 2010 [2] report of data from 2000 to 2009, as this is the only other burn database
that reports comparable summary data. While comparison of summary epidemiological data was
possible, consideration of the different health systems and potential different development and
governance processes of the registries is required when interpreting the comparison data. Limitations
and caveats associated with the present data are outlined and the Appendix includes a comprehensive
summary of data item completeness for the reporting period.

BI-NATIONAL BURNS REGISTRY ANNUAL REPORT
1 JULY 2009 TO 30 JUNE 2010 page 9
About The Bi-National Burns Registry
What is the Bi-National Burns Registry?
The Bi-National Burns Registry (Bi-NBR) is a clinical quality registry capturing epidemiological and quality
of care outcomes for adult and paediatric burn patients across Australian and New Zealand burns units.
The registry is a collaboration between the Australian and New Zealand Burn Association (ANZBA) and
Monash University, Melbourne. The registry has been co-funded by ANZBA and the Julian Burton Burns
Trust with additional funding received from the Australian Commission on Safety and Quality in Health
Care (2008-2009) and the Helen Macpherson Smith Trust (2010).
The purpose of the registry is to monitor burn injury incidence, burn injury causation, and to identify
objective and verifiable data on treatment, outcomes and quality of care with the principal objective to
encourage higher standards of both burn injury prevention and patient care.
Participating Burns Units
Only sites with Institutional Ethics Committee (IEC) approval and able to provide resources for local data
collection submit data to the Bi-NBR. For the 2009 to 2010 period, 12 of the 17 Bi-NBR sites (60 per cent)
contributed data.
Aims
i. Describe the epidemiology of burn injuries and inform the development of burn injury
prevention strategies in Australia and New Zealand
ii. Monitor the type and quality of burn care management
iii. Establish the clinical outcomes of burn patients
iv. Improve service planning
v. Develop best practice clinical guidelines and initiatives
vi. Benchmark performance indicators on a state, national and international level.
BI-NATIONAL BURNS REGISTRY ANNUAL REPORT
1 JULY 2009 TO 30 JUNE 2010 page 10
Project Achievements
Key project outcomes achieved are summarised below:
Ethics approval obtained
The primary Institutional Ethics Committee (IEC) approval was obtained from Monash University with
the stipulation of individual site approval. Seeking site IEC approval to contribute data to the Bi-NBR has
been pivotal in sites being able to participate. Sites individually applied for local ethics approval, with
support from the Bi-NBR staff members. For the first year of reporting, 13 out of 17 sites had obtained
ethics approval to submit data to the Bi-NBR.
Governance structure established
A formalised governance structure was established, consisting of a Steering Committee, Reference
Committee, Management Committee and sub-committees to oversee and develop the Bi-NBR. The
terms of reference and membership of the Steering Committee have been reviewed since the launch of
the Bi-NBR and now includes a consumer representative and funding body representatives.
Updated minimum dataset and data dictionary
A thorough review of the utility of the original minimum dataset relative to the aims of the registry was
conducted and redundant items were removed. Existing international burn registry and Australian
Institute of Health and Welfare data items were utilised where possible and new data definitions were
only developed where none previously existed. A further extensive review process was completed
following the second quarterly report and the revised dataset was implemented from April 2010.
Development of quality indicators
Key quality of care indicators were developed for the Bi-NBR to allow the quality of health care provided
to burn patients to be monitored and benchmarked across services. Nineteen quality indicators are
embedded within the Bi-NBR and reported on in this report.
Development of a revised centralised web-based information system
The Bi-NBR has evolved from a simple one-page web-based interface with no validation, to a web-based
information system with in-built data management processes, extensive validity checks and robust
security processes. Data entry has been streamlined to minimise manual effort and improve the user
experience, and search and completeness functions incorporated.
BI-NATIONAL BURNS REGISTRY ANNUAL REPORT
1 JULY 2009 TO 30 JUNE 2010 page 11
Established Routine Reporting Schedule and content
Quarterly reports are routinely produced and provide summary aggregate data from the registry. Sites
have the facility to access their own data for local analysis and reporting via the registry website. Sites
can also request ad-hoc reports of aggregate data for local use. Requests from external sources must
comply with the Bi-NBR Data Access Policy and be approved by the Bi-NBR Steering Committee.
Pilot collection of quality of life and functional instruments
The increased survival of patients with severe burn injury has resulted in a focus on measuring long term
outcomes for this group. A pilot project was commenced in October 2009 collecting quality of life and
functional outcomes for adult burn survivors. This project will span four years with the outcomes of the
study informing recommendations for the future collection of long term outcomes as a routine
component of the Bi-NBR.
BI-NATIONAL BURNS REGISTRY ANNUAL REPORT
1 JULY 2009 TO 30 JUNE 2010 page 12
How does the Bi-NBR operate?
Inclusion / Exclusion criteria
i. All first admissions to an Australian or New Zealand Burns Unit where a burn injury is the principal reason for admission and the following criteria are met:
a. The first admission is within 28 days of the burn injury
b. All transfers from another hospital irrespective of the time of injury to admission
c. The patient is admitted under the Burns Unit or admitted to another hospital unit but requires a Burns Unit consult
ii. Admission to hospital for greater than 24 hours or the patient is admitted for less than 24 hours but requires a burns management procedure in theatre; or the patient dies within 24 hours of admission
iii. All readmissions to the Burns Unit within 28 days of the date of discharge from the first admission.
Medical cause cases such as Steven Johnson Syndrome and toxic epidermal necrolysis (TENS) are
excluded from the registry.
Data Capture
Data collection is the responsibility of participating burn units. Patient data are retrieved via medical
records and existing hospital information systems and entered into the web-based database on-site. A
data collection form is used to assist this process. International Classification of Disease version 10,
Australian Modification (ICD-10-AM) diagnostic and procedural codes are predominantly retrieved
electronically from hospital information systems, de-identified and submitted to the Bi-NBR.
Registry Data Quality Assurance
To ensure all burns data coordinators and collectors designated to collect data for the registry are
collecting data in a standardised manner, formal training sessions are held. Annual ‘refresher’ training
sessions and ad hoc informal training sessions are available as required.
Data completeness reports are provided to sites prior to extracting data for the quarterly and annual
reports to maximise data completeness. Routine quality assurance review and checks for reliability and
validity are planned to ensure the Bi-NBR produces high quality data.
BI-NATIONAL BURNS REGISTRY ANNUAL REPORT
1 JULY 2009 TO 30 JUNE 2010 page 13
Data Analysis
The number of burn cases
This section provides information about the number of patients admitted to a participating burns unit
that meet the Bi-NBR inclusion criteria.
Bi-NBR burn cases
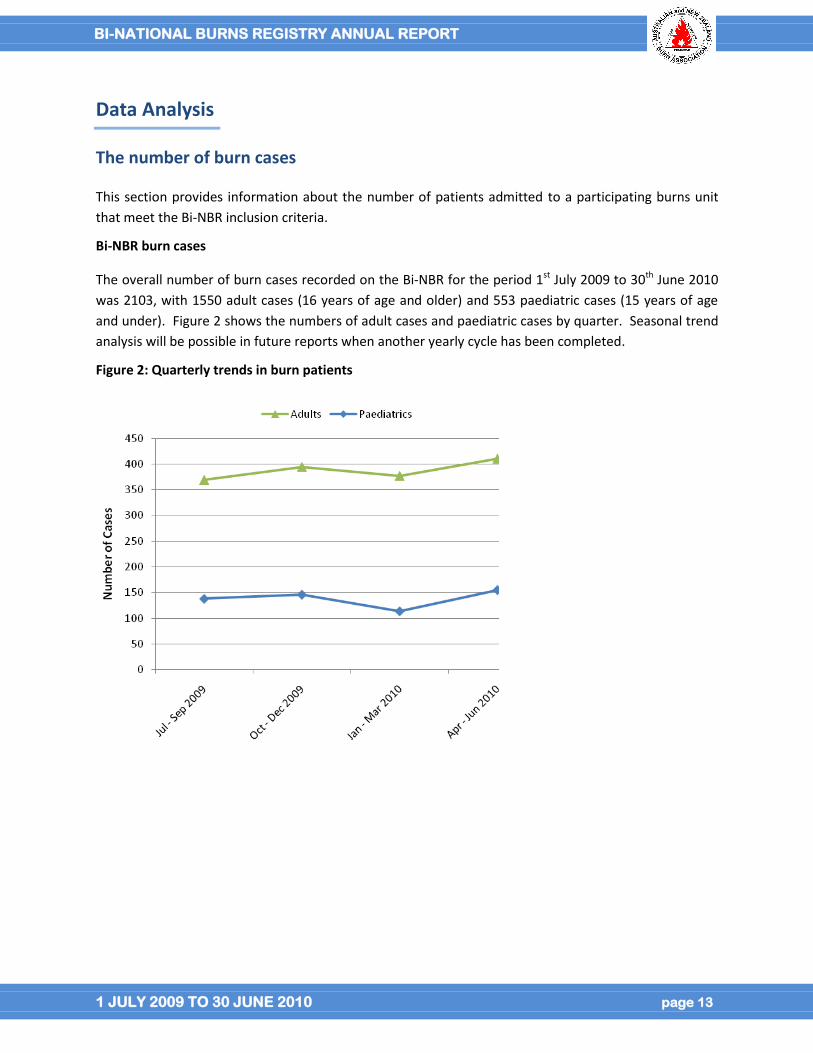
The overall number of burn cases recorded on the Bi-NBR for the period 1st July 2009 to 30th June 2010
was 2103, with 1550 adult cases (16 years of age and older) and 553 paediatric cases (15 years of age
and under). Figure 2 shows the numbers of adult cases and paediatric cases by quarter. Seasonal trend
analysis will be possible in future reports when another yearly cycle has been completed.
Figure 2: Quarterly trends in burn patients
BI-NATIONAL BURNS REGISTRY ANNUAL REPORT
1 JULY 2009 TO 30 JUNE 2010 page 14
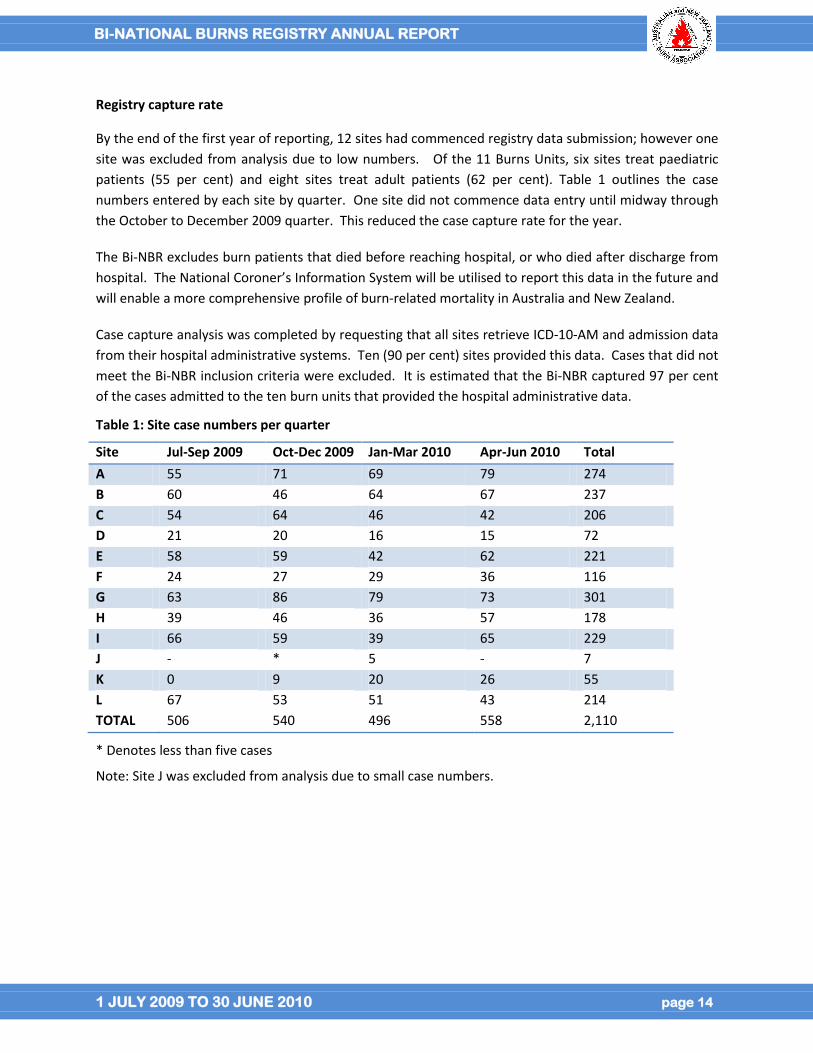
Registry capture rate
By the end of the first year of reporting, 12 sites had commenced registry data submission; however one
site was excluded from analysis due to low numbers. Of the 11 Burns Units, six sites treat paediatric
patients (55 per cent) and eight sites treat adult patients (62 per cent). Table 1 outlines the case
numbers entered by each site by quarter. One site did not commence data entry until midway through
the October to December 2009 quarter. This reduced the case capture rate for the year.
The Bi-NBR excludes burn patients that died before reaching hospital, or who died after discharge from
hospital. The National Coroner’s Information System will be utilised to report this data in the future and
will enable a more comprehensive profile of burn-related mortality in Australia and New Zealand.
Case capture analysis was completed by requesting that all sites retrieve ICD-10-AM and admission data
from their hospital administrative systems. Ten (90 per cent) sites provided this data. Cases that did not
meet the Bi-NBR inclusion criteria were excluded. It is estimated that the Bi-NBR captured 97 per cent
of the cases admitted to the ten burn units that provided the hospital administrative data.
Table 1: Site case numbers per quarter
Site Jul-Sep 2009 Oct-Dec 2009 Jan-Mar 2010 Apr-Jun 2010 Total
A 55 71 69 79 274
B 60 46 64 67 237
C 54 64 46 42 206
D 21 20 16 15 72
E 58 59 42 62 221
F 24 27 29 36 116
G 63 86 79 73 301
H 39 46 36 57 178
I 66 59 39 65 229
J - * 5 - 7
K 0 9 20 26 55
L 67 53 51 43 214
TOTAL 506 540 496 558 2,110
* Denotes less than five cases
Note: Site J was excluded from analysis due to small case numbers.
BI-NATIONAL BURNS REGISTRY ANNUAL REPORT
1 JULY 2009 TO 30 JUNE 2010 page 15
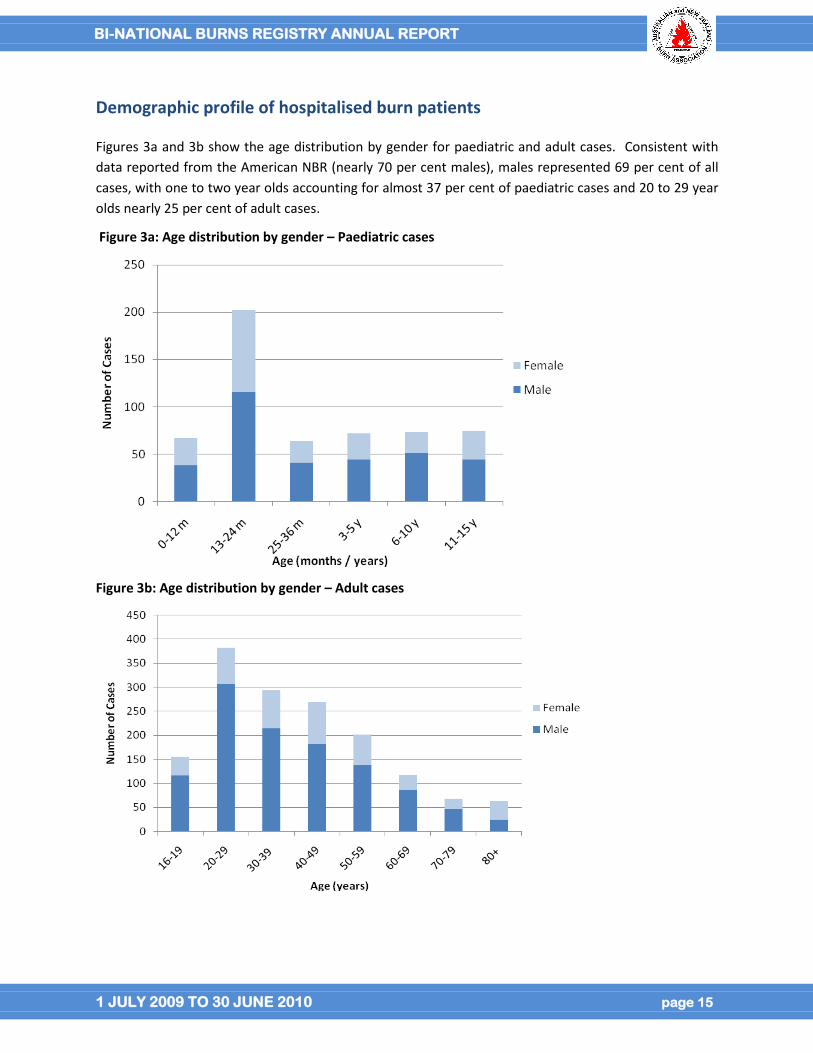
Demographic profile of hospitalised burn patients
Figures 3a and 3b show the age distribution by gender for paediatric and adult cases. Consistent with
data reported from the American NBR (nearly 70 per cent males), males represented 69 per cent of all
cases, with one to two year olds accounting for almost 37 per cent of paediatric cases and 20 to 29 year
olds nearly 25 per cent of adult cases.
Figure 3a: Age distribution by gender – Paediatric cases
Figure 3b: Age distribution by gender – Adult cases
BI-NATIONAL BURNS REGISTRY ANNUAL REPORT
1 JULY 2009 TO 30 JUNE 2010 page 16
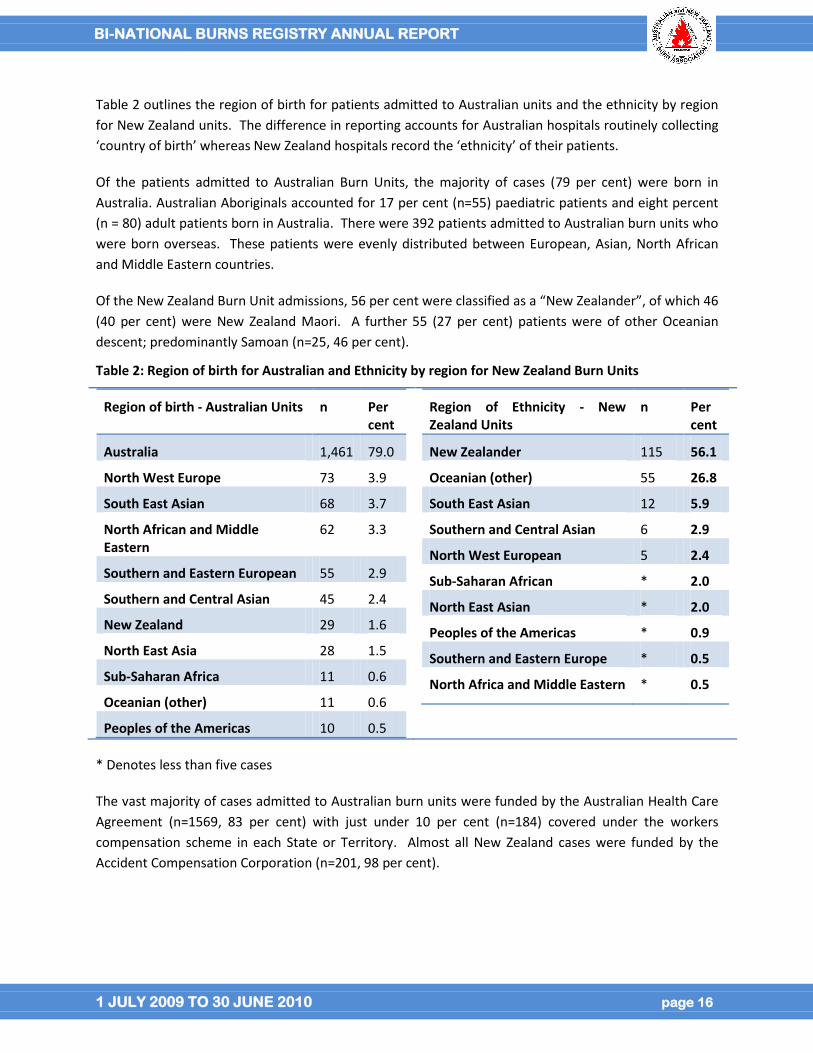
Table 2 outlines the region of birth for patients admitted to Australian units and the ethnicity by region
for New Zealand units. The difference in reporting accounts for Australian hospitals routinely collecting
‘country of birth’ whereas New Zealand hospitals record the ‘ethnicity’ of their patients.
Of the patients admitted to Australian Burn Units, the majority of cases (79 per cent) were born in
Australia. Australian Aboriginals accounted for 17 per cent (n=55) paediatric patients and eight percent
(n = 80) adult patients born in Australia. There were 392 patients admitted to Australian burn units who
were born overseas. These patients were evenly distributed between European, Asian, North African
and Middle Eastern countries.
Of the New Zealand Burn Unit admissions, 56 per cent were classified as a “New Zealander”, of which 46
(40 per cent) were New Zealand Maori. A further 55 (27 per cent) patients were of other Oceanian
descent; predominantly Samoan (n=25, 46 per cent).
Table 2: Region of birth for Australian and Ethnicity by region for New Zealand Burn Units
Region of birth - Australian Units n Per cent
Australia 1,461 79.0
North West Europe 73 3.9
South East Asian 68 3.7
North African and Middle Eastern
62 3.3
Southern and Eastern European 55 2.9
Southern and Central Asian 45 2.4
New Zealand 29 1.6
North East Asia 28 1.5
Sub-Saharan Africa 11 0.6
Oceanian (other) 11 0.6
Peoples of the Americas 10 0.5
Region of Ethnicity - New Zealand Units
n Per cent
New Zealander 115 56.1
Oceanian (other) 55 26.8
South East Asian 12 5.9
Southern and Central Asian 6 2.9
North West European 5 2.4
Sub-Saharan African * 2.0
North East Asian * 2.0
Peoples of the Americas * 0.9
Southern and Eastern Europe * 0.5
North Africa and Middle Eastern * 0.5
* Denotes less than five cases
The vast majority of cases admitted to Australian burn units were funded by the Australian Health Care
Agreement (n=1569, 83 per cent) with just under 10 per cent (n=184) covered under the workers
compensation scheme in each State or Territory. Almost all New Zealand cases were funded by the
Accident Compensation Corporation (n=201, 98 per cent).
BI-NATIONAL BURNS REGISTRY ANNUAL REPORT
1 JULY 2009 TO 30 JUNE 2010 page 17
What was the cause and location of the events leading to a burn injury?
This section outlines the cause of burn injury, the activities leading to injury, the places of injury, and the
geographical region of the injury across Australia and New Zealand.
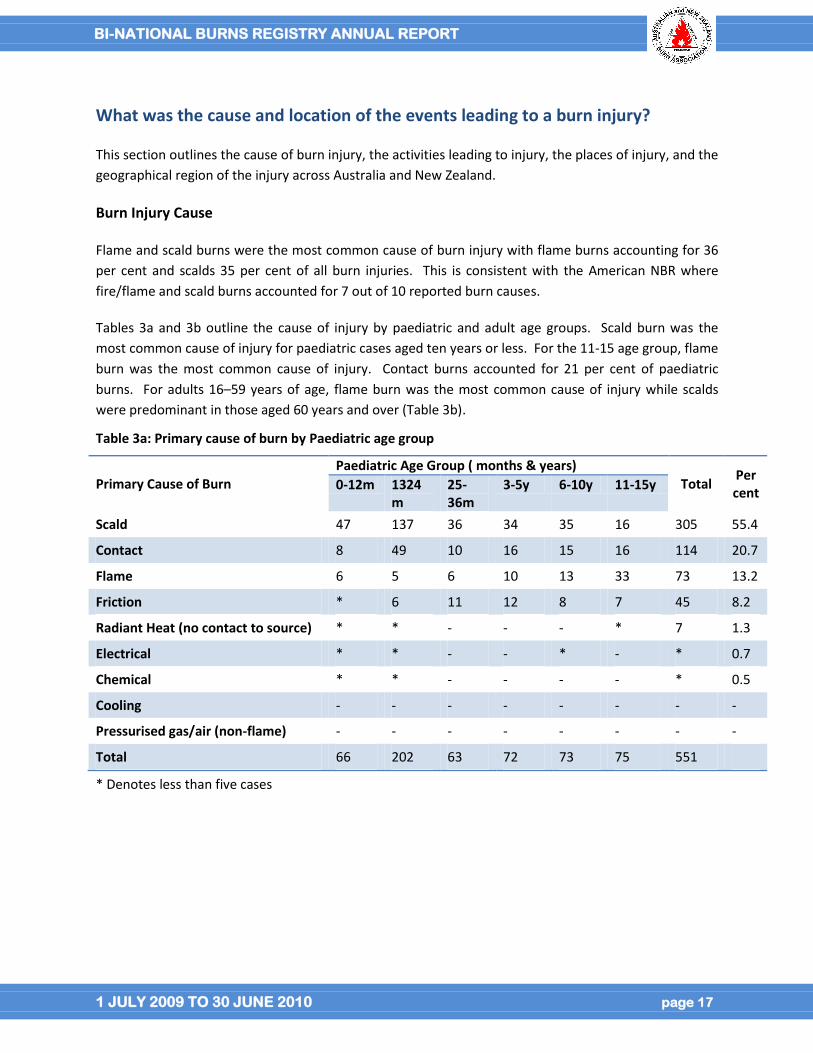
Burn Injury Cause
Flame and scald burns were the most common cause of burn injury with flame burns accounting for 36
per cent and scalds 35 per cent of all burn injuries. This is consistent with the American NBR where
fire/flame and scald burns accounted for 7 out of 10 reported burn causes.
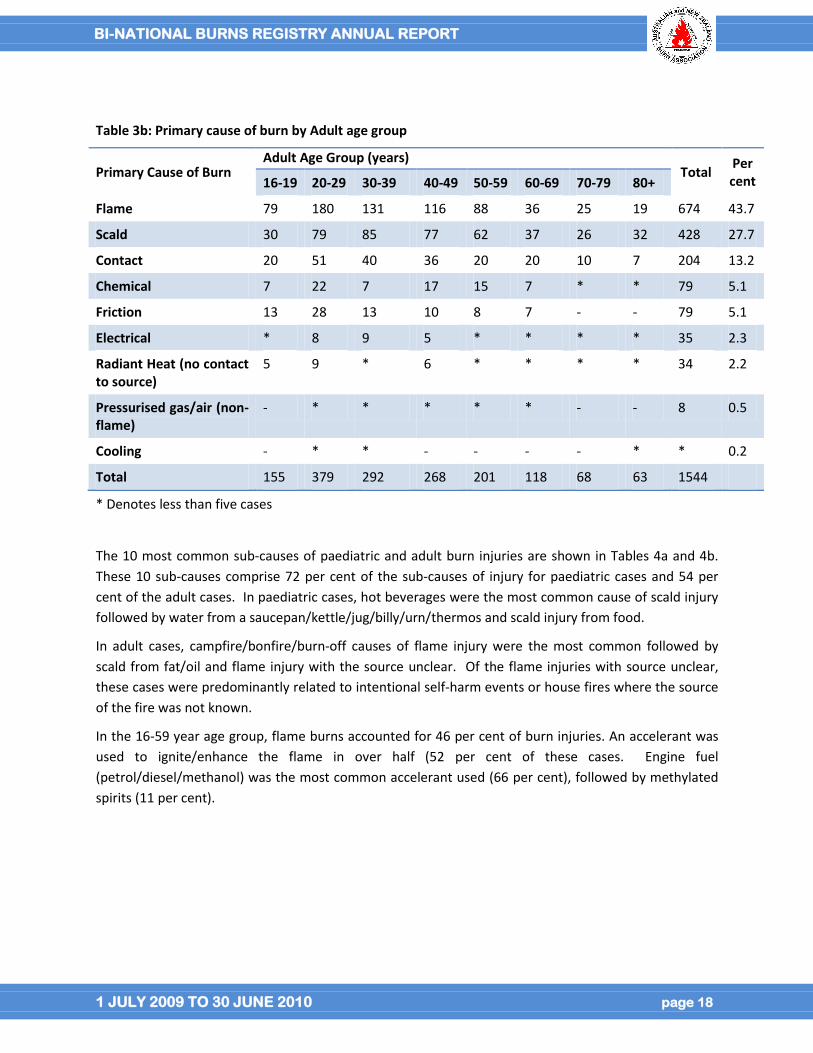
Tables 3a and 3b outline the cause of injury by paediatric and adult age groups. Scald burn was the
most common cause of injury for paediatric cases aged ten years or less. For the 11-15 age group, flame
burn was the most common cause of injury. Contact burns accounted for 21 per cent of paediatric
burns. For adults 16–59 years of age, flame burn was the most common cause of injury while scalds
were predominant in those aged 60 years and over (Table 3b).
Table 3a: Primary cause of burn by Paediatric age group
Primary Cause of Burn
Paediatric Age Group ( months & years)
Total Per cent
0-12m 1324m
25-36m
3-5y 6-10y 11-15y
Scald 47 137 36 34 35 16 305 55.4
Contact 8 49 10 16 15 16 114 20.7
Flame 6 5 6 10 13 33 73 13.2
Friction * 6 11 12 8 7 45 8.2
Radiant Heat (no contact to source) * * - - - * 7 1.3
Electrical * * - - * - * 0.7
Chemical * * - - - - * 0.5
Cooling - - - - - - - -
Pressurised gas/air (non-flame) - - - - - - - -
Total 66 202 63 72 73 75 551
* Denotes less than five cases
BI-NATIONAL BURNS REGISTRY ANNUAL REPORT
1 JULY 2009 TO 30 JUNE 2010 page 18
Table 3b: Primary cause of burn by Adult age group
Primary Cause of Burn Adult Age Group (years)
Total Per cent 16-19 20-29 30-39 40-49 50-59 60-69 70-79 80+
Flame 79 180 131 116 88 36 25 19 674 43.7
Scald 30 79 85 77 62 37 26 32 428 27.7
Contact 20 51 40 36 20 20 10 7 204 13.2
Chemical 7 22 7 17 15 7 * * 79 5.1
Friction 13 28 13 10 8 7 - - 79 5.1
Electrical * 8 9 5 * * * * 35 2.3
Radiant Heat (no contact to source)
5 9 * 6 * * * * 34 2.2
Pressurised gas/air (non-flame)
- * * * * * - - 8 0.5
Cooling - * * - - - - * * 0.2
Total 155 379 292 268 201 118 68 63 1544
* Denotes less than five cases
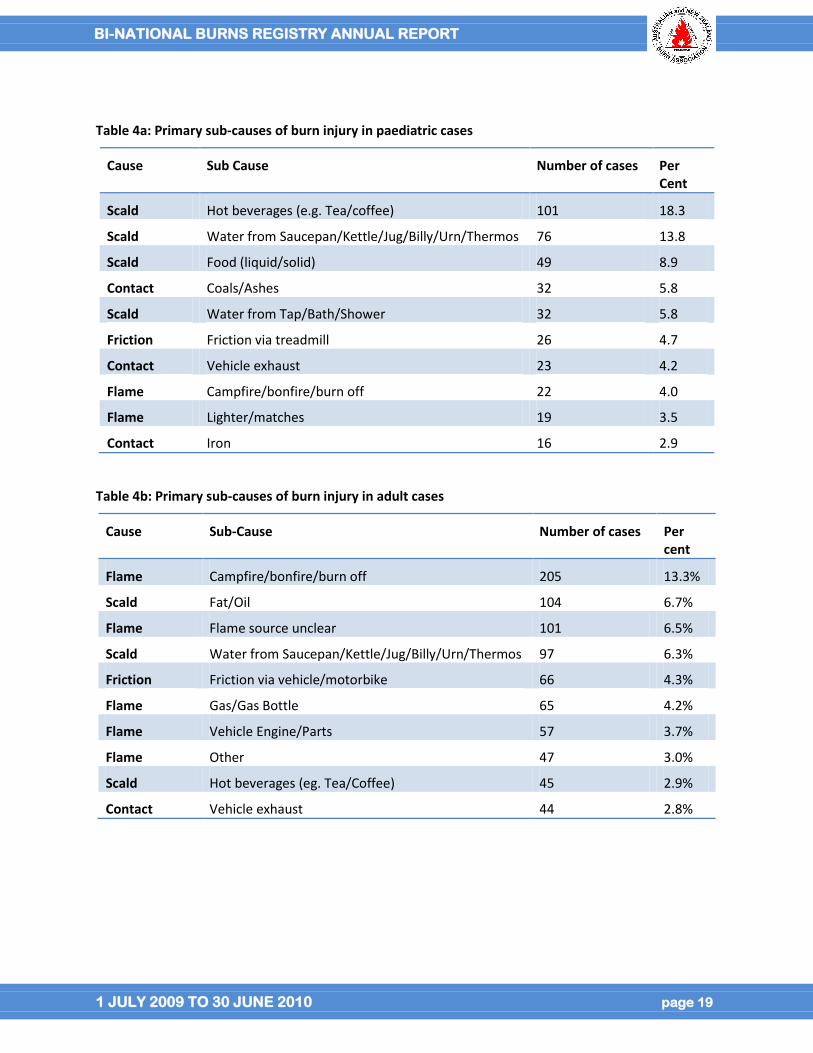
The 10 most common sub-causes of paediatric and adult burn injuries are shown in Tables 4a and 4b.
These 10 sub-causes comprise 72 per cent of the sub-causes of injury for paediatric cases and 54 per
cent of the adult cases. In paediatric cases, hot beverages were the most common cause of scald injury
followed by water from a saucepan/kettle/jug/billy/urn/thermos and scald injury from food.
In adult cases, campfire/bonfire/burn-off causes of flame injury were the most common followed by
scald from fat/oil and flame injury with the source unclear. Of the flame injuries with source unclear,
these cases were predominantly related to intentional self-harm events or house fires where the source
of the fire was not known.
In the 16-59 year age group, flame burns accounted for 46 per cent of burn injuries. An accelerant was
used to ignite/enhance the flame in over half (52 per cent of these cases. Engine fuel
(petrol/diesel/methanol) was the most common accelerant used (66 per cent), followed by methylated
spirits (11 per cent).
BI-NATIONAL BURNS REGISTRY ANNUAL REPORT
1 JULY 2009 TO 30 JUNE 2010 page 19
Table 4a: Primary sub-causes of burn injury in paediatric cases
Cause Sub Cause Number of cases Per Cent
Scald Hot beverages (e.g. Tea/coffee) 101 18.3
Scald Water from Saucepan/Kettle/Jug/Billy/Urn/Thermos 76 13.8
Scald Food (liquid/solid) 49 8.9
Contact Coals/Ashes 32 5.8
Scald Water from Tap/Bath/Shower 32 5.8
Friction Friction via treadmill 26 4.7
Contact Vehicle exhaust 23 4.2
Flame Campfire/bonfire/burn off 22 4.0
Flame Lighter/matches 19 3.5
Contact Iron 16 2.9
Table 4b: Primary sub-causes of burn injury in adult cases
Cause Sub-Cause Number of cases Per cent
Flame Campfire/bonfire/burn off 205 13.3%
Scald Fat/Oil 104 6.7%
Flame Flame source unclear 101 6.5%
Scald Water from Saucepan/Kettle/Jug/Billy/Urn/Thermos 97 6.3%
Friction Friction via vehicle/motorbike 66 4.3%
Flame Gas/Gas Bottle 65 4.2%
Flame Vehicle Engine/Parts 57 3.7%
Flame Other 47 3.0%
Scald Hot beverages (eg. Tea/Coffee) 45 2.9%
Contact Vehicle exhaust 44 2.8%
BI-NATIONAL BURNS REGISTRY ANNUAL REPORT
1 JULY 2009 TO 30 JUNE 2010 page 20
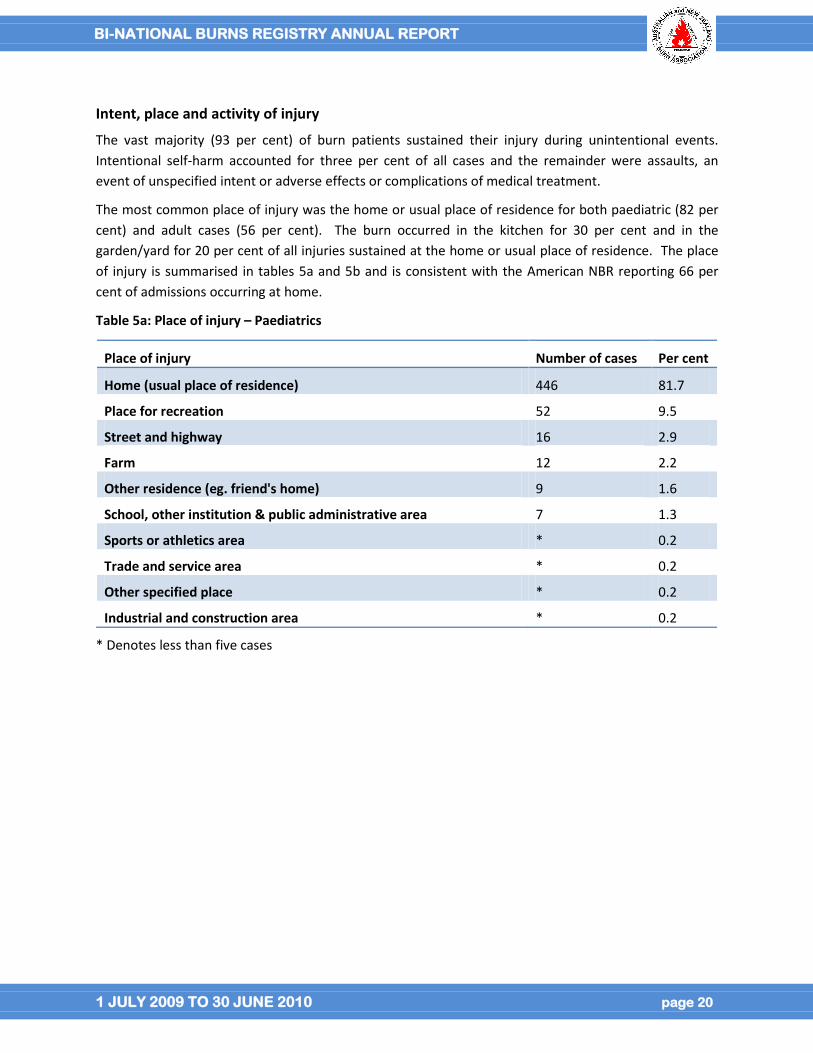
Intent, place and activity of injury
The vast majority (93 per cent) of burn patients sustained their injury during unintentional events.
Intentional self-harm accounted for three per cent of all cases and the remainder were assaults, an
event of unspecified intent or adverse effects or complications of medical treatment.
The most common place of injury was the home or usual place of residence for both paediatric (82 per
cent) and adult cases (56 per cent). The burn occurred in the kitchen for 30 per cent and in the
garden/yard for 20 per cent of all injuries sustained at the home or usual place of residence. The place
of injury is summarised in tables 5a and 5b and is consistent with the American NBR reporting 66 per
cent of admissions occurring at home.
Table 5a: Place of injury – Paediatrics
Place of injury Number of cases Per cent
Home (usual place of residence) 446 81.7
Place for recreation 52 9.5
Street and highway 16 2.9
Farm 12 2.2
Other residence (eg. friend's home) 9 1.6
School, other institution & public administrative area 7 1.3
Sports or athletics area * 0.2
Trade and service area * 0.2
Other specified place * 0.2
Industrial and construction area * 0.2
* Denotes less than five cases
BI-NATIONAL BURNS REGISTRY ANNUAL REPORT
1 JULY 2009 TO 30 JUNE 2010 page 21
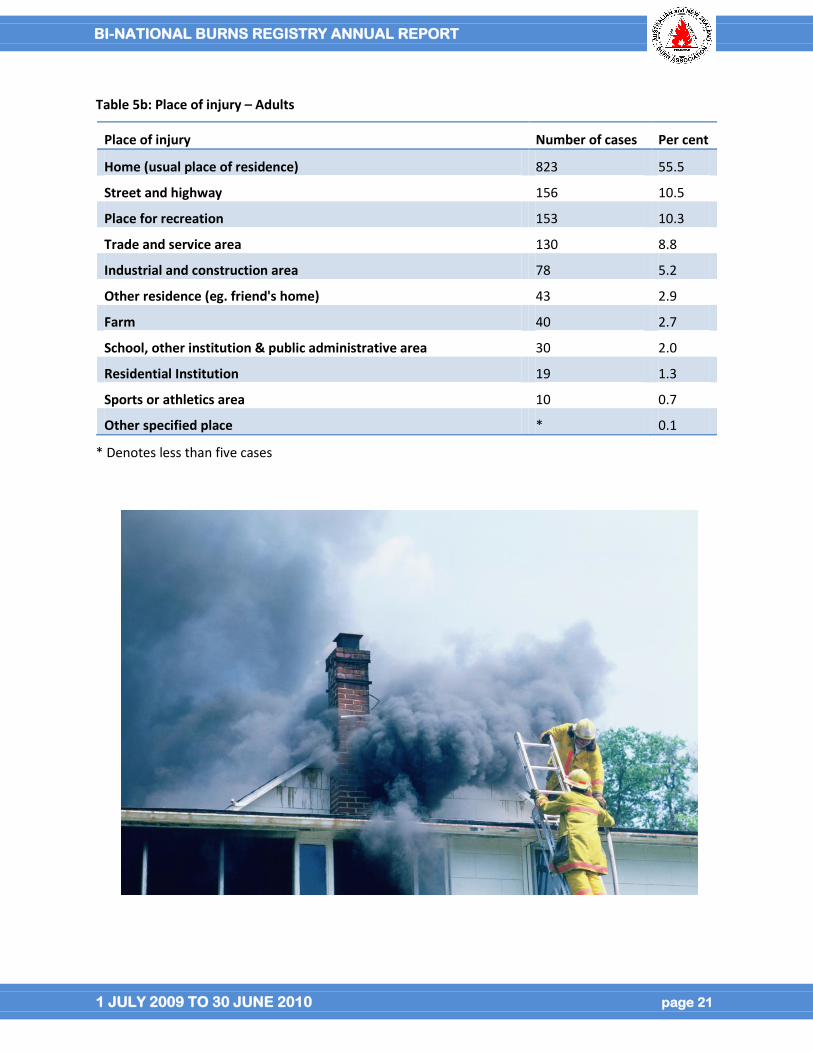
Table 5b: Place of injury – Adults
Place of injury Number of cases Per cent
Home (usual place of residence) 823 55.5
Street and highway 156 10.5
Place for recreation 153 10.3
Trade and service area 130 8.8
Industrial and construction area 78 5.2
Other residence (eg. friend's home) 43 2.9
Farm 40 2.7
School, other institution & public administrative area 30 2.0
Residential Institution 19 1.3
Sports or athletics area 10 0.7
Other specified place * 0.1
* Denotes less than five cases
BI-NATIONAL BURNS REGISTRY ANNUAL REPORT
1 JULY 2009 TO 30 JUNE 2010 page 22
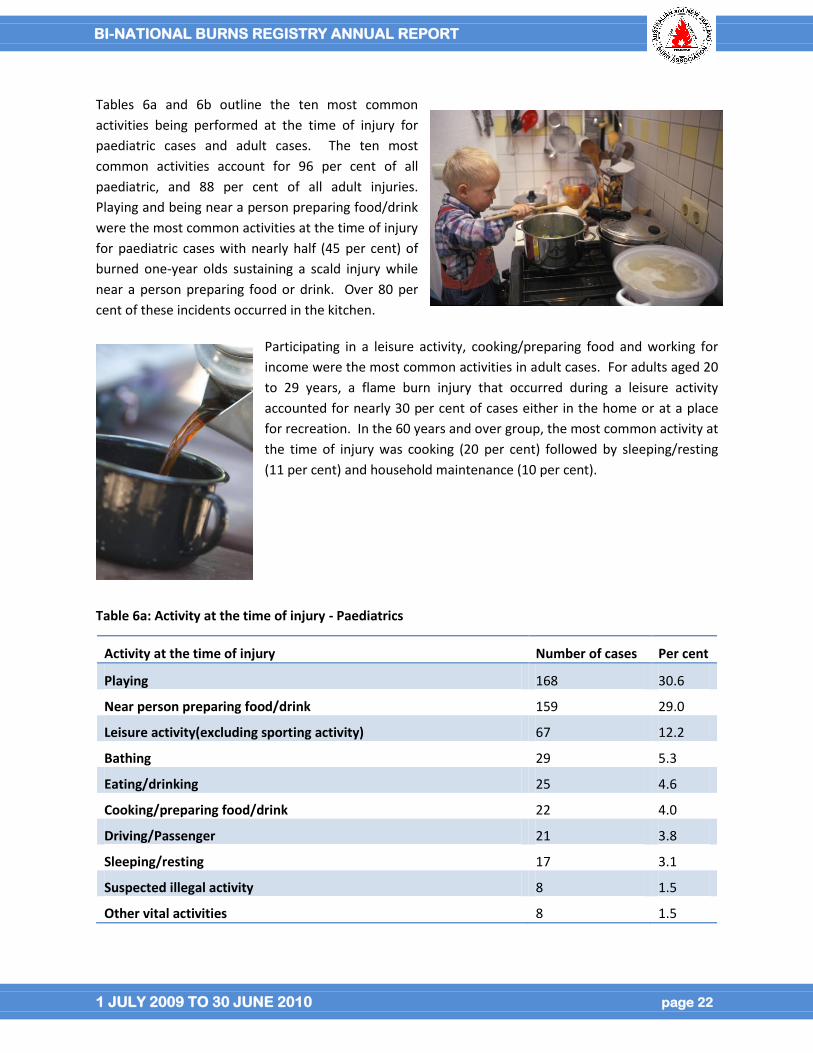
Tables 6a and 6b outline the ten most common
activities being performed at the time of injury for
paediatric cases and adult cases. The ten most
common activities account for 96 per cent of all
paediatric, and 88 per cent of all adult injuries.
Playing and being near a person preparing food/drink
were the most common activities at the time of injury
for paediatric cases with nearly half (45 per cent) of
burned one-year olds sustaining a scald injury while
near a person preparing food or drink. Over 80 per
cent of these incidents occurred in the kitchen.
Participating in a leisure activity, cooking/preparing food and working for
income were the most common activities in adult cases. For adults aged 20
to 29 years, a flame burn injury that occurred during a leisure activity
accounted for nearly 30 per cent of cases either in the home or at a place
for recreation. In the 60 years and over group, the most common activity at
the time of injury was cooking (20 per cent) followed by sleeping/resting
(11 per cent) and household maintenance (10 per cent).
Table 6a: Activity at the time of injury - Paediatrics
Activity at the time of injury Number of cases Per cent
Playing 168 30.6
Near person preparing food/drink 159 29.0
Leisure activity(excluding sporting activity) 67 12.2
Bathing 29 5.3
Eating/drinking 25 4.6
Cooking/preparing food/drink 22 4.0
Driving/Passenger 21 3.8
Sleeping/resting 17 3.1
Suspected illegal activity 8 1.5
Other vital activities 8 1.5
BI-NATIONAL BURNS REGISTRY ANNUAL REPORT
1 JULY 2009 TO 30 JUNE 2010 page 23
Table 6b: Activity at the time of injury - Adults
Activity at the time of injury Number of cases Per cent
Leisure activity (excluding sporting activity) 296 19.6
Cooking/preparing food 243 16.1
Working for income 240 15.9
Household maintenance 115 7.6
Sleeping/resting 101 6.7
Driving/passenger 98 6.5
Other specified activity 64 4.2
Self harming 61 4.0
Vehicle maintenance 58 3.8
Suspected illegal activity 49 3.2
Drug/Alcohol Involvement
For the majority of cases (75 per cent), there was no documented suspicion of drug and alcohol
involvement. Documented suspicion of alcohol involvement was recorded in 20 per cent of cases with
drugs in just fewer than two percent and a combination of drugs and alcohol in less than four per cent of
cases. Blood testing for alcohol or drug involvement is not completed routinely for all burn patients and
therefore the information capture is based on medical record documentation of suspicion or known
alcohol or drug involvement. Whether there is underreporting of drug or alcohol involvement in the
medical record requires further investigation.
BI-NATIONAL BURNS REGISTRY ANNUAL REPORT
1 JULY 2009 TO 30 JUNE 2010 page 24
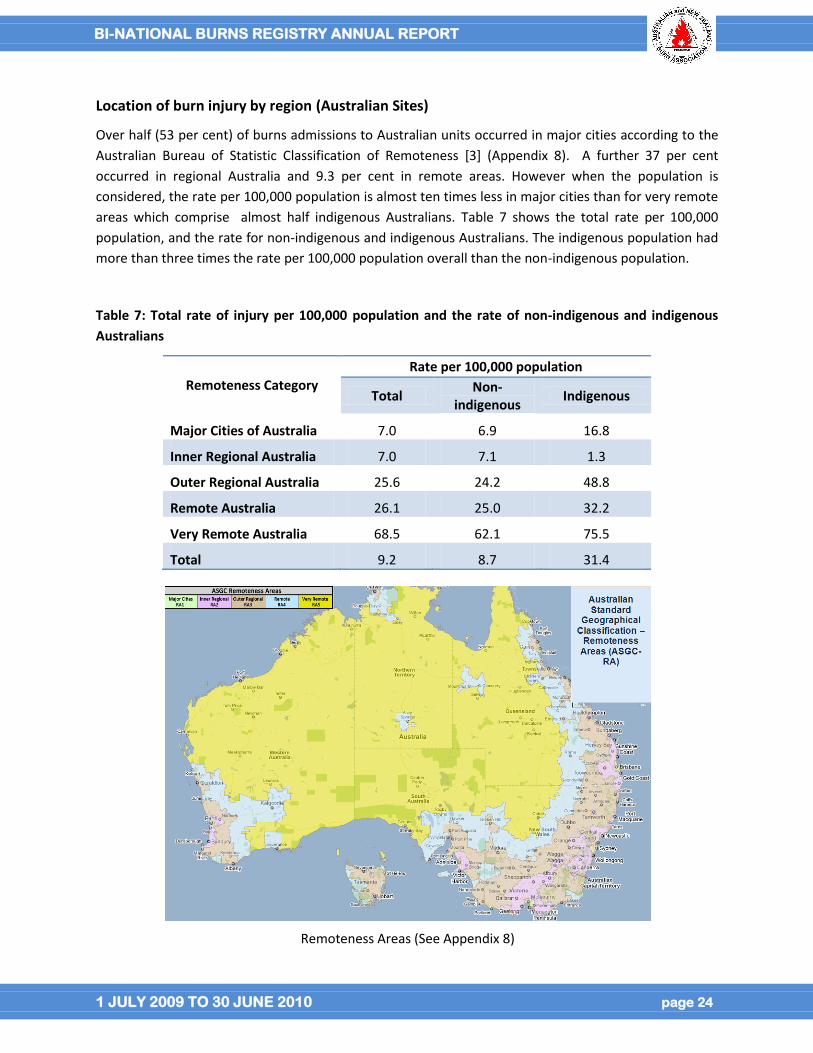
Location of burn injury by region (Australian Sites)
Over half (53 per cent) of burns admissions to Australian units occurred in major cities according to the
Australian Bureau of Statistic Classification of Remoteness [3] (Appendix 8). A further 37 per cent
occurred in regional Australia and 9.3 per cent in remote areas. However when the population is
considered, the rate per 100,000 population is almost ten times less in major cities than for very remote
areas which comprise almost half indigenous Australians. Table 7 shows the total rate per 100,000
population, and the rate for non-indigenous and indigenous Australians. The indigenous population had
more than three times the rate per 100,000 population overall than the non-indigenous population.
Table 7: Total rate of injury per 100,000 population and the rate of non-indigenous and indigenous
Australians
Remoteness Category
Rate per 100,000 population
Total Non-
indigenous Indigenous
Major Cities of Australia 7.0 6.9 16.8
Inner Regional Australia 7.0 7.1 1.3
Outer Regional Australia 25.6 24.2 48.8
Remote Australia 26.1 25.0 32.2
Very Remote Australia 68.5 62.1 75.5
Total 9.2 8.7 31.4
Remoteness Areas (See Appendix 8)
BI-NATIONAL BURNS REGISTRY ANNUAL REPORT
1 JULY 2009 TO 30 JUNE 2010 page 25
Burn injury severity
This section outlines the severity of burn by burn size (percentage total body surface area burnt, per
cent TBSA), burn depth and the presence of an inhalation injury.
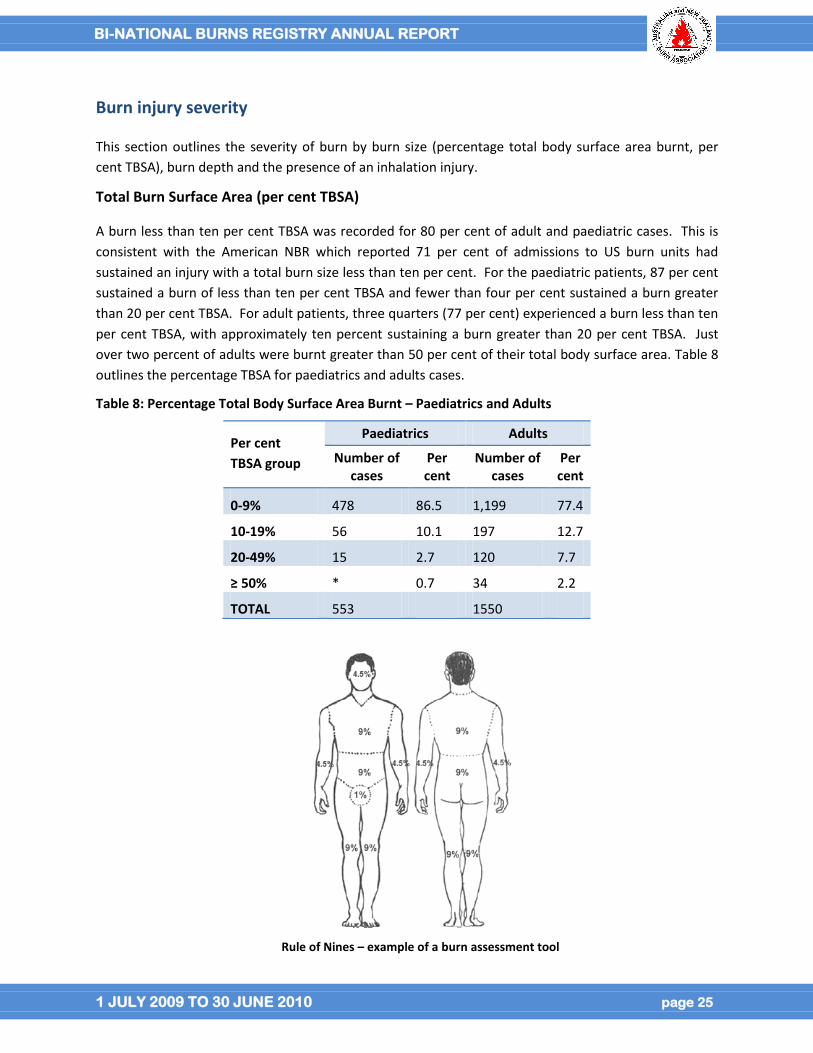
Total Burn Surface Area (per cent TBSA)
A burn less than ten per cent TBSA was recorded for 80 per cent of adult and paediatric cases. This is
consistent with the American NBR which reported 71 per cent of admissions to US burn units had
sustained an injury with a total burn size less than ten per cent. For the paediatric patients, 87 per cent
sustained a burn of less than ten per cent TBSA and fewer than four per cent sustained a burn greater
than 20 per cent TBSA. For adult patients, three quarters (77 per cent) experienced a burn less than ten
per cent TBSA, with approximately ten percent sustaining a burn greater than 20 per cent TBSA. Just
over two percent of adults were burnt greater than 50 per cent of their total body surface area. Table 8
outlines the percentage TBSA for paediatrics and adults cases.
Table 8: Percentage Total Body Surface Area Burnt – Paediatrics and Adults
Per cent
TBSA group
Paediatrics Adults
Number of cases
Per cent
Number of cases
Per cent
0-9% 478 86.5 1,199 77.4
10-19% 56 10.1 197 12.7
20-49% 15 2.7 120 7.7
≥ 50% * 0.7 34 2.2
TOTAL 553 1550
Rule of Nines – example of a burn assessment tool
BI-NATIONAL BURNS REGISTRY ANNUAL REPORT
1 JULY 2009 TO 30 JUNE 2010 page 26
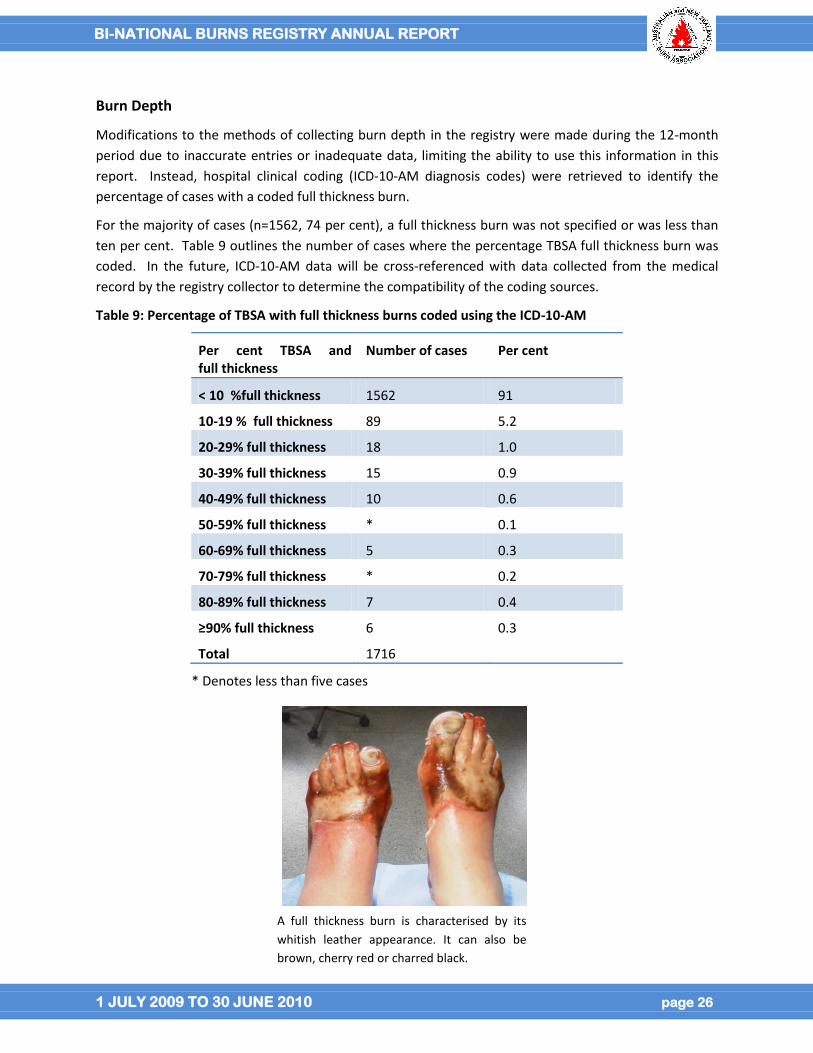
Burn Depth
Modifications to the methods of collecting burn depth in the registry were made during the 12-month
period due to inaccurate entries or inadequate data, limiting the ability to use this information in this
report. Instead, hospital clinical coding (ICD-10-AM diagnosis codes) were retrieved to identify the
percentage of cases with a coded full thickness burn.
For the majority of cases (n=1562, 74 per cent), a full thickness burn was not specified or was less than
ten per cent. Table 9 outlines the number of cases where the percentage TBSA full thickness burn was
coded. In the future, ICD-10-AM data will be cross-referenced with data collected from the medical
record by the registry collector to determine the compatibility of the coding sources.
Table 9: Percentage of TBSA with full thickness burns coded using the ICD-10-AM
Per cent TBSA and full thickness
Number of cases Per cent
< 10 %full thickness 1562 91
10-19 % full thickness 89 5.2
20-29% full thickness 18 1.0
30-39% full thickness 15 0.9
40-49% full thickness 10 0.6
50-59% full thickness * 0.1
60-69% full thickness 5 0.3
70-79% full thickness * 0.2
80-89% full thickness 7 0.4
≥90% full thickness 6 0.3
Total 1716
* Denotes less than five cases
A full thickness burn is characterised by its
whitish leather appearance. It can also be
brown, cherry red or charred black.
BI-NATIONAL BURNS REGISTRY ANNUAL REPORT
1 JULY 2009 TO 30 JUNE 2010 page 27
Inhalation injury
A documented inhalation injury was recorded for 8.5 per cent of adults and 1.5 per cent of paediatric cases. Approximately 70 per cent of patients who died experienced an inhalation injury.
Co-morbidities (Pre-existing medical conditions)
ICD-10-AM data were received from ten of the 11 sites contributing to this report. At least one co-
morbidity was coded for 702 cases with an overall total of 1435 co-morbidities reported. Appendix 6
describes the methodology for developing the co-morbidity codes.
Only eight per cent of paediatric cases and 48 per cent of adult cases had a co-morbidity recorded.
Males accounted for 70 per cent of cases with co-morbid conditions, consistent with the overall burn
gender distribution. The 16 to 34 year age group was the most represented with 248 (35 per cent) cases
having a documented co-morbid condition followed closely by 223 (32 per cent) cases in the 35 to 54
year age group. Table 10 shows the ten most common co-morbidities.
Table 10: Ten most common co-morbidities
Co-morbidity No. of cases Per cent
Tobacco use 362 19.2%
Dementia 124 6.6%
Hypertension 88 4.7%
Socioeconomic/psychosocial health hazards 68 3.6%
Diabetes 58 3.0%
Cardiac arrthythmias 39 2.1%
Stress and adjustment disorders 39 2.1%
Urinary tract infection 37 2.0%
Moderate or severe renal disease 36 1.9%
Delirium 33 1.8%
Current tobacco use was coded for 362 (19.2 per cent) cases and 124 burn cases had a pre-existing
diagnosis of dementia recorded (6.6 per cent). Cardiac, renal conditions and diabetes were also
recorded in the ten most common co-morbidities as was socio-economic/psycho-social and stress
related conditions. Tobacco use was the only comorbidity in 61 per cent of the 16 to 34 year age group
and 40 per cent of the 35 to 54 year age group.
Further work is planned to more accurately distinguish co-morbidities from complications, by reviewing
the use of a qualifying prefix in some jurisdictions, as well as the identification and review of overlapping
codes. This analysis will provide further scope to understand the influence of co-morbidities on burn
care provided and outcomes.

BI-NATIONAL BURNS REGISTRY ANNUAL REPORT
1 JULY 2009 TO 30 JUNE 2010 page 28
How were the burns patients managed prior to admission to the burns unit?
This section describes the pre-hospital phase and burn cooling response, the referral process and
transfer times. Quality indicator data associated with the standard of care documented are also
provided. Data in this section is limited by changes made to registry data collection procedures over the
12-month period to improve completeness and data quality. Data from this and future reports will
guide the establishment of suitable standards of care across Australia and New Zealand.
Burn Cooling
Burn cooling is critical in the initial first aid response to a burn injury.
Applying cool running water to the burn for 20 minutes within three
hours of the injury is considered best practice in terms of reducing the
area of skin affected by the burn, the depth of the burn and for pain
management [9-11]. While applying water for a longer period than 20
minutes can have an analgesic effect on small burns, the symptoms of
hypothermia need to be monitored, particularly in larger burns [9, 10,
12, 13].
Inadequate burn cooling treatments continue to be used at the scene
of the burn injury such as application of ice, aloe vera, butter, creams
and toothpaste. Burn cooling techniques other than cool running
water are not recommended for the first aid management of a burn
injury.
Most of the paediatric cases (80 per cent) and over half of the adult cases (60 per cent) had documented
burn cooling at the scene of the burn injury. Of these cases, cool running water was documented as
being used in 91 per cent of paediatric cases and 88 per cent of adult cases. Table 11 outlines the
nature of documented burn cooling completed at the scene of injury.
Table 11: Documented Burn cooling completed at the scene of injury
Scene of injury Paediatrics cases Adult cases
Cool running water 386 (91%) 681 (87.5%)
Within three hours of injury 376 (99.7%) 653 (97%)
Applied 11-20 minutes 90 (25%) 163 (29%)
Water was documented as being applied to the burn within three hours of injury in 98 per cent of cases.
Water was applied for eleven to 20 minutes in 25 per cent of paediatric cases and 29 per cent of adult
cases. For 40 per cent of paediatric cases and 47 per cent of adult cases, cool running water was applied
for greater than 20 minutes. Of these cases, 76 per cent were burns less than ten per cent TBSA.
BI-NATIONAL BURNS REGISTRY ANNUAL REPORT
1 JULY 2009 TO 30 JUNE 2010 page 29
Techniques other than water were documented for burn cooling in 23 per cent of cases. In some cases
this is because cool running water was not available.
For example, hydrogel was the predominant cooling technique (72 per cent) used by paramedics which
could be explained by the inability to apply running water during transit.
The most common ‘other’ cooling techniques documented as used at the scene of injury included;
application of wet cloths such as towels, dressings and blankets, immersion in water. Use of ice and ice
packs, aloe vera, butter, and toothpaste were also reported but are not recommended as effective or
appropriate first aid for burn injury.
What was the referral source to the burns unit?
Direct transport from the scene of injury via ambulance to the burns unit occurred for 30 per cent of
paediatric cases and 32 per cent of adult cases. Self-referral to the burns unit, where the injured person
self presented to the hospital emergency department accounted for approximately eight per cent of
both paediatric and adult cases. Just under half of both paediatric (46 per cent) and adult cases (49 per
cent) were referred to the burns unit from another hospital.
How long did it take for the burn patient to be admitted to a burns unit?
The time taken for a burn patient to be admitted from the scene of the burn injury to the burns unit is
considered critical for the initial medical and surgical management of burn injuries. Given the
centralised structure of burn care services across Australia and New Zealand, and the geographical size
and distances required to travel to a burns unit, identifying a standardised acceptable transfer time for
benchmarking has been challenging. The registry therefore collects data on the length of time taken to
admission from time of injury and reasons why admission to a burns unit is greater than two hours. This
data will assist in developing an acceptable time frame for transfer to a burns unit, identify if pre burn
unit care was appropriate and monitor outcomes of care where there have been transfer delays.
The median time in hours from injury to admission to the burns unit for cases with complete date and
time data was nine hours (range 3-229) for paediatric patients and eight (range 3-50) hours for adult
patients.
There were 356 paediatric cases (64 per
cent) and 754 (49 per cent) adults cases with
complete data who were admitted to the
burns unit more than two hours after injury.
For those patients transferred from another
hospital, 706 (70 per cent) were admitted
two hours or greater after injury. Nearly half
(41 per cent) of these patients were
transferred greater than 24 hours after
injury. For patients transferred from the
BI-NATIONAL BURNS REGISTRY ANNUAL REPORT
1 JULY 2009 TO 30 JUNE 2010 page 30
scene of injury to the burns unit, 38 per cent were admitted within two hours of injury with 60 per cent
of all cases transported within 24 hours of injury. The most common reason (20 per cent) for delay in
admission was reported to be the distance between the geographical locations of the burn injury to the
burns unit.
For the 2010 to 2011 reporting period, more detailed data are being collected to establish the reasons
for delays in transport to burn units. This will assist in informing the standardised time frame for
admissions that care can be measured against.
Burn unit performance
The following section outlines burns until performance and reports quality of care data for established
processes of care. Data from this and future reports will be instrumental in developing standards of
acceptable performance for burns care across the region.
Wound assessment
The definitive burn wound assessment is defined as the burn
assessment documented by the most senior burns clinician
within 72 hours of admission.
Over three quarters (76 per cent) of paediatric cases and 64
per cent of adult cases had their definitive burn wound
assessment documented within 72 hours of admission to
hospital. For paediatric cases, the burn registrar recorded
the burn wound assessment within 72 hours of admission for 40 per cent of cases, followed by the burn
consultant (19 per cent) and the senior burn nurse (16 per cent. For adult cases, the burn registrar
documented the burn wound assessment for 23 per cent of cases followed by the burn consultant (20
per cent) and the burn clinical nurse specialist/nurse practitioner (15 per cent).
Burns surgeon assessment
It is common practice that more serious burns are assessed and managed by a senior burn clinician. For
paediatric patients with large burns (defined as greater than 10 per cent TBSA) a senior burn clinician
assessment was documented in 63 per cent of cases. Documentation of this assessment occurred
within 24 hours of admission for 44 per cent of paediatric cases. For adult cases with large burns
(defined as greater than fifteen per cent TBSA), a senior burn clinician assessment was documented in
77 per cent of cases. This assessment occurred within 24 hours of admission for 51 per cent of adult
cases. Where there was a documented inhalation injury, a senior burn clinician assessment was
recorded for 71 per cent of paediatric cases and 73 per cent of adult cases.
BI-NATIONAL BURNS REGISTRY ANNUAL REPORT
1 JULY 2009 TO 30 JUNE 2010 page 31
Theatre for burn wound excision
Nearly three quarters (71 per cent) of
paediatric cases underwent a burn wound
management procedure in theatre. Of these
cases 64 per cent had skin grafting. For adult
cases, 80 per cent underwent a burn wound
management procedure with 65 per cent
receiving skin grafts. Further analysis of the
type of grafting will be possible in future
reports.
BI-NATIONAL BURNS REGISTRY ANNUAL REPORT
1 JULY 2009 TO 30 JUNE 2010 page 32
The 10 most common burn wound management procedures
The ICD-10-AM procedure codes provide information about
the wound procedures used for management of admitted burn
patients (Table 12). These procedures include those
completed outside theatre and those completed when the
patient was re-admitted. Burn wound management
procedures during re-admission accounted for only five
percent of all procedures with all but five of these procedures
occurring within 28 days of discharge of the first admission.
Table 12: Ten most common ICD-10-AM Burn Wound
Management Procedure Codes
ICD-10 Block Procedure Code
Block description No. of instances
Per cent of procedures
1644 Split skin graft to burn of other sites 806 25
1600 Dressing of burn 672 21
1640 Allograft, xenograft or synthetic skin graft 543 16.8
1627 Debridement of burn 540 16.7
1643 Split skin graft to burn of specific sites 474 14.6
1648 Full thickness skin graft to burn 88 2.7
1641 Split skin graft to granulating burn site 42 1.3
1607 Release of skin and subcutaneous tissue 30 0.9
1448 Amputation of wrist, hand or digit 18 0.6
1533 Amputation of ankle or foot 7 0.2
Comparison with the ten most common procedure codes reported by the American NBR is limited as
American health services use version 9 of the Internal Classification of Disease and Procedures (ICD-9)
while across Australia and New Zealand, ICD-10 is used.
BI-NATIONAL BURNS REGISTRY ANNUAL REPORT
1 JULY 2009 TO 30 JUNE 2010 page 33
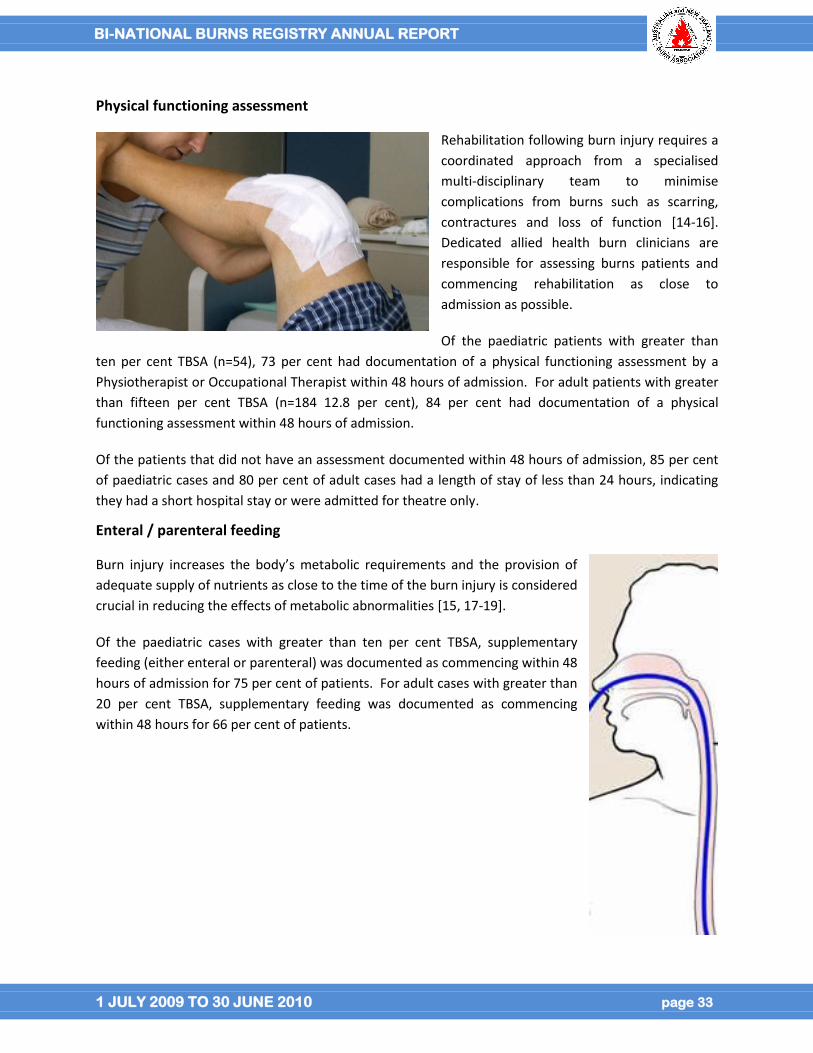
Physical functioning assessment
Rehabilitation following burn injury requires a
coordinated approach from a specialised
multi-disciplinary team to minimise
complications from burns such as scarring,
contractures and loss of function [14-16].
Dedicated allied health burn clinicians are
responsible for assessing burns patients and
commencing rehabilitation as close to
admission as possible.
Of the paediatric patients with greater than
ten per cent TBSA (n=54), 73 per cent had documentation of a physical functioning assessment by a
Physiotherapist or Occupational Therapist within 48 hours of admission. For adult patients with greater
than fifteen per cent TBSA (n=184 12.8 per cent), 84 per cent had documentation of a physical
functioning assessment within 48 hours of admission.
Of the patients that did not have an assessment documented within 48 hours of admission, 85 per cent
of paediatric cases and 80 per cent of adult cases had a length of stay of less than 24 hours, indicating
they had a short hospital stay or were admitted for theatre only.
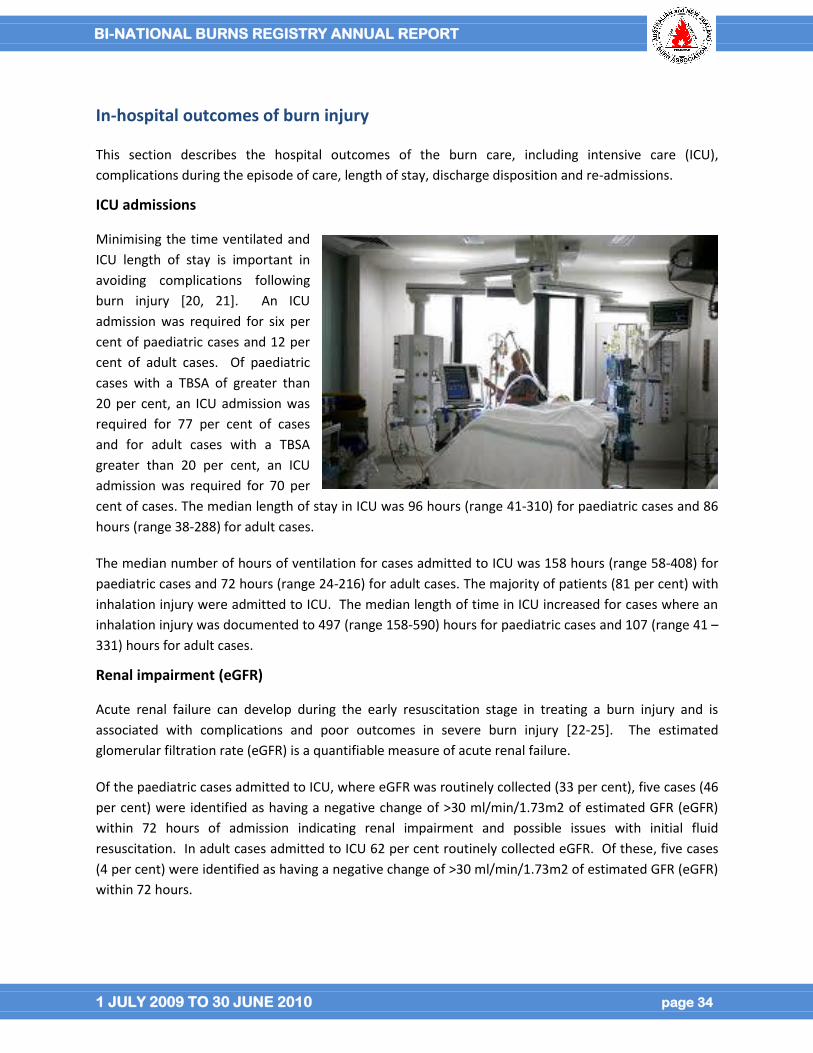
Enteral / parenteral feeding
Burn injury increases the body’s metabolic requirements and the provision of
adequate supply of nutrients as close to the time of the burn injury is considered
crucial in reducing the effects of metabolic abnormalities [15, 17-19].
Of the paediatric cases with greater than ten per cent TBSA, supplementary
feeding (either enteral or parenteral) was documented as commencing within 48
hours of admission for 75 per cent of patients. For adult cases with greater than
20 per cent TBSA, supplementary feeding was documented as commencing
within 48 hours for 66 per cent of patients.
BI-NATIONAL BURNS REGISTRY ANNUAL REPORT
1 JULY 2009 TO 30 JUNE 2010 page 34
In-hospital outcomes of burn injury
This section describes the hospital outcomes of the burn care, including intensive care (ICU),
complications during the episode of care, length of stay, discharge disposition and re-admissions.
ICU admissions
Minimising the time ventilated and
ICU length of stay is important in
avoiding complications following
burn injury [20, 21]. An ICU
admission was required for six per
cent of paediatric cases and 12 per
cent of adult cases. Of paediatric
cases with a TBSA of greater than
20 per cent, an ICU admission was
required for 77 per cent of cases
and for adult cases with a TBSA
greater than 20 per cent, an ICU
admission was required for 70 per
cent of cases. The median length of stay in ICU was 96 hours (range 41-310) for paediatric cases and 86
hours (range 38-288) for adult cases.
The median number of hours of ventilation for cases admitted to ICU was 158 hours (range 58-408) for
paediatric cases and 72 hours (range 24-216) for adult cases. The majority of patients (81 per cent) with
inhalation injury were admitted to ICU. The median length of time in ICU increased for cases where an
inhalation injury was documented to 497 (range 158-590) hours for paediatric cases and 107 (range 41 –
331) hours for adult cases.
Renal impairment (eGFR)
Acute renal failure can develop during the early resuscitation stage in treating a burn injury and is
associated with complications and poor outcomes in severe burn injury [22-25]. The estimated
glomerular filtration rate (eGFR) is a quantifiable measure of acute renal failure.
Of the paediatric cases admitted to ICU, where eGFR was routinely collected (33 per cent), five cases (46
per cent) were identified as having a negative change of >30 ml/min/1.73m2 of estimated GFR (eGFR)
within 72 hours of admission indicating renal impairment and possible issues with initial fluid
resuscitation. In adult cases admitted to ICU 62 per cent routinely collected eGFR. Of these, five cases
(4 per cent) were identified as having a negative change of >30 ml/min/1.73m2 of estimated GFR (eGFR)
within 72 hours.
BI-NATIONAL BURNS REGISTRY ANNUAL REPORT
1 JULY 2009 TO 30 JUNE 2010 page 35
Complications
Table 13 outlines the ten most common complications experienced by admitted burn patients, as
sourced from hospital ICD-10-AM coding. As noted for the procedure codes, direct comparison with the
American NBR is limited by the version of ICD coding used across the regions.
Table 13: ICD-10 Ten most common complications codes
ICD-10 Complication description No. of instances
Other disorders of fluid, electrolyte and acid-base balance 89
Hypertensive disease 76
Cellulites 72
Other sepsis 55
Volume depletion 51
Pneumonia 50
Hypotension 39
Fever of other and unknown origin 39
Blood cultures
Bloodstream infections increase the risk of complications and
mortality in burn injured patients [26, 27]. A positive blood
culture was identified for 26 (6.5 per cent) paediatric cases
and 36 (5 per cent) adult cases. Of the cases that had a
positive blood culture during their admission and wound
swabs were taken on admission (n=47), eight paediatric cases
and 11 adult cases had positive wound cultures taken on
admission.
BI-NATIONAL BURNS REGISTRY ANNUAL REPORT
1 JULY 2009 TO 30 JUNE 2010 page 36
Weight recorded and weight loss
Measuring the patients’ weight is important for the initial
fluid resuscitation of the burn patient and for monitoring
weight loss. Weight loss is a complication following burn
injury that can affect patient outcomes in terms of healing
potential [15, 18, 28]. Patients with an extended length of
stay are more at risk of weight loss and therefore poorer
outcomes.
Of the paediatric patients with a length of stay greater than
two weeks (9 per cent), 72 per cent had their weight
measured and documented within three to five days of
admission, and 55 per cent had a weekly weight
documented during their admission. Weight loss was
recorded in four paediatric patients ranging from 0.2kg – 14kg.
For adult cases with a length of stay greater than two weeks (20 per cent), 58 per cent had their weight
measured and documented within three to five days of admission. A weekly weigh was conducted and
documented for 67 per cent of these patients. Weight loss was recorded in 23 (21 per cent) cases with
the range of loss between 0.1kg-20kg.
BI-NATIONAL BURNS REGISTRY ANNUAL REPORT
1 JULY 2009 TO 30 JUNE 2010 page 37
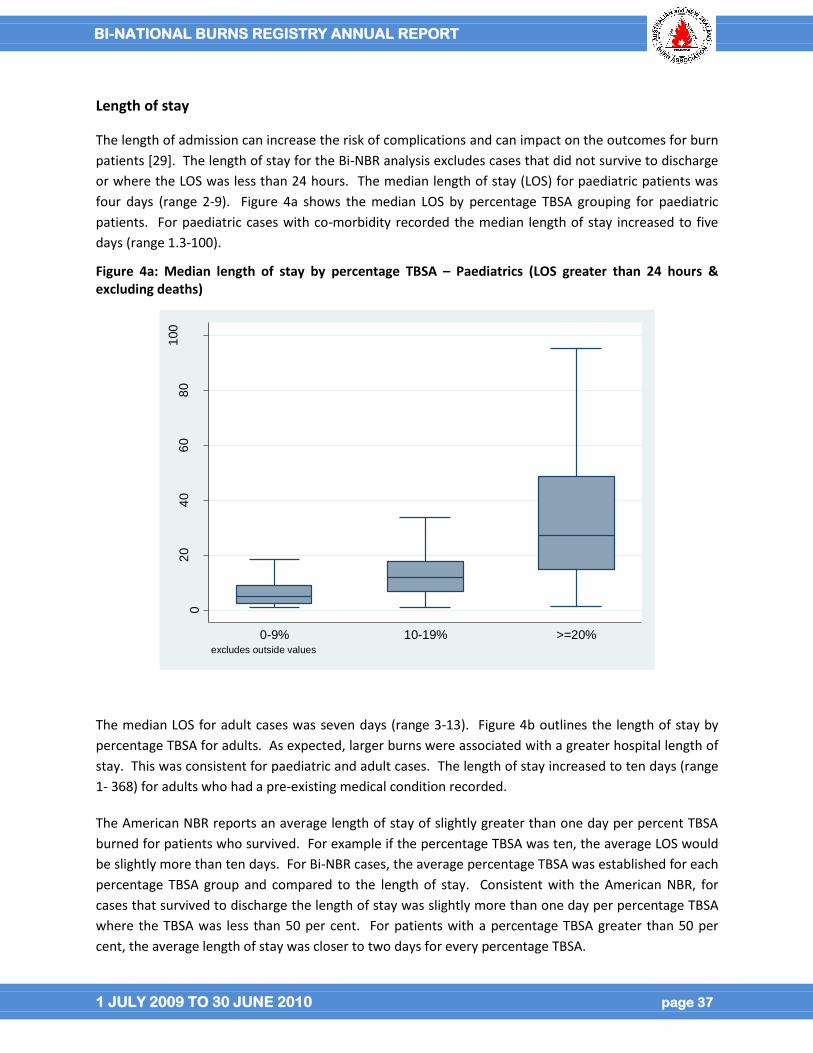
Length of stay
The length of admission can increase the risk of complications and can impact on the outcomes for burn
patients [29]. The length of stay for the Bi-NBR analysis excludes cases that did not survive to discharge
or where the LOS was less than 24 hours. The median length of stay (LOS) for paediatric patients was
four days (range 2-9). Figure 4a shows the median LOS by percentage TBSA grouping for paediatric
patients. For paediatric cases with co-morbidity recorded the median length of stay increased to five
days (range 1.3-100).
Figure 4a: Median length of stay by percentage TBSA – Paediatrics (LOS greater than 24 hours & excluding deaths)
02
04
06
08
01
00
LO
Sd
ays
0-9% 10-19% >=20%excludes outside values
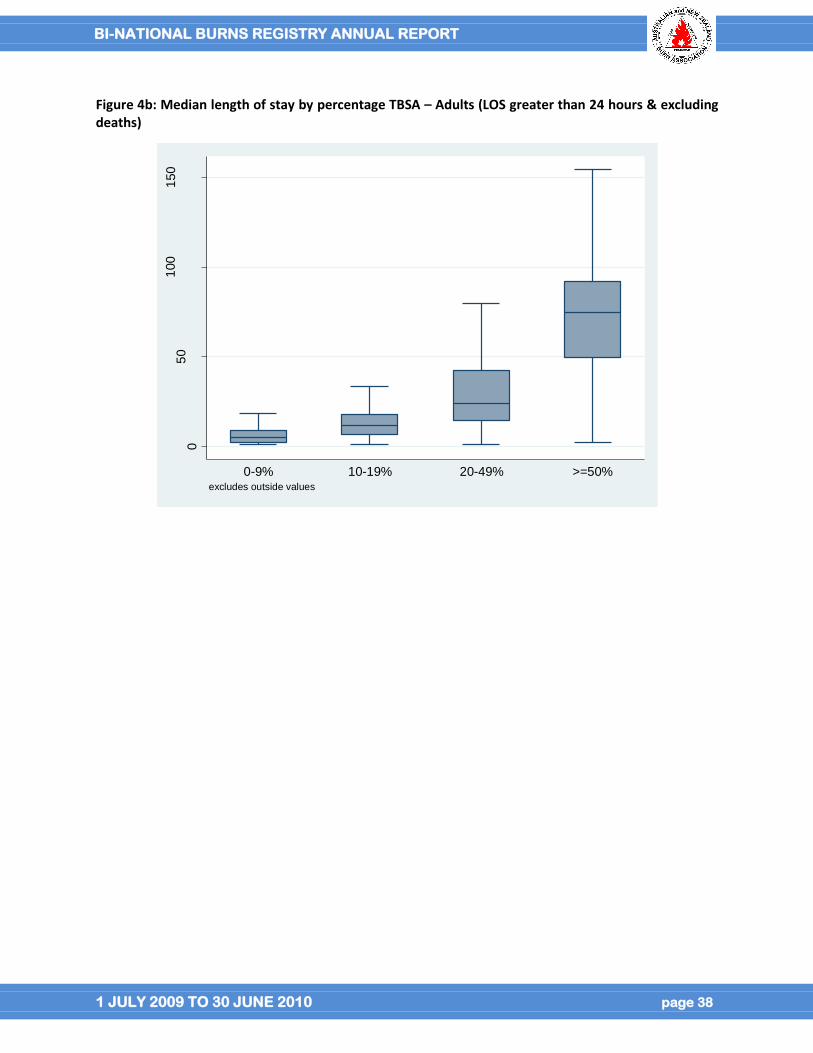
The median LOS for adult cases was seven days (range 3-13). Figure 4b outlines the length of stay by
percentage TBSA for adults. As expected, larger burns were associated with a greater hospital length of
stay. This was consistent for paediatric and adult cases. The length of stay increased to ten days (range
1- 368) for adults who had a pre-existing medical condition recorded.
The American NBR reports an average length of stay of slightly greater than one day per percent TBSA
burned for patients who survived. For example if the percentage TBSA was ten, the average LOS would
be slightly more than ten days. For Bi-NBR cases, the average percentage TBSA was established for each
percentage TBSA group and compared to the length of stay. Consistent with the American NBR, for
cases that survived to discharge the length of stay was slightly more than one day per percentage TBSA
where the TBSA was less than 50 per cent. For patients with a percentage TBSA greater than 50 per
cent, the average length of stay was closer to two days for every percentage TBSA.
BI-NATIONAL BURNS REGISTRY ANNUAL REPORT
1 JULY 2009 TO 30 JUNE 2010 page 38
Figure 4b: Median length of stay by percentage TBSA – Adults (LOS greater than 24 hours & excluding deaths)
05
01
00
150
LO
Sd
ays
0-9% 10-19% 20-49% >=50%excludes outside values
BI-NATIONAL BURNS REGISTRY ANNUAL REPORT
1 JULY 2009 TO 30 JUNE 2010 page 39
Deaths
Overall the registry recorded 33 deaths in the 2103 burn cases submitted to the registry. This
corresponds to an overall death rate of 1.6 percent amongst the hospitalised burn patients meeting the
registry inclusion criteria. This death rate is lower than the reported American NBR death rate of 3.2 per
cent.
As would be expected, the likelihood of death increases with burn size. The death rate was 0.2 per cent
for cases with a TBSA less than ten per cent. This is lower than the American NBR which recorded a
death rate of 0.6 per cent for TBSA less than ten per cent group. The death rate increased to 18 per cent
in cases with a TBSA greater than 20 per cent TBSA, and 55 per cent in cases with a TBSA greater than 50
per cent.
Of the patients who died, an inhalation injury was present in 18 (19 per cent). A reason for death was
recorded for 88 per cent of cases and nearly half (48 per cent) succumbed to multi-system organ failure.
BI-NATIONAL BURNS REGISTRY ANNUAL REPORT
1 JULY 2009 TO 30 JUNE 2010 page 40
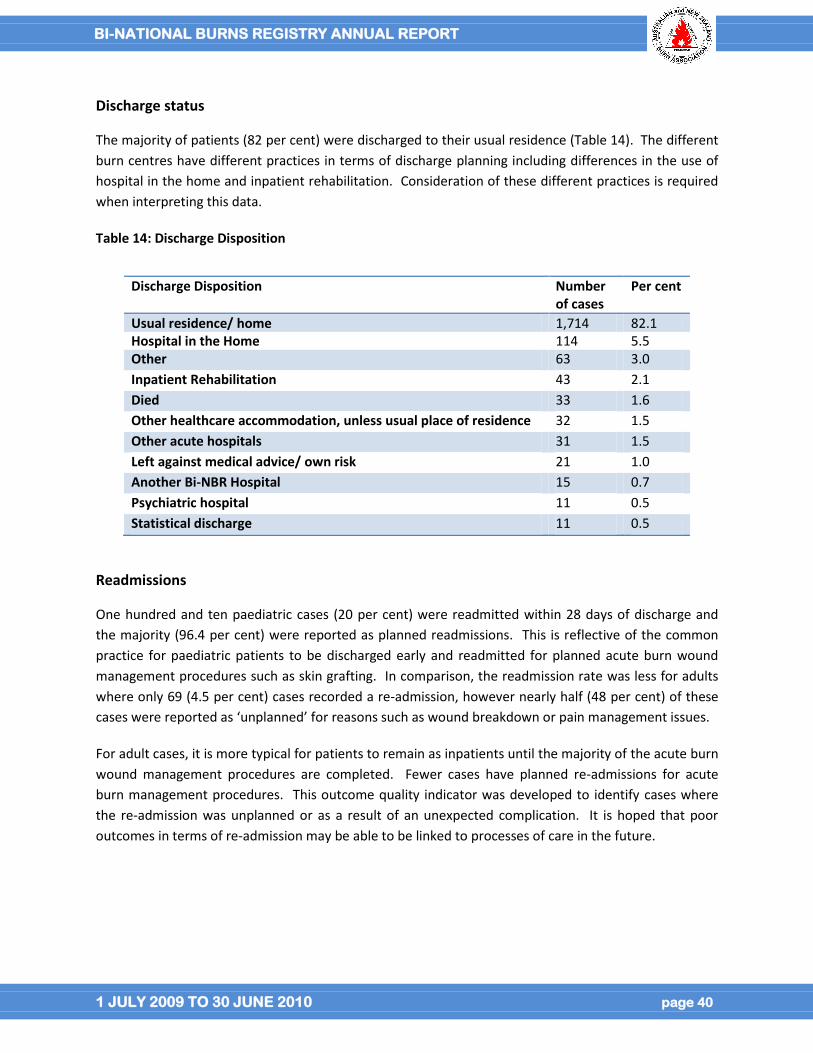
Discharge status
The majority of patients (82 per cent) were discharged to their usual residence (Table 14). The different
burn centres have different practices in terms of discharge planning including differences in the use of
hospital in the home and inpatient rehabilitation. Consideration of these different practices is required
when interpreting this data.
Table 14: Discharge Disposition
Readmissions
One hundred and ten paediatric cases (20 per cent) were readmitted within 28 days of discharge and
the majority (96.4 per cent) were reported as planned readmissions. This is reflective of the common
practice for paediatric patients to be discharged early and readmitted for planned acute burn wound
management procedures such as skin grafting. In comparison, the readmission rate was less for adults
where only 69 (4.5 per cent) cases recorded a re-admission, however nearly half (48 per cent) of these
cases were reported as ‘unplanned’ for reasons such as wound breakdown or pain management issues.
For adult cases, it is more typical for patients to remain as inpatients until the majority of the acute burn
wound management procedures are completed. Fewer cases have planned re-admissions for acute
burn management procedures. This outcome quality indicator was developed to identify cases where
the re-admission was unplanned or as a result of an unexpected complication. It is hoped that poor
outcomes in terms of re-admission may be able to be linked to processes of care in the future.
Discharge Disposition Number of cases
Per cent
Usual residence/ home 1,714 82.1 Hospital in the Home 114 5.5 Other 63 3.0
Inpatient Rehabilitation 43 2.1
Died 33 1.6
Other healthcare accommodation, unless usual place of residence 32 1.5
Other acute hospitals 31 1.5
Left against medical advice/ own risk 21 1.0
Another Bi-NBR Hospital 15 0.7
Psychiatric hospital 11 0.5
Statistical discharge 11 0.5
BI-NATIONAL BURNS REGISTRY ANNUAL REPORT
1 JULY 2009 TO 30 JUNE 2010 page 41
Limitations and data caveats
Only cases meeting the Bi-NBR inclusion criteria are included in reports
Only the first acute admission that meets the Bi-NBR inclusion criteria for a new burn injury is
included in reporting. Readmissions (within 28 days of discharge) are excluded except when
reported separately in the final section. If a patient is transferred between Bi-NBR hospitals,
only the initial admission is included.
Each record in the database represents a new burn injury. If an individual sustains multiple burn
injuries on different occasions, they are included as separate records.
Only valid responses to data items are included in the analysis. Missing data and items that
have been classified as “not stated/inadequately described” are reported on for completeness
but excluded from analysis. Data items recorded as “not collected for this patient”, “not
collected at this site” are identified separately in the completeness report.
Numbers with values less than five have been replaced by an asterisk (*) as a privacy protection
measure
Dataset changes were required during the 2009 to 2010 reporting year to improve data
completeness and data quality. This has limited the ability to report data on all data items in
this report.
Reporting against the clinical quality indicators that have been developed is limited by the fact
that standards of acceptable care have yet to be developed for many of the quality indicators.
Data from this report and future reports will be used to develop standards of acceptable quality
of care performance that will be monitored and benchmarked in the future.
Participation remains a limitation of the Bi-NBR. Until there is near complete site participation,
caution is required when using the registry data as it cannot provide definitive figures for
monitoring the health care provided.
Ten of the 11 sites provided ICD-10-AM and admission data to ascertain the rate of case
capture. Identifying whether cases met the Bi-NBR inclusion criteria was limited by the inability
to determine the primary diagnosis and treating unit for all cases. All cases with a burns
diagnostic code were included which may under estimate the case capture rate. Whilst the
analysis compared all admissions including re-admission, the re-admissions greater than 28 days
after discharge could not be isolated in the case capture data. Hence the reported case capture
rate may also be under estimated.
BI-NATIONAL BURNS REGISTRY ANNUAL REPORT
1 JULY 2009 TO 30 JUNE 2010 page 42
Conclusion
The overall goal of the Bi-NBR is to monitor burn injury incidence and causation and to encourage higher
standards of burn injury prevention and patient care across Australia and New Zealand. The launch of
the revised Bi-NBR in July 2009 provides the best opportunity to date to achieve these aims.
Data are presented for 2103 burn cases admitted to 11 of the 17 designated Burns Units across both
Australia and New Zealand for the 12-month period July 2009 to June 2010. It is estimated that this
corresponds to 97 per cent of burns admissions to the ten burns units that provided hospital
administrative data for case capture comparison.
Data completeness is 95 to 100 per cent for the majority of core data items including the patient, burn
event, admission, percentage TBSA, ICU and discharge details and continues to improve for all items.
Descriptive statistics were performed for the majority of data elements. Epidemiological data indicate
males aged 20 to 29 years are at high risk of sustaining a flame burn injury and children one year of age
are at risk of sustaining a scald burn injury. Injury prevention campaigns should be targeted at these age
groups and burn causes.
Cool running water was documented as being applied within three hours of injury for 98 per cent of all
cases that received burn cooling at the scene of injury. Where an injury requiring admission to a burns
unit occurred, the vast majority of burns were less than ten per cent TBSA. However, nearly three
quarters of all cases required theatre for a burn wound management procedure, indicating the severity
of even the smaller burns and importance of injury prevention campaigns.
The data presented suggests similarities in patient age, sex, burn cause, and place of injury with that
reported in the American Burn Association, NBR. Differences were seen in overall mortality rates and
length of hospital stay for patients with a percentage TBSA of greater than 50.
While quality of care data was presented in this report, comparisons against an acceptable standard of
performance are not possible until future annual reports. More detailed analysis of trends will also be
possible as the volume of Bi-NBR cases and site participation increases. An executive summary is
presented at the beginning of the report.
BI-NATIONAL BURNS REGISTRY ANNUAL REPORT
1 JULY 2009 TO 30 JUNE 2010 page 43
References
[1] Australian Commission on Quality and Safety in Health Care. Operating Principles and Technical
Standards for Australian Clinical Quality Registries. Available at:
http://www.safetyandquality.gov.au/internet/safety/publishing.nsf/Content/PriorityProgram-
08_CQRegistries. Accessed 20 June 2010.
[2] American Burn Association. National Burn Repository, 2010 Version 6. Available at:
http://www.ameriburn.org/2010NBRAnnualReport.pdf. Accessed February 2011.
[3] Australian Bureau of Statistics. Australian Standard Geographical Classification (ASGC)
correspondence file concording 2006 (POA) to 2006 Remoteness Areas (RA). In: Section AG, editor.2006.
[4] Mahar P, Wasiak J, Bailey M, Cleland H. Clinical factors affecting mortality in elderly burn patients
admitted to a burn service. Burns. 2008;34:629-36.
[5] Lundgren R, Kramer CB, Rivara F, Wang J, Heimbach D, Gibran N, et al. Influence of Comorbidities
and Age on Outcome Following Burn Injury in Older Adults. Journal of Burn Care & Research.
2009;30:307-14.
[6] Thombs B, Singh V, Halonen J, Diallo A, Milner S. The Effects of Preexisting Medical Comorbidities on
Mortality and Length of Hospital Stay in Acute Burn Injury. Annuals of Surgery. 2007;245:629-43.
[7] Charlson M, Pompei P, Ales K, MacKenzie C. A new method of classifying prognostic comorbidity in
longitudinal studies: development and validation. J Chron Dis. 1987;40.
[8] Commonwealth of Australia. The International Statistical Classification of Disease and Related Health
Problems (ICD-10-AM). National Centre for Classification in Health; 2008.
[9] Bartlett N, Yuan J, Holland AJ, Harvey JG, Martin HC, La Hei ER, et al. Optimal Duration of Cooling for
an Acute Scald Contact Burn Injury in a Porcine Model. J Burn Care Res. 2008;29.
[10] Yuan J, Wu C, Holland AJ, Harvey JG, Martin HC, La Hei ER, et al. Assessment of Cooling on an Acute
Scald Burn Injury in a Porcine Model. J Burn Care Res. 2007;28.
[11] Cuttle L, Kempf M, Liu P-Y, Kravchuk O, Kimble RM. The optimal duration and delay of first aid
treatment for deep partial thickness burn injuries. Burns. 2010;36:673-9.
[12] Cuttle L, Kempf M, Kravchuk OP, Phillips GE, Mill J, Wang X-Q, et al. The optimal temperature of first
aid treatment for partial thickness burn injuries. Wound Repair Regen. 2008;16.
[13] Cuttle L, Pearn J, McMillan JR, Kimble RM. A review of first aid treatments for burn injuries. Burns.
2009;doi: 10.1016/j.burns.2008.10.011.
BI-NATIONAL BURNS REGISTRY ANNUAL REPORT
1 JULY 2009 TO 30 JUNE 2010 page 44
[14] Al-Mousawi AM, Mecott-Rivera GA, Herndon DN. Burn Teams and Burn Centers: The Importance of
a Comprehensive Team Approach to Burn Care. Clin Plast Surg. 2009;36:547-54.
[15] Australian and New Zealand Burn Association. Burn Survivor Rehabilitation: Principles and
Guidelines for the Allied Health Professional. Available at: http://www.anzba.org.au/. Accessed 17th
January 2011.
[16] Jarrett M, McMahon M, Stiller K. Physical Outcomes of Patients With Burn Injuries - A 12 Month
Follow-Up. Journal of Burn Care & Research. 2008;29:975-84.
[17] Wasiak J, Cleland H, Jeffery R. Early versus delayed enteral nutrition support for burn injuries
(Review). Cochrane Database Syst Rev. 2006;Art. No.: CD005489.DOI:
10.1002/14651858.CD005489.pub2.
[18] Khorasani EN, Mansouri F. Effect of early enteral nutrition on morbidity and mortality in children
with burns. Burns. 2010;doi:10.1016/j.burns.2009.12.05.
[19] Prelack K, Dylewski M, Sheridan R. Practical guidelines for nutritional management of burn injury
and recovery. Burns. 2007;33:14-24.
[20] Palmieri T. What's New in Critical Care of the Burn-Injured Patient? Clin Plast Surg. 2009;36:607-15.
[21] Wang Y, Tang H-T, Xia Z-F, Zhu S-H, Ma B, Wei W, et al. Factors affecting survival in adult patients
with massive burns. Burns. 2010;36:57-64.
[22] Mosier MJ, Pham TN, Klein MB, Gibran NS, Arnoldo BD, Gamelli RL, et al. Early Acute Kidney Injury
Predicts Progressive Renal Dysfunction and Higher Mortality in Severely Burned Adults. J Burn Care Res
2010;31:83-92.
[23] Palmieri T, Lavrentieva A, Greenhalgh DG. Acute kidney injury in critically ill burn patients. Risk
factors, progression and impact on mortality. Burns. 2010;36:205-11.
[24] Mitra B, Fitzgerald M, Cameron P, Cleland H. Fluid Resuscitation in Major Burns. ANZ J Surg.
2006;76:35-8.
[25] Latenser B. Critical care of the burn patient: The first 48 hours. Crit Care Med. 2009;37:2819-26.
[26] Guo F, Chen X-L, Wang Y-J, Wang F, Chen X-Y, Sun Y-X. Management of burns for over 80 per cent of
total body surface area: A comparative study. Burns. 2009;35:210-4.
[27] Shupp JW, Pavlovich AR, Jeng JC, Pezzullo JC, Oetgen WJ, Jaskille AD, et al. Epidemiology of
Bloodstream Infections in Burn-Injured Patients: A Review of the National Burn Repository. J Burn Care
Res. 2010;31.
BI-NATIONAL BURNS REGISTRY ANNUAL REPORT
1 JULY 2009 TO 30 JUNE 2010 page 45
[28] Jacobs DG, Jacobs DO, Kudsk KA, Moore FA, Oswanski MF, Poole GV, et al. Practice Management
Guidelines for Nutritional Support of the Trauma Patient. J Trauma. 2004;57.
[29] Pereira C, Murphy K, Herndon D. Outcome measures in burn care. Is mortality dead? Burns.
2004;30:761-71.
[30] New South Wales Health. Clinical Practice Guidelines: Burn Wound Management. Available at:
http://www.health.nsw.gov.au/gmct/burninjury/guidelines.asp. Accessed 28 March.
[31] Australian Institute of Health and Welfare. METeOR Available at: http://meteor.aihw.gov.au.
Accessed 9 May 2010.
[32] Gabbe B, Magtengaard K, Hannaford A, Cameron P. Is the Charlson Comorbidity Index Useful for
Predicting Trauma Outcomes? Acad Emerg Med. 2005;12.
[33] Li B, Evans D, Faris P, Stafford D, Hude Q. Rosk adjustment performance of Charlson and Elixhauser
comorbidities in ICD-9 and ICD-10 administrative databases. BMC Health Services Research. 2008;8.
[34] Kidney Health Australia. The eGFR Calculator (estimated Glomerular Filtration Rate). Available at:
http://www.kidney.org.au/HealthProfessionals/eGFRClinicalTools/tabid/632/Default.aspx. Accessed
28 March.
[35] New Zealand Government. Statistics New Zealand. Available at:
http://www.stats.govt.nz/surveys_and_methods/methods/classifications-and-
standards/classification-related-stats-standards/ethnicity/definition.aspx. Accessed 28 March
[36] Carr J, Phillips B, Bowling W. The Utility of Bronchoscopy After Inhalation Injury Complicated by
Pneumonia in Burn Patients: Results From the National Burn Repository. Journal of Burn Care &
Research. 2009;30:967-74.

BI-NATIONAL BURNS REGISTRY ANNUAL REPORT
1 JULY 2009 TO 30 JUNE 2010 page 46
Glossary
Burn Depth: Burns are described according to the depth of injury to the skin layers and are
classified into superficial dermal, mid-dermal, deep-dermal and full thickness burns
[30].
Burn Injury
classifications [30]
Chemical – direct contact with chemicals
Contact- direct contact with hot objects
Electrical – direct contact with an electrical current
Flame – direct contact with open flame or fire
Flash – exposure to the energy produced by explosive material
Friction – rapid movement of a surface against the skin, eg treadmill, road surface
Radiation – exposure to solar energy, radiotherapy, laser
Radiant heat – heat radiating from heaters , open fire places
Scald hot liquids such as hot water and steam, hot fats, oils and foods
Country of Birth: Country in which the person was born [31].
Charlson Comorbidity
Index
Includes 19 diseases weighted according to their association with mortality. It has
been shown to be a reliable predictor of mortality in a number of populations
[32]and has been adapted for use on ICD-9 and ICD-10 administrative systems [33].
Definitive burn wound
assessment:
The burn assessment documented by the most senior burns clinician assessment
within 72 hours of admission.
This definition was developed by the registry’s Steering Committee in an effort to
standardise burn wound assessment data, particularly given the per centTBSA can
be estimated and documented by numerous clinicians at multiple time points
following burn injury.
Enteral / parenteral
feeding:
Enteral nutrition is commonly administered through a nasogastric tube placed via
the nose. Parenteral nutrition is administered via a peripheral or central vein.
Enteral and parenteral nutritional supports are used to provide nutrients on a
temporary or permanent basis to patients who are unable to ingest or tolerate
adequate nutrients or to tolerate an oral diet [15].
BI-NATIONAL BURNS REGISTRY ANNUAL REPORT
1 JULY 2009 TO 30 JUNE 2010 page 47
Estimated glomerular
rate (eGFR):
‘The glomerular filtration rate measures how well kidneys filter the waste products
and toxins from a patient's blood and is the best indicated of kidney function. It
helps determine if there is any damage.’ [34]
The eGFR (estimated Glomerular Filtration Rate) is test used to screen for and
detect early kidney damage and to monitor kidney status. It is a quantifiable
measure of acute renal failure and routinely recorded in patients admitted to
intensive care units across Australia and New Zealand.
Ethnicity: The ethnic group or groups that a person identifies with or feels they belong to.
Ethnicity is a measure of cultural affiliation, as opposed to race, ancestry,
nationality or citizenship [35].
Full thickness burns: The most severe classification of burn depth where all skin layers are destroyed,
leaving no cells to heal the wound. Full thickness burns are likely to require
surgical excision and skin grafting [30].
Inhalation injuries: Burns to the oropharynx and upper airway result in swelling and possible airway
obstruction within the first few hours after injury. Inhalation injuries are complex,
with significant morbidity and increased mortality [36].
Senior burn clinician: The Head of Unit; or a surgeon with a minimum of two years experience in a major
burn unit who has Emergency Management of Severe Burns (EMSB) certification;
or a Burns Nurse Practitioner with Emergency Management of Severe Burns
(EMSB) certification.
Total body surface area: A percentage measure of burns of the skin. The two most common assessment
tools used to assess the burn size are the ‘Lund and Browder’ and ‘Rule of Nines’
chart. As a general guideline the size of a person's hand print (palm and fingers) is
approximately 1 per cent of their TBSA [30].
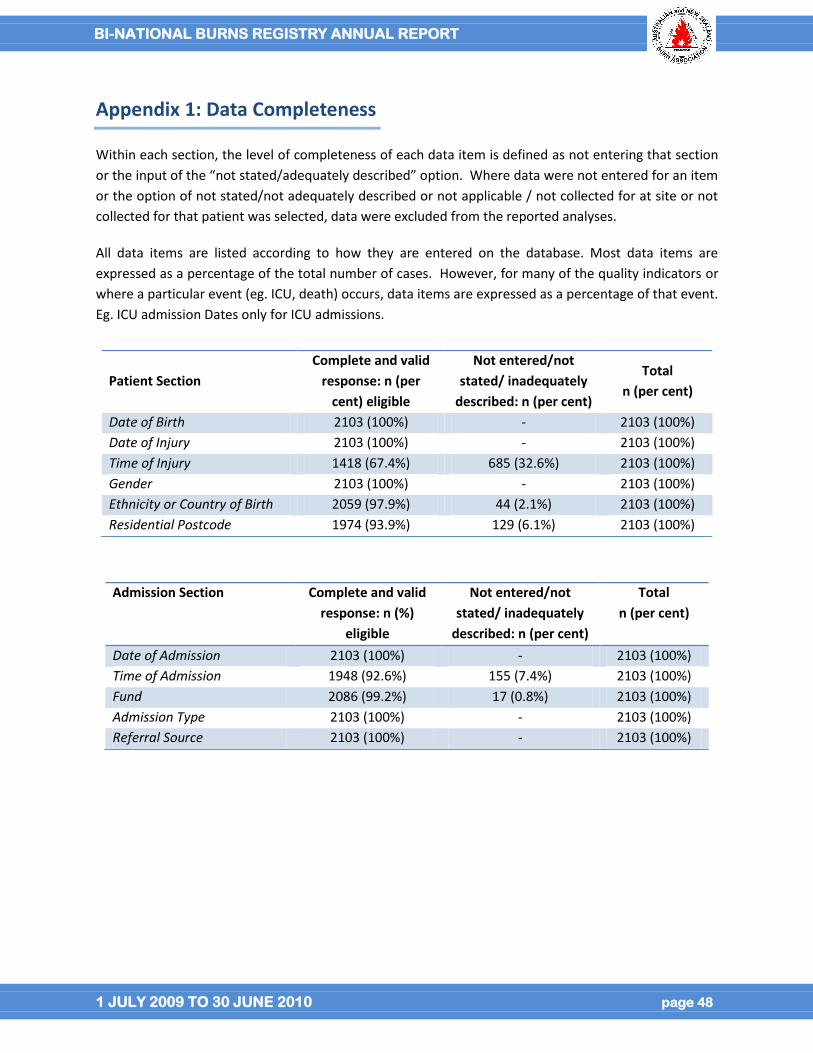
BI-NATIONAL BURNS REGISTRY ANNUAL REPORT
1 JULY 2009 TO 30 JUNE 2010 page 48
Appendix 1: Data Completeness
Within each section, the level of completeness of each data item is defined as not entering that section
or the input of the “not stated/adequately described” option. Where data were not entered for an item
or the option of not stated/not adequately described or not applicable / not collected for at site or not
collected for that patient was selected, data were excluded from the reported analyses.
All data items are listed according to how they are entered on the database. Most data items are
expressed as a percentage of the total number of cases. However, for many of the quality indicators or
where a particular event (eg. ICU, death) occurs, data items are expressed as a percentage of that event.
Eg. ICU admission Dates only for ICU admissions.
Patient Section
Complete and valid
response: n (per
cent) eligible
Not entered/not
stated/ inadequately
described: n (per cent)
Total
n (per cent)
Date of Birth 2103 (100%) - 2103 (100%)
Date of Injury 2103 (100%) - 2103 (100%)
Time of Injury 1418 (67.4%) 685 (32.6%) 2103 (100%)
Gender 2103 (100%) - 2103 (100%)
Ethnicity or Country of Birth 2059 (97.9%) 44 (2.1%) 2103 (100%)
Residential Postcode 1974 (93.9%) 129 (6.1%) 2103 (100%)
Admission Section Complete and valid
response: n (%)
eligible
Not entered/not
stated/ inadequately
described: n (per cent)
Total
n (per cent)
Date of Admission 2103 (100%) - 2103 (100%)
Time of Admission 1948 (92.6%) 155 (7.4%) 2103 (100%)
Fund 2086 (99.2%) 17 (0.8%) 2103 (100%)
Admission Type 2103 (100%) - 2103 (100%)
Referral Source 2103 (100%) - 2103 (100%)
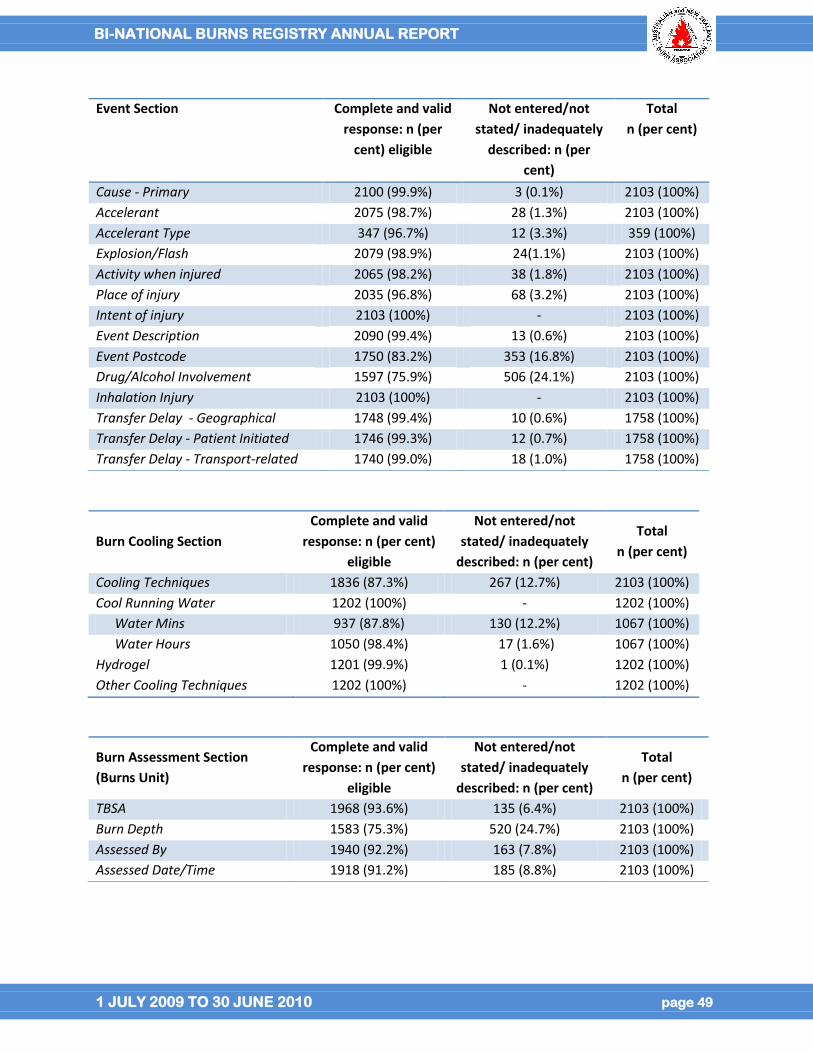
BI-NATIONAL BURNS REGISTRY ANNUAL REPORT
1 JULY 2009 TO 30 JUNE 2010 page 49
Event Section Complete and valid
response: n (per
cent) eligible
Not entered/not
stated/ inadequately
described: n (per
cent)
Total
n (per cent)
Cause - Primary 2100 (99.9%) 3 (0.1%) 2103 (100%)
Accelerant 2075 (98.7%) 28 (1.3%) 2103 (100%)
Accelerant Type 347 (96.7%) 12 (3.3%) 359 (100%)
Explosion/Flash 2079 (98.9%) 24(1.1%) 2103 (100%)
Activity when injured 2065 (98.2%) 38 (1.8%) 2103 (100%)
Place of injury 2035 (96.8%) 68 (3.2%) 2103 (100%)
Intent of injury 2103 (100%) - 2103 (100%)
Event Description 2090 (99.4%) 13 (0.6%) 2103 (100%)
Event Postcode 1750 (83.2%) 353 (16.8%) 2103 (100%)
Drug/Alcohol Involvement 1597 (75.9%) 506 (24.1%) 2103 (100%)
Inhalation Injury 2103 (100%) - 2103 (100%)
Transfer Delay - Geographical 1748 (99.4%) 10 (0.6%) 1758 (100%)
Transfer Delay - Patient Initiated 1746 (99.3%) 12 (0.7%) 1758 (100%)
Transfer Delay - Transport-related 1740 (99.0%) 18 (1.0%) 1758 (100%)
Burn Cooling Section
Complete and valid
response: n (per cent)
eligible
Not entered/not
stated/ inadequately
described: n (per cent)
Total
n (per cent)
Cooling Techniques 1836 (87.3%) 267 (12.7%) 2103 (100%)
Cool Running Water 1202 (100%) - 1202 (100%)
Water Mins 937 (87.8%) 130 (12.2%) 1067 (100%)
Water Hours 1050 (98.4%) 17 (1.6%) 1067 (100%)
Hydrogel 1201 (99.9%) 1 (0.1%) 1202 (100%)
Other Cooling Techniques 1202 (100%) - 1202 (100%)
Burn Assessment Section
(Burns Unit)
Complete and valid
response: n (per cent)
eligible
Not entered/not
stated/ inadequately
described: n (per cent)
Total
n (per cent)
TBSA 1968 (93.6%) 135 (6.4%) 2103 (100%)
Burn Depth 1583 (75.3%) 520 (24.7%) 2103 (100%)
Assessed By 1940 (92.2%) 163 (7.8%) 2103 (100%)
Assessed Date/Time 1918 (91.2%) 185 (8.8%) 2103 (100%)
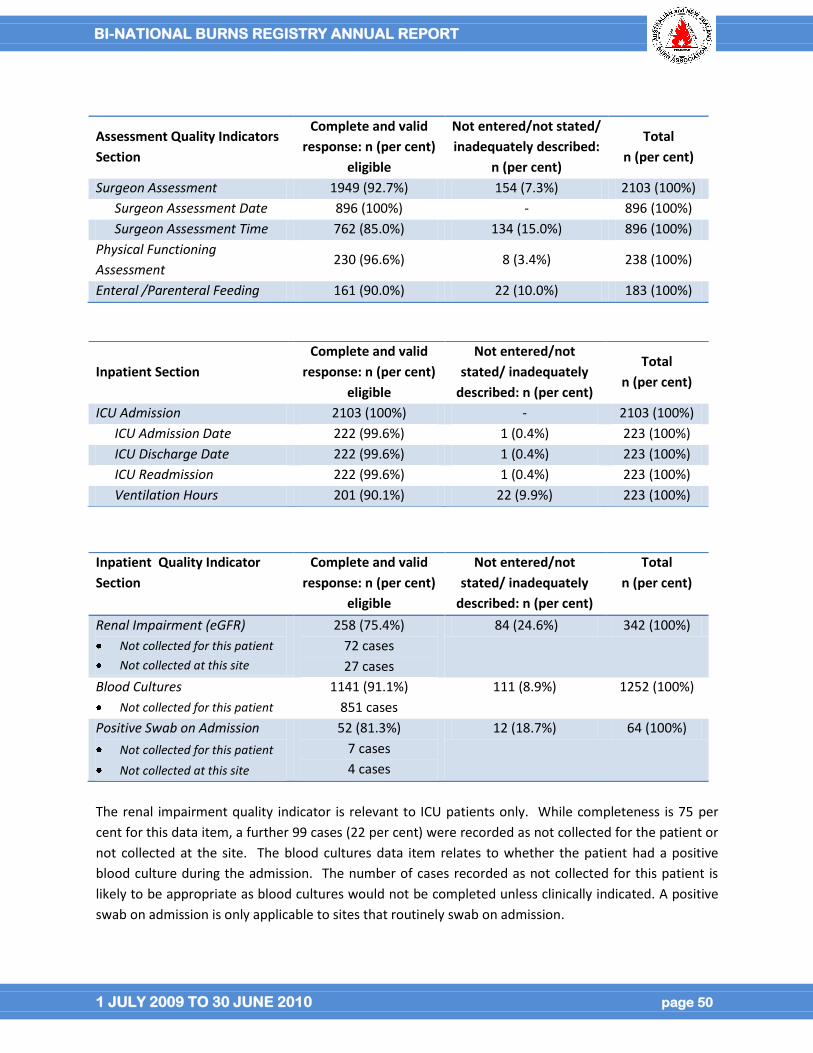
BI-NATIONAL BURNS REGISTRY ANNUAL REPORT
1 JULY 2009 TO 30 JUNE 2010 page 50
The renal impairment quality indicator is relevant to ICU patients only. While completeness is 75 per
cent for this data item, a further 99 cases (22 per cent) were recorded as not collected for the patient or
not collected at the site. The blood cultures data item relates to whether the patient had a positive
blood culture during the admission. The number of cases recorded as not collected for this patient is
likely to be appropriate as blood cultures would not be completed unless clinically indicated. A positive
swab on admission is only applicable to sites that routinely swab on admission.
Assessment Quality Indicators
Section
Complete and valid
response: n (per cent)
eligible
Not entered/not stated/
inadequately described:
n (per cent)
Total
n (per cent)
Surgeon Assessment 1949 (92.7%) 154 (7.3%) 2103 (100%)
Surgeon Assessment Date 896 (100%) - 896 (100%)
Surgeon Assessment Time 762 (85.0%) 134 (15.0%) 896 (100%)
Physical Functioning
Assessment 230 (96.6%) 8 (3.4%) 238 (100%)
Enteral /Parenteral Feeding 161 (90.0%) 22 (10.0%) 183 (100%)
Inpatient Section
Complete and valid
response: n (per cent)
eligible
Not entered/not
stated/ inadequately
described: n (per cent)
Total
n (per cent)
ICU Admission 2103 (100%) - 2103 (100%)
ICU Admission Date 222 (99.6%) 1 (0.4%) 223 (100%)
ICU Discharge Date 222 (99.6%) 1 (0.4%) 223 (100%)
ICU Readmission 222 (99.6%) 1 (0.4%) 223 (100%)
Ventilation Hours 201 (90.1%) 22 (9.9%) 223 (100%)
Inpatient Quality Indicator
Section
Complete and valid
response: n (per cent)
eligible
Not entered/not
stated/ inadequately
described: n (per cent)
Total
n (per cent)
Renal Impairment (eGFR)
Not collected for this patient
Not collected at this site
258 (75.4%)
72 cases
27 cases
84 (24.6%) 342 (100%)
Blood Cultures
Not collected for this patient
1141 (91.1%)
851 cases
111 (8.9%) 1252 (100%)
Positive Swab on Admission
Not collected for this patient
Not collected at this site
52 (81.3%)
7 cases
4 cases
12 (18.7%) 64 (100%)
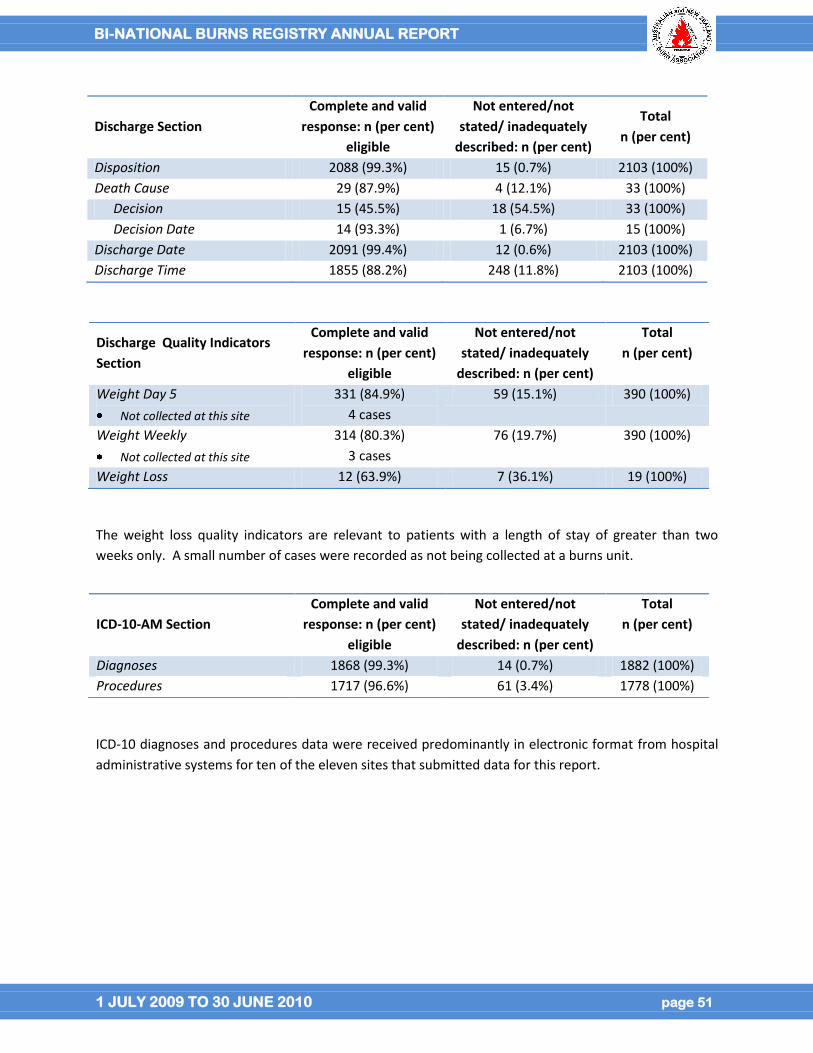
BI-NATIONAL BURNS REGISTRY ANNUAL REPORT
1 JULY 2009 TO 30 JUNE 2010 page 51
The weight loss quality indicators are relevant to patients with a length of stay of greater than two
weeks only. A small number of cases were recorded as not being collected at a burns unit.
ICD-10 diagnoses and procedures data were received predominantly in electronic format from hospital
administrative systems for ten of the eleven sites that submitted data for this report.
Discharge Section
Complete and valid
response: n (per cent)
eligible
Not entered/not
stated/ inadequately
described: n (per cent)
Total
n (per cent)
Disposition 2088 (99.3%) 15 (0.7%) 2103 (100%)
Death Cause 29 (87.9%) 4 (12.1%) 33 (100%)
Decision 15 (45.5%) 18 (54.5%) 33 (100%)
Decision Date 14 (93.3%) 1 (6.7%) 15 (100%)
Discharge Date 2091 (99.4%) 12 (0.6%) 2103 (100%)
Discharge Time 1855 (88.2%) 248 (11.8%) 2103 (100%)
Discharge Quality Indicators
Section
Complete and valid
response: n (per cent)
eligible
Not entered/not
stated/ inadequately
described: n (per cent)
Total
n (per cent)
Weight Day 5
Not collected at this site
331 (84.9%)
4 cases
59 (15.1%) 390 (100%)
Weight Weekly
Not collected at this site
314 (80.3%)
3 cases
76 (19.7%) 390 (100%)
Weight Loss 12 (63.9%) 7 (36.1%) 19 (100%)
ICD-10-AM Section
Complete and valid
response: n (per cent)
eligible
Not entered/not
stated/ inadequately
described: n (per cent)
Total
n (per cent)
Diagnoses 1868 (99.3%) 14 (0.7%) 1882 (100%)
Procedures 1717 (96.6%) 61 (3.4%) 1778 (100%)
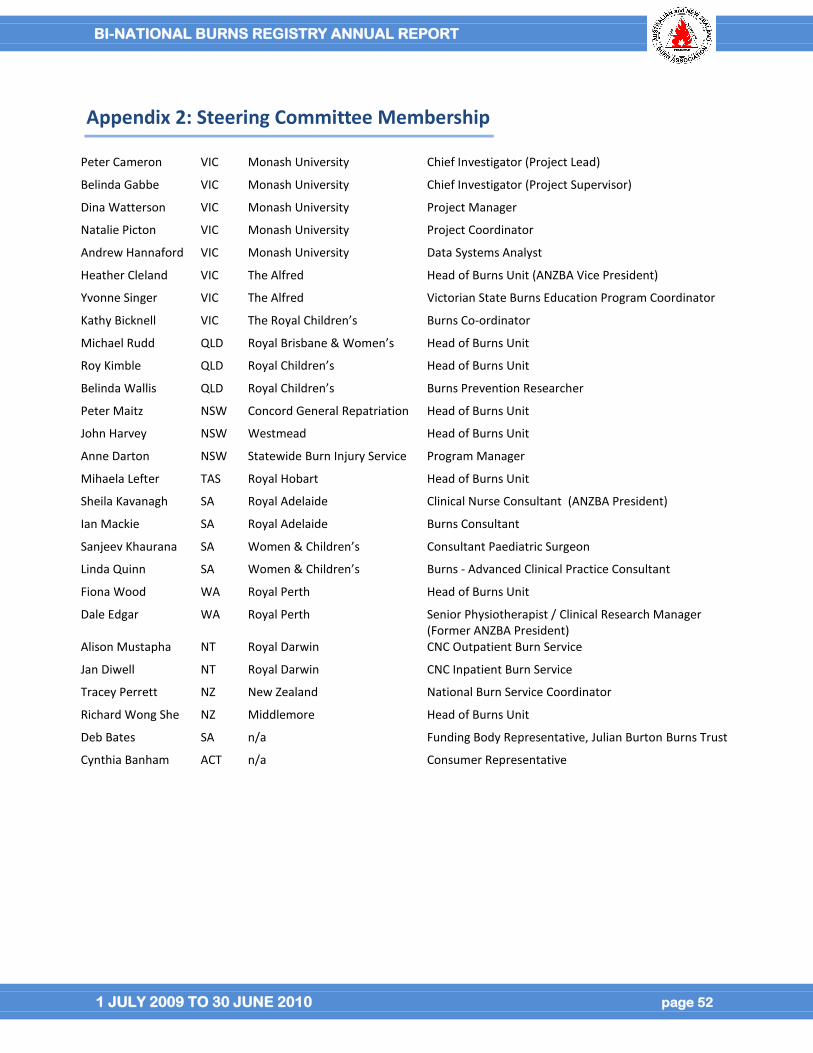
BI-NATIONAL BURNS REGISTRY ANNUAL REPORT
1 JULY 2009 TO 30 JUNE 2010 page 52
Appendix 2: Steering Committee Membership
Peter Cameron VIC Monash University Chief Investigator (Project Lead)
Belinda Gabbe VIC Monash University Chief Investigator (Project Supervisor)
Dina Watterson VIC Monash University Project Manager
Natalie Picton VIC Monash University Project Coordinator
Andrew Hannaford VIC Monash University Data Systems Analyst
Heather Cleland VIC The Alfred Head of Burns Unit (ANZBA Vice President)
Yvonne Singer VIC The Alfred Victorian State Burns Education Program Coordinator
Kathy Bicknell VIC The Royal Children’s Burns Co-ordinator
Michael Rudd QLD Royal Brisbane & Women’s Head of Burns Unit
Roy Kimble QLD Royal Children’s Head of Burns Unit
Belinda Wallis QLD Royal Children’s Burns Prevention Researcher
Peter Maitz NSW Concord General Repatriation Head of Burns Unit
John Harvey NSW Westmead Head of Burns Unit
Anne Darton NSW Statewide Burn Injury Service Program Manager
Mihaela Lefter TAS Royal Hobart Head of Burns Unit
Sheila Kavanagh SA Royal Adelaide Clinical Nurse Consultant (ANZBA President)
Ian Mackie SA Royal Adelaide Burns Consultant
Sanjeev Khaurana SA Women & Children’s Consultant Paediatric Surgeon
Linda Quinn SA Women & Children’s Burns - Advanced Clinical Practice Consultant
Fiona Wood WA Royal Perth Head of Burns Unit
Dale Edgar WA Royal Perth Senior Physiotherapist / Clinical Research Manager (Former ANZBA President)
Alison Mustapha NT Royal Darwin CNC Outpatient Burn Service
Jan Diwell NT Royal Darwin CNC Inpatient Burn Service
Tracey Perrett NZ New Zealand National Burn Service Coordinator
Richard Wong She NZ Middlemore Head of Burns Unit
Deb Bates SA n/a Funding Body Representative, Julian Burton Burns Trust
Cynthia Banham ACT n/a Consumer Representative
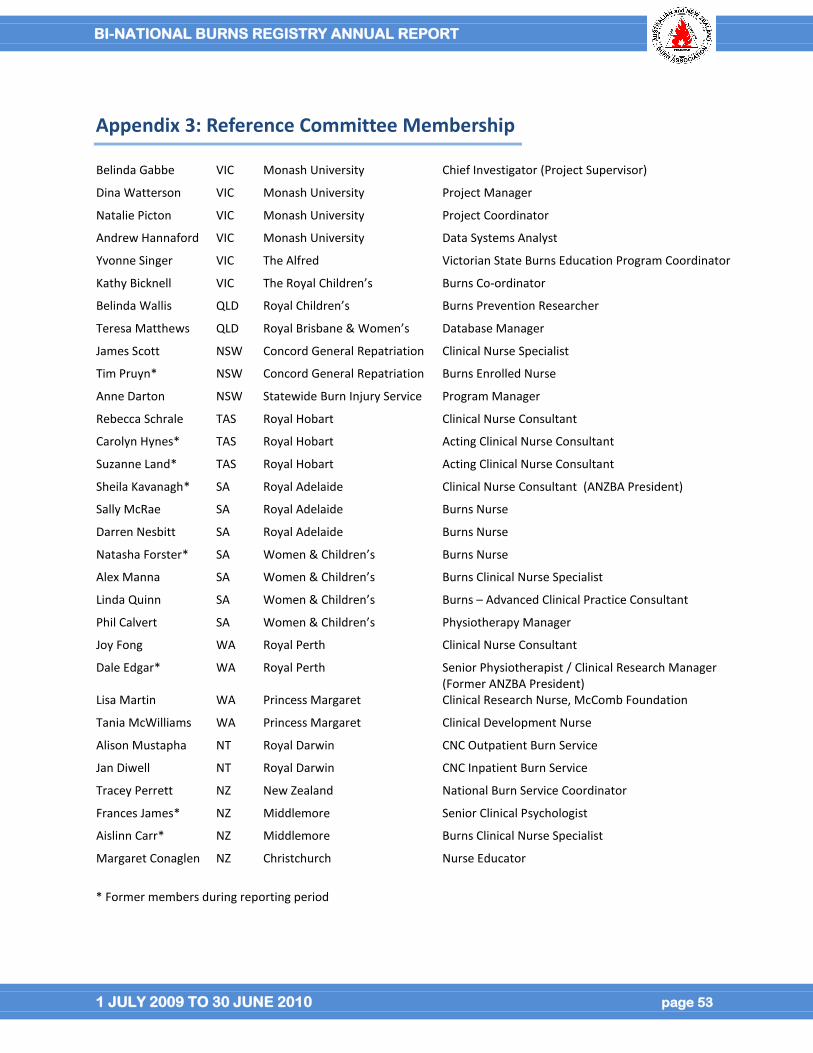
BI-NATIONAL BURNS REGISTRY ANNUAL REPORT
1 JULY 2009 TO 30 JUNE 2010 page 53
Appendix 3: Reference Committee Membership
Belinda Gabbe VIC Monash University Chief Investigator (Project Supervisor)
Dina Watterson VIC Monash University Project Manager
Natalie Picton VIC Monash University Project Coordinator
Andrew Hannaford VIC Monash University Data Systems Analyst
Yvonne Singer VIC The Alfred Victorian State Burns Education Program Coordinator
Kathy Bicknell VIC The Royal Children’s Burns Co-ordinator
Belinda Wallis QLD Royal Children’s Burns Prevention Researcher
Teresa Matthews QLD Royal Brisbane & Women’s Database Manager
James Scott NSW Concord General Repatriation Clinical Nurse Specialist
Tim Pruyn* NSW Concord General Repatriation Burns Enrolled Nurse
Anne Darton NSW Statewide Burn Injury Service Program Manager
Rebecca Schrale TAS Royal Hobart Clinical Nurse Consultant
Carolyn Hynes* TAS Royal Hobart Acting Clinical Nurse Consultant
Suzanne Land* TAS Royal Hobart Acting Clinical Nurse Consultant
Sheila Kavanagh* SA Royal Adelaide Clinical Nurse Consultant (ANZBA President)
Sally McRae SA Royal Adelaide Burns Nurse
Darren Nesbitt SA Royal Adelaide Burns Nurse
Natasha Forster* SA Women & Children’s Burns Nurse
Alex Manna SA Women & Children’s Burns Clinical Nurse Specialist
Linda Quinn SA Women & Children’s Burns – Advanced Clinical Practice Consultant
Phil Calvert SA Women & Children’s Physiotherapy Manager
Joy Fong WA Royal Perth Clinical Nurse Consultant
Dale Edgar* WA Royal Perth Senior Physiotherapist / Clinical Research Manager (Former ANZBA President)
Lisa Martin WA Princess Margaret Clinical Research Nurse, McComb Foundation
Tania McWilliams WA Princess Margaret Clinical Development Nurse
Alison Mustapha NT Royal Darwin CNC Outpatient Burn Service
Jan Diwell NT Royal Darwin CNC Inpatient Burn Service
Tracey Perrett NZ New Zealand National Burn Service Coordinator
Frances James* NZ Middlemore Senior Clinical Psychologist
Aislinn Carr* NZ Middlemore Burns Clinical Nurse Specialist
Margaret Conaglen NZ Christchurch Nurse Educator
* Former members during reporting period
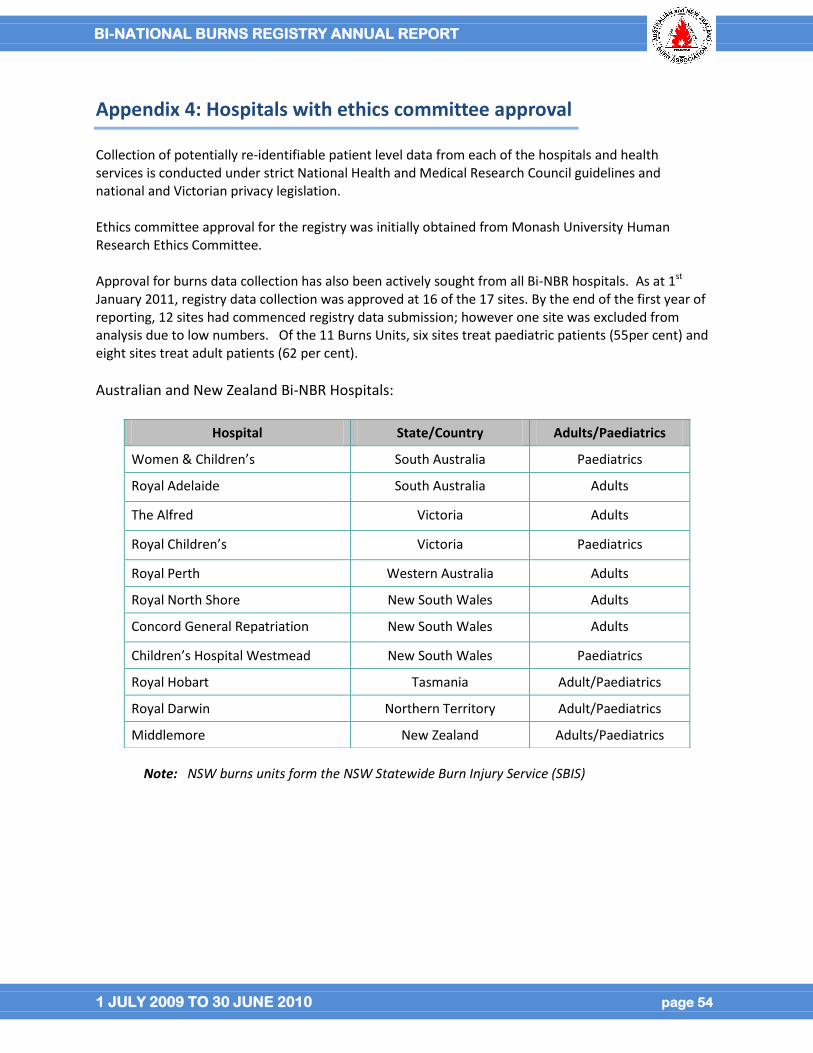
BI-NATIONAL BURNS REGISTRY ANNUAL REPORT
1 JULY 2009 TO 30 JUNE 2010 page 54
Appendix 4: Hospitals with ethics committee approval
Collection of potentially re-identifiable patient level data from each of the hospitals and health services is conducted under strict National Health and Medical Research Council guidelines and national and Victorian privacy legislation. Ethics committee approval for the registry was initially obtained from Monash University Human Research Ethics Committee. Approval for burns data collection has also been actively sought from all Bi-NBR hospitals. As at 1st January 2011, registry data collection was approved at 16 of the 17 sites. By the end of the first year of reporting, 12 sites had commenced registry data submission; however one site was excluded from analysis due to low numbers. Of the 11 Burns Units, six sites treat paediatric patients (55per cent) and eight sites treat adult patients (62 per cent).
Australian and New Zealand Bi-NBR Hospitals:
Note: NSW burns units form the NSW Statewide Burn Injury Service (SBIS)
Hospital State/Country Adults/Paediatrics
Women & Children’s South Australia Paediatrics
Royal Adelaide South Australia Adults
The Alfred Victoria Adults
Royal Children’s Victoria Paediatrics
Royal Perth Western Australia Adults
Royal North Shore New South Wales Adults
Concord General Repatriation New South Wales Adults
Children’s Hospital Westmead New South Wales Paediatrics
Royal Hobart Tasmania Adult/Paediatrics
Royal Darwin Northern Territory Adult/Paediatrics
Middlemore New Zealand Adults/Paediatrics
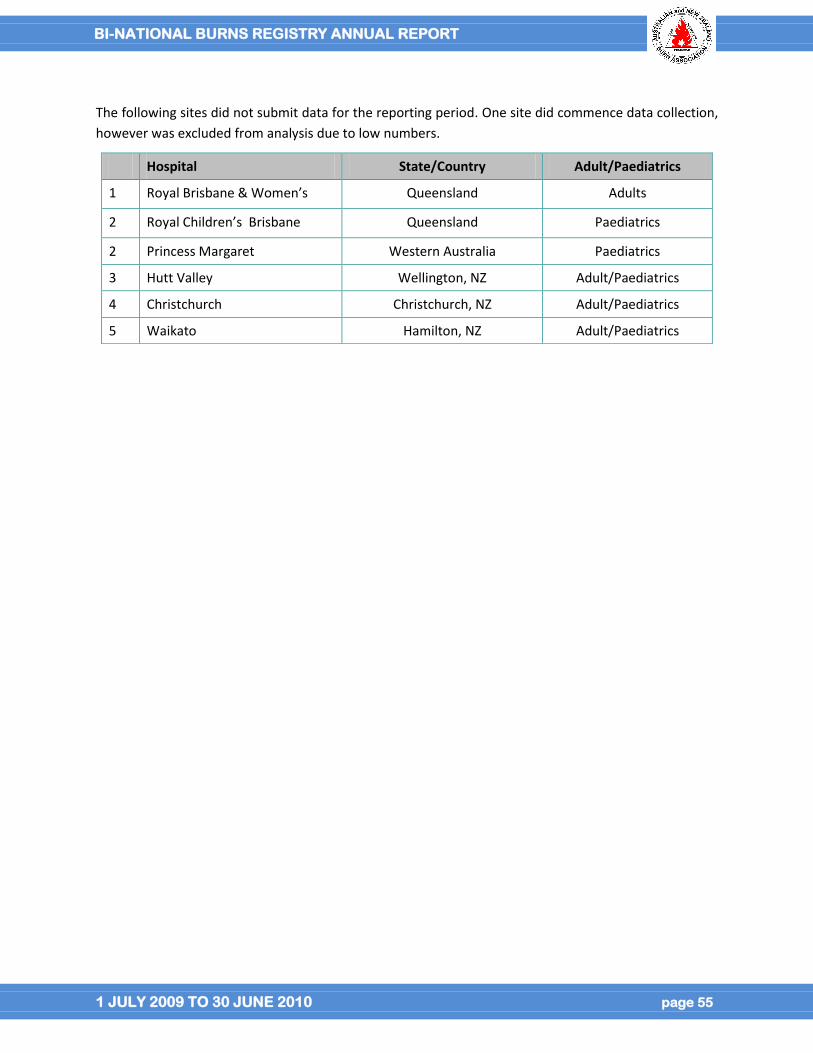
BI-NATIONAL BURNS REGISTRY ANNUAL REPORT
1 JULY 2009 TO 30 JUNE 2010 page 55
The following sites did not submit data for the reporting period. One site did commence data collection,
however was excluded from analysis due to low numbers.
Hospital State/Country Adult/Paediatrics
1 Royal Brisbane & Women’s Queensland Adults
2 Royal Children’s Brisbane Queensland Paediatrics
2 Princess Margaret Western Australia Paediatrics
3 Hutt Valley Wellington, NZ Adult/Paediatrics
4 Christchurch Christchurch, NZ Adult/Paediatrics
5 Waikato Hamilton, NZ Adult/Paediatrics
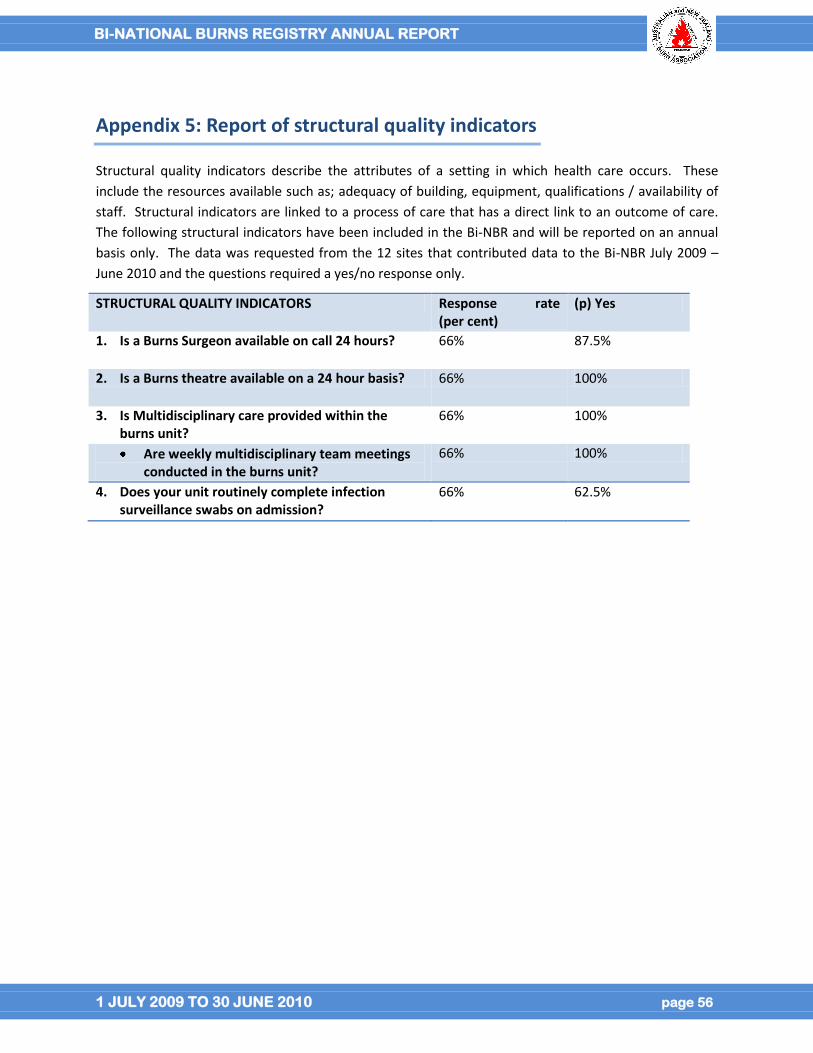
BI-NATIONAL BURNS REGISTRY ANNUAL REPORT
1 JULY 2009 TO 30 JUNE 2010 page 56
Appendix 5: Report of structural quality indicators
Structural quality indicators describe the attributes of a setting in which health care occurs. These
include the resources available such as; adequacy of building, equipment, qualifications / availability of
staff. Structural indicators are linked to a process of care that has a direct link to an outcome of care.
The following structural indicators have been included in the Bi-NBR and will be reported on an annual
basis only. The data was requested from the 12 sites that contributed data to the Bi-NBR July 2009 –
June 2010 and the questions required a yes/no response only.
STRUCTURAL QUALITY INDICATORS Response rate (per cent)
(p) Yes
1. Is a Burns Surgeon available on call 24 hours? 66% 87.5%
2. Is a Burns theatre available on a 24 hour basis? 66% 100%
3. Is Multidisciplinary care provided within the burns unit?
66% 100%
Are weekly multidisciplinary team meetings conducted in the burns unit?
66% 100%
4. Does your unit routinely complete infection surveillance swabs on admission?
66% 62.5%
BI-NATIONAL BURNS REGISTRY ANNUAL REPORT
1 JULY 2009 TO 30 JUNE 2010 page 57
Appendix 6: Methodology for developing the co-morbidity categories
Co-morbidities have been shown to increase the risk of death and length of stay for burn patients [4-6] .
The methodology developed to categorise co-morbidities for the Bi-NBR using ICD-10-AM data
incorporated the following three key methods:
(i) The Charlson Comorbidity Index (CCI) [7].
(ii) The American Burn Association National Burns Registry (ABA-NBR) combination of the CCI with
the Elixhauser method using ICD-9-CM, mapped to ICD-10-AM in the Bi-NBR [6].
(iii) Remaining co-morbidities using ICD-10-AM chapter titles, not classified using the CCI and ABA-
NBR, grouped according to prevalent diseases or ICD-10-AM blocks [8].
BI-NATIONAL BURNS REGISTRY ANNUAL REPORT
1 JULY 2009 TO 30 JUNE 2010 page 58
Appendix 7: ANZBA Referral Criteria
Criteria for specialised burns treatment
The following criteria are endorsed by the Australian & New Zealand Burn Association in assessing whether burns require treatment in a specialised burns unit (ANZBA 2004):
burns greater than 10 per cent of total body surface area (TBSA); burns of special areas—face, hands, feet, genitalia, perineum, and major joints; full-thickness burns greater than 5 per cent of TBSA; electrical burns; chemical burns; burns with an associated inhalation injury; circumferential burns of the limbs or chest; burns in the very young or very old, or pregnant women; burns in people with pre-existing medical disorders that could complicate management, prolong
recovery, or increase mortality; burns with associated trauma; and Non-accidental burns.
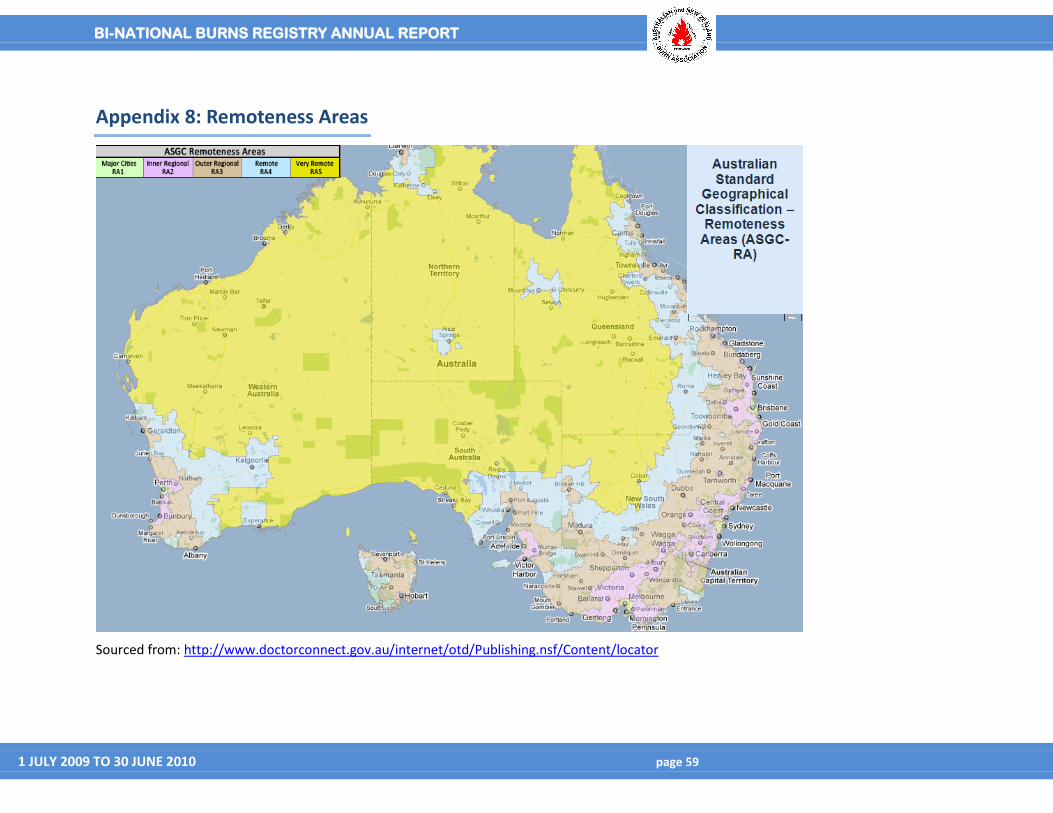
BI-NATIONAL BURNS REGISTRY ANNUAL REPORT
1 JULY 2009 TO 30 JUNE 2010 page 59
Appendix 8: Remoteness Areas
Sourced from: http://www.doctorconnect.gov.au/internet/otd/Publishing.nsf/Content/locator
Recommended