1920
BIENNIALREPORT

PAGE | 2
table ofCONTENTS
COMMISSIONER’S MESSAGE
FY 2019 AGRICULTURE HIGHLIGHTS
2020 PANDEMIC RESPONSE
FY 2020 AGRICULTURE STATISTICSADMINISTRATION, GRANTS, AND COMMODITIES
BUSINESS DEVELOPMENTCONSUMER AND INDUSTRY SERVICES
FORESTRYANIMAL HEALTH AND LAB DIAGNOSTICS
USDA NASS STATISTICS
3
4
5
68
101214
16
.....
.....
.....
.....
.....
.....
.....
.....
.....

PAGE | 2
When thinking back on the last two years, it’s difficult to summarize it all in a few short paragraphs. From 2019 to 2020, our world experienced immense change. The COVID-19 pandemic has touched every single one of us and continues to affect nearly every corner of the globe. In this biennial report, you will gain an understanding of how the Tennessee Department of Agriculture stepped up, pitched in, and held strong to our commitment to serve the citizens of Tennessee.
This new environment reinforces the fact that agriculture is vital for the most important aspects of our daily lives. Farmers, foresters, manufacturers, distributors, and retailers ensure community access to safe and abundant food, fuel, fiber, and wood products. The Department’s priority remains protecting the safety and health of our staff and our customers while delivering the services you trust and expect. In the following pages you will see how agriculture in our state has continued to progress, positively impacting Tennessee’s economy by billions of dollars even in the face of uncertainty.
Advancement of our rural areas is a primary focus. Investments in grant programs and projects to enhance farm incomes create positive outcomes in all of our communities. Even with budget cutbacks, were able to keep those programs in place. And with federal assistance, we are proud to have offered the nation’s most comprehensive pandemic recovery initiative to reinforce the agriculture industry. The Coronavirus Agricultural and Forestry Business Fund helped stabilize the food supply and agribusinesses, with $55 million approved for financial relief to the individuals and organizations that needed it most.
There is no denying that our lives have been altered by this unpredictable and devastating virus. Yet no matter the challenges they face, farmers and foresters remain resilient. There is comfort in knowing that the agriculture community stands together in the face of the storm.
Thank you for your interest in and support of agriculture,
Charlie Hatcher, D.V.M.Tennessee Commissioner of Agriculture
PAGE | 4
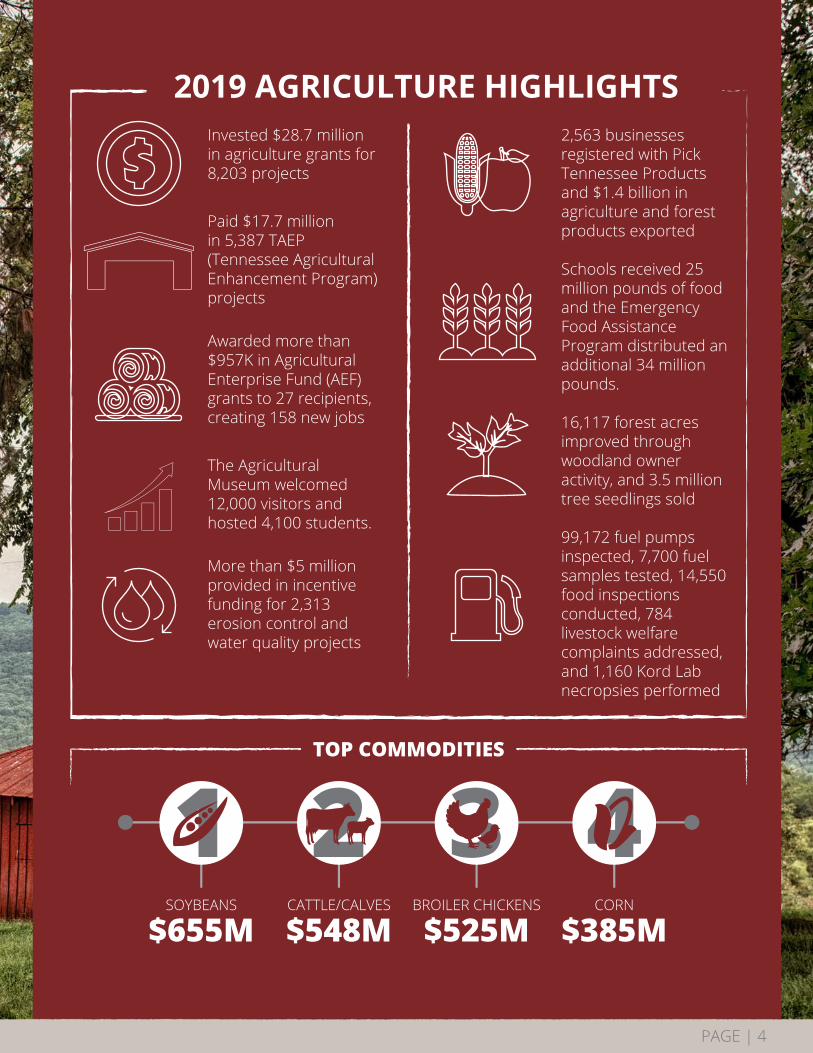
2019 AGRICULTURE HIGHLIGHTS2,563 businesses registered with Pick Tennessee Products and $1.4 billion in agriculture and forest products exported
Schools received 25 million pounds of food and the Emergency Food Assistance Program distributed an additional 34 million pounds.
16,117 forest acres improved through woodland owner activity, and 3.5 million tree seedlings sold
99,172 fuel pumps inspected, 7,700 fuel samples tested, 14,550 food inspections conducted, 784 livestock welfare complaints addressed, and 1,160 Kord Lab necropsies performed
Invested $28.7 million in agriculture grants for 8,203 projects
Paid $17.7 million in 5,387 TAEP (Tennessee Agricultural Enhancement Program) projects
Awarded more than $957K in Agricultural Enterprise Fund (AEF) grants to 27 recipients, creating 158 new jobs
The Agricultural Museum welcomed 12,000 visitors and hosted 4,100 students.
More than $5 million provided in incentive funding for 2,313 erosion control and water quality projects
TOP COMMODITIES
SOYBEANS
$655M
1CATTLE/CALVES
$548M
2BROILER CHICKENS
$525M
3CORN
$385M
4
PAGE | 4
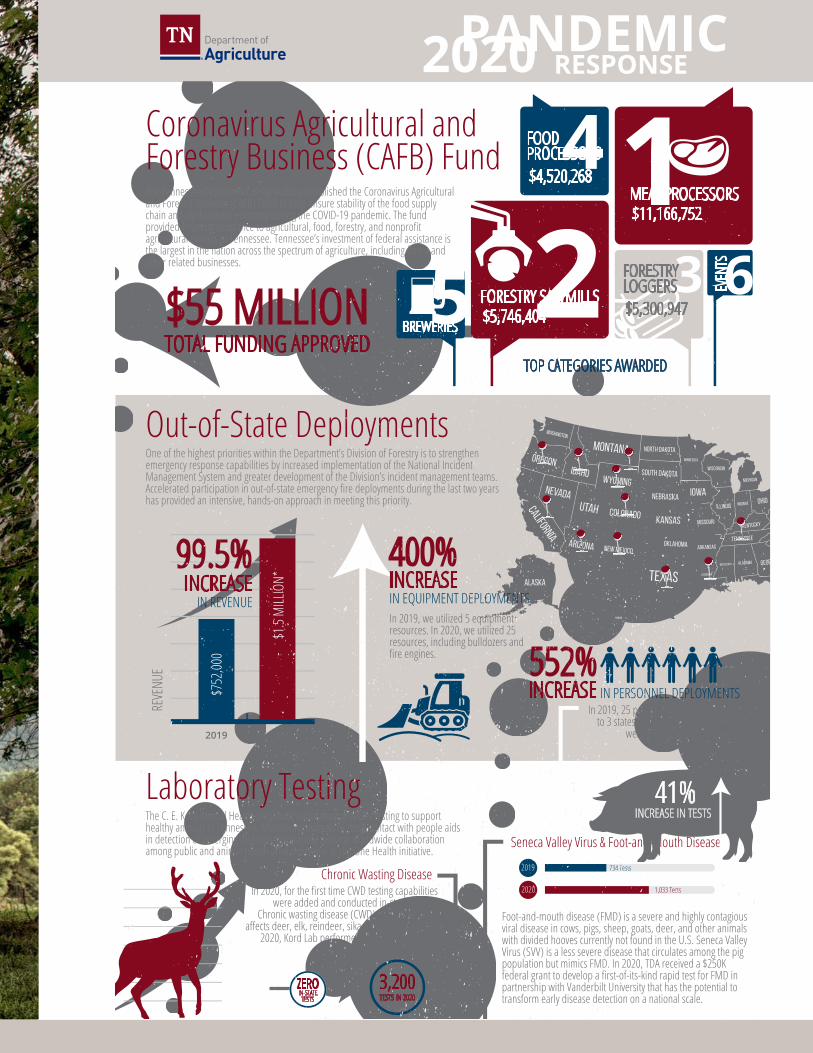
Out-of-State Deployments
Laboratory Testing
Coronavirus Agricultural and Forestry Business (CAFB) Fund
RESPONSEPANDEMIC2020
552% IN PERSONNEL DEPLOYMENTSINCREASE
99.5%INCREASE
400% INCREASEIN EQUIPMENT DEPLOYMENTSIN REVENUE
2019
2020
734 Tests
1,033 Tests
3,200TESTS IN 2020
ZEROIN-STATE
TESTS
$55 MILLIONTOTAL FUNDING APPROVED
TOP CATEGORIES AWARDED
12 3
4
5 6
One of the highest priorities within the Department’s Division of Forestry is to strengthen emergency response capabilities by increased implementation of the National Incident Management System and greater development of the Division’s incident management teams. Accelerated participation in out-of-state emergency fire deployments during the last two years has provided an intensive, hands-on approach in meeting this priority.
The C. E. Kord Animal Health Diagnostic Laboratory provides testing to support healthy animals in Tennessee. Monitoring animals in close contact with people aids in detection of emerging diseases, supporting the vital worldwide collaboration among public and animal health officials known as the One Health initiative.
The Tennessee Department of Agriculture established the Coronavirus Agricultural and Forestry Business (CAFB) Fund to help ensure stability of the food supply chain and agribusiness economy during the COVID-19 pandemic. The fund provided financial assistance to agricultural, food, forestry, and nonprofit agricultural entities in Tennessee. Tennessee’s investment of federal assistance is the largest in the nation across the spectrum of agriculture, including forest and other related businesses.
2019 2020
In 2019, 25 personnel were deployed to 3 states. In 2020, 163 personnel
were deployed to 11 states.
REVE
NUE
$1.5
MILL
ION*
$752
,000
In 2019, we utilized 5 equipment resources. In 2020, we utilized 25 resources, including bulldozers and fire engines.
*Estimated value
Foot-and-mouth disease (FMD) is a severe and highly contagious viral disease in cows, pigs, sheep, goats, deer, and other animals with divided hooves currently not found in the U.S. Seneca Valley Virus (SVV) is a less severe disease that circulates among the pig population but mimics FMD. In 2020, TDA received a $250K federal grant to develop a first-of-its-kind rapid test for FMD in partnership with Vanderbilt University that has the potential to transform early disease detection on a national scale.
Seneca Valley Virus & Foot-and-Mouth Disease
Chronic Wasting DiseaseIn 2020, for the first time CWD testing capabilities
were added and conducted in-state by TDA. Chronic wasting disease (CWD) is a disease that
affects deer, elk, reindeer, sika deer and moose. In 2020, Kord Lab performed 3,200 CWD tests. Of
those tests, 107 were positive.
MEAT PROCESSORS$11,166,752
FORESTRY SAWMILLS$5,746,404
FOODPROCESSORS$4,520,268
BREWERIES
EVEN
TSFORESTRYLOGGERS$5,300,947
tn.gov/agriculture
41% INCREASE IN TESTS
PAGE | 6
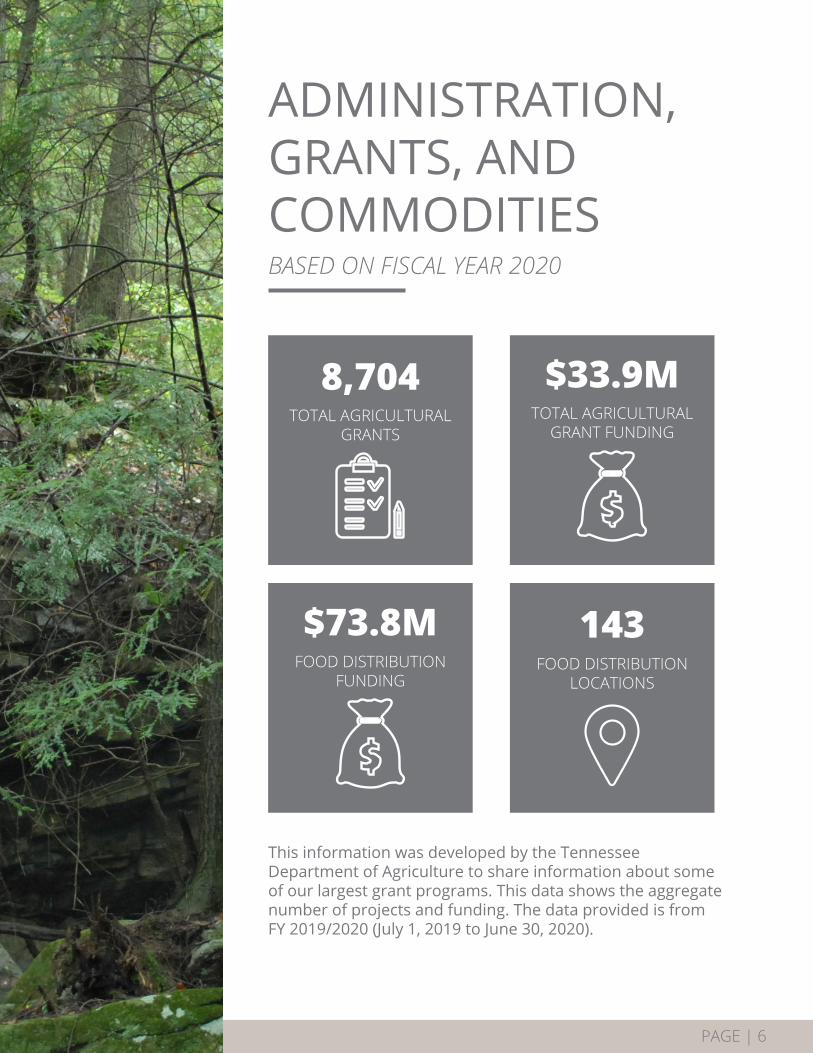
This information was developed by the Tennessee Department of Agriculture to share information about some of our largest grant programs. This data shows the aggregate number of projects and funding. The data provided is from FY 2019/2020 (July 1, 2019 to June 30, 2020).
ADMINISTRATION, GRANTS, AND COMMODITIES
TOTAL AGRICULTURAL GRANTS
8,704
FOOD DISTRIBUTION FUNDING
$73.8M 143FOOD DISTRIBUTION
LOCATIONS
$33.9MTOTAL AGRICULTURAL
GRANT FUNDING
BASED ON FISCAL YEAR 2020

PAGE | 6
TOTAL INVESTMENTS
$6,172,873CONSERVATION
PRACTICES
2,353COUNTIES
95LAND AND WATER STEWARDSHIP
TENNESSEE AGRICULTURAL ENHANCEMENT PROGRAM
TOTAL PAID
$21.3MECONOMIC IMPACT
$129.9MPROJECTS
5,807
FORESTRY GRANTS
WILDFIRE MANAGEMENT & PREVENTION GRANTS
224,708URBAN FORESTRY
GRANTS
63,570RURAL FORESTRY
GRANTS
193,958

PAGE | 8
This information was developed by the Tennessee Department of Agriculture to share information about programs within the Business Development Division. The data provided is from FY 2019/2020 (July 1, 2019 to June 30, 2020). The AEF economic impact data is cumulative from the year of program origination, beginning in August of 2017.
BUSINESS DEVELOPMENT
PICK TENNESSEE PRODUCTS BUSINESSES
2,700+
TENNESSEE AGRICULTURAL ENHANCEMENT PROGRAM PROJECTS
5,807
BASED ON FISCAL YEAR 2020
AGRICULTURAL ENTERPRISE FUND ECONOMIC IMPACT
$56.7 M
PAGE | 8
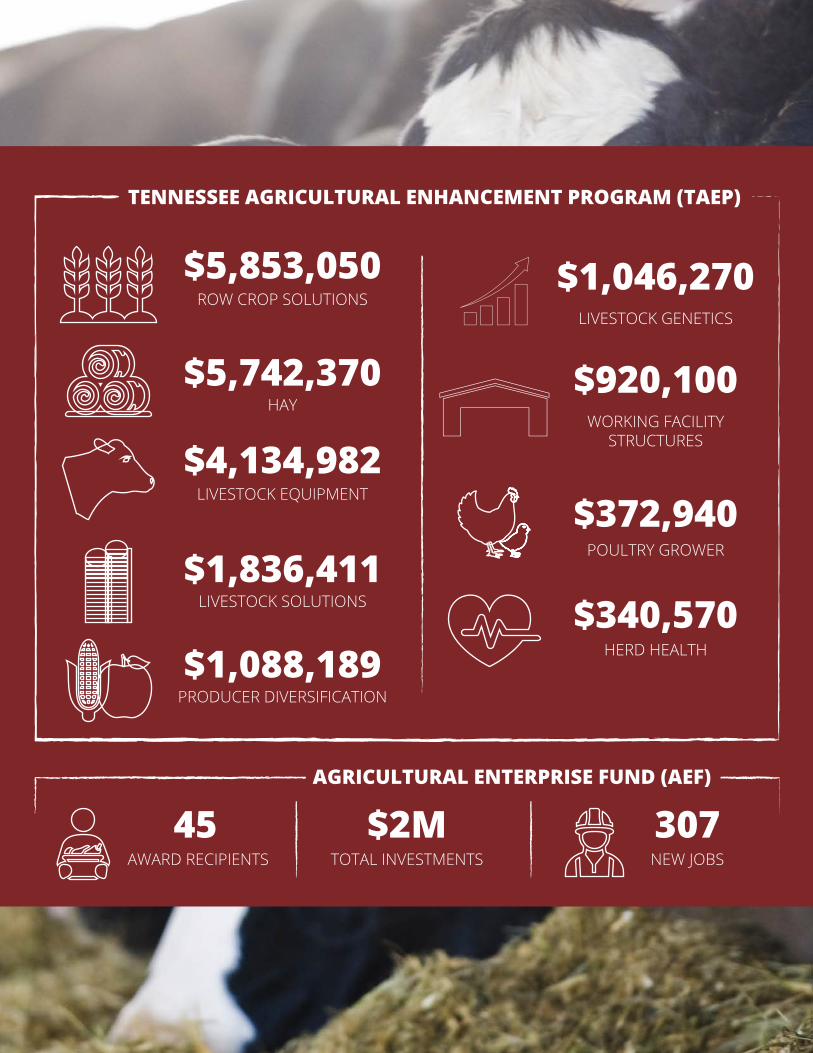
AGRICULTURAL ENTERPRISE FUND (AEF)
TENNESSEE AGRICULTURAL ENHANCEMENT PROGRAM (TAEP)
TOTAL INVESTMENTS
$2MNEW JOBS
307
LIVESTOCK SOLUTIONS$1,836,411
ROW CROP SOLUTIONS
$5,853,050
LIVESTOCK EQUIPMENT
$4,134,982HAY
$5,742,370WORKING FACILITY
STRUCTURES
$920,100
LIVESTOCK GENETICS
$1,046,270
HERD HEALTH
$340,570
PRODUCER DIVERSIFICATION$1,088,189
AWARD RECIPIENTS
45
POULTRY GROWER
$372,940

PAGE | 10
The licensing and inspections data was developed by the Tennessee Department of Agriculture to share information about the functions performed by the Consumer and Industry Services Division. It includes regulatory inspections performed and licenses issued as required by law and rule. The data contains licenses and inspections within the State of Tennessee. The term “license” represents permits, certifications, charters, and professional licenses. The data provided is based on the last day of FY 2020 (June 30, 2020). Inspections are based on FY 2019/2020 (July 1, 2019 to June 30, 2020).
CONSUMER AND INDUSTRY SERVICES
LICENSED INDIVIDUALS(As of June 30, 2020)
14,952
LICENSED FACILITIES(As of June 30, 2020)
38,880
TOTAL INSPECTIONS(FY 2020)
45,683
BASED ON FISCAL YEAR 2020
PAGE | 10
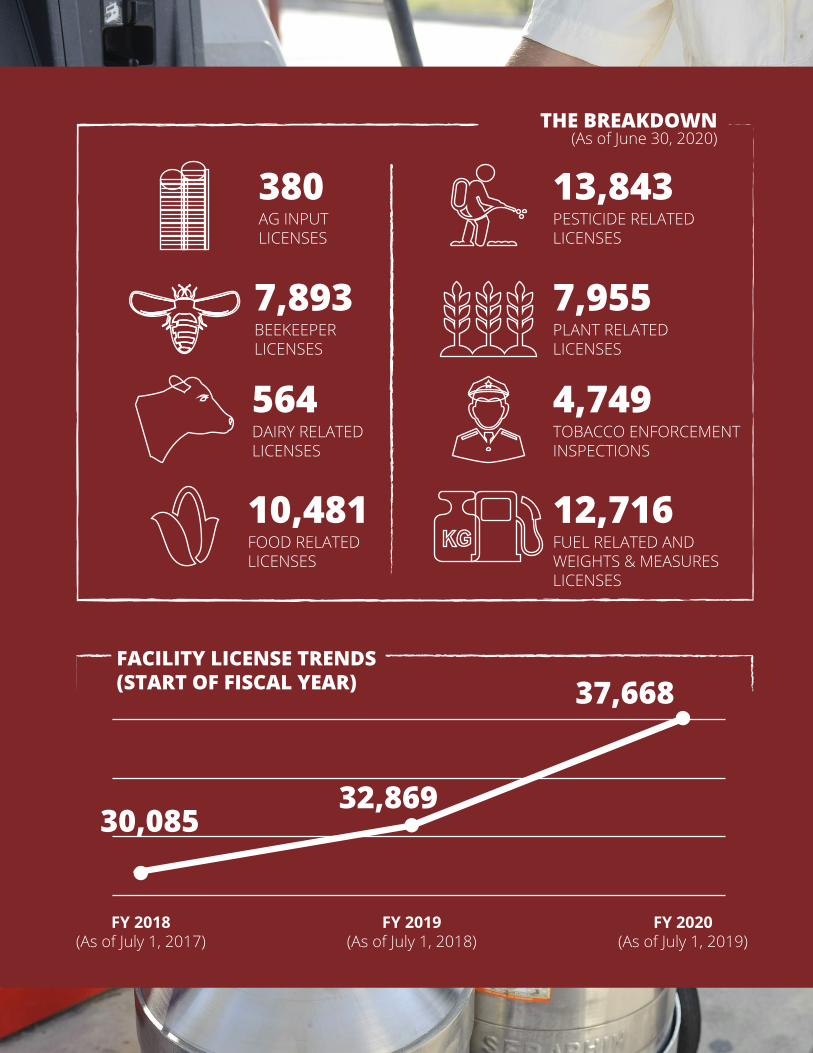
THE BREAKDOWN
AG INPUTLICENSES
380
BEEKEEPER LICENSES
7,893
DAIRY RELATED LICENSES
564
FOOD RELATED LICENSES
10,481
PESTICIDE RELATED LICENSES
13,843
PLANT RELATED LICENSES
7,955
TOBACCO ENFORCEMENT INSPECTIONS
4,749
FUEL RELATED AND WEIGHTS & MEASURES LICENSES
12,716
FY 2018(As of July 1, 2017)
FY 2019(As of July 1, 2018)
FY 2020(As of July 1, 2019)
30,08532,869
37,668FACILITY LICENSE TRENDS(START OF FISCAL YEAR)
(As of June 30, 2020)
PAGE | 12
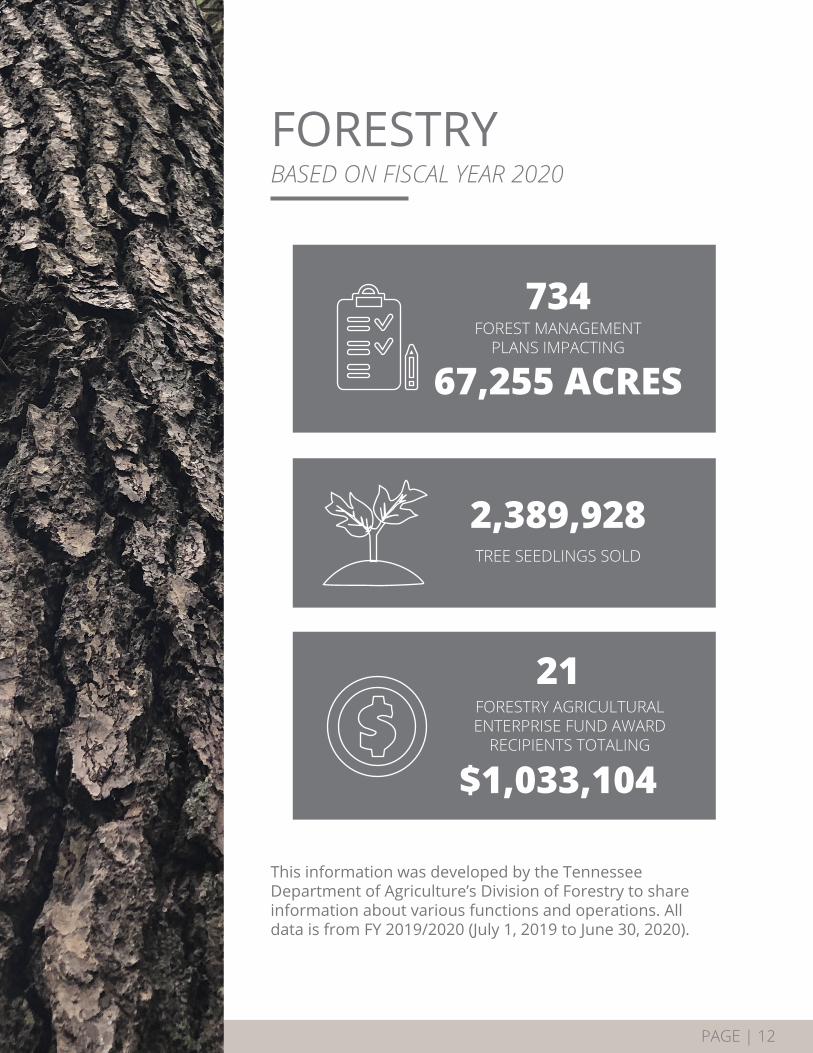
This information was developed by the Tennessee Department of Agriculture’s Division of Forestry to share information about various functions and operations. All data is from FY 2019/2020 (July 1, 2019 to June 30, 2020).
FORESTRYBASED ON FISCAL YEAR 2020
FORESTRY AGRICULTURAL ENTERPRISE FUND AWARD
RECIPIENTS TOTALING
$1,033,104
21
FOREST MANAGEMENT PLANS IMPACTING
67,255 ACRES
734
TREE SEEDLINGS SOLD
2,389,928

PAGE | 12
WILDFIRE STATISTICS
WILDFIRES SUPPRESSED THAT BURNED 3,668 ACRES
443BURN PERMITS
ISSUED FOR 34,546 ACRES
448,223
PERSONNEL DEPLOYED TO FIGHT WILDFIRES
OUT-OF-STATE
64PERSONNEL DEPLOYED
IN-STATE TO ASSIST WITH EMERGENCY
RESPONSE
34
OTHER FORESTRY STATISTICS
SAWMILLSSTATEWIDE
264VOLUNTEER FIRE DEPARTMENTS
436FIREWISE
COMMUNITIES
27
PAGE | 14
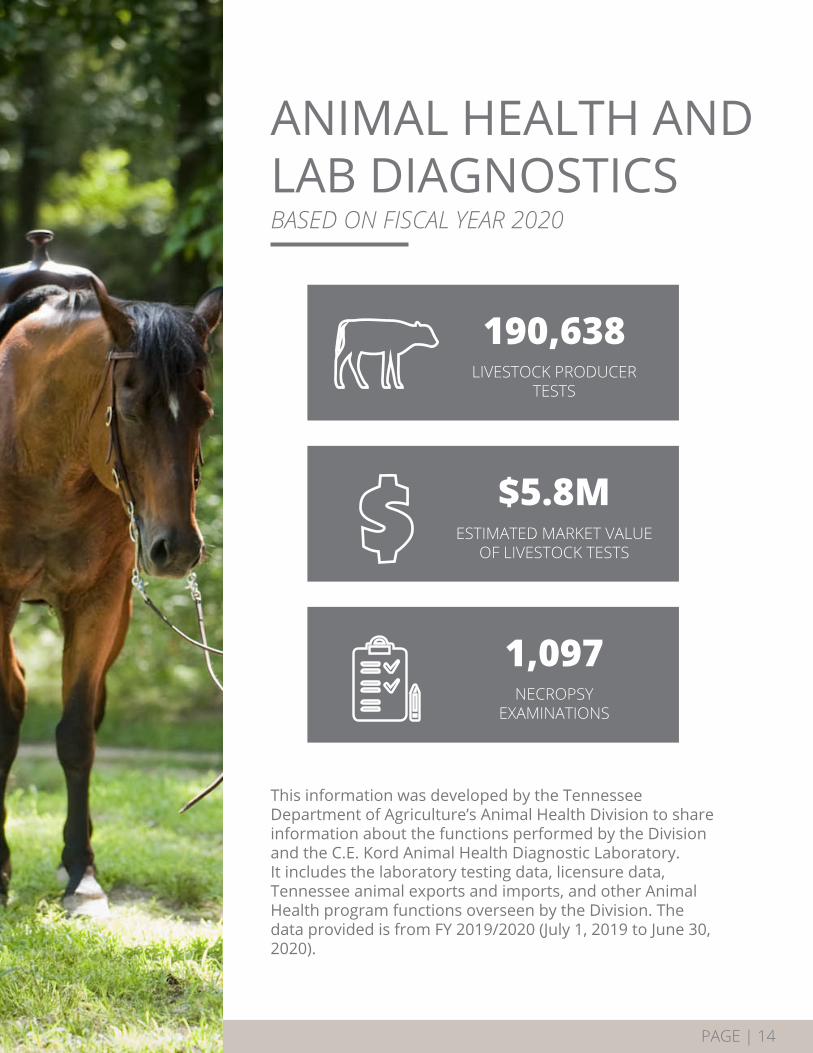
This information was developed by the Tennessee Department of Agriculture’s Animal Health Division to share information about the functions performed by the Division and the C.E. Kord Animal Health Diagnostic Laboratory. It includes the laboratory testing data, licensure data, Tennessee animal exports and imports, and other Animal Health program functions overseen by the Division. The data provided is from FY 2019/2020 (July 1, 2019 to June 30, 2020).
ANIMAL HEALTH AND LAB DIAGNOSTICS
LIVESTOCK PRODUCER TESTS
190,638
ESTIMATED MARKET VALUE OF LIVESTOCK TESTS
$5.8M
NECROPSY EXAMINATIONS
1,097
BASED ON FISCAL YEAR 2020
PAGE | 14
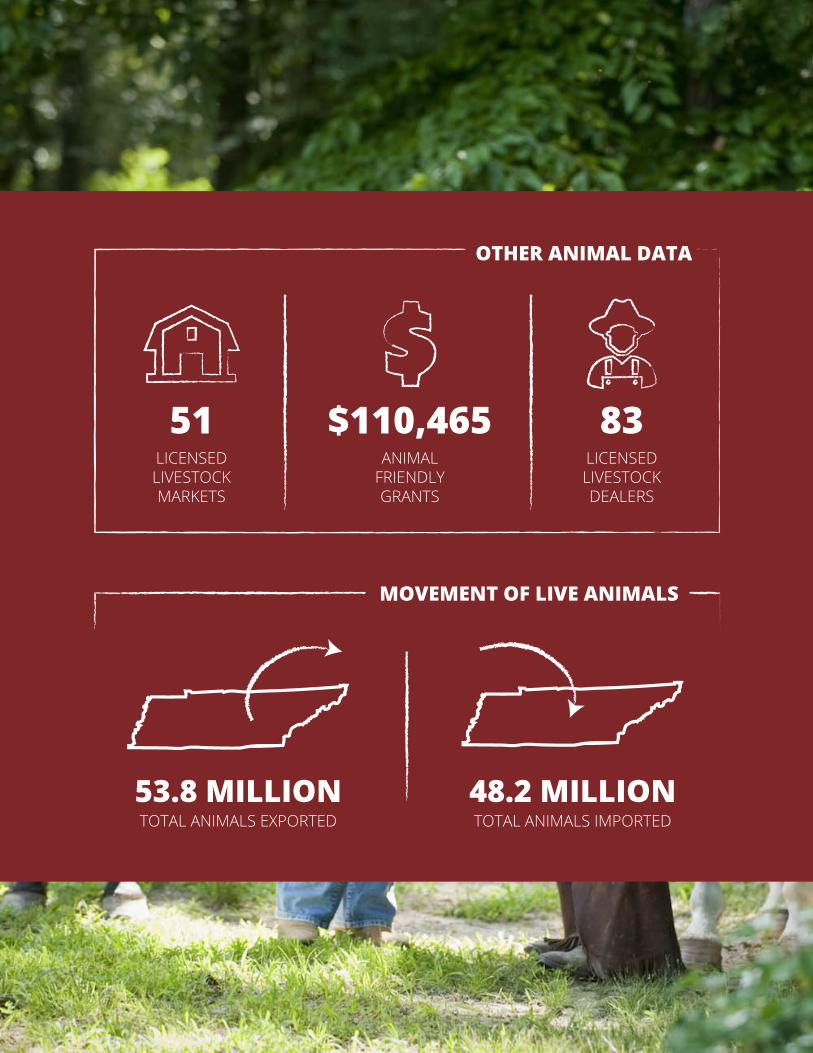
OTHER ANIMAL DATA
LICENSED LIVESTOCK MARKETS
51LICENSED LIVESTOCK DEALERS
83ANIMAL
FRIENDLY GRANTS
$110,465
53.8 MILLION 48.2 MILLION
MOVEMENT OF LIVE ANIMALS
TOTAL ANIMALS EXPORTED TOTAL ANIMALS IMPORTED

PAGE | 16
Source: USDA’s National Agricultural Statistics Service
Corn Wheat
SoybeansHay, AlfalfaHay, Other
CottonTobacco, Burley
Tobacco, Dark AirTobacco, Dark Fire
Cattle, AllCattle, BeefCattle, MilkHogs & Pigs
Sheep, AllGoats, Meat & Other
Goats, MilkBroiler Chickens
Number of Farms Land in Farms
Average Farm Size
1518163158322
16123120272
20
92542
2020 2020
140,250,00013,570,00081,000,000
74,0004,066,000
610,0004,340,0008,510,000
16,530,000
1,790,000900,000
30,000260,000
53,00096,000
7,000
70,00010,800,000
155
bu.bu.bu.tonstonsbaleslbs.lbs.lbs.
headheadheadheadheadheadhead
ac.ac.
2019
161,070,00014,405,00064,390,000
48,0004,025,000
960,0006,400,0006,450,000
17,640,000
1,810,000909,000
31,000250,000
49,000100,000
7,000
70,00010,800,000
155
bu.bu.bu.tonstonsbaleslbs.lbs.lbs.
headheadheadheadheadheadhead
ac.ac.
1617163148322
16113120302
18
92542
2019
70,000 FARMS10,800,000 ACRES
by commodityPRODUCTION
NATIONAL RANK
PAGE | 16
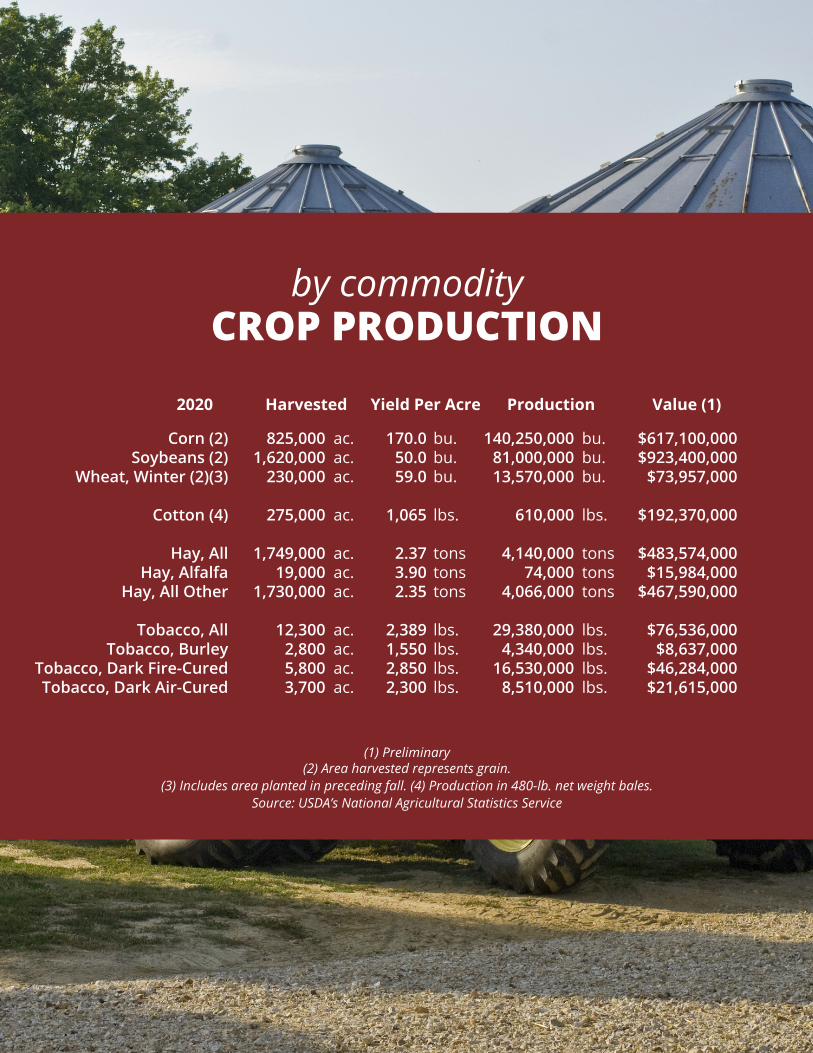
by commodityCROP PRODUCTION
Corn (2)Soybeans (2)
Wheat, Winter (2)(3)
Cotton (4)
Hay, All Hay, Alfalfa
Hay, All Other
Tobacco, All Tobacco, Burley
Tobacco, Dark Fire-CuredTobacco, Dark Air-Cured
825,0001,620,000
230,000
275,000
1,749,00019,000
1,730,000
12,3002,8005,8003,700
Harvested Value (1)
$617,100,000$923,400,000
$73,957,000
$192,370,000
$483,574,000$15,984,000
$467,590,000
$76,536,000$8,637,000
$46,284,000$21,615,000
Yield Per Acre
170.050.059.0
1,065
2.373.902.35
2,3891,5502,8502,300
bu.bu.bu.
lbs.
tonstonstons
lbs.lbs.lbs.lbs.
Production
140,250,00081,000,00013,570,000
610,000
4,140,00074,000
4,066,000
29,380,0004,340,000
16,530,0008,510,000
bu.bu.bu.
lbs.
tonstonstons
lbs.lbs.lbs.lbs.
(1) Preliminary(2) Area harvested represents grain.
(3) Includes area planted in preceding fall. (4) Production in 480-lb. net weight bales.Source: USDA’s National Agricultural Statistics Service
ac.ac.ac.
ac.
ac.ac.ac.
ac.ac.ac.ac.
2020
PAGE | 18
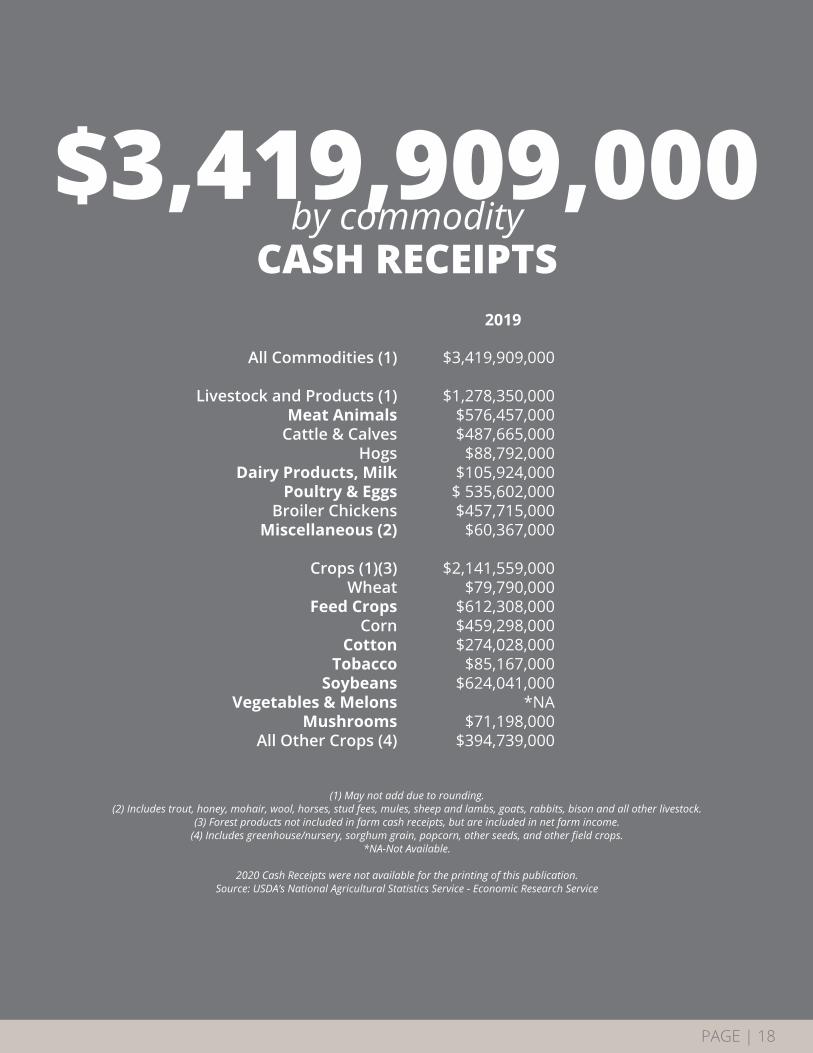
by commodityCASH RECEIPTS
$3,419,909,000
$1,278,350,000$576,457,000$487,665,000
$88,792,000$105,924,000$ 535,602,000$457,715,000
$60,367,000
$2,141,559,000$79,790,000
$612,308,000$459,298,000$274,028,000
$85,167,000$624,041,000
*NA$71,198,000
$394,739,000
2019
All Commodities (1)
Livestock and Products (1)Meat Animals
Cattle & CalvesHogs
Dairy Products, MilkPoultry & Eggs
Broiler ChickensMiscellaneous (2)
Crops (1)(3)
WheatFeed Crops
CornCotton
TobaccoSoybeans
Vegetables & MelonsMushrooms
All Other Crops (4)
(1) May not add due to rounding. (2) Includes trout, honey, mohair, wool, horses, stud fees, mules, sheep and lambs, goats, rabbits, bison and all other livestock.
(3) Forest products not included in farm cash receipts, but are included in net farm income. (4) Includes greenhouse/nursery, sorghum grain, popcorn, other seeds, and other field crops.
*NA-Not Available.
2020 Cash Receipts were not available for the printing of this publication.Source: USDA’s National Agricultural Statistics Service - Economic Research Service
$3,419,909,000

PAGE | 18
summary per headLIVESTOCK
All Cattle and Calves Cows and Heifers That Have Calved Beef Cows Milk Cows Calves Under 500 Pounds Steers 500 Pounds and Over Heifers 500 Pounds and Over Beef Cow Replacements Milk Cow Replacements Other Heifers Bulls 500 Pounds and OverCalf CropTotal Hogs All Meat & Other GoatsAll Milk GoatsAll Sheep & Lambs (1)Lamb Crop (2)All LayersTotal PulletsOther ChickensAll Chickens
1,830,000950,000910,000
40,000430,000150,000
135,00025,00080,00060,000
860,000250,000
89,0007,000
48,00034,000
1,409,0001,047,000
145,0002,601,000
(1) All sheep includes new crop lambs. New crop lambs are lambs born after September 30, the previous year. (2) Total for the year. Lamb crop defined as lambs marked, docked or branded.
Source: USDA’s National Agricultural Statistics Service
2019
1,800,000950,000914,000
36,000410,000130,000
145,00025,00075,00065,000
860,000260,000100,000
7,40049,00037,000
1,618,0001,432,000
137,0003,187,000
2020
Tennessee Department of AgricultureEllington Agricultural Center
440 Hogan Road | Nashville, TN 37220
(615) 837-5103tn.gov/agriculture
Tennessee Department of Agriculture, Authorization No. 325529, 200 copies, April 2021. This public document was promulgated at a cost of $2.80 per copy.
See what’s happening in agriculture and forestry where you live. The Tennessee Department of Agriculture offers free, interactive data online. Live dashboards show the most requested data and key metrics from a statewide overview down to the county level.
Social icon
Rounded squareOnly use blue and/or white.
For more details check out ourBrand Guidelines.
Recommended