CHAPTER-1 INTRODUCTION
1.1 BACKGROUND TO THE STUDY
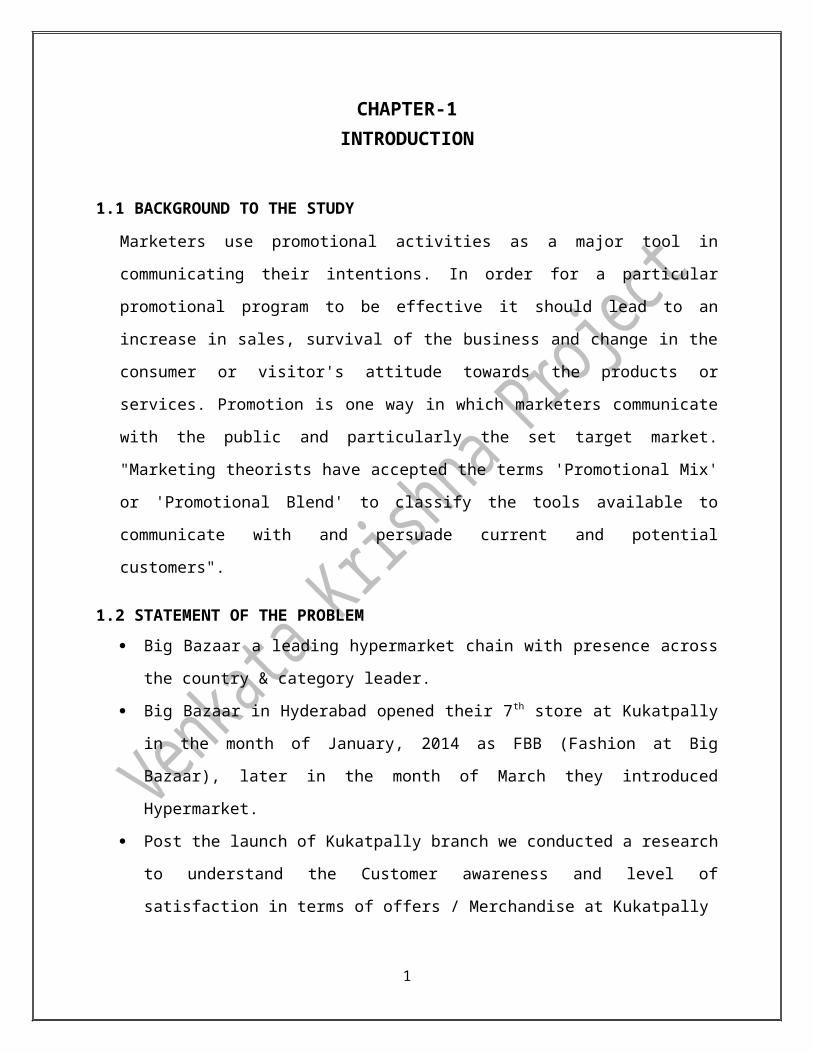
Marketers use promotional activities as a major tool in communicating their intentions. In
order for a particular promotional program to be effective it should lead to an increase in
sales, survival of the business and change in the consumer or visitor's attitude towards the
products or services. Promotion is one way in which marketers communicate with the public
and particularly the set target market. "Marketing theorists have accepted the terms
'Promotional Mix' or 'Promotional Blend' to classify the tools available to communicate with
and persuade current and potential customers".
1.2 STATEMENT OF THE PROBLEM
Big Bazaar a leading hypermarket chain with presence across the country & category
leader.
Big Bazaar in Hyderabad opened their 7th store at Kukatpally in the month of January,
2014 as FBB (Fashion at Big Bazaar), later in the month of March they introduced
Hypermarket.
Post the launch of Kukatpally branch we conducted a research to understand the
Customer awareness and level of satisfaction in terms of offers / Merchandise at
Kukatpally
1.3 THE PURPOSE OF THE STUDY
The purpose of the study is to determine the Effectiveness of Promotional Activities and
Perception about the Store either FBB or Hypermarket
1.4 OBJECTIVES OF THE STUDY
To know the Effectiveness of Promotional Activities at Kukatpally Big Bazaar To know whether the customer are aware about the change from FBB to Hypermarket
1
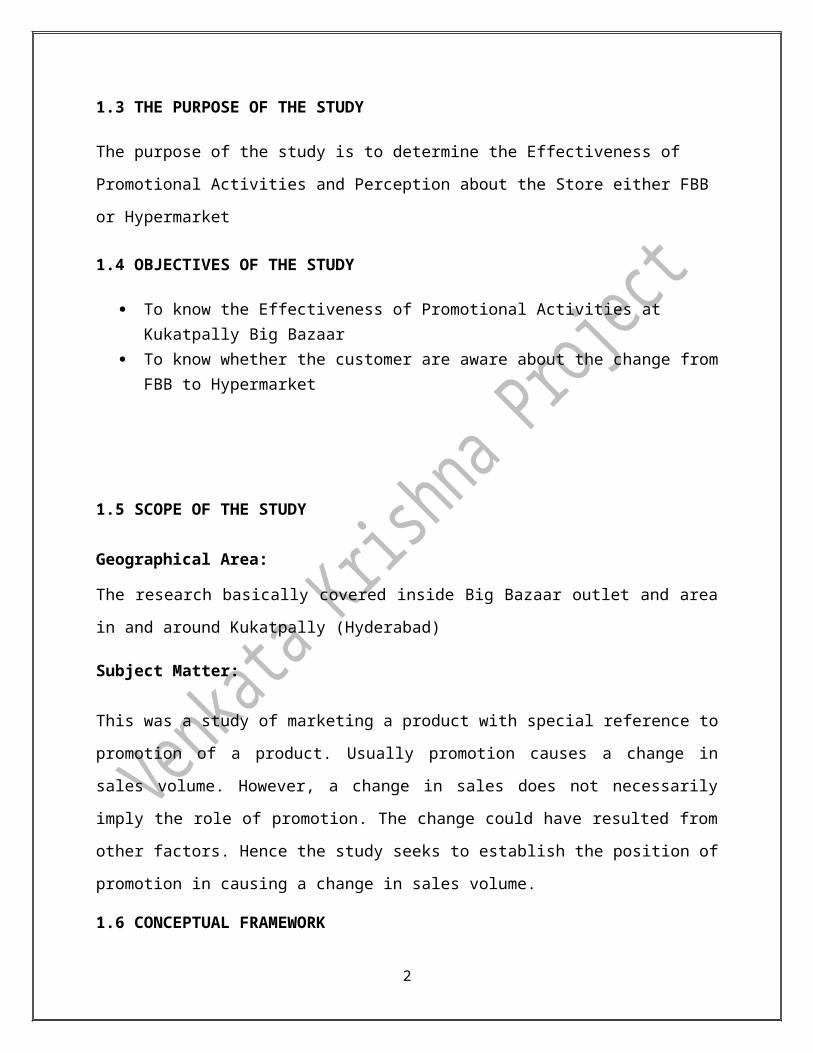
1.5 SCOPE OF THE STUDY Geographical Area:
The research basically covered inside Big Bazaar outlet and area in and around Kukatpally
(Hyderabad)
Subject Matter:
This was a study of marketing a product with special reference to promotion of a product.
Usually promotion causes a change in sales volume. However, a change in sales does not
necessarily imply the role of promotion. The change could have resulted from other factors.
Hence the study seeks to establish the position of promotion in causing a change in sales volume.
1.6 CONCEPTUAL FRAMEWORK
Promotion has been identified as one of the elements of an organization's marketing mix that
influence its customers. This makes it stand out in the famous traditional 4Ps amongst others that
include Product, Price and Place. The model to be adopted will emphasize Promotion to include
Advertising, Sales Promotion, Personal Selling, Publicity and Public Relations. These, combined
have an effect in terms of making customers to buy the products.
1.7 JUSTIFICATION AND SIGNIFICANCE OF THE STUDY
The study is likely to benefit several parties including scholars, marketing, and Operation
division to reach and serve as many customers as possible. The findings from the study may be a
base for promotional decisions. The findings of the study should act as a guideline in the making
effective management decision.
2

CHAPTER-2
2.0 INDUSTRY PROFILE
Retail consists of the sale of goods or merchandise from a fixed location, such as a
department store, boutique or mall, in small or individual lots for direct consumption by the
purchaser. Retailing may include subordinated services, such as delivery. Purchasers may be
individuals or businesses. In commerce, a ‘retailer’ buys goods or products in large quantities to
the end-user. Retail establishments are often called shops or stores. Retailers are at the end of the
supply chain. Manufacturing marketers see the process of retailing as a necessary part of their
overall distribution strategy.
2.1 Retail Sector
The retail sector in India is witnessing a huge revamping exercise as traditional markets
make way for new formats such as departmental stores, hypermarkets, supermarkets and
specialty stores. Western-style malls have begun appearing in metros and Tier-2 cities alike
introducing the Indian consumer to a shopping experience like never before. The sector is at an
inflexion point where the growth of organised retailing and growth in the consumption by the
Indian population is going to take a higher growth trajectory. The Indian population is witnessing
a significant change in its demographics. Organised retail is on all-time high in India.
Retailing consists of the location sale of goods or merchandise from a very fixed location,
such as a department store, by mall, in small or individual lots direct consumption by the
purchaser. Retailing may include subordinated services, such as delivery. Retail is usually
classified by type of products as follows:
Food products
Hard Goods – Appliances, Electronics, Furniture, etc
Soft Goods- clothing, apparel, and other fabrics.
There are the following retailers by marketing strategy:
Departmental stores - very large stores offering a huge assortment of soft and hard goods
Supermarkets - Is a self-service store consisting mainly of grocery and limited products
on non-food items. Sells mostly food products
3

Warehouse stores - warehouses that offer low-cost, often high quantity goods piled on
pallets or steel shelves, warehouse clubs charge a membership fee.
General stores - A rural store that supplies the main needs for the local community.
Convenience stores - Is essentially found in residential areas. They provide limited
amount of merchandise at more than average prices with a speedy checkout. This store is
ideal for the emergency and immediate purchases.
Hypermarkets - provides variety and huge volumes of exclusive merchandise at low
margins. The operating cost is comparatively less than other retail formats.
Malls - range of retail shops at a single outlet.
Indian retail market is expected to grow at a CAGR of 13% till 2018
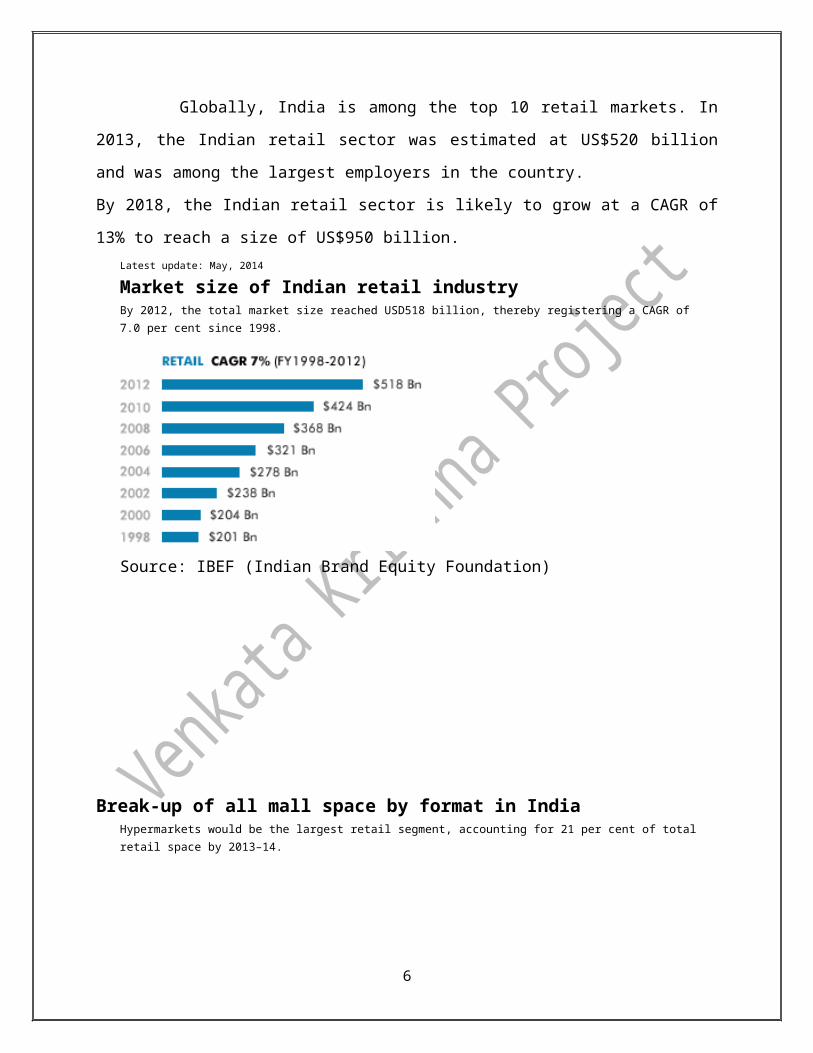
Globally, India is among the top 10 retail markets. In 2013, the Indian retail sector was
estimated at US$520 billion and was among the largest employers in the country.
By 2018, the Indian retail sector is likely to grow at a CAGR of 13% to reach a size of US$950
billion.Latest update: May, 2014
Market size of Indian retail industryBy 2012, the total market size reached USD518 billion, thereby registering a CAGR of 7.0 per cent since 1998.
Source: IBEF (Indian Brand Equity Foundation)
4
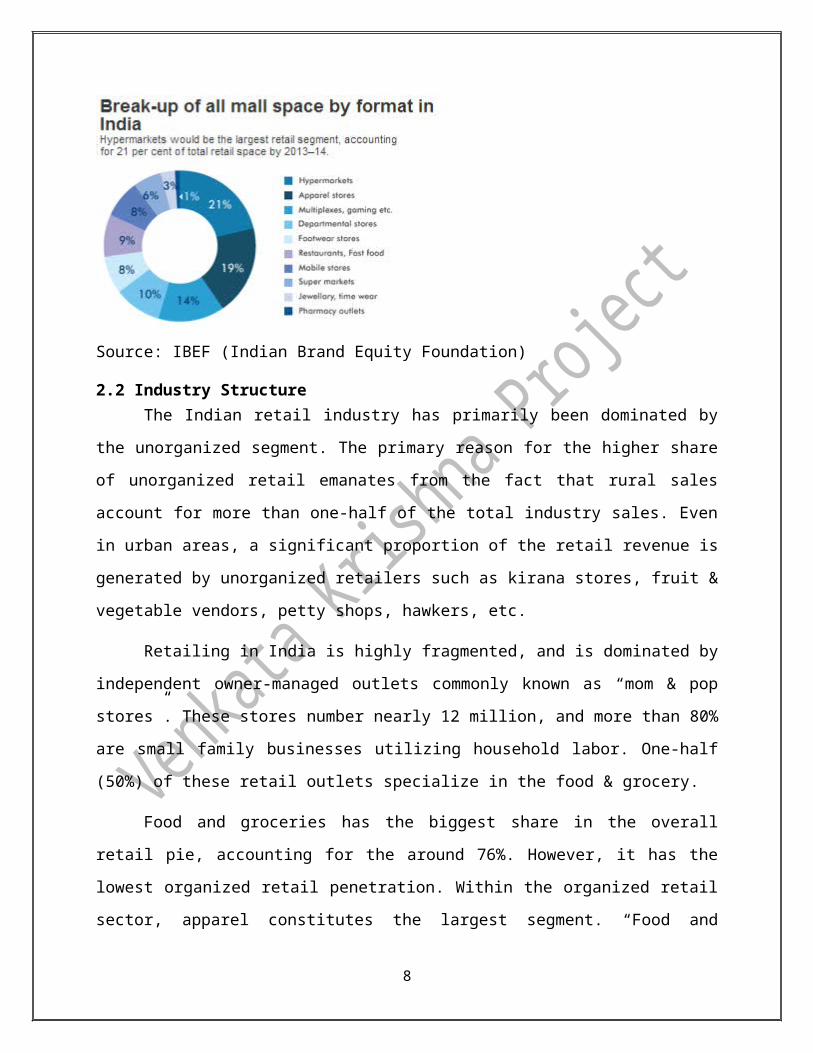
Break-up of all mall space by format in IndiaHypermarkets would be the largest retail segment, accounting for 21 per cent of total retail space by 2013–14.
Source: IBEF (Indian Brand Equity Foundation)
Organized retail market in India is burgeoning and is expected to grow at CAGR of 19-20% over the next 5 years
The Indian retail sector is set to grow rapidly with a gradual shift toward organized Retailing
formats. Organized retail penetration is expected to increase from 7.5% in 2013 to 10% in 2018
at a robust CAGR of 19-20% during the same period.
This will be driven by a combination of demand, supply and regulatory factors, which are
expected to be the growth engines of the Indian consumer and retail market.
Source: IBEF (Indian Brand Equity Foundation)
5
Source: IBEF (Indian Brand Equity Foundation)
2.2 Industry StructureThe Indian retail industry has primarily been dominated by the unorganized segment. The
primary reason for the higher share of unorganized retail emanates from the fact that rural sales
account for more than one-half of the total industry sales. Even in urban areas, a significant
proportion of the retail revenue is generated by unorganized retailers such as kirana stores, fruit
& vegetable vendors, petty shops, hawkers, etc.
Retailing in India is highly fragmented, and is dominated by independent owner-managed
outlets commonly known as “mom & pop stores”. These stores number nearly 12 million, and
more than 80% are small family businesses utilizing household labor. One-half (50%) of these
retail outlets specialize in the food & grocery.
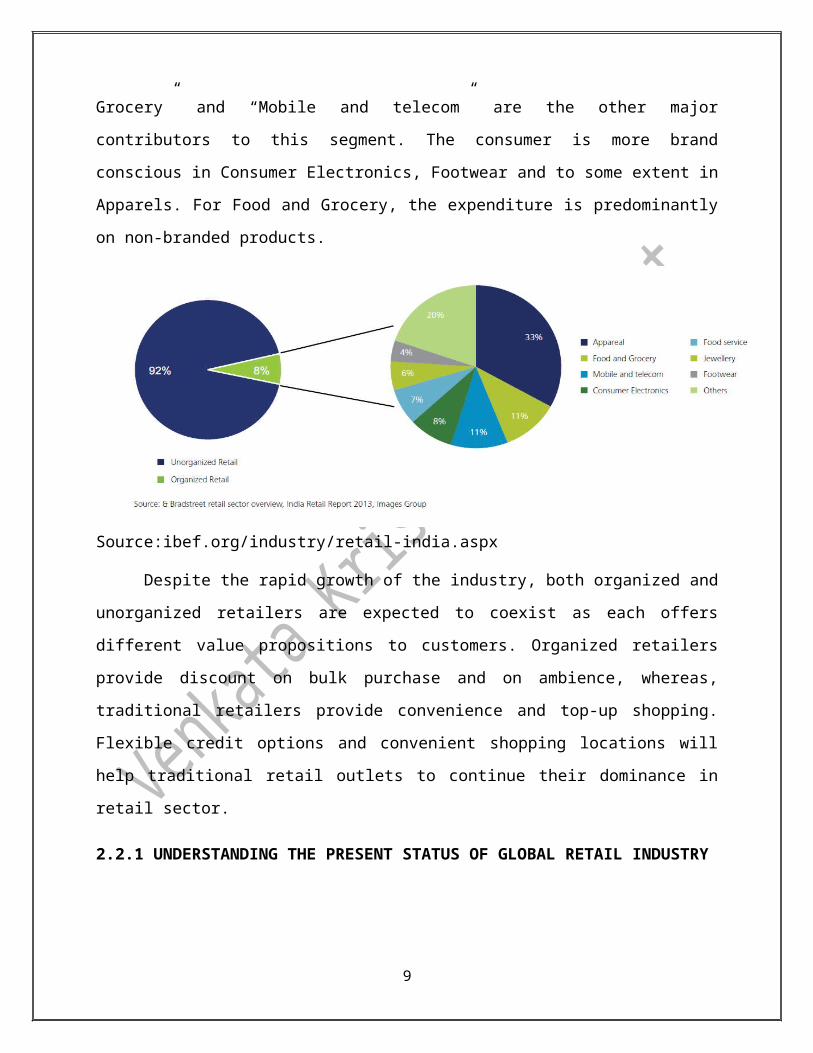
Food and groceries has the biggest share in the overall retail pie, accounting for the
around 76%. However, it has the lowest organized retail penetration. Within the organized retail
sector, apparel constitutes the largest segment. “Food and Grocery” and “Mobile and telecom”
are the other major contributors to this segment. The consumer is more brand conscious in
Consumer Electronics, Footwear and to some extent in Apparels. For Food and Grocery, the
expenditure is predominantly on non-branded products.
6

Source:ibef.org/industry/retail-india.aspx
Despite the rapid growth of the industry, both organized and unorganized retailers are
expected to coexist as each offers different value propositions to customers. Organized retailers
provide discount on bulk purchase and on ambience, whereas, traditional retailers provide
convenience and top-up shopping. Flexible credit options and convenient shopping locations will
help traditional retail outlets to continue their dominance in retail sector.
2.2.1 UNDERSTANDING THE PRESENT STATUS OF GLOBAL RETAIL INDUSTRY
It’s not all good news, however. Respondents in India most often cite inflation as a threat
to domestic growth, with commodity and energy prices identified as the primary factors that
make it a risk. Inflation is also top of mind in Latin America, where 53 percent of respondents
say it’s a risk, compared with the global average of 21 percent. And while most executives in
India expect their inflation rate will stay the same or decrease over the next six months, those in
Latin America and developed Asia
Australia, Hong Kong, Japan, New Zealand, the Philippines, Singapore, South Korea, and
Taiwan are the most likely to expect inflation rates in their countries will increase. Across
regions, many executives agree that economic conditions are improving and will continue to do
so in the coming months. At the country level, they are twice more likely to say current
conditions at home have improved than to say conditions have worsened. Looking ahead, 53
percent expect conditions will improve in the next six months. While geopolitical instability still
poses the biggest threat to global growth.
7
Sixty percent of all respondents cite geopolitical instability as a top risk to global
economic growth in the next 12 months. During the week the survey was in the field, a group of
militants defeated Iraqi military forces and took control of Mosul, the country’s second-largest
city—one week after militants invaded Samarra, another city in Iraq as it did in March,
executives maintain a positive view of conditions—both current and future—in the world
economy. In most geography, respondent’s views on current global conditions have either met or
surpassed their expectations from six months ago.
In most regions, assessments of the global economy either meet or exceed earlier expectations.
Source: McKinsey & Company Global Survey
8
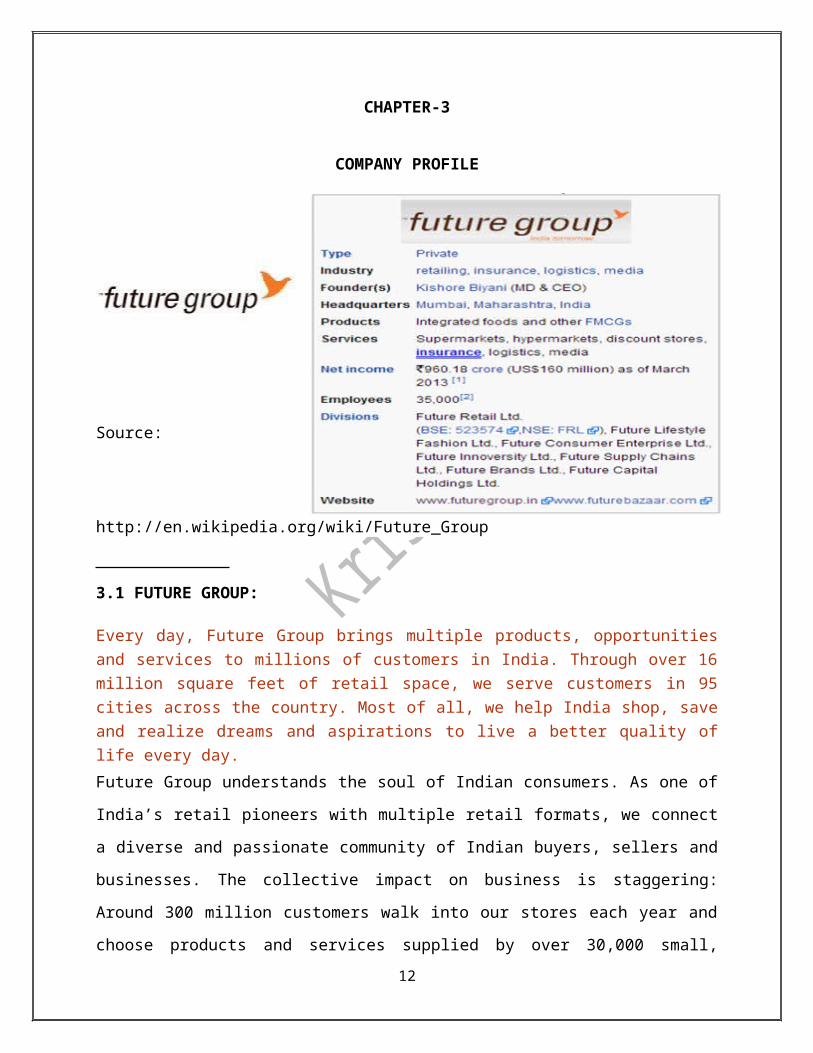
CHAPTER-3
COMPANY PROFILE
Source: http://en.wikipedia.org/wiki/Future_Group
3.1 FUTURE GROUP:
Every day, Future Group brings multiple products, opportunities and services to millions of
customers in India. Through over 16 million square feet of retail space, we serve customers in 95
cities across the country. Most of all, we help India shop, save and realize dreams and aspirations
to live a better quality of life every day.
Future Group understands the soul of Indian consumers. As one of India’s retail pioneers with
multiple retail formats, we connect a diverse and passionate community of Indian buyers, sellers
and businesses. The collective impact on business is staggering: Around 300 million customers
walk into our stores each year and choose products and services supplied by over 30,000 small,
medium and large entrepreneurs and manufacturers from across India. And this number is set to
grow.
Future Group employs 30,000 people directly from every section of our society. We source our
supplies from enterprises across the country, creating fresh employment, impacting livelihoods,
empowering local communities and fostering mutual growth.
9
We believe in the ‘Indian dream’ and have aligned our business practices to our larger objective
of being a premier catalyst in India’s consumption-led growth story. Working towards this end,
we are ushering positive socio-economic changes in communities to help the Indian dream fly
high and the ‘Sone Ki Chidiya’ soar once again. This approach remains embedded in our ethos
even as we rapidly expand our footprints deeper into India.
About Future Group
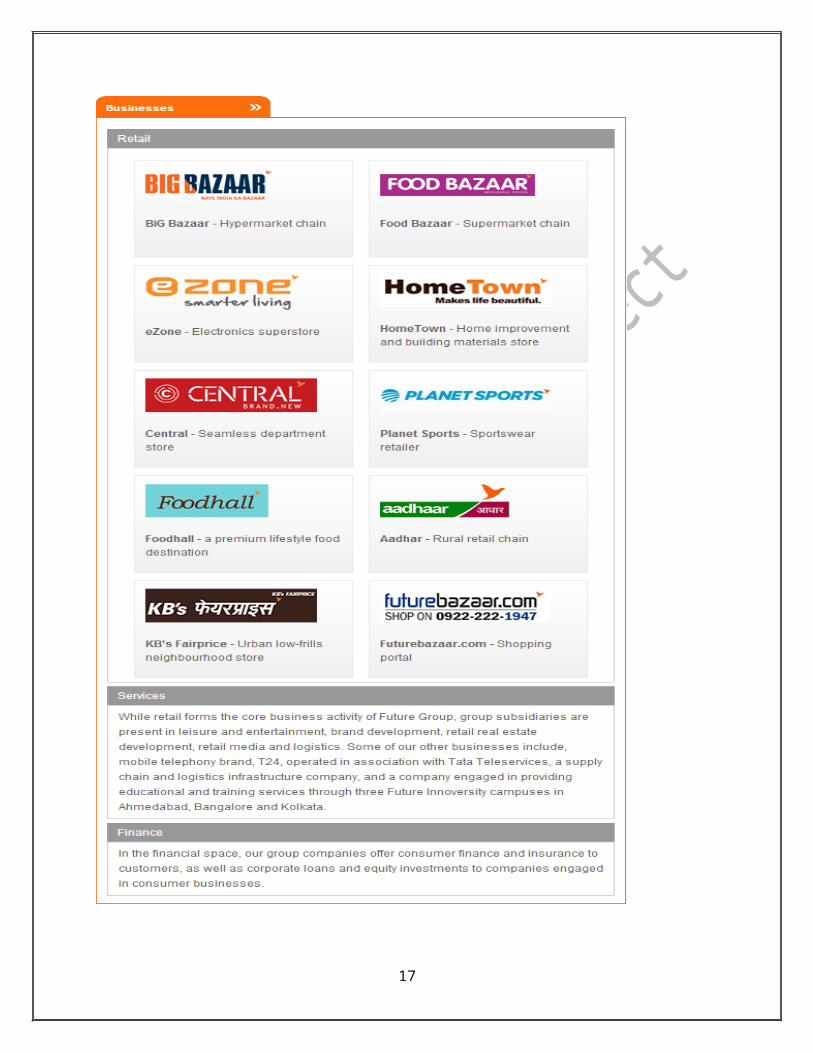
Big Bazaar is part of the retail network of Future Group. Future Group operates some of India’s
most popular retail chains including Pantaloons, Central, Big Bazaar, Food Bazaar, Home Town
and eZone and also has allied businesses in consumer finance, life and non-life insurance,
logistics infrastructure and supply chain and brand development. The group operates over 17
million square feet of retail space in over 90 cities and towns and 60 rural locations across India.
The group’s retail formats connect over 300 million customers to over 30,000 small, medium and
large enterprises that supply products and services to its retail chains. Future Group believes in
developing strong insights on Indian consume
Retail
Winning the Hearts of Indian Consumers
Future Group was conceived as a force to drive domestic consumption and capture every
addressable need of Indian consumers.
Future Group makes every effort to delight its customers, tailoring store formats to changing
Indian lifestyles and adapting products and services to their desires.
The group is credited with creating some of India’s most popular retail chains. The 162-store
hypermarket chain, Big Bazaar is ranked amongst the top 3 service brands in the country by The
Nielsen Company. Other retail chains include, department store chain, Central, outlet stores
chain, Brand Factory, sportswear chain, Planet Sports, home improvement and consumer
durables chain, Home Town and Ezone, supermarket chain, Food Bazaar, convenience stores
chain, KB’s Fairprice and a growing rural distribution network through Aadhaar.
As modern retail drives fresh demand and consumption in new categories, our strategy is based
on a deep understanding of Indian consumers, the products they want, and making these products
10

available in every city, in every store format. Future Group offers innovative offerings at
affordable prices tailored to the needs of every Indian household.
Pioneers in the India’s retail space, our formats are household names in more than 95 cities
across the country
Our stores cover around 16 million square feet of retail space and attract around 300 million
customers each year
Future Retail Limited focuses on the hypermarket & supermarket business led by formats like
BB, FB, FBB, Food hall, Home town & eZone
Future Lifestyle fashion focuses on the fashion businesses with over 24 popular fashion brands
& retail formats like Central, Brand Factory, Planet Sports, I m in and all
Future Consumer Enterprise Ltd is group's integrated food company with Food & FMCG
brands & retail formats like KB’s fair price & Aadhar. It also has interest in Food Pa
3.1.1 The Future of Future Group
Organized retail is a new phenomenon in India and despite the downturns, the market is
growing exponentially, as economic growth brings more of India’s people into the consuming
classes and organized retail lures more and more existing shoppers into its open doors. By 2015,
more than 300 million shoppers are likely to patronize organized retail chains.
The growing middle class is an important factor contributing to the growth of retail in
India. By 2030, it is estimated that 91 million households will be ‘middle class’, up from 21
million today. Also by 2030, 570 million people are expected to live in cities, nearly twice the
population of the United States today.
Consumer markets in emerging market economies like India are growing rapidly owing to
robust economic growth. India's modern consumption level is set to double within five years to
US$ 1.5 trillion from the present level of US$ 750 billion. With India's large ‘young’ population
and high domestic consumption, the macro trends for the sector look favorable.
Online retail business is another format which has high potential for growth in the near
future. The online retail segment in India is growing at an annual rate of 35 per cent, which
would take its value from Rs 2,000 cr. (US$ 429.5 million) in 2011 to Rs 7,000 cr. (US$ 1.5
billion) by 2015.
11
12
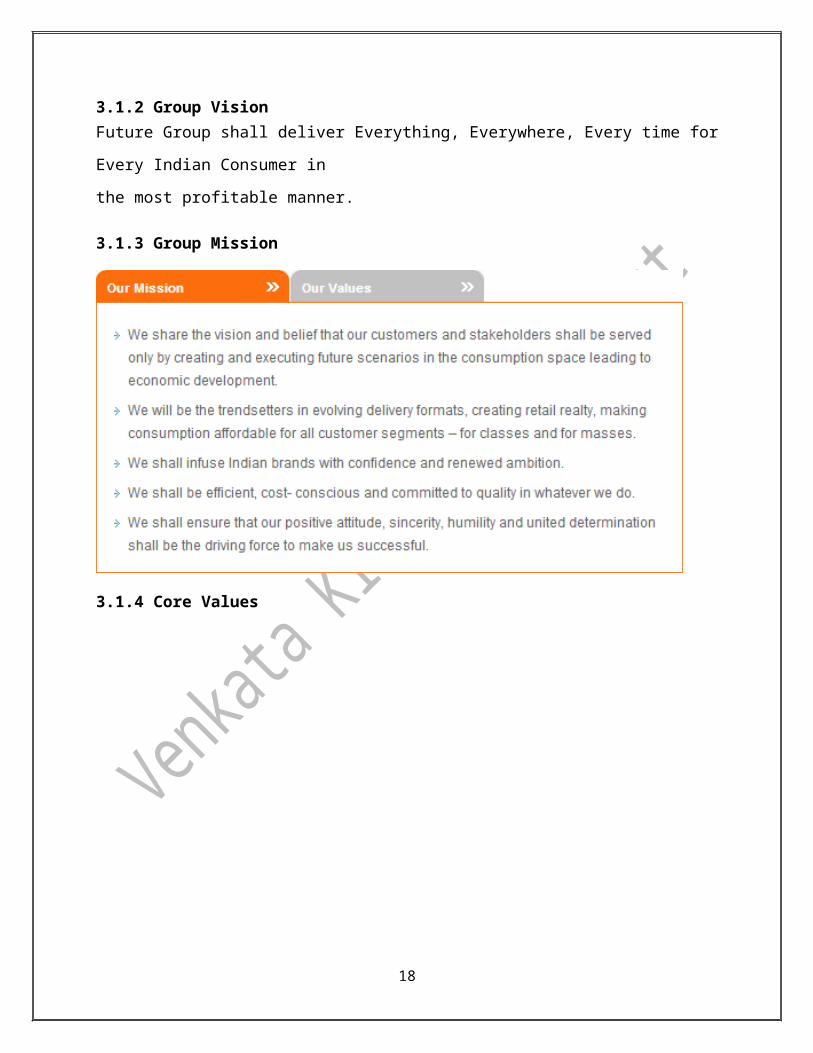
3.1.2 Group VisionFuture Group shall deliver Everything, Everywhere, Every time for Every Indian Consumer in
the most profitable manner.
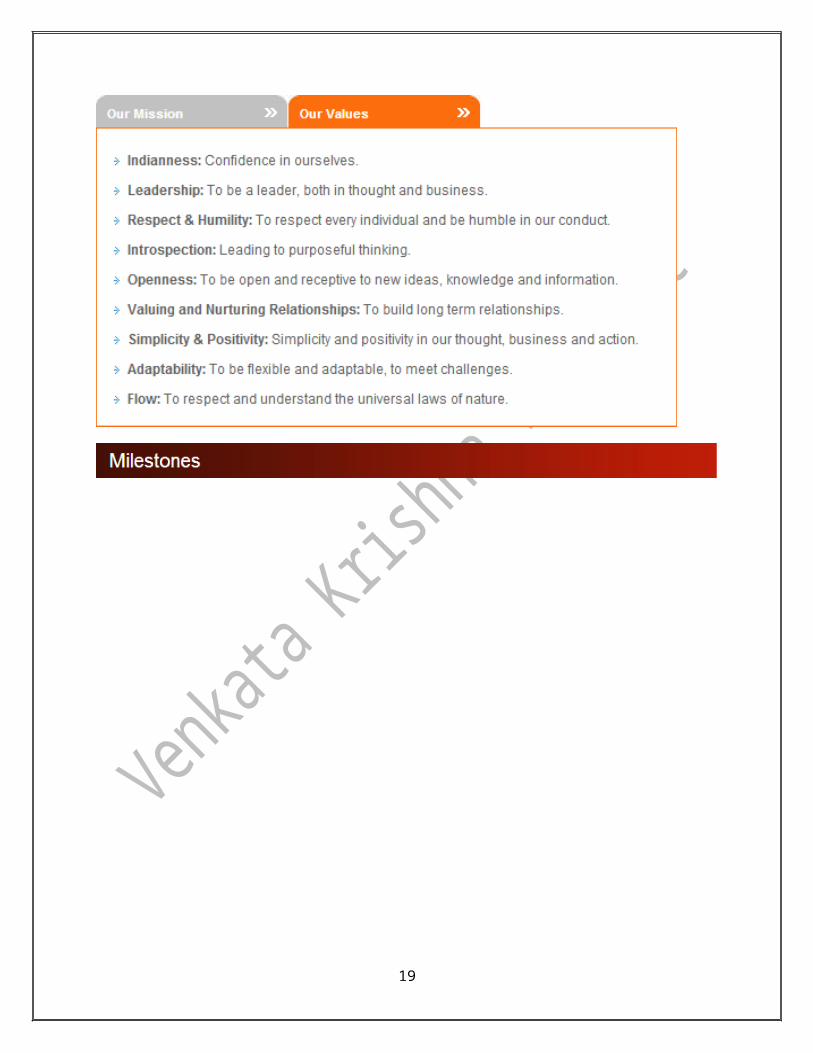
3.1.3 Group Mission
3.1.4 Core Values
13

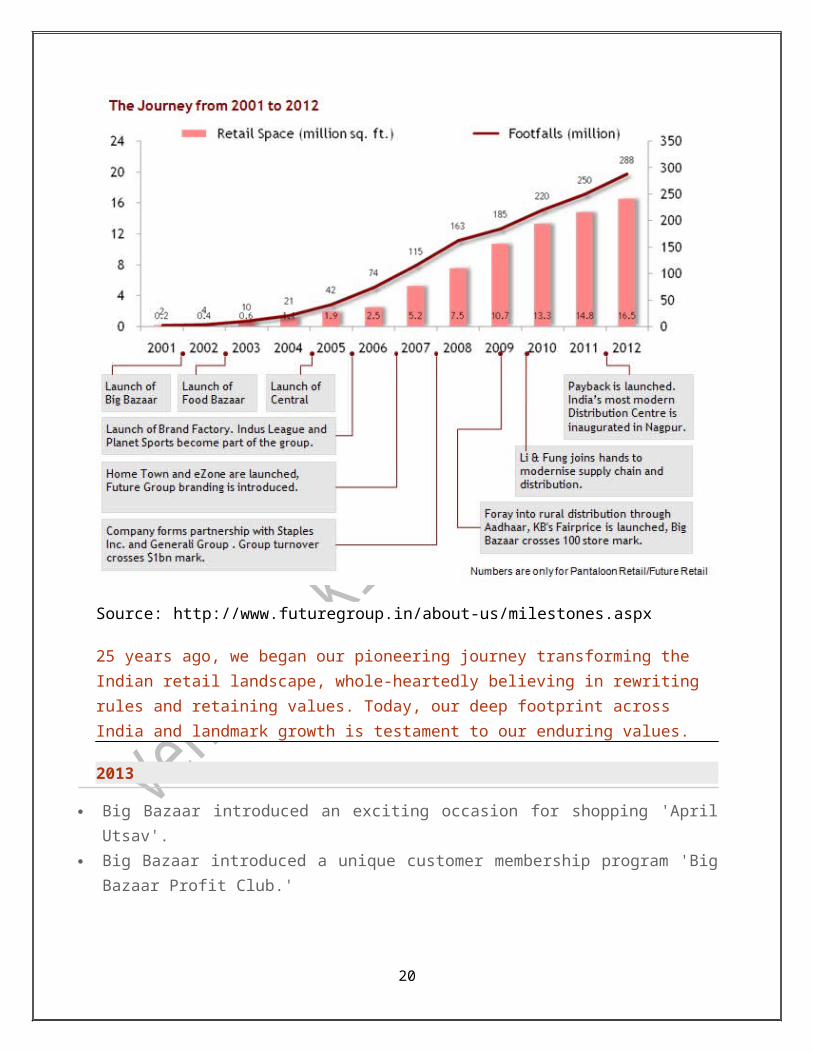
Source: http://www.futuregroup.in/about-us/milestones.aspx
25 years ago, we began our pioneering journey transforming the Indian retail landscape, whole-heartedly believing in rewriting rules and retaining values. Today, our deep footprint across India and landmark growth is testament to our enduring values.
2013
Big Bazaar introduced an exciting occasion for shopping 'April Utsav'.
Big Bazaar introduced a unique customer membership program 'Big Bazaar Profit Club.'
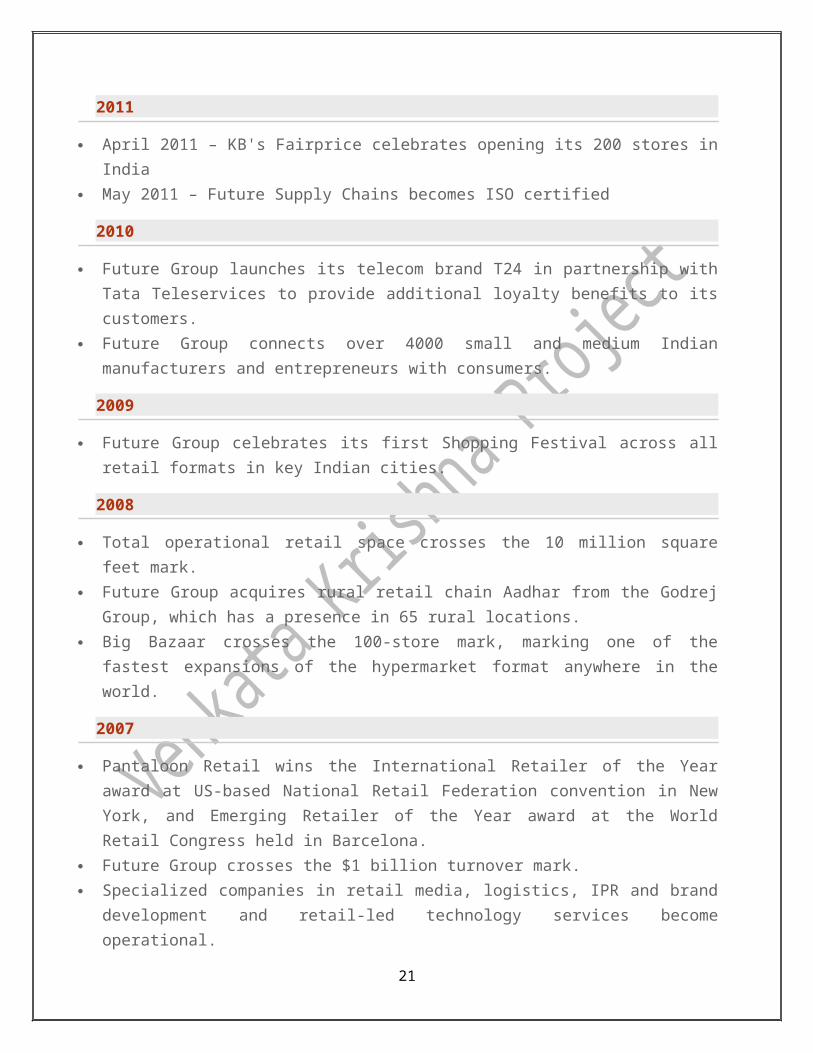
2011
April 2011 – KB's Fairprice celebrates opening its 200 stores in India
May 2011 – Future Supply Chains becomes ISO certified
14
2010
Future Group launches its telecom brand T24 in partnership with Tata Teleservices to provide
additional loyalty benefits to its customers.
Future Group connects over 4000 small and medium Indian manufacturers and entrepreneurs
with consumers.
2009
Future Group celebrates its first Shopping Festival across all retail formats in key Indian cities.
2008
Total operational retail space crosses the 10 million square feet mark.
Future Group acquires rural retail chain Aadhar from the Godrej Group, which has a presence in
65 rural locations.
Big Bazaar crosses the 100-store mark, marking one of the fastest expansions of the
hypermarket format anywhere in the world.
2007
Pantaloon Retail wins the International Retailer of the Year award at US-based National Retail
Federation convention in New York, and Emerging Retailer of the Year award at the World
Retail Congress held in Barcelona.
Future Group crosses the $1 billion turnover mark.
Specialized companies in retail media, logistics, IPR and brand development and retail-led
technology services become operational.
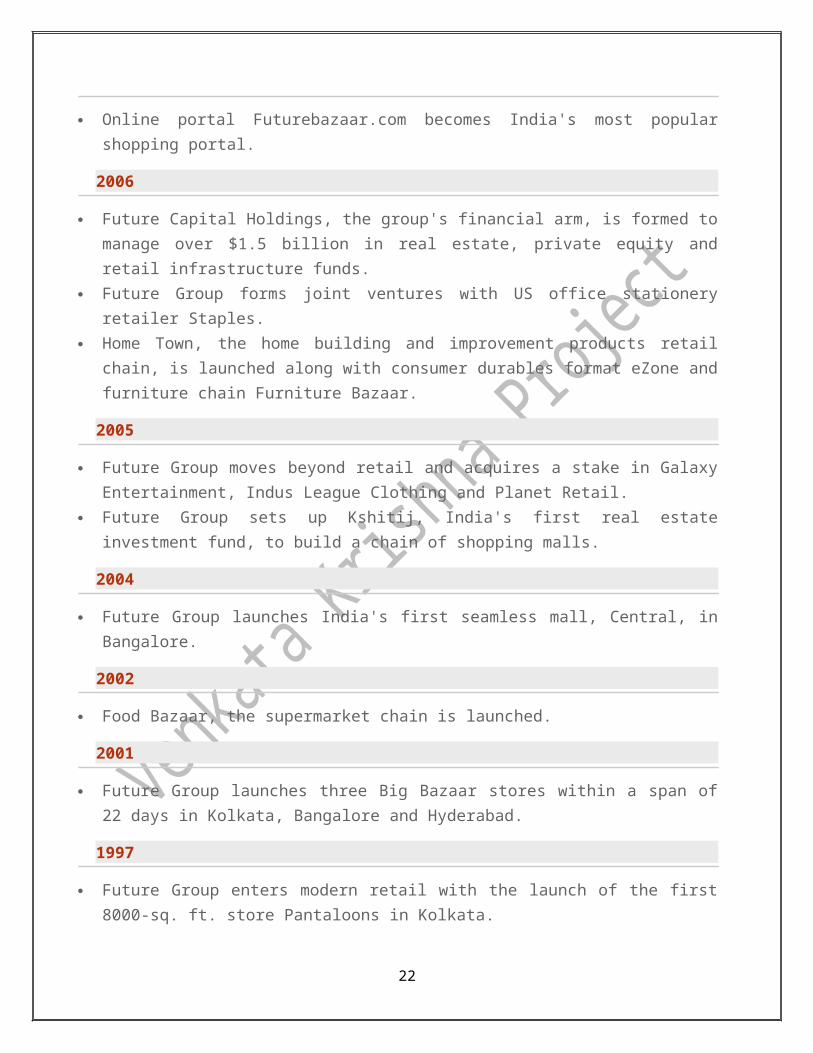
Online portal Futurebazaar.com becomes India's most popular shopping portal.
2006
Future Capital Holdings, the group's financial arm, is formed to manage over $1.5 billion in real
estate, private equity and retail infrastructure funds.
Future Group forms joint ventures with US office stationery retailer Staples.
Home Town, the home building and improvement products retail chain, is launched along with
consumer durables format eZone and furniture chain Furniture Bazaar.
2005
Future Group moves beyond retail and acquires a stake in Galaxy Entertainment, Indus League
Clothing and Planet Retail.
15

Future Group sets up Kshitij, India's first real estate investment fund, to build a chain of
shopping malls.
2004
Future Group launches India's first seamless mall, Central, in Bangalore.
2002
Food Bazaar, the supermarket chain is launched.
2001
Future Group launches three Big Bazaar stores within a span of 22 days in Kolkata, Bangalore
and Hyderabad.
1997
Future Group enters modern retail with the launch of the first 8000-sq. ft. store Pantaloons in
Kolkata.
1995
Future Group launches John Miller, a brand for Formal shirts.
1994
The Pantaloon Shoppe, Future Group's exclusive menswear store in a franchisee format is
launched across the nation. The company starts distribution of branded garments through multi-
brand retail outlets across the nation.
1992
Initial Public Offer (IPO) of shares by the Company
1991
BARE, an Indian denim brand is launched.
1987
The company is incorporated under the name of Manz Wear Private Ltd.
Pantaloons, one of India’s first formal trouser brands, are launched.
16
3.2 BIG BAZAAR
Big Bazaar is not just another
hypermarket. It caters to every need of your
family. Where Big Bazaar scores over other
stores is its value for money proposition for the
Indian customers.
Kishore Biyani led the company’s foray
into organized retail with the opening up of the
Big Bazaar in the year 2001.
It is a unit of Pantaloon Retail (India)
Ltd was started as a hypermarket format head
quartered in Jogeshwari, Mumbai with approx.
50,000 sqft of space. Its values and missions are to be the best in Value Retailing by providing
the cheapest prices.
It sells variety of merchandise at affordable rates, the prices of which it claims are lowest
in the city. Usually the items are clubbed together for offers as on the lines of Wal-Mart and
Carrefour, offer weekend discounts and works on the same economy model as Wal-Mart and has
considerable success in many Indian cities and small towns.
At Big Bazaar, you will definitely get the best products at the best prices - that’s what
they guarantee. It has also opened the doors into the world of fashion and general merchandise
including Home furnishings, utensils, crockery, cutlery, sports goods.
Wednesday Bazaar
The concept of Wednesday Bazaar was promoted as 'Hafte Ka Sabse Sasta Din' (Cheapest Day
of the Week). Initiated in January 2007, the idea behind this scheme was to draw customers to
stores on Wednesdays, the day when consumer presence is usually less. According to the chain,
the aim of the concept was 'to give Home Makers the power to save the most
Advertising campaigns and marketing initiatives
New logo
On the occasion of completion of ten (10) years in the Indian retail industry (in 2011) Big Bazaar
came up with a new logo for the company with a tag line that says: 'Naye India Ka Bazaar'
17
(Market for New India). This replaces the earlier tag line: 'Isse Sasta Aur accha Kahin Nahin'
(Nothing is Cheaper and good than Here).
Advertising initiatives
Big Bazaar has launched a promotion drive covering the three prime media, television, print and
social media, to mark the launch of the new logo. The media campaign was developed by Mudra
Communications.
3.2.1 Big Bazaar timeline
2001
Three stores launched within a span of 22 days in Kolkata, Bangalore and Hyderabad
2002
ICICI Bank Card is launched.
Food Bazaar becomes part of Big Bazaar with the launch of the first store in Mumbai at High
Street Phoenix
2003
Enters Tier II cities with the launch of the store in Nagpur
Welcomes its 10 millionth customer at its new store in Gurgaon
2004
Wins its first award and national recognition. Big Bazaar and Food Bazaar awarded the
country’s most admired retailer award in value retailing and food retailing segment at the
India Retail Forum
A day before Diwali, the store at Lower Parel becomes the first to touch Rs 10 million
turnover on a single day
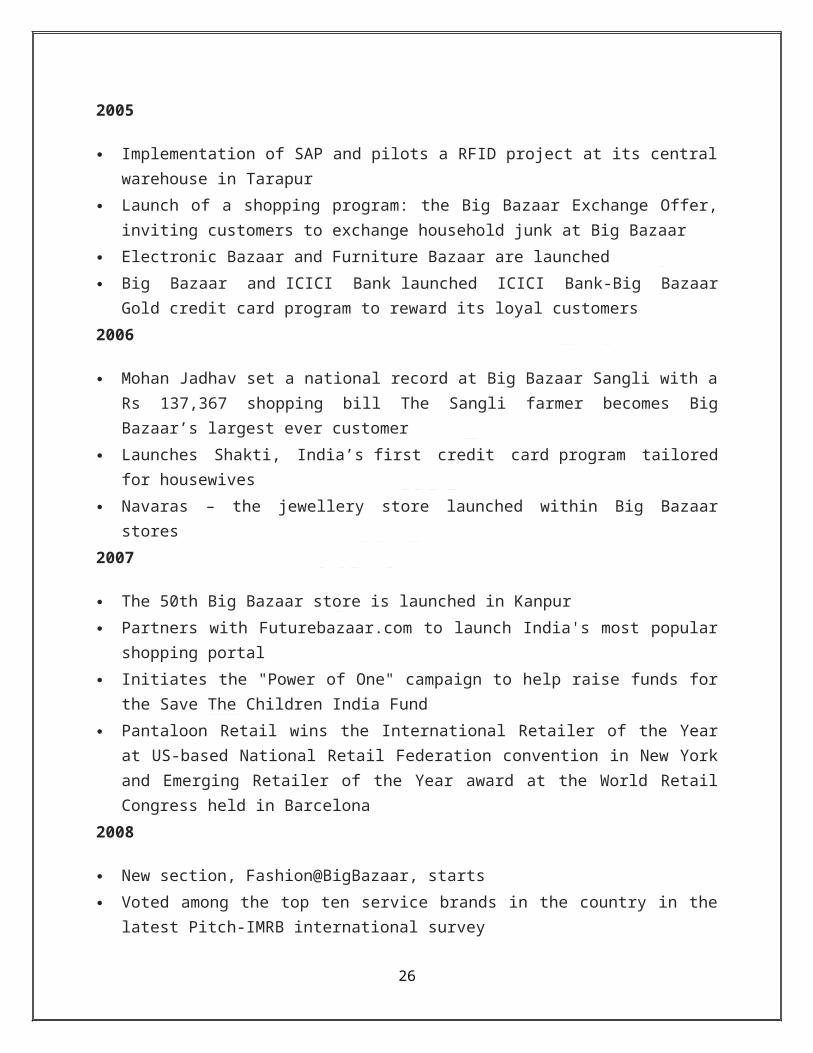
2005
Implementation of SAP and pilots a RFID project at its central warehouse in Tarapur
Launch of a shopping program: the Big Bazaar Exchange Offer, inviting customers to
exchange household junk at Big Bazaar
Electronic Bazaar and Furniture Bazaar are launched
18
Big Bazaar and ICICI Bank launched ICICI Bank-Big Bazaar Gold credit card program to
reward its loyal customers
2006
Mohan Jadhav set a national record at Big Bazaar Sangli with a Rs 137,367 shopping bill
The Sangli farmer becomes Big Bazaar’s largest ever customer
Launches Shakti, India’s first credit card program tailored for housewives
Navaras – the jewellery store launched within Big Bazaar stores
2007
The 50th Big Bazaar store is launched in Kanpur
Partners with Futurebazaar.com to launch India's most popular shopping portal
Initiates the "Power of One" campaign to help raise funds for the Save The Children India
Fund
Pantaloon Retail wins the International Retailer of the Year at US-based National Retail
Federation convention in New York and Emerging Retailer of the Year award at the World
Retail Congress held in Barcelona
2008
New section, Fashion@BigBazaar, starts
Voted among the top ten service brands in the country in the latest Pitch-IMRB international
survey
Initiates the Mega Saving "Monthly Bachat Bazaar" campaign, to provide deals on groceries
and food items during the first week of every month
2009
Opens its second store in Assam at Tinsukia
Initiates Maha Annasantarpane program at its stores in South India – an initiative to offer
meals to visitors and support local social organizations
Mahendra Singh Dhoni and Asin, youth icons of India, were chosen as the brand
ambassadors of Big Bazaar
Announced the launch of 'The Great Exchange Offer'
Formed a joint venture with Hidesign to launch Holii, a new brand of handbags, laptop bags
and other accessories
19
2010
Future Value Retail Limited is formed as a subsidiary to spearhead the group’s value
retail business through Big Bazaar, Food Bazaar and other formats
Wins CNBC Awaaz Consumer Awards for the third consecutive year. Adjudged the Most
Preferred Multi Brand Food & Beverage Chain, Most Preferred Multi Brand Retail Outlet
and Most Preferred Multi Brand One Stop Shop
Opens its third store in Kanpur at Z Square Mall
Vidya Balan was chosen as the brand ambassador of Big Bazaar's Price Challenge exercise
Ranked six among the Top 50 Service Brands in India
2011
Enters the rural wholesale and distribution business through 'Aadhaar Wholesale' store at
Kalol, Gujarat
Big Bazaar has come up a new logo with a new tag line: 'Naye India Ka Bazaar'
200th store opened in India
Future Group launched Food hall – a premium food destination across 10 metros in India
Entered into an agreement with Hindustan Unilever to co-develop and co-brand bakery
products, which would be sold exclusively at Big Bazaar stores
2012
Entered into a five-year multi-million dollar deal with Cognizant Technology Solutions for
IT infrastructure services that support Future Group's network of stores, warehouses, offices,
and data centers
Sakshi Tanwar & Ram Kapoor chosen brand ambassadors to promote more turnover
Partnered with Disney to launch "Kidz Cookies" for kids across India
20
CHAPTER-4
LITERATURE REVIEW
Awareness Building and Lead Generation, Marketing's Dynamic Duo
A well rounded marketing communications plan contains programs for awareness building and
sales lead generation. To maximize the effectiveness of your programs, they should be
coordinated, and based on a strategic plan that comprehends your business goals.
An awareness building program can:
Shorten your sales cycle by letting audiences know you exist and offer something they want.
Educate prospective customers that your products or services meet their needs.
Decrease your prospects’ perception of risk in selecting you as a vendor.
Awareness Building:
In this first article in a series of two, we concentrate specifically on awareness building. For this,
we discuss using coordinated advertising and PR tactics.
Profile your target audiences:
When setting out to profile your prospective customers, make sure you recognize that there’s a
difference between a customer and a market. A market is an aggregate of customers that has
needs in common, but it’s a customer that actually pays you for your product or service. At the
end of the day, individual customers are whom you must influence.
Questions that you should be able to answer about your prospective customers include:
How many of them are there?
How easy is it to identify them (company type and point of entry)? Do you have their
contact information?
What are their hot buttons or pain points and how does your product or service relate to
them?
How do they make decisions?
Where do they get their information?
Can you address them as a group?
Do they know you?
Are competitive solutions entrenched?
21
Where are they currently in their purchasing process and relationship with you?
Select your communications media
Sales and marketing can be described as the process of bringing prospects and then customers
closer to you. The vehicles you choose to communicate can make a big difference in whether
your message gets through. Time spent understanding how customers get their information and
the role that information sources play in purchase decision making can have a critical effect on
the success of marketing programs.
4.1 Marketing - Promotion StrategyPromotion is the method you use to spread the word about your product or service to customers,
stakeholders and the broader public.
1. Advertising
What is Advertising?
Advertising is a form of communication designed to persuade potential customers to choose your
product or service over that of a competitor.
It should be a planned, consistent activity that keeps the name of your business and the benefits
of your products or services uppermost in the mind of the consumer.
Why Advertise?
Advertising aims to:
Make your business and product name familiar to the public Create goodwill and build a favorable image Educate and inform the public Offer specific products or services Attract customers to find out more about your product or service
Aim - What is the primary purpose of the advertisement? Is it to inform, sell, produce listings or
improve the image of your business?
Target - Who is the target? From which sector of the public are you trying to achieve a
response? For example is it male, female, adult, teenager, child, mother, father etc.
22

Media – Bearing the aim and target in mind, which of the media available to you is the most
suitable – i.e. TV, radio, press or Internet?
Competitors – What are your competitors doing? Which media channel do they use? Are they
successful? Can you improve on their approach and beat them in competition?
Commonly used media
There are many media options open to advertisers. Which media you use will depend on who
you are trying to reach, what you want to say and your budget.
Stationery which includes letterheads, envelopes and business cards
Window display or office front The external presentation of your business office or shop is
one of the principal ways of establishing your business image
Press advertising This is a commonly used form of general advertising and includes
advertising in all press such as newspapers, magazines and journals
Radio is considered by many advertisers as an ideal medium due to its ability to reach
specific target groups.
Television is a powerful advertising medium because it creates impact through sight, sound
and movement.
Direct mail this is a broad category covering direct communication with the consumer
through email, post or fax
Outdoor this is any type of advertising which is done outdoors, including static advertising
such as billboards, backs of street benches and bus shelters or mobile advertising displayed
on buses, trains, taxis or towed signage
Point of Sale advertising at the point where the consumer makes a purchase decision eg:
floor stickers, in-store digital advertising
Online The options for online advertising continue to grow rapidly. They include advertising
on your website, advertising on other websites, creating links to your website from other
websites, publishing blogs, offering online product games, social networks and forums.
Directory listings Many consumers use business directories to find a supplier. Directories
include the yellow or white pages, union directories, trade directories or local business
directories.
23
Evaluating the effectiveness of your advertising
Famous American department store merchant John Wanamaker (1838-1922) was attributed as
saying “Half the money I spend on advertising is wasted – the trouble is I don’t know which
half.” This quote is often still true today as many businesses do not evaluate the effectiveness of
their advertising.
Evaluating effectiveness can be as simple as staff asking every new customer “How did you hear
about us?” or asking every customer that responds to an advertised special “where did you see or
hear our advertisement?”
Whatever method you use, it is absolutely critical in getting top value for your advertising dollar
by finding out which media works and which doesn't.
2. Selling
What is selling?
Put simply, selling is the exchange of goods or services for an agreed sum of money.
Prospecting and qualifying – identifying qualified prospects ie: those that are likely to want or
need your product or service and can afford to pay for it.
Pre-approach – undertaking research about prospects to assist in the actual selling process.
Approach – making actual contact with the prospect in person, by phone or in writing.
Presentation and demonstration – presenting and demonstrating the features and benefits of
your product or service in order to convince the prospect that their want or need can be satisfied.
Handling objections – demonstrating the product or service value to overcome real or perceived
objections or misunderstandings that are impeding the purchase decision.
Closing – bringing the selling process to a successful conclusion by either asking for the order or
responding to a positive decision from the prospect.
Follow-up – proactive or reactive contact with the purchaser to establish their satisfaction level
and to address any problems that may exist.
24

In planning the selling element of your marketing strategy you will need to consider the
following:
The size and structure of your sales team
Recruiting, training, motivating and evaluating individuals and the team as a whole
The remuneration structure
The location/territory to be serviced
Management and communication systems
Selling is a particularly important element if you are marketing services because the purchaser
of a professional service is in fact buying the capabilities of the seller.
What is sales promotion?
Sales promotion relates to short term incentives or activities that encourage the purchase or sale
of a product or service. Sales promotions initiatives are often referred to as “below the line”
activities.
What are the major sales promotion activities?
Sales promotion activities can be targeted toward final buyers (consumer promotions), business
customers (business promotions), retailers and wholesalers (trade promotions) and members of
the sales force (sales force promotions). Here are some typical sales promotion activities:
3. Public Relations
What are public relations?
The Public Relations Institute of Australia (PRIA) defines Public Relations (PR) as: “The
deliberate, planned and sustained effort to establish and maintain mutual understanding between
an organization (or individual) and its (or their) publics”.
Put more simply, public relations is about building good relations with the stakeholders (public)
of your business by obtaining favorable publicity, building a good corporate image and handling
or heading off unfavorable rumors’, stories and events.
25
By building good relationships with your stakeholders, particularly customers, you can generate
positive word of mouth and referrals from satisfied customers.
What are the main public relations tools?
Typical PR tools include:
News creation and distribution (media releases)
Special events such as news conferences, grand openings and product launches
Speeches and presentations
Educational programs
Annual reports, brochures, newsletters, magazines and AV presentations
Community activities and sponsorships
What are the key steps in implementing public relations?
Implementing effective public relations activities requires careful planning. The three major
steps are outlined below
Setting the objectives
Deciding on the message and the vehicle
Evaluating the results
The Stages of Perception in Marketing
by Vanessa Cross, Demand Media
Perception establishes the meaning about a product or brand when a consumer makes initial
contact. In marketing, this is described as consumer information processing. At this stage all of
the senses are engaged in receiving brand marketing communicate messages. In marketing
literature, four distinct stages of perception occur during consumer information processing:
sensation, attention, interpretation and retention.
Sensation:
Sensation describes what occurs when a person's senses are initially exposed to the external
stimulus of a product or brand marketing. Background music and a unique store design round out
26

the experience of the taste of hot or cold coffee and food products that can be enjoyed in-store at
quaint cafe tables.
Attention:
Attention occurs when a person lingers and gives mental processing capacity to the external
stimulus from a product or brand. Selective perception is when a consumer pays attention to
messages that are consistent with her attitudes, beliefs and needs.
Interpretation:
Interpretation occurs when a person assigns a meaning to the sensory stimulus from a product or
brand marketing. Comprehension is aided by expectations and familiarity.
Retention:
The conclusion of the consumer perception process is the retention stage. This is marked by the
storage of product or brand information in short-term and long-term memory.
4.2 Consumer Perception Theory:
by Chris Blank, Demand Media
Merchants aim to increase their sales by determining what drives their customers' purchase
decisions. Consumer perception theory attempts to explain consumer behavior by analyzing
motivations for buying -- or not buying -- particular items. Three areas of consumer perception
theory relate to consumer perception theory: self perception, price perception and perception of a
benefit to quality of life.
Definition:
Consumer perception applies the concept of sensory perception to marketing and advertising.
Just as sensory perception relates to how humans perceive and process sensory stimuli through
their five senses, consumer perception pertains to how individuals form opinions about
companies and the merchandise they offer through the purchases they make. Merchants apply
consumer perception theory to determine how their customers perceive them. They also use
27
consumer perception theory to develop marketing and advertising strategies intended to retain
current customers -- and attract new ones.
Self Perception:
Self perception theory attempts to explain how individuals develop an understanding of the
motivations behind their own behavior. Self perception by customers relates to values and
motivations that drive buying behavior -- which is also an important aspect of consumer
perception theory.
Price Perception:
While mass merchandisers such as Wal-Mart emphasize low prices as an inherent virtue, upscale
merchants attempt to emphasize quality and value for money to appeal to potential customers.
Researchers at the School of Business Administration at LaSalle University and LeBow College
of Business at Drexel University considered several factors, including price perception --
whether consumers believed they were being charged fair prices -- in determining whether online
shoppers would make repeat purchases through the same website.
Benefit Perception:
"It's good, and it's good for you." Many consumers are familiar with this phrase frequently
associated with food advertising. Researchers from Marquette University, Louisiana State
University and the University of Arkansas surveyed customers to determine how nutrition claims
associated with food affected their perception of that food's nutritional value.
4.3 Customer Satisfaction
Customer satisfaction can help your business to achieve a sustainable competitive advantage. It
is about understanding the way a customer feels after purchasing a product or service and, in
particular, whether or not that product or service met the customer’s expectations.
Customers primarily from their expectations through past purchasing experiences, word-of-
mouth from family, friends and colleagues and information delivered through marketing
28
activities, such as advertising or public relations. If the customer’s expectation isn’t met, they
will be dissatisfied and it’s very likely they will tell others about their experience.
Why customer satisfaction is important
Don’t underestimate the value of customer satisfaction. It’s becoming an important area of
competition.
A high level of satisfaction can deliver many benefits, including:
Loyalty: a highly satisfied customer is a loyal customer
Repeat purchase: a highly satisfied customer buys more products
Referrals: a highly satisfied customer tells their family and friends about the product or
service
Retention: a highly satisfied customer is less likely to switch brands
Reduced costs: a highly satisfied customer costs less to serve than a new customer
Premium prices: a highly satisfied customer is willing to pay more for the product or
service
Customer satisfaction research
Satisfaction surveys are an important method for collecting information about how your
customers think and feel about your brand, product or service.
A satisfaction survey can help you to understand the expectations of your customers, determine
whether your customers believe you are meeting those expectations, identify new customer
requirements or trends in the market and determine what areas of your business need investment.
4.4 Competitive EdgeBy differentiating your product, service, personnel or brand, you can establish a unique position
in your market.
The following strategies can help to distinguish your offering in the market and create a
competitive edge.
Be first in the market
Leverage your expertise: Establish leadership
Focus your market expertise
Make your products stand out as new and improved
29
How to maintain your competitive edge
Once you have defined your competitive edge, you must work to maintain that upper hand. Your
competitors will constantly work to improve their products and build their expertise, and so
should you.
What is not a competitive edge?
Avoid focusing on the following areas or characteristics, as they will not set you apart from your
competition.
Quality and Customer Orientation
Although it is important to manufacture good quality products and be customer-oriented, these
factors will not set you apart from the competition.
Customer Service
It is assumed that you will work diligently to ensure customer satisfaction. This alone will not
keep those customers coming back to you.
Price
Although pricing your products below market price might attract some buyers, it will not
differentiate your product for long. Being cheaper than an alternative will not position you as
unique. It will place you in a weak position because your competition could change their price to
match yours at any time.
Breadth of Line
Based on the success of “superstores,” you might be tempted to become “everything to
everyone.” However, this is not differentiation. You might solve some problems for some
customers, but it is more likely that you will not fully solve any customers’ problems.
Provide a specific solution to ensure that you solve real problems for a specific target market.
30
CHAPTER -5
RESEARCH METHODOLOG
Data Source : Primary Data - from questionnaire and personal interaction
Secondary Data – old records, Internet
Research approach : Survey method
Research Instrument : Questionnaire
Sample plan : Personal Interview
Sample unit : Customers of Big Bazaar and Nearby Areas
Sampling method : Convenience sampling
Sample Size : 336 Respondents
Data Interpretation : Percentage method
DURATION OF PROJECT
Duration of the Project 20th May 2014 to 5th July 2014.
5.1 DATA COLLECTIONThis section was basically divided to address 3 areas: Sources of data, data collection methods
and data collection instruments.
5.1.1 Data Collection Sources
Data was collected from the following two main sources.
1) Primary Data and 2) Secondary Data.
Primary data was sourced directly from the respondents i.e. Customers
Secondary data was obtained from Journals such as those of Marketing and Consumer Research;
5.2 DATA PROCESSING AND ANALYSISThe data collected was processed and analyzed using the Statistical Package for Social Sciences
(SPSS) Software.
31

5.2.1 Data Processing
Processing involved classifying, coding, entering, editing and tabulating the data.
5.2.2 Data Analysis
Statistical analysis of historical data was used to assess promotional effectiveness. Primary data
analysis involved calculation of frequencies and percentages. This was followed by cross
tabulations and correlation studied through Pearson's Coefficient of partial correlation. The
findings were cross tabulated at a 0.05 level of significance with a view to establish relationships
between the variables under study. Multiple regression analysis was carried out to test the
strength of relationships since the study involved one dependent variable i.e. the decision to visit
(also the purchase decision) which is presumed to be a function of independent variables like
promotional activities, service quality.
32
DATA ANALYSIS
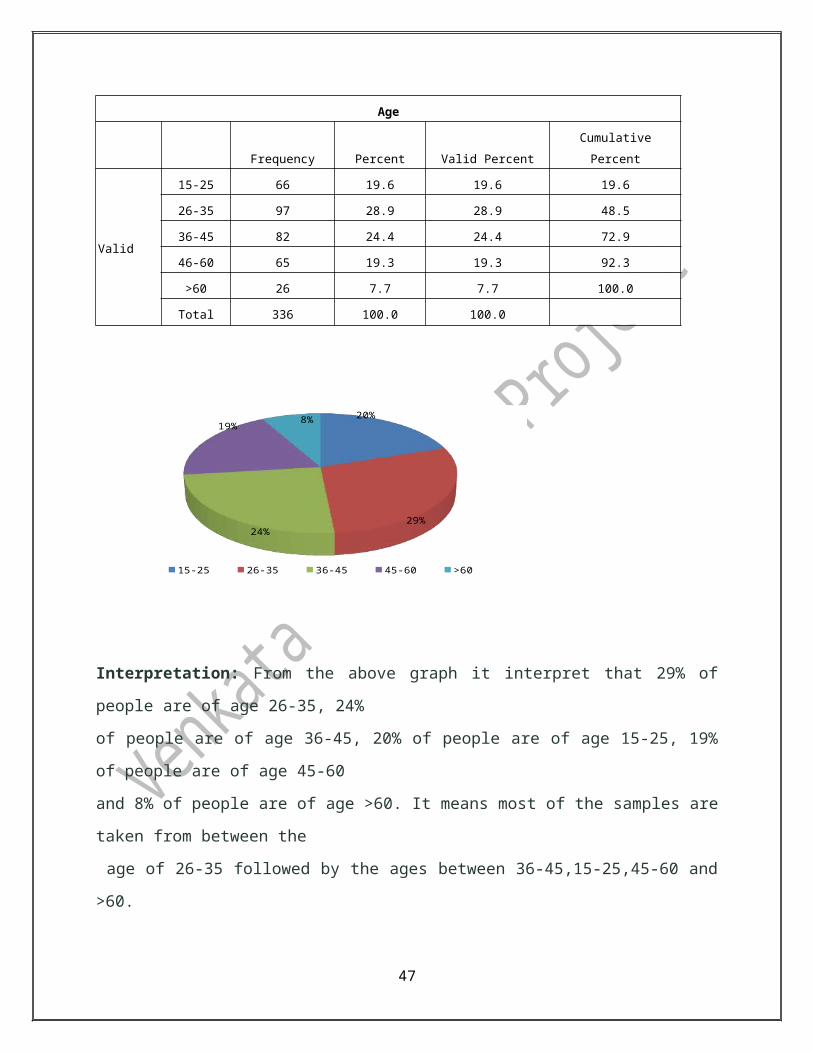
1) Frequency table for AGE:
Age
Frequency Percent Valid Percent Cumulative Percent
Valid
15-25 66 19.6 19.6 19.6
26-35 97 28.9 28.9 48.5
36-45 82 24.4 24.4 72.9
46-60 65 19.3 19.3 92.3
>60 26 7.7 7.7 100.0
Total 336 100.0 100.0
20%
29%24%
19%8%
15-25 26-35 36-45 45-60 >60
Interpretation: From the above graph it interpret that 29% of people are of age 26-35, 24%
of people are of age 36-45, 20% of people are of age 15-25, 19% of people are of age 45-60
and 8% of people are of age >60. It means most of the samples are taken from between the
age of 26-35 followed by the ages between 36-45,15-25,45-60 and >60.
33

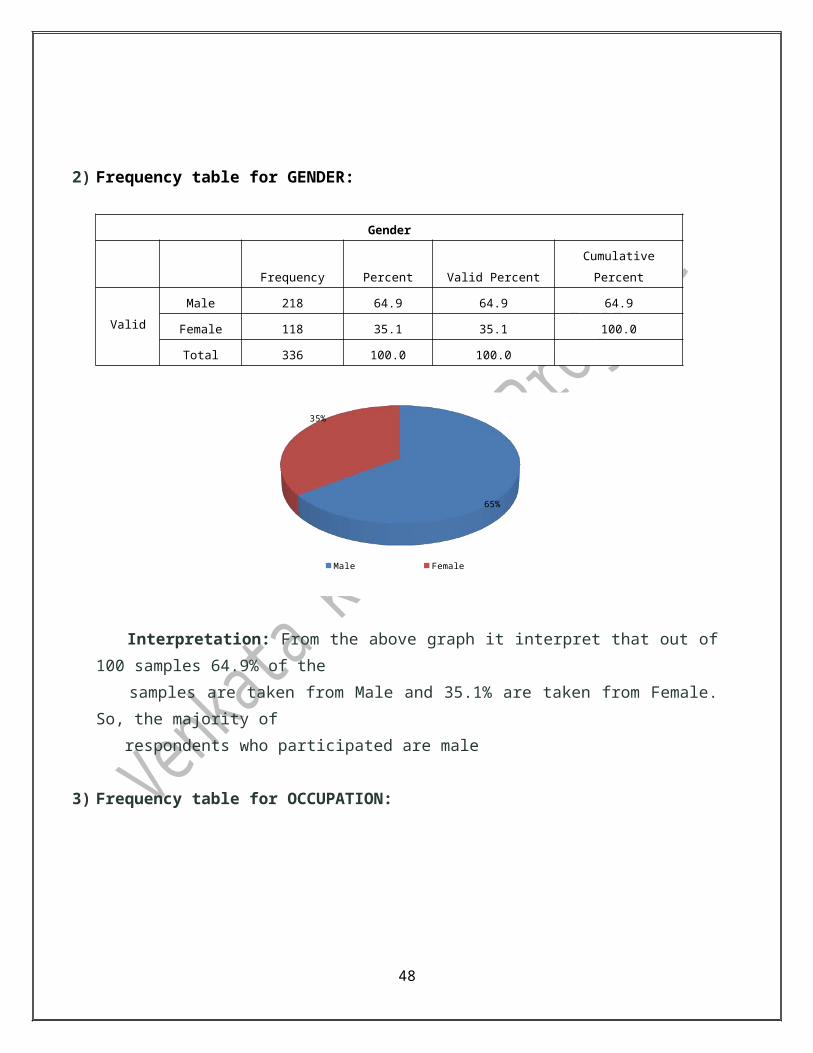
2) Frequency table for GENDER:
Gender
Frequency Percent Valid Percent Cumulative Percent
Valid
Male 218 64.9 64.9 64.9
Female 118 35.1 35.1 100.0
Total 336 100.0 100.0
65%
35%
Male Female
Interpretation: From the above graph it interpret that out of 100 samples 64.9% of the
samples are taken from Male and 35.1% are taken from Female. So, the majority of
respondents who participated are male
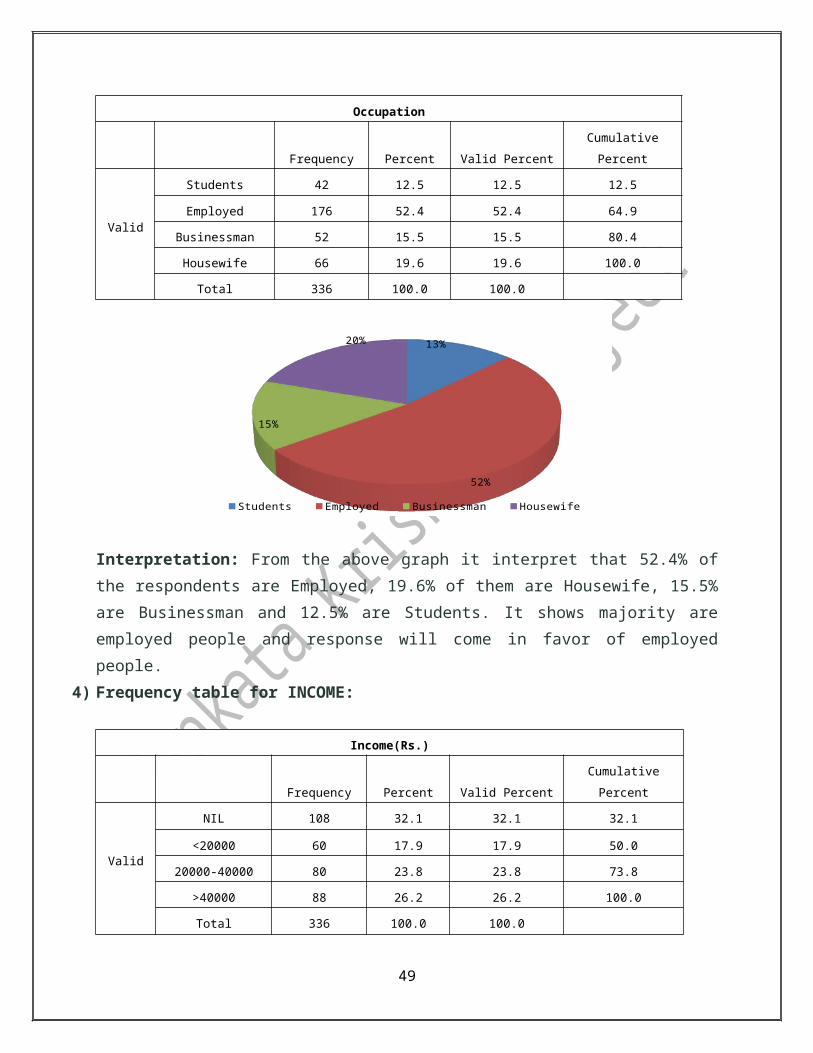
3) Frequency table for OCCUPATION:
Occupation
Frequency Percent Valid Percent Cumulative Percent
Valid
Students 42 12.5 12.5 12.5
Employed 176 52.4 52.4 64.9
Businessman 52 15.5 15.5 80.4
Housewife 66 19.6 19.6 100.0
Total 336 100.0 100.0
34
13%
52%
15%
20%
Students Employed Businessman Housewife
Interpretation: From the above graph it interpret that 52.4% of the respondents are Employed,
19.6% of them are Housewife, 15.5% are Businessman and 12.5% are Students. It shows
majority are employed people and response will come in favor of employed people.
4) Frequency table for INCOME:
Income(Rs.)
Frequency Percent Valid Percent Cumulative Percent
Valid
NIL 108 32.1 32.1 32.1
<20000 60 17.9 17.9 50.0
20000-40000 80 23.8 23.8 73.8
>40000 88 26.2 26.2 100.0
Total 336 100.0 100.0
32%
18%24%
26%
NIL Less than 20,000 20,000-40,000 More than 40,000
35
Interpretation: From the above graph it interpret that, majority of sample is taken from the
students with NIL income and followed by Middle income people and the income levels are
between <20,000 and 20,000 to 40,000.
5) Do you know about Kukatpally Big Bazaar?
(Yes / No)
Kukatpally BB?
Frequency Percent Valid Percent
Cumulative
Percent
Valid Yes 236 70.2 70.2 70.2
No 100 29.8 29.8 100.0
Total 336 100.0 100.0
70%
30%
Yes No
Interpretation: From the above graph it interpret that, 70.2% of the respondents are aware of
Kukatpally Big Bazaar and 29.8% of respondents are not aware of Kukatpally Big Bazaar
36
6) What is your perception about the Kukatpally Store?
FBB (Fashion at Big Bazaar) / Hypermarket (Variety of products under one roof)
Perception?
Frequency Percent Valid Percent
Cumulative
Percent
Valid FBB 5 1.5 2.1 2.1
Hypermarket 231 68.8 97.9 100.0
Total 236 70.2 100.0
Missing System 100 29.8
Total 336 100.0
1%
69%
30%
FBB Hypermarket Missing
Interpretation: From the above graph it interpret that, majority of respondents are aware about
the change from FBB to Hypermarket
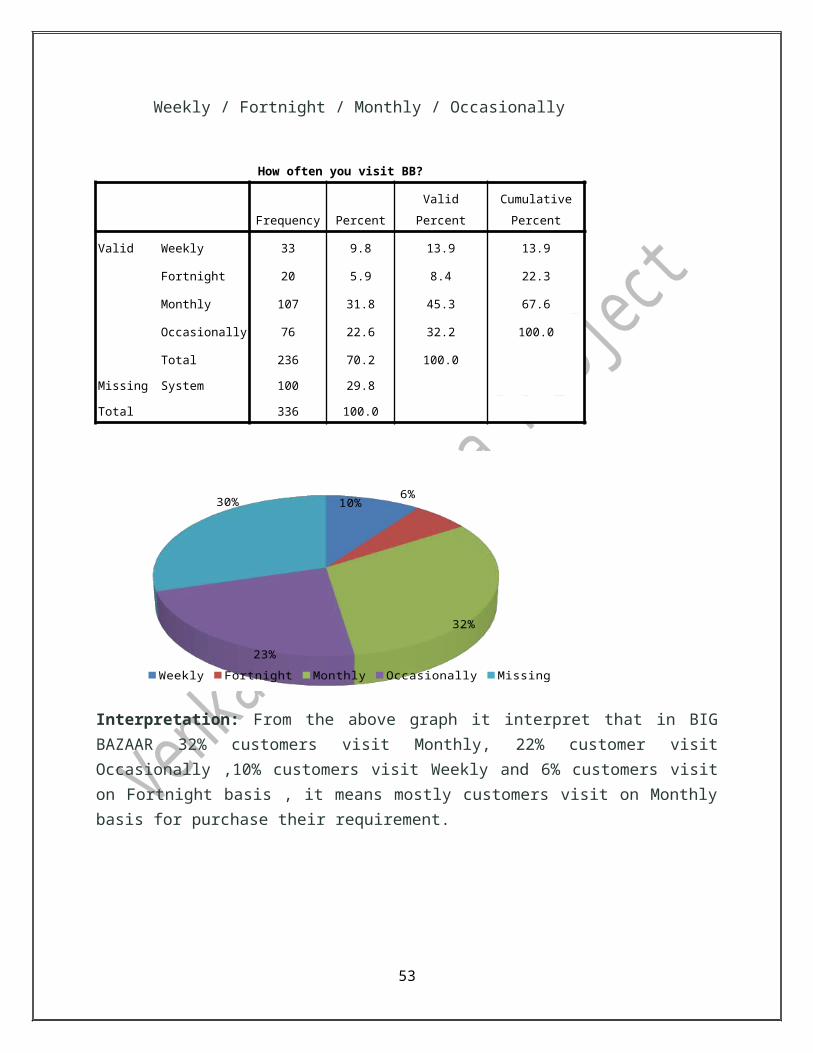
7) How often you visit Big Bazaar?
37

Weekly / Fortnight / Monthly / Occasionally
How often you visit BB?
Frequency Percent Valid Percent
Cumulative
Percent
Valid Weekly 33 9.8 13.9 13.9
Fortnight 20 5.9 8.4 22.3
Monthly 107 31.8 45.3 67.6
Occasionally 76 22.6 32.2 100.0
Total 236 70.2 100.0
Missing System 100 29.8
Total 336 100.0
10%6%
32%
23%
30%
Weekly Fortnight Monthly Occasionally Missing
Interpretation: From the above graph it interpret that in BIG BAZAAR 32% customers visit Monthly, 22% customer visit Occasionally ,10% customers visit Weekly and 6% customers visit on Fortnight basis , it means mostly customers visit on Monthly basis for purchase their requirement.
38
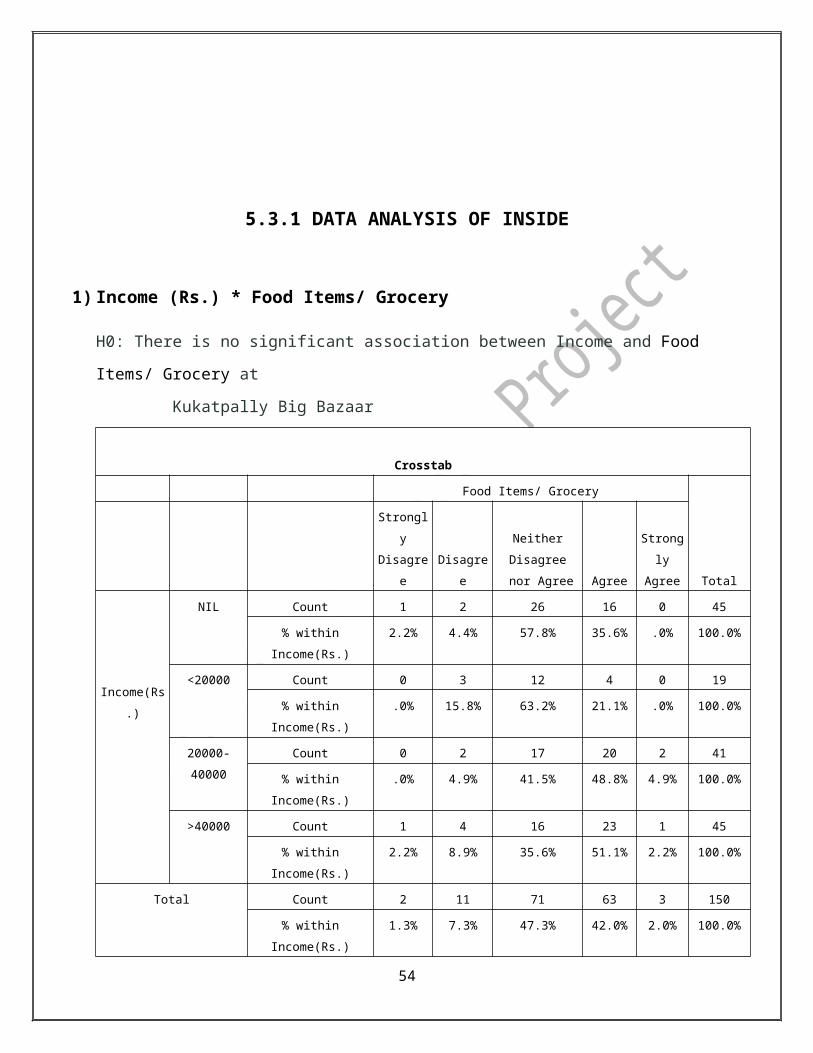
5.3.1 DATA ANALYSIS OF INSIDE
1) Income (Rs.) * Food Items/ Grocery
H0: There is no significant association between Income and Food Items/ Grocery at
Kukatpally Big Bazaar
Crosstab
Food Items/ Grocery
Total
Strongly
Disagree Disagree
Neither
Disagree
nor Agree Agree
Strongly
Agree
Income(Rs.)
NIL Count 1 2 26 16 0 45
% within Income(Rs.) 2.2% 4.4% 57.8% 35.6% .0% 100.0%
<20000 Count 0 3 12 4 0 19
% within Income(Rs.) .0% 15.8% 63.2% 21.1% .0% 100.0%
20000-40000 Count 0 2 17 20 2 41
% within Income(Rs.) .0% 4.9% 41.5% 48.8% 4.9% 100.0%
>40000 Count 1 4 16 23 1 45
% within Income(Rs.) 2.2% 8.9% 35.6% 51.1% 2.2% 100.0%
Total Count 2 11 71 63 3 150
% within Income(Rs.) 1.3% 7.3% 47.3% 42.0% 2.0% 100.0%
Chi-Square Tests
Value df Asymp. Sig. (2-sided)
Pearson Chi-Square 14.601a 12 .264
Likelihood Ratio 16.122 12 .186
Linear-by-Linear Association 2.678 1 .102
N of Valid Cases 150
12 cells (60.0%) have expected count less than 5. The minimum expected count is .25
39
From the above table Chi-Square is not significant (Significant value is > 0.05), accept Null
Hypothesis. There is no significant association between Income and Food Items/ Grocery at
Kukatpally Big Bazaar.
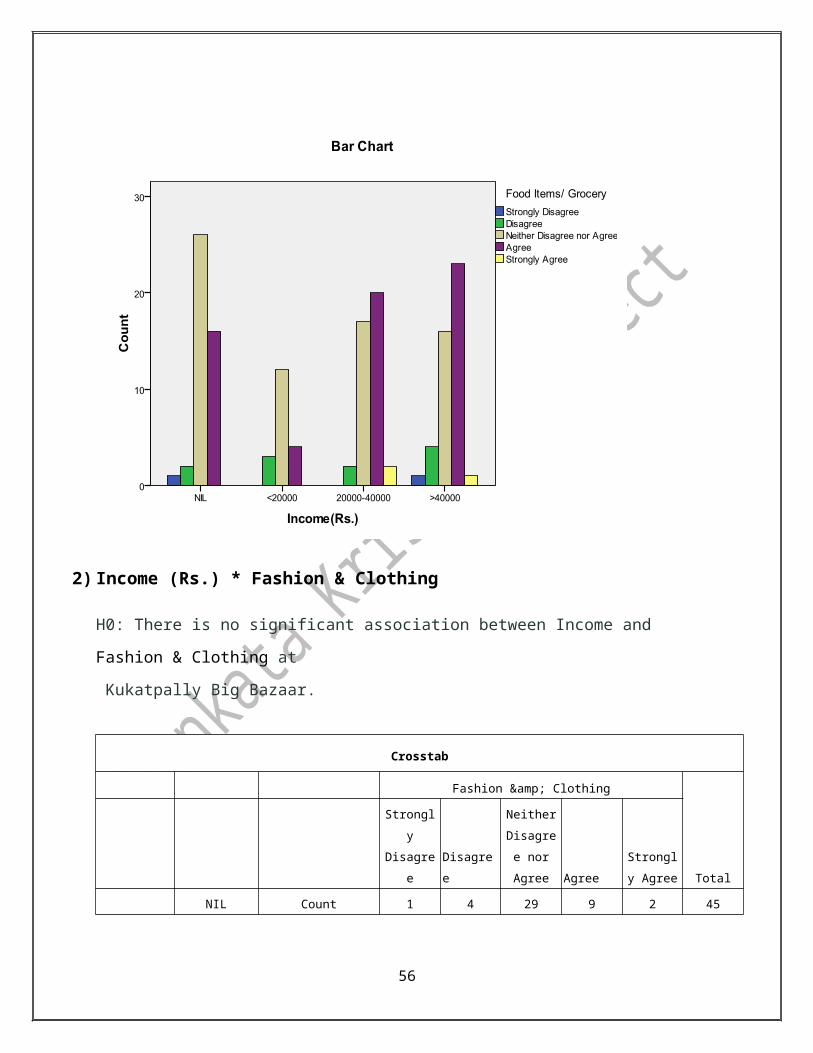
2) Income (Rs.) * Fashion & Clothing
H0: There is no significant association between Income and Fashion & Clothing at
Kukatpally Big Bazaar.
Crosstab
Fashion & Clothing
Total
Strongly
Disagree Disagree
Neither
Disagree
nor Agree Agree
Strongly
Agree
NIL Count 1 4 29 9 2 45
40
Income(Rs.)
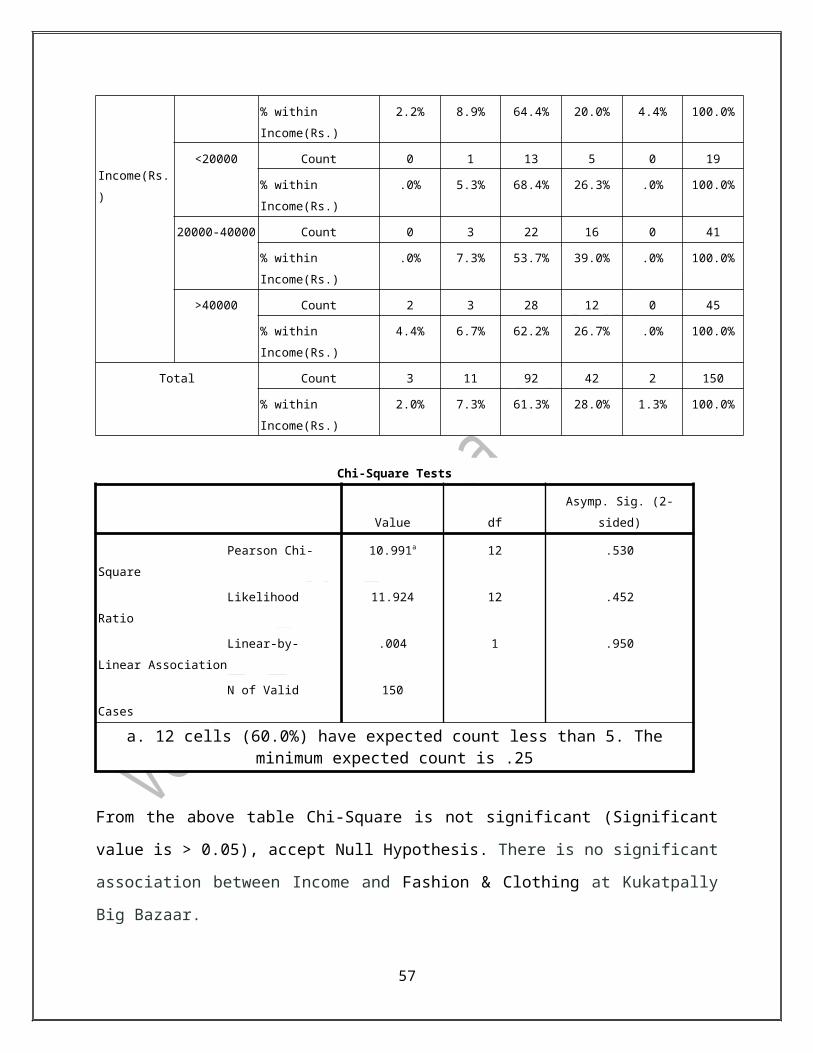
% within Income(Rs.) 2.2% 8.9% 64.4% 20.0% 4.4% 100.0%
<20000 Count 0 1 13 5 0 19
% within Income(Rs.) .0% 5.3% 68.4% 26.3% .0% 100.0%
20000-40000 Count 0 3 22 16 0 41
% within Income(Rs.) .0% 7.3% 53.7% 39.0% .0% 100.0%
>40000 Count 2 3 28 12 0 45
% within Income(Rs.) 4.4% 6.7% 62.2% 26.7% .0% 100.0%
Total Count 3 11 92 42 2 150
% within Income(Rs.) 2.0% 7.3% 61.3% 28.0% 1.3% 100.0%
Chi-Square Tests
Value df Asymp. Sig. (2-sided)
Pearson Chi-Square 10.991a 12 .530
Likelihood Ratio 11.924 12 .452
Linear-by-Linear Association .004 1 .950
N of Valid Cases 150
a. 12 cells (60.0%) have expected count less than 5. The minimum expected count is .25
From the above table Chi-Square is not significant (Significant value is > 0.05), accept Null
Hypothesis. There is no significant association between Income and Fashion & Clothing at
Kukatpally Big Bazaar.
41
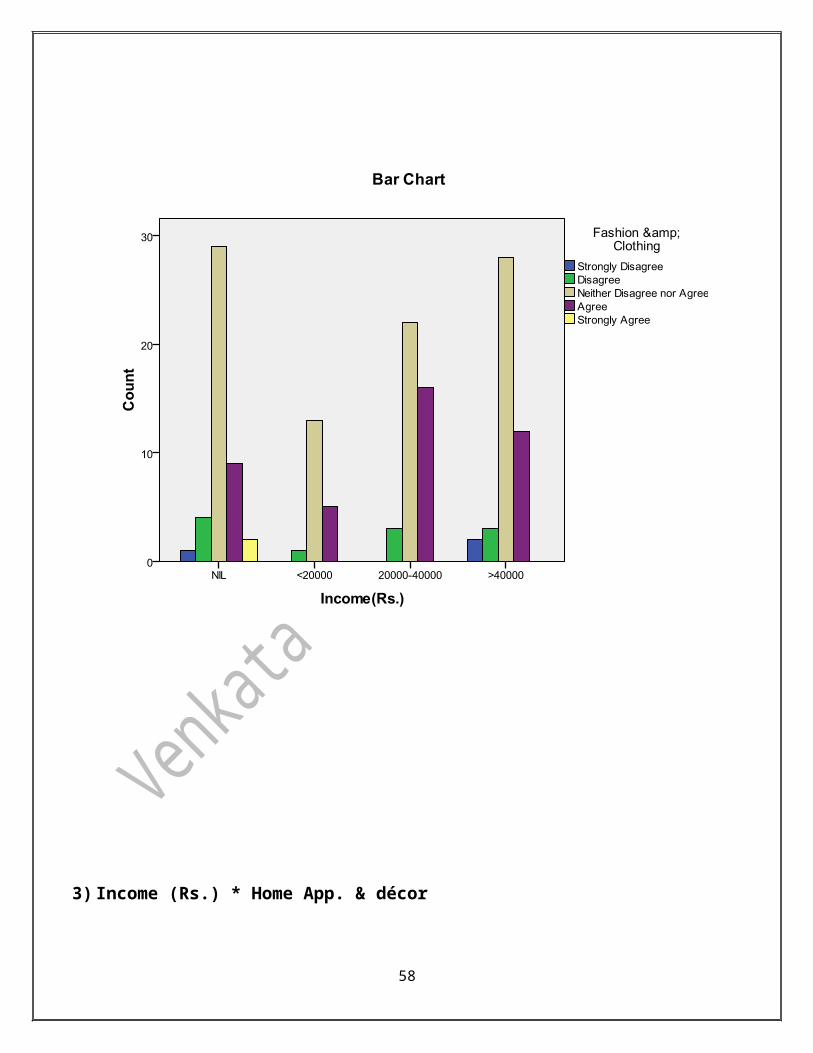
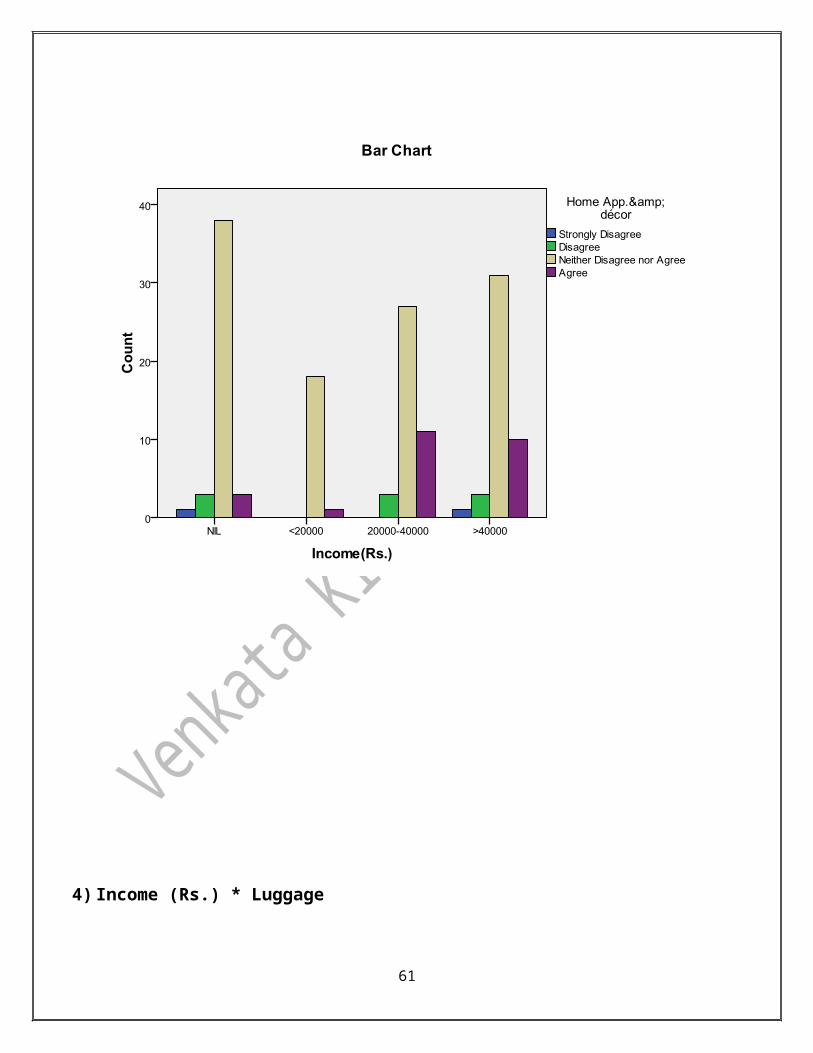
3) Income (Rs.) * Home App. & décor
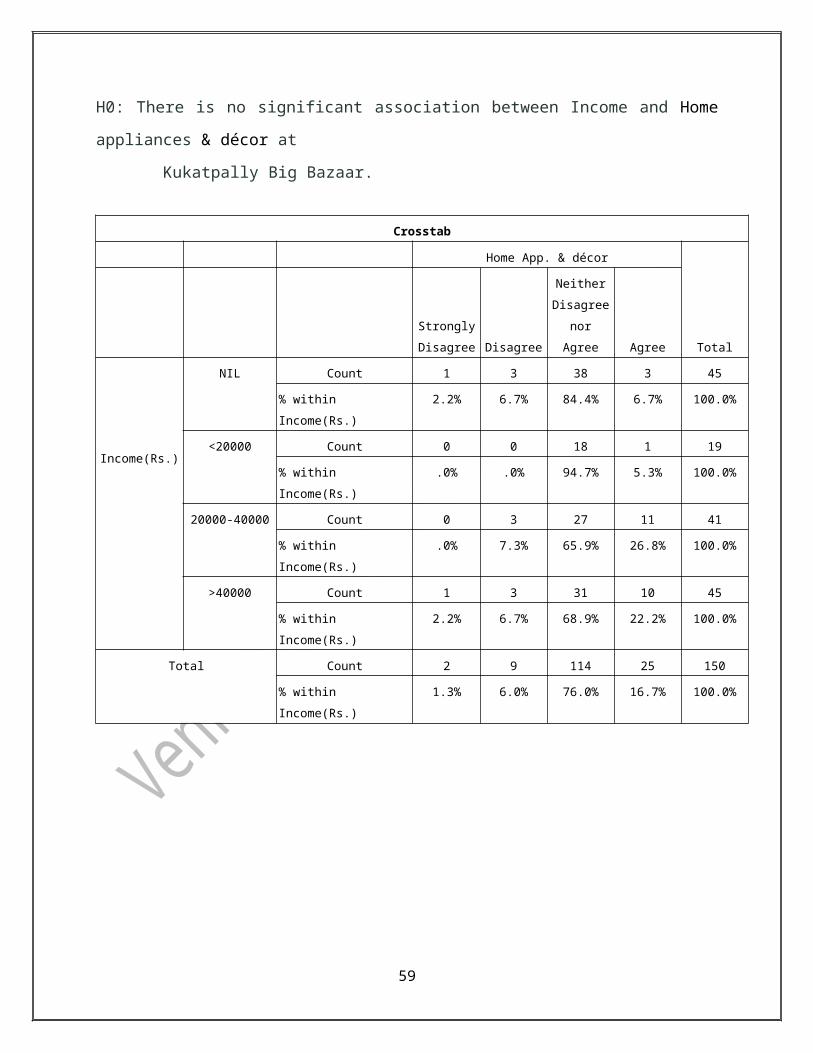
H0: There is no significant association between Income and Home appliances & décor at
Kukatpally Big Bazaar.
42

Crosstab
Home App. & décor
Total
Strongly
Disagree Disagree
Neither
Disagree
nor Agree Agree
Income(Rs.)
NIL Count 1 3 38 3 45
% within Income(Rs.) 2.2% 6.7% 84.4% 6.7% 100.0%
<20000 Count 0 0 18 1 19
% within Income(Rs.) .0% .0% 94.7% 5.3% 100.0%
20000-40000 Count 0 3 27 11 41
% within Income(Rs.) .0% 7.3% 65.9% 26.8% 100.0%
>40000 Count 1 3 31 10 45
% within Income(Rs.) 2.2% 6.7% 68.9% 22.2% 100.0%
Total Count 2 9 114 25 150
% within Income(Rs.) 1.3% 6.0% 76.0% 16.7% 100.0%
Chi-Square Tests
Value Df Asymp. Sig. (2-sided)
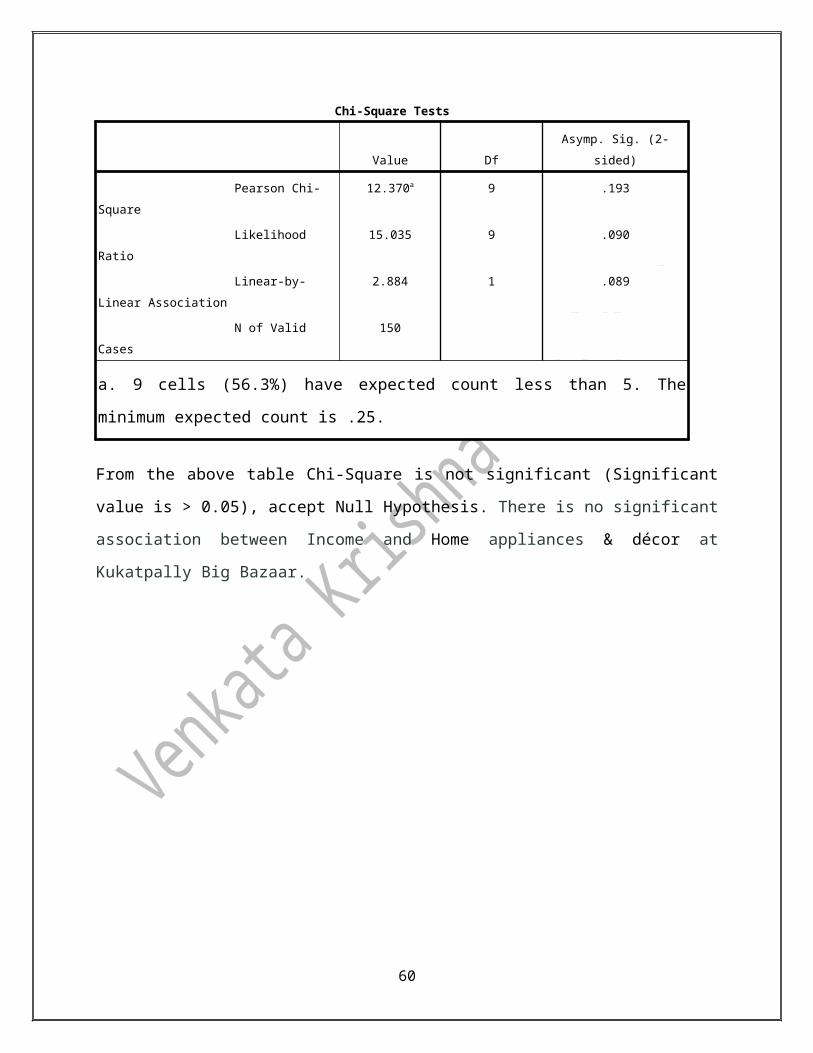
Pearson Chi-Square 12.370a 9 .193
Likelihood Ratio 15.035 9 .090
Linear-by-Linear Association 2.884 1 .089
N of Valid Cases 150
a. 9 cells (56.3%) have expected count less than 5. The minimum expected count is .25.
From the above table Chi-Square is not significant (Significant value is > 0.05), accept Null
Hypothesis. There is no significant association between Income and Home appliances & décor at
Kukatpally Big Bazaar.
43
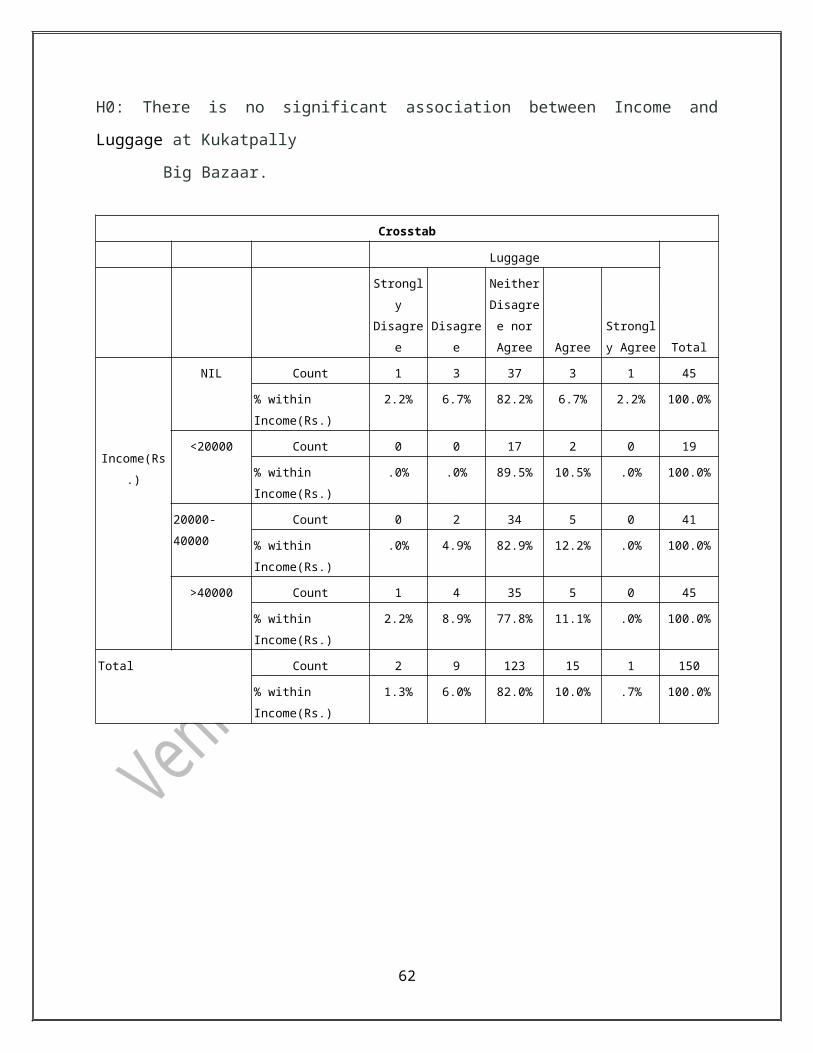
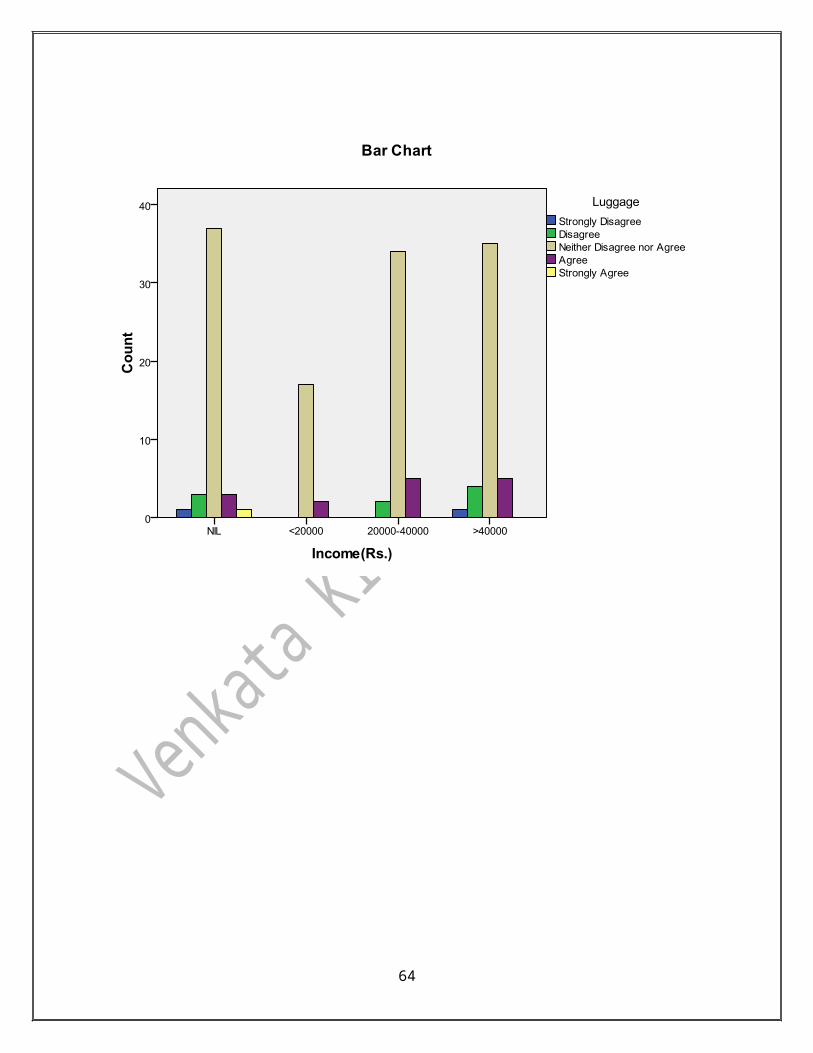
4) Income (Rs.) * Luggage
H0: There is no significant association between Income and Luggage at Kukatpally
Big Bazaar.
44
Crosstab
Luggage
Total
Strongly
Disagree Disagree
Neither
Disagree
nor Agree Agree
Strongly
Agree
Income(Rs.)
NIL Count 1 3 37 3 1 45
% within Income(Rs.) 2.2% 6.7% 82.2% 6.7% 2.2% 100.0%
<20000 Count 0 0 17 2 0 19
% within Income(Rs.) .0% .0% 89.5% 10.5% .0% 100.0%
20000-40000 Count 0 2 34 5 0 41
% within Income(Rs.) .0% 4.9% 82.9% 12.2% .0% 100.0%
>40000 Count 1 4 35 5 0 45
% within Income(Rs.) 2.2% 8.9% 77.8% 11.1% .0% 100.0%
Total Count 2 9 123 15 1 150
% within Income(Rs.) 1.3% 6.0% 82.0% 10.0% .7% 100.0%
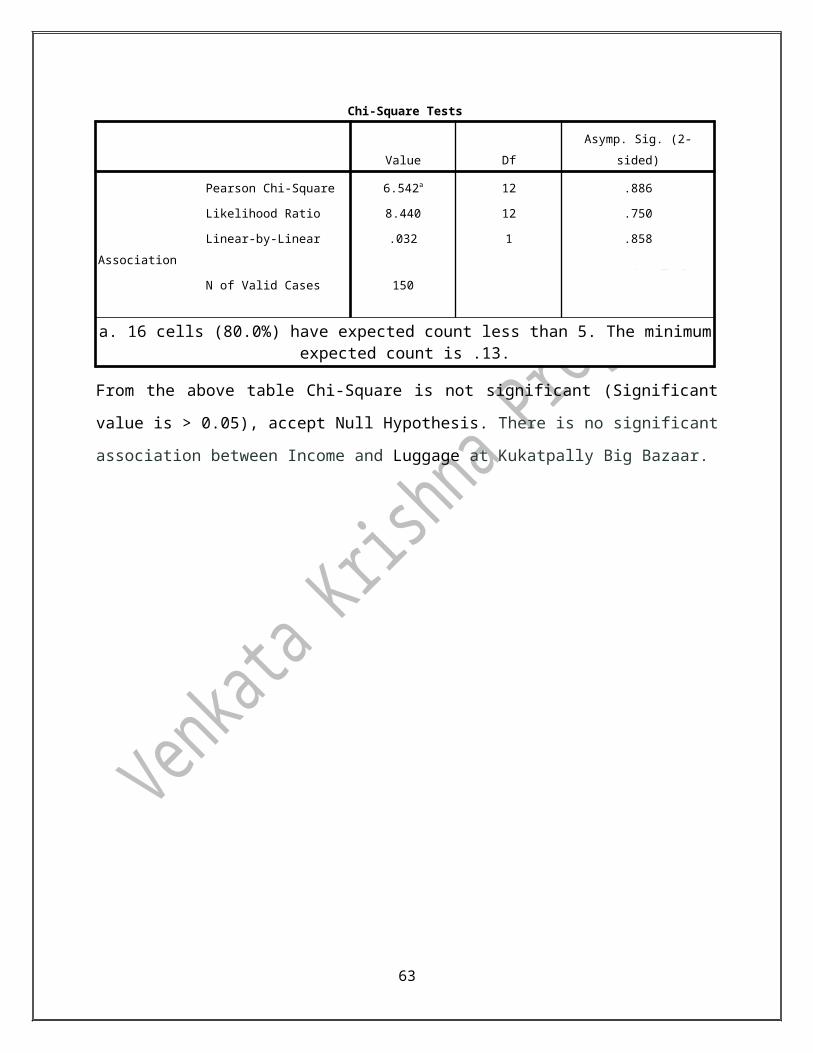
Chi-Square Tests
Value Df Asymp. Sig. (2-sided)
Pearson Chi-Square 6.542a 12 .886
Likelihood Ratio 8.440 12 .750
Linear-by-Linear Association .032 1 .858
N of Valid Cases 150
a. 16 cells (80.0%) have expected count less than 5. The minimum expected count is .13.
From the above table Chi-Square is not significant (Significant value is > 0.05), accept Null
Hypothesis. There is no significant association between Income and Luggage at Kukatpally Big
Bazaar.
45

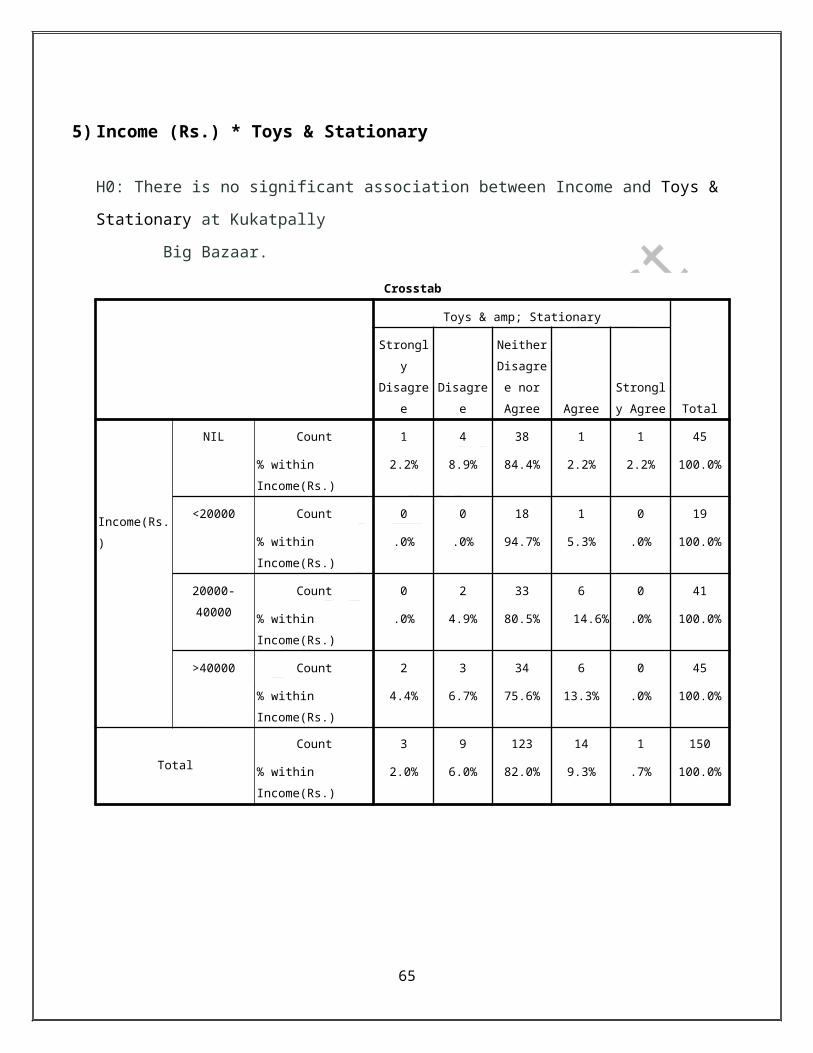
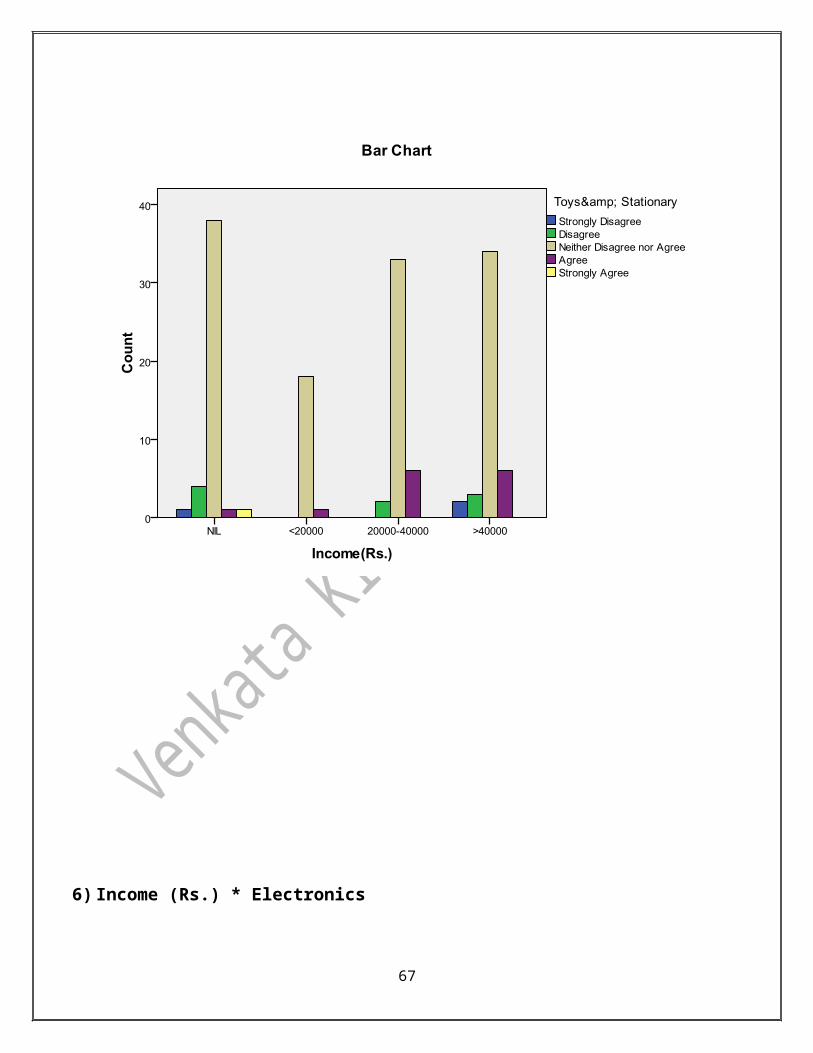
5) Income (Rs.) * Toys & Stationary
46
H0: There is no significant association between Income and Toys & Stationary at Kukatpally
Big Bazaar.
Crosstab
Toys & amp; Stationary
Total
Strongly
Disagree Disagree
Neither
Disagree
nor Agree Agree
Strongly
Agree
Income(Rs.)
NIL Count 1 4 38 1 1 45
% within Income(Rs.) 2.2% 8.9% 84.4% 2.2% 2.2% 100.0%
<20000 Count 0 0 18 1 0 19
% within Income(Rs.) .0% .0% 94.7% 5.3% .0% 100.0%
20000-40000 Count 0 2 33 6 0 41
% within Income(Rs.) .0% 4.9% 80.5% 14.6% .0% 100.0%
>40000 Count 2 3 34 6 0 45
% within Income(Rs.) 4.4% 6.7% 75.6% 13.3% .0% 100.0%
Total
Count 3 9 123 14 1 150
% within Income(Rs.) 2.0% 6.0% 82.0% 9.3% .7% 100.0%
Chi-Square Tests
Value Df Asymp. Sig. (2-sided)
Pearson Chi-Square 12.203a 12 .429
Likelihood Ratio 15.058 12 .238
Linear-by-Linear Association .346 1 .557
N of Valid Cases 150
a. 16 cells (80.0%) have expected count less than 5. The minimum expected count is .13.
From the above table Chi-Square is not significant (Significant value is > 0.05), accept Null
Hypothesis. There is no significant association between Income and Toys & Stationary at
Kukatpally Big Bazaar.
47
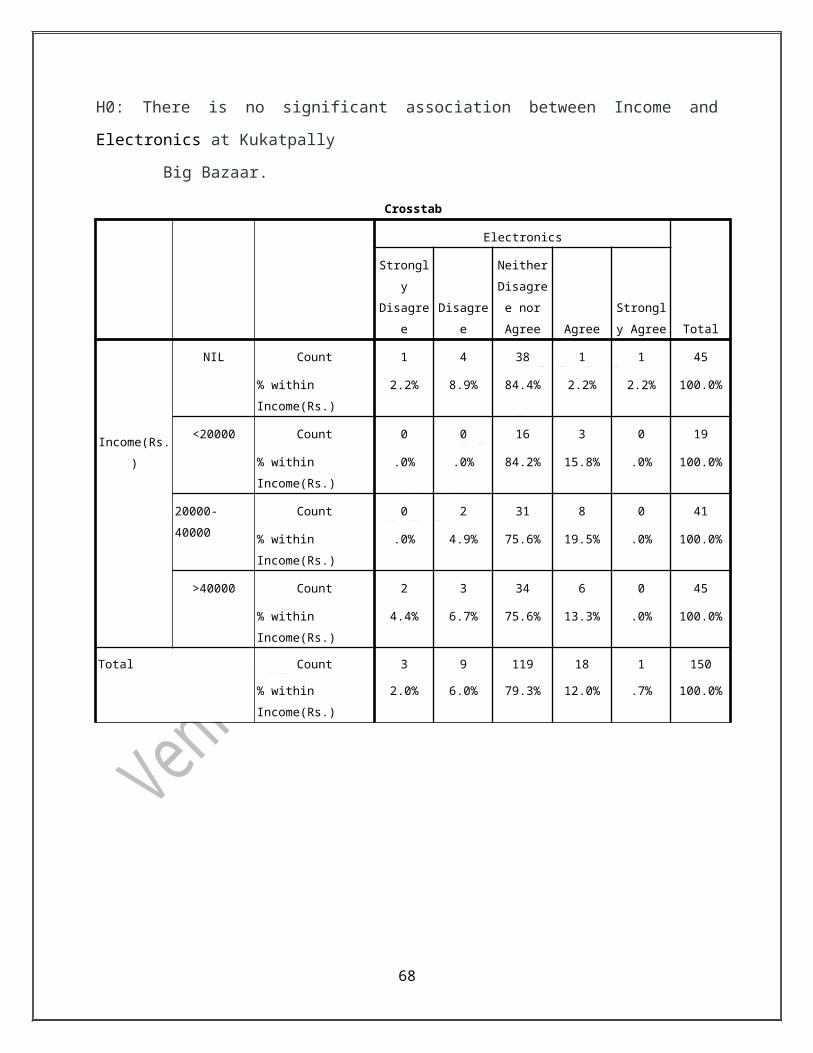
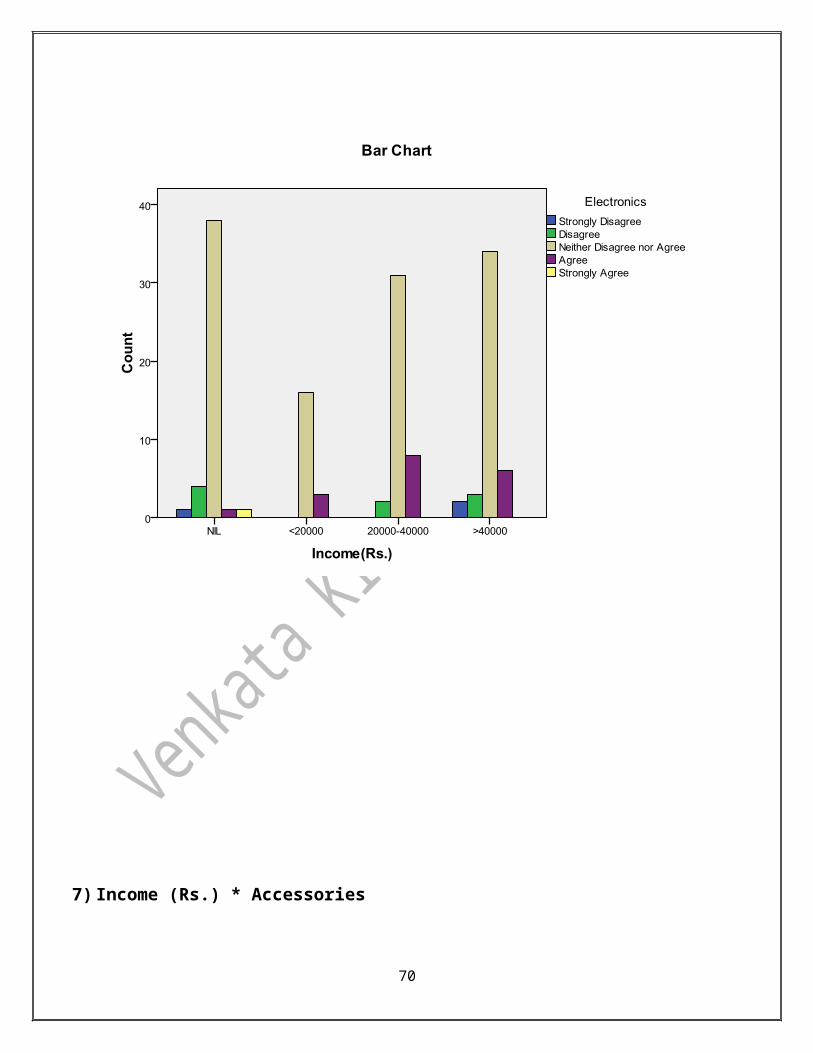
6) Income (Rs.) * Electronics
H0: There is no significant association between Income and Electronics at Kukatpally
Big Bazaar.
48
Crosstab
Electronics
Total
Strongly
Disagree Disagree
Neither
Disagree
nor Agree Agree
Strongly
Agree
Income(Rs.)
NIL Count 1 4 38 1 1 45
% within Income(Rs.) 2.2% 8.9% 84.4% 2.2% 2.2% 100.0%
<20000 Count 0 0 16 3 0 19
% within Income(Rs.) .0% .0% 84.2% 15.8% .0% 100.0%
20000-40000 Count 0 2 31 8 0 41
% within Income(Rs.) .0% 4.9% 75.6% 19.5% .0% 100.0%
>40000 Count 2 3 34 6 0 45
% within Income(Rs.) 4.4% 6.7% 75.6% 13.3% .0% 100.0%
Total Count 3 9 119 18 1 150
% within Income(Rs.) 2.0% 6.0% 79.3% 12.0% .7% 100.0%
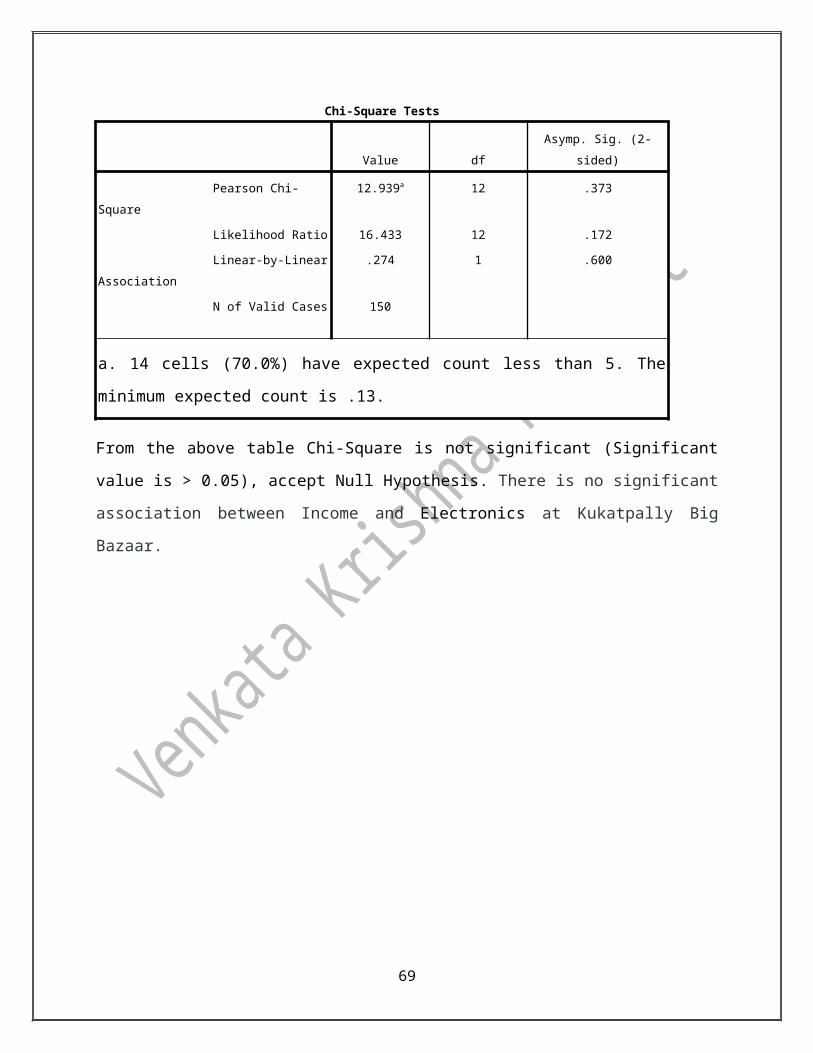
Chi-Square Tests
Value df Asymp. Sig. (2-sided)
Pearson Chi-Square 12.939a 12 .373
Likelihood Ratio 16.433 12 .172
Linear-by-Linear Association .274 1 .600
N of Valid Cases 150
a. 14 cells (70.0%) have expected count less than 5. The minimum expected count is .13.
From the above table Chi-Square is not significant (Significant value is > 0.05), accept Null
Hypothesis. There is no significant association between Income and Electronics at Kukatpally
Big Bazaar.
49

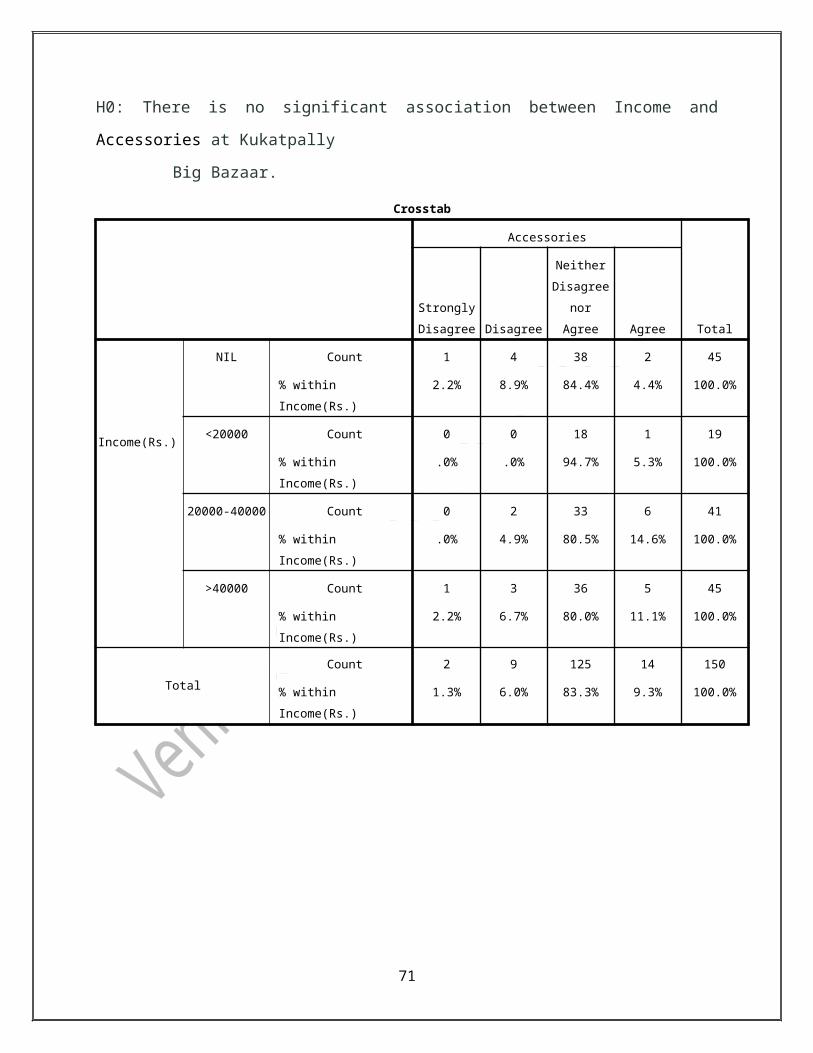
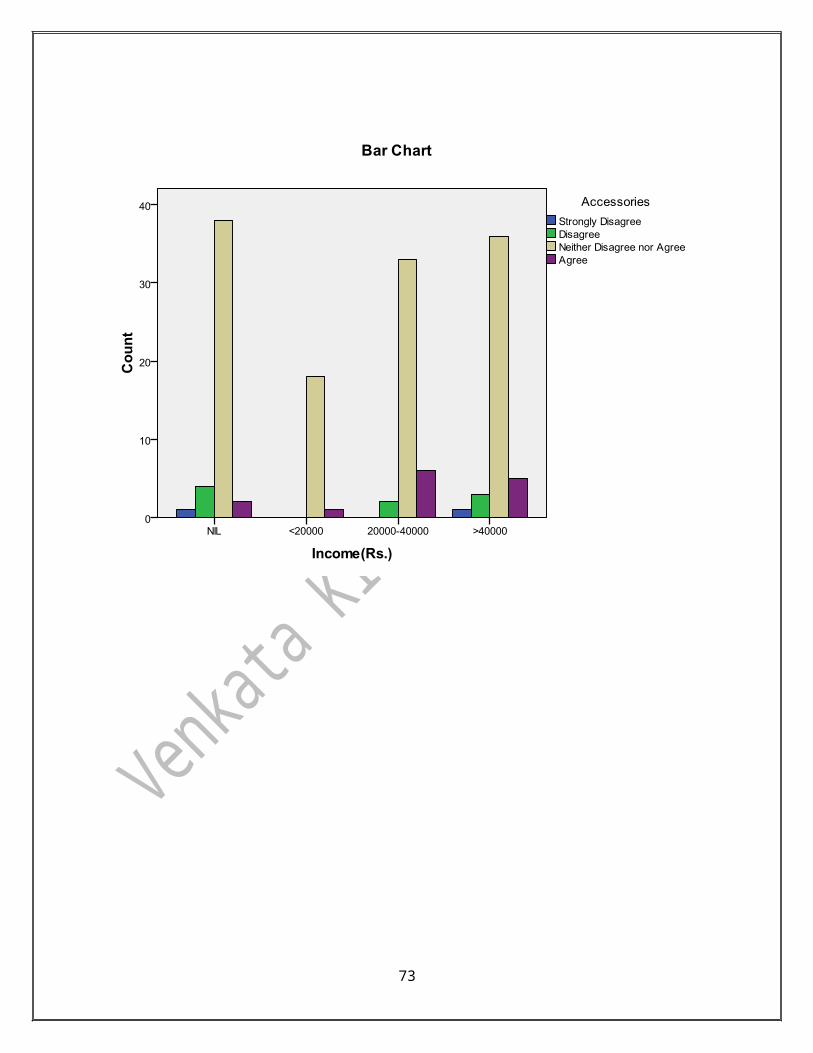
7) Income (Rs.) * Accessories
H0: There is no significant association between Income and Accessories at Kukatpally
Big Bazaar.
50

Crosstab
Accessories
Total
Strongly
Disagree Disagree
Neither
Disagree
nor Agree Agree
Income(Rs.)
NIL Count 1 4 38 2 45
% within Income(Rs.) 2.2% 8.9% 84.4% 4.4% 100.0%
<20000 Count 0 0 18 1 19
% within Income(Rs.) .0% .0% 94.7% 5.3% 100.0%
20000-40000 Count 0 2 33 6 41
% within Income(Rs.) .0% 4.9% 80.5% 14.6% 100.0%
>40000 Count 1 3 36 5 45
% within Income(Rs.) 2.2% 6.7% 80.0% 11.1% 100.0%
Total
Count 2 9 125 14 150
% within Income(Rs.) 1.3% 6.0% 83.3% 9.3% 100.0%
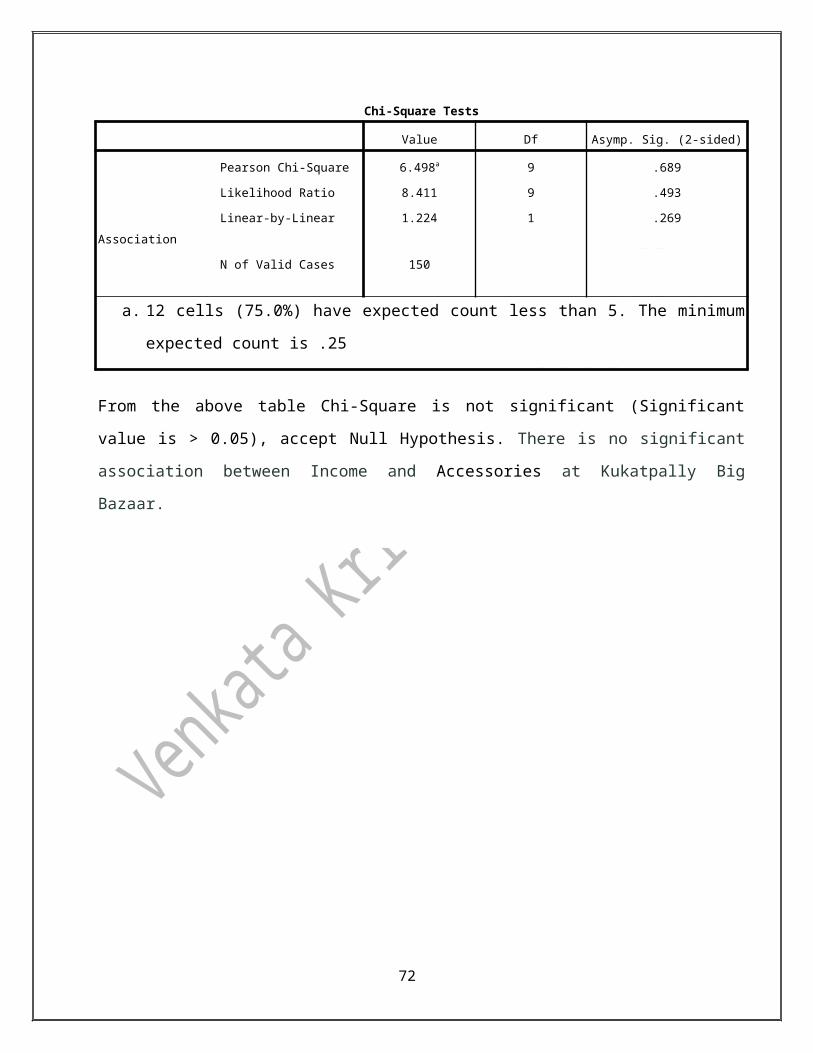
Chi-Square Tests
Value Df Asymp. Sig. (2-sided)
Pearson Chi-Square 6.498a 9 .689
Likelihood Ratio 8.411 9 .493
Linear-by-Linear Association 1.224 1 .269
N of Valid Cases 150
a. 12 cells (75.0%) have expected count less than 5. The minimum expected count is .25
From the above table Chi-Square is not significant (Significant value is > 0.05), accept Null
Hypothesis. There is no significant association between Income and Accessories at Kukatpally Big
Bazaar.
51

52
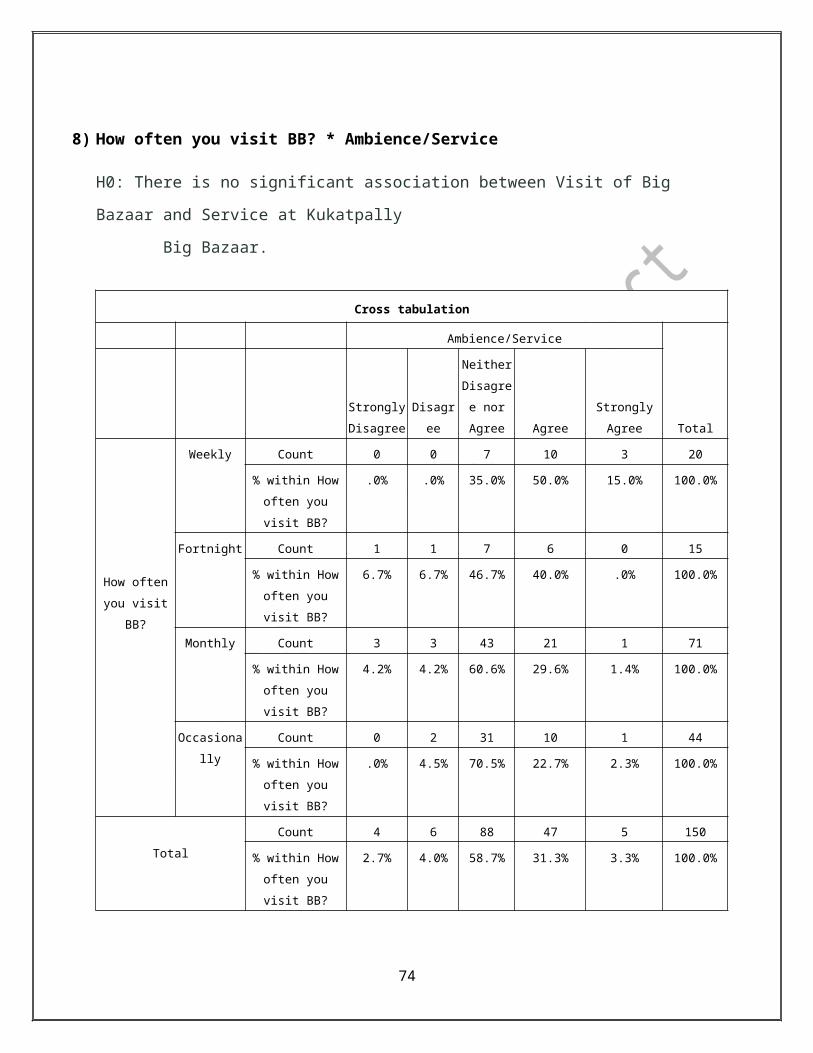
8) How often you visit BB? * Ambience/Service
H0: There is no significant association between Visit of Big Bazaar and Service at Kukatpally
Big Bazaar.
Cross tabulation
Ambience/Service
Total
Strongly
Disagree
Disagre
e
Neither
Disagree
nor
Agree Agree
Strongly
Agree
How often
you visit BB?
Weekly Count 0 0 7 10 3 20
% within How
often you visit
BB?
.0% .0% 35.0% 50.0% 15.0% 100.0%
Fortnight Count 1 1 7 6 0 15
% within How
often you visit
BB?
6.7% 6.7% 46.7% 40.0% .0% 100.0%
Monthly Count 3 3 43 21 1 71
% within How
often you visit
BB?
4.2% 4.2% 60.6% 29.6% 1.4% 100.0%
Occasionall
y
Count 0 2 31 10 1 44
% within How
often you visit
BB?
.0% 4.5% 70.5% 22.7% 2.3% 100.0%
Total
Count 4 6 88 47 5 150
% within How
often you visit
BB?
2.7% 4.0% 58.7% 31.3% 3.3% 100.0%
53
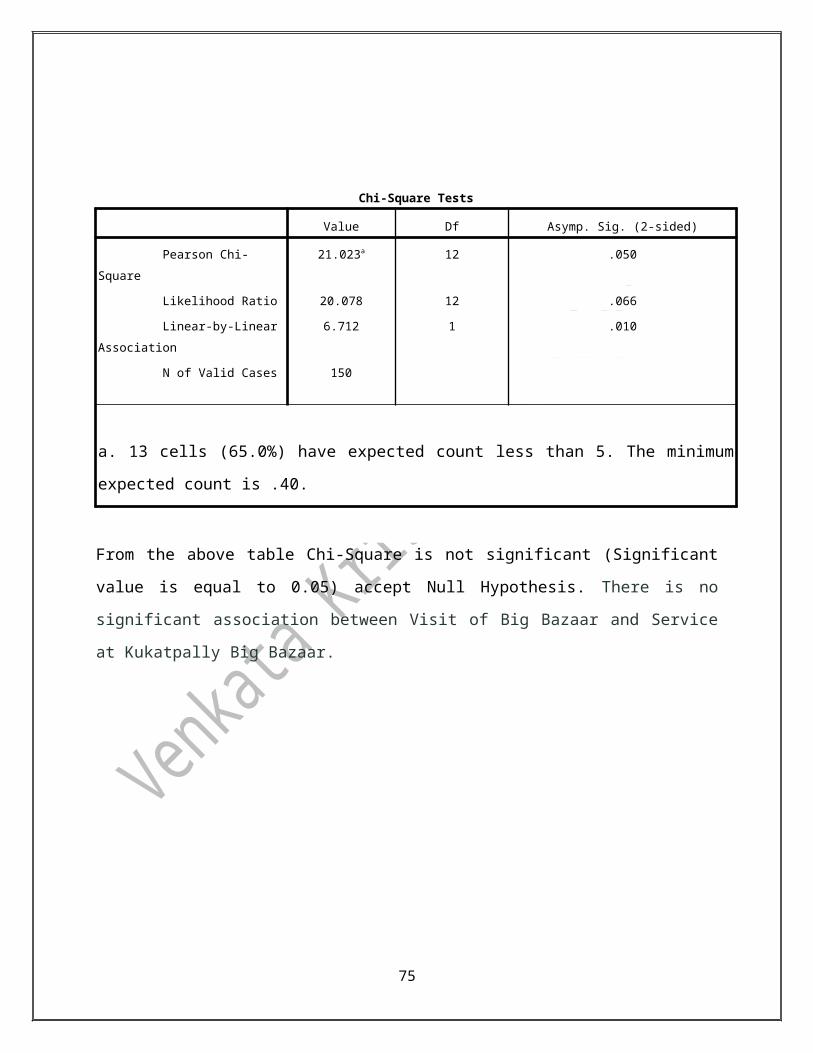
Chi-Square Tests
Value Df Asymp. Sig. (2-sided)
Pearson Chi-Square 21.023a 12 .050
Likelihood Ratio 20.078 12 .066
Linear-by-Linear Association 6.712 1 .010
N of Valid Cases 150
a. 13 cells (65.0%) have expected count less than 5. The minimum expected count is .40.
From the above table Chi-Square is not significant (Significant value is equal to 0.05) accept
Null Hypothesis. There is no significant association between Visit of Big Bazaar and Service at
Kukatpally Big Bazaar.
54

55
Null Hypothesis Sig. value Result
H0: There is no significant association between Income and Food
Items/ Grocery at Kukatpally Big Bazaar..264 Accepted
H0:There is no Significant association between Income and
Fashion & Clothing at Kukatpally Big Bazaar..530 Accepted
H0:There is no significant association between Income and Home
Appliances & décor at Kukatpally Big Bazaar..193 Accepted
H0: There is no significant association between Income and
Luggage at Kukatpally Big Bazaar..886 Accepted
H0:There is no significant association between Income and Toys
& Stationary at Kukatpally Big Bazaar..429 Accepted
H0:There is no significant association between Income and
Electronics at Kukatpally Big Bazaar..373 Accepted
H0:There is no significant association between Income and
Accessories at Kukatpally Big Bazaar..689 Accepted
H0:There is no significant association between Visit of Big
Bazaar and Service at Kukatpally Big Bazaar..050 Accepted
56
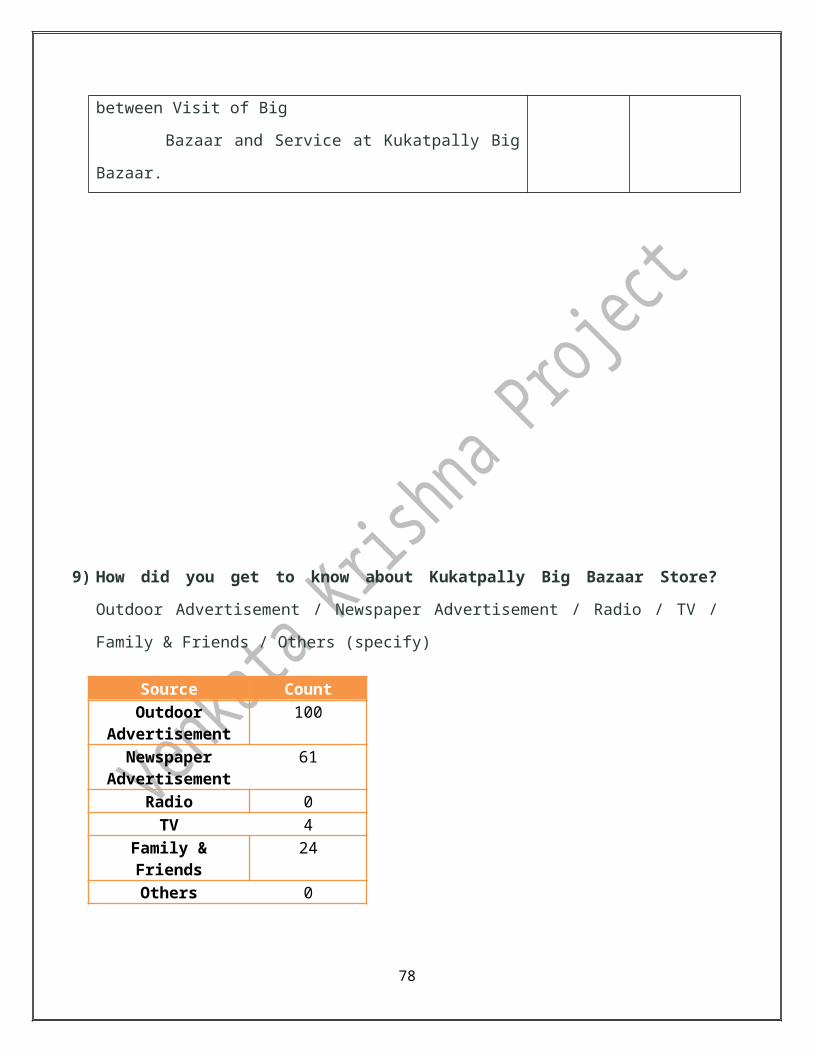
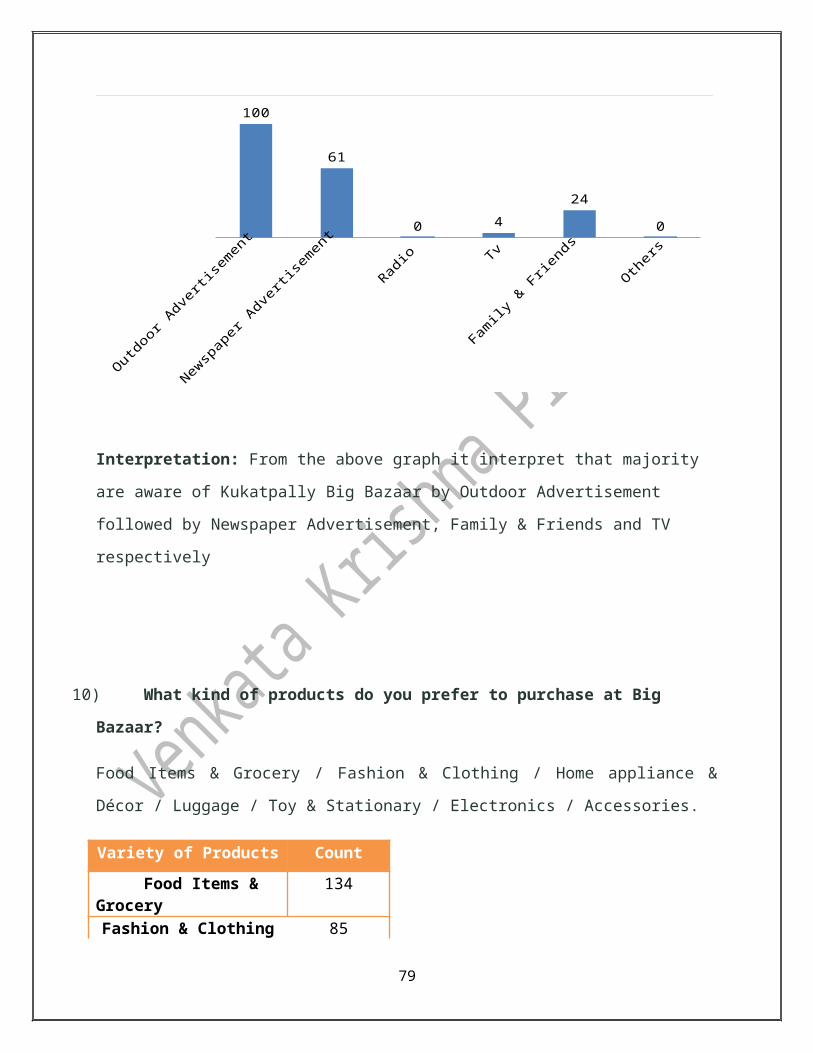
9) How did you get to know about Kukatpally Big Bazaar Store?
Outdoor Advertisement / Newspaper Advertisement / Radio / TV / Family & Friends / Others
(specify)
Source Count
Outdoor Advertisement
100
Newspaper Advertisement
61
Radio 0
TV 4
Family & Friends 24
Others 0
Outd
oor Adver
tisem
ent
New
spap
er A
dvertis
emen
t
Rad
io
Tv
Family
& F
riends
Oth
ers
100
61
0 4
24
0
Interpretation: From the above graph it interpret that majority are aware of Kukatpally Big
Bazaar by Outdoor Advertisement followed by Newspaper Advertisement, Family & Friends and
TV respectively
57
10) What kind of products do you prefer to purchase at Big Bazaar?
Food Items & Grocery / Fashion & Clothing / Home appliance & Décor / Luggage / Toy &
Stationary / Electronics / Accessories.
Variety of Products Count
Food Items & Grocery 134
Fashion & Clothing 85
Home appliance & Décor 39
Luggage 20
Toy & Stationary 23
Electronics 23
Accessories 19
Food Item
s &...
Fashio
n & C
lo...
Hom
e ap
pliance
...
Luggage
Toy & S
tatio
n...
Elect
ronic
s
Acc
esso
ries
134
85
39
20 23 23 19
Interpretation: From the above graph it interpret that,majority of respondents prefer Food Items & Grocery followed by Fashion & Clothing, Home appliance & Decor, Toy& Stationary, Electronics, Accessories and Luggage respectively.
58
11) Are you satisfied with the offers provided?
(SD = Strongly Disagree, D = Disagree, N = Neither Disagree nor Agree, A= Agree,
SA= Strongly Agree)
Variety of Products
Excellent Good Average Bad Worst
Food Items & Grocery
3 63 71 11 2
Fashion & Clothing
2 42 92 11 3
Home appliance &
Décor
0 25 114 9 2
Luggage 1 15 123 9 2
Toy & Stationary
1 14 123 9 3
Electronics 1 18 119 9 3
Accessories 0 14 125 9 2
Food Items / Grocery:
2%
42%
47%
7%1%
Excellent Good Average Bad Worst
59
Interpretation: From the above graph it interpret that out of 150 responses,48% feel the offers
are Average,42% feel that the offers are Good, 7% feel that the offers are Bad,2% feel that offers
are Excellent and 1% feel the offers are Worst
Fashion & Clothing:
1%28%
61%
7%
2%
Excellent Good Average Bad Worst
Interpretation: From the above graph it interpret that out of 150 responses, 62% feel the offers
are Average,28% feel the offers are Good,7% feel the offers are Bad,2% feel the offers are worst
and 1% feel the offers are Excellent
Home Appliance & Décor:
17%
76%
6% 1%
Excellent Good Average Bad Worst
60
Interpretation: From the above graph it interpret that out of 150 responses, 76% feel the offers
are Average, 17% feel the offers are Good, 6% feel the offers are bad and 1% feel the offers are
Worst
Luggage:
1%10%
82%
6%1%
Excellent Good Average Bad Worst
Interpretation: From the above graph it interpret that out of 150 responses, 82% feel the offers
are Average, 10% feel the offers are Good, 6% feel the offers are Bad, 1% feel the offers are
Worst and 1% feel the offers are Excellent
Toys & Stationary:
1%9%
82%
6%
2%
Excellent Good Average Bad Worst
61
Interpretation: From the above graph it interpret that out of 150 responses, 82% feel the offers
are Average, 9% feel the offers are Good,6% feel the offers are Bad, 2% feel the offers are
Worst and 1% feel the offers are Excellent
Electronics:
1%12%
79%
6%
2%
Excellent Good Average Bad Worst
Interpretation: From the above graph it interpret that out of 150 responses, 79% feel the offers
are Average, 12% feel the offers are Good, 6% feel the offers are Bad, 2% feel the offers are
Worst and 1% feel the offers are Excellent
Accessories:
9%
83%
6%1%
Excellent Good Average Bad Worst
62
Interpretation: From the above graph it interpret that out of 150 responses, 83% feel the offers
are Average, 10% feel the offers are Good, 6% feel the offers are Bad and 1% feel the offers are
Worst
12) Where do you prefer to shop Food Items / Grocery?
Big Bazaar / More (Megamart) / D-Mart / Others (specify)
Stores Count
Big Bazaar 93
More
38
D-Mart
54
Others 43
Big Bazaar More D-Mart Others
93
38
54
43
Interpretation: From the above graph it interpret that most of the respondents prefered to
purchase Food Items & Grocery is Big Bazaar followed with D-Mart, Others and More
respectively.
63
13) Do you like our Ambience and Services?
(SD = Strongly Disagree, D = Disagree, N = Neither Disagree nor Agree, A= Agree,
SA= Strongly Agree)
SD D N A SA
3%
31%
59%
4% 3%
Excellent Good Average Bad Worst
Interpretation: From the above graph it interpret that out of 150 responses, 59% is Average,
31% is Good, 4% is Bad, 3% is Excellent and 3% is Worst
64
5.3.2 DATA ANALYSIS OF OUTSIDE
Chi - Square Test:
1) Income(Rs.) * Food Items/ Grocery
H0: There is no significant association between Income and Food Items/ Grocery at
Kukatpally Big Bazaar
Crosstab
Food Items/ Grocery
TotalDisagree
Neither
Disagree
nor Agree Agree
Strongly
Agree
Income(Rs.)
NIL Count 2 9 14 0 25
% within Income(Rs.) 8.0% 36.0% 56.0% .0% 100.0%
<20000 Count 1 12 6 1 20
% within Income(Rs.) 5.0% 60.0% 30.0% 5.0% 100.0%
20000-40000 Count 0 9 14 0 23
% within Income(Rs.) .0% 39.1% 60.9% .0% 100.0%
>40000 Count 0 6 11 1 18
% within Income(Rs.) .0% 33.3% 61.1% 5.6% 100.0%
Total
Count 3 36 45 2 86
% within Income(Rs.) 3.5% 41.9% 52.3% 2.3% 100.0%
Chi-Square Tests
Value df Asymp. Sig. (2-sided)
Pearson Chi-Square 10.246a 9 .331
Likelihood Ratio 12.165 9 .204
Linear-by-Linear Association 2.447 1 .118
N of Valid Cases 86
a. 8 cells (50.0%) have expected count less than 5. The minimum expected count is .42.
65

From the above table Chi-Square is not significant (Significant value is > 0.05), accept Null
Hypothesis. There is no significant association between Income and Food Items/ Grocery at
Kukatpally Big Bazaar.
66
2) Income(Rs.) * Fashion & Clothing
H0: There is no significant association between Income and Fashion & Clothing at
Kukatpally Big Bazaar
Crosstab
Fashion & Clothing
Total
Strongly
Disagree Disagree
Neither
Disagree
nor Agree Agree
Strongly
Agree
Income(Rs.)
NIL Count 1 0 13 11 0 25
% within Income(Rs.) 4.0% .0% 52.0% 44.0% .0% 100.0%
<20000 Count 0 1 9 10 0 20
% within Income(Rs.) .0% 5.0% 45.0% 50.0% .0% 100.0%
20000-40000 Count 0 0 13 10 0 23
% within Income(Rs.) .0% .0% 56.5% 43.5% .0% 100.0%
>40000 Count 0 1 11 5 1 18
% within Income(Rs.) .0% 5.6% 61.1% 27.8% 5.6% 100.0%
Total
Count 1 2 46 36 1 86
% within Income(Rs.) 1.2% 2.3% 53.5% 41.9% 1.2% 100.0%
Chi-Square Tests
Value df Asymp. Sig. (2-sided)
Pearson Chi-Square 10.483a 12 .574
Likelihood Ratio 10.700 12 .555
Linear-by-Linear Association .005 1 .945
N of Valid Cases 86
a. 12 cells (60.0%) have expected count less than 5. The minimum expected count is .21.
From the above table Chi-Square is not significant (Significant value is > 0.05), accept Null
Hypothesis. There is no significant association between Income and Fashion & Clothing at
Kukatpally Big Bazaar.
67
68
3) Income(Rs.) * Home App.& décor
H0: There is no significant association between Income and Home appliances & décor at
Kukatpally Big Bazaar.
Crosstab
Home App.& décor
TotalDisagree
Neither Disagree
nor Agree Agree
Income(Rs.)
NIL Count 1 19 5 25
% within Income(Rs.) 4.0% 76.0% 20.0% 100.0%
<20000 Count 0 18 2 20
% within Income(Rs.) .0% 90.0% 10.0% 100.0%
20000-40000 Count 0 17 6 23
% within Income(Rs.) .0% 73.9% 26.1% 100.0%
>40000 Count 0 10 8 18
% within Income(Rs.) .0% 55.6% 44.4% 100.0%
Total
Count 1 64 21 86
% within Income(Rs.) 1.2% 74.4% 24.4% 100.0%
Chi-Square Tests
Value df Asymp. Sig. (2-sided)
Pearson Chi-Square 8.847a 6 .182
Likelihood Ratio 8.844 6 .183
Linear-by-Linear Association 4.684 1 .030
N of Valid Cases 86
a. 6 cells (50.0%) have expected count less than 5. The minimum expected count is .21.
From the above table Chi-Square is not significant (Significant value is > 0.05), accept Null Hypothesis. There is no significant association between Income and Home appliances & décor at Kukatpally Big Bazaar.
69
70
4) Income (Rs.) * Luggage
H0: There is no significant association between Income and Luggage at Kukatpally
Big Bazaar.
Crosstab
Luggage
TotalDisagree
Neither Disagree
nor Agree Agree
Income(Rs.)
NIL Count 0 21 4 25
% within Income(Rs.) .0% 84.0% 16.0% 100.0%
<20000 Count 0 18 2 20
% within Income(Rs.) .0% 90.0% 10.0% 100.0%
20000-40000 Count 0 17 6 23
% within Income(Rs.) .0% 73.9% 26.1% 100.0%
>40000 Count 1 13 4 18
% within Income(Rs.) 5.6% 72.2% 22.2% 100.0%
Total Count 1 69 16 86
% within Income(Rs.) 1.2% 80.2% 18.6% 100.0%
Chi-Square Tests
Value df Asymp. Sig. (2-sided)
Pearson Chi-Square 6.024a 6 .420
Likelihood Ratio 5.455 6 .487
Linear-by-Linear Association .238 1 .626
N of Valid Cases 86
a. 8 cells (66.7%) have expected count less than 5. The minimum expected count is .21.
From the above table Chi-Square is not significant (Significant value is > 0.05), accept
Null Hypothesis. There is no significant association between Income and Luggage at
Kukatpally Big Bazaar.
71
72
5) Income (Rs.) * Toys & Stationary
H0: There is no significant association between Income and Toys & Stationary at Kukatpally
Big Bazaar.
Crosstab
Toys & Stationary
Total
Neither Disagree
nor Agree Agree
Income(Rs.)
NIL Count 18 7 25
% within Income(Rs.) 72.0% 28.0% 100.0%
<20000 Count 18 2 20
% within Income(Rs.) 90.0% 10.0% 100.0%
20000-40000 Count 17 6 23
% within Income(Rs.) 73.9% 26.1% 100.0%
>40000 Count 13 5 18
% within Income(Rs.) 72.2% 27.8% 100.0%
Total Count 66 20 86
% within Income(Rs.) 76.7% 23.3% 100.0%
Chi-Square Tests
Value df Asymp. Sig. (2-sided)
Pearson Chi-Square 2.594a 3 .459
Likelihood Ratio 2.960 3 .398
Linear-by-Linear Association .062 1 .803
N of Valid Cases 86
a. 2 cells (25.0%) have expected count less than 5. The minimum expected count is 4.19.
From the above table Chi-Square is not significant (Significant value is > 0.05), accept Null
Hypothesis. There is no significant association between Income and Toys & Stationary at
Kukatpally Big Bazaar.
73
74
6) Income(Rs.) * Electronics
H0: There is no significant association between Income and Electronics at Kukatpally
Big Bazaar.
Crosstab
Electronics
Total
Neither Disagree
nor Agree Agree
Income(Rs.)
NIL Count 19 6 25
% within Income(Rs.) 76.0% 24.0% 100.0%
<20000 Count 18 2 20
% within Income(Rs.) 90.0% 10.0% 100.0%
20000-40000 Count 17 6 23
% within Income(Rs.) 73.9% 26.1% 100.0%
>40000 Count 12 6 18
% within Income(Rs.) 66.7% 33.3% 100.0%
Total Count 66 20 86
% within Income(Rs.) 76.7% 23.3% 100.0%
Chi-Square Tests
Value df Asymp. Sig. (2-sided)
Pearson Chi-Square 3.104a 3 .376
Likelihood Ratio 3.410 3 .333
Linear-by-Linear Association .871 1 .351
N of Valid Cases 86
a. 2 cells (25.0%) have expected count less than 5. The minimum expected count is 4.19.
From the above table Chi-Square is not significant (Significant value is > 0.05),
accept Null Hypothesis. There is no significant association between Income and
Electronics at Kukatpally Big Bazaar.
75

76

7) Income(Rs.) * Accessories
H0: There is no significant association between Income and Accessories at Kukatpally Big
Bazaar.
Crosstab
Accessories
Total
Neither Disagree
nor Agree Agree
Income(Rs.)
NIL Count 20 5 25
% within Income(Rs.) 80.0% 20.0% 100.0%
<20000 Count 18 2 20
% within Income(Rs.) 90.0% 10.0% 100.0%
20000-40000 Count 18 5 23
% within Income(Rs.) 78.3% 21.7% 100.0%
>40000 Count 15 3 18
% within Income(Rs.) 83.3% 16.7% 100.0%
Total Count 71 15 86
% within Income(Rs.) 82.6% 17.4% 100.0%
Chi-Square Tests
Value df Asymp. Sig. (2-sided)
Pearson Chi-Square 1.185a 3 .757
Likelihood Ratio 1.277 3 .735
Linear-by-Linear Association .000 1 .986
N of Valid Cases 86
a. 4 cells (50.0%) have expected count less than 5. The minimum expected count is 3.14.
From the above table Chi-Square is not significant (Significant value is > 0.05), accept
Null Hypothesis. There is no significant association between Income and Accessories at
Kukatpally Big Bazaar.
77
78
8) How often you visit BB? * Ambience/Service Cross tabulation
H0: There is no significant association between Visit of Big Bazaar and Service at Kukatpally
Big Bazaar.
Crosstab
Ambience/Service
TotalDisagree
Neither
Disagree nor
Agree Agree
Strongly
Agree
How often you visit
BB?
Weekly Count 0 3 9 1 13
% within How often you
visit BB?
.0% 23.1% 69.2% 7.7% 100.0%
Fortnight Count 0 0 5 0 5
% within How often you
visit BB?
.0% .0% 100.0% .0% 100.0%
Monthly Count 1 12 23 0 36
% within How often you
visit BB?
2.8% 33.3% 63.9% .0% 100.0%
Occasionally Count 2 25 5 0 32
% within How often you
visit BB?
6.3% 78.1% 15.6% .0% 100.0%
Total
Count 3 40 42 1 86
% within How often you
visit BB?
3.5% 46.5% 48.8% 1.2% 100.0%
Chi-Square Tests
Value df Asymp. Sig. (2-sided)
Pearson Chi-Square 31.760a 9 .000
Likelihood Ratio 33.795 9 .000
Linear-by-Linear Association 19.429 1 .000
N of Valid Cases 86
a. 10 cells (62.5%) have expected count less than 5. The minimum expected count is .06.
79
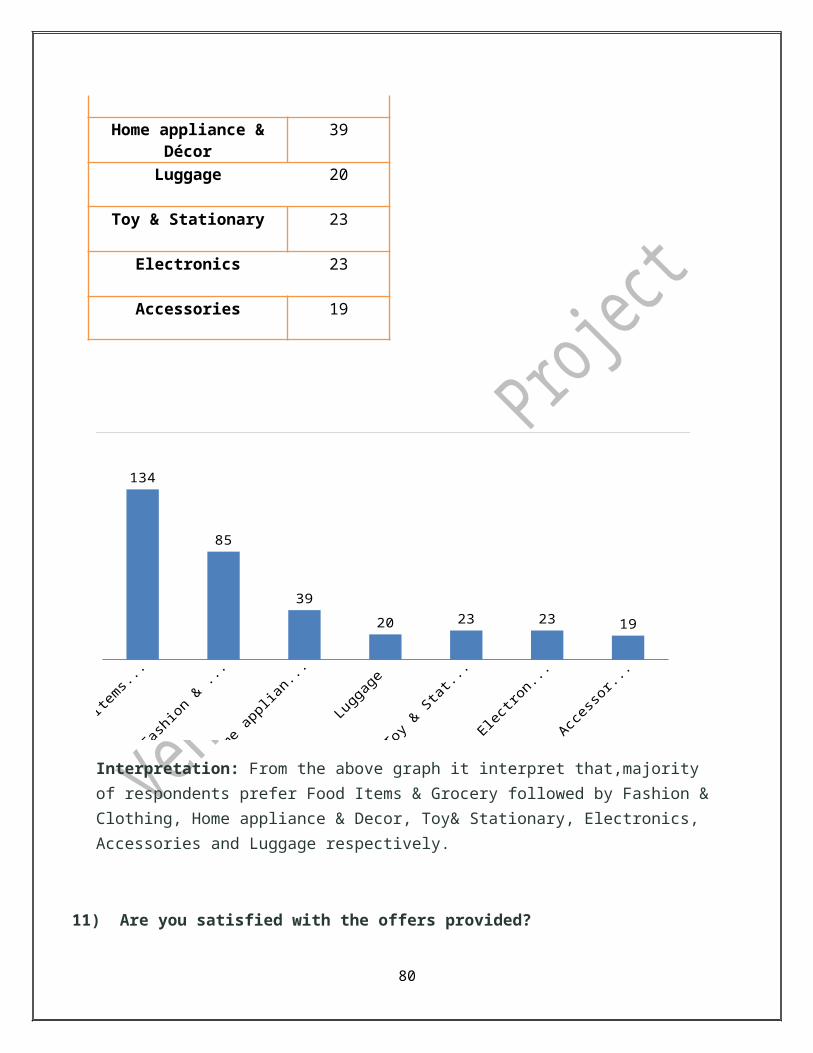
From the above table Chi-Square is significant (Significant value is < 0.05) Reject Null Hypothesis. There is a significant association between Visit of Big Bazaar and Service at Kukatpally Big Bazaar.
80
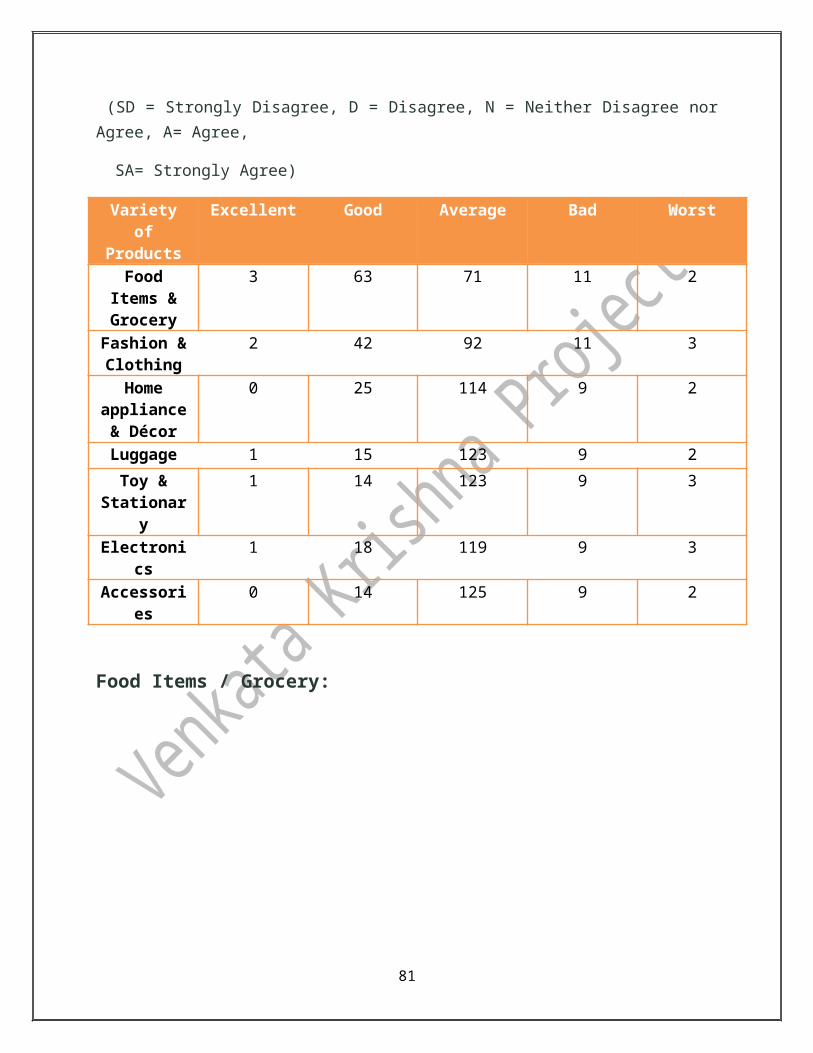
Null Hypothesis Sig. value ResultH0: There is no significant association between Income
and Food Items/ Grocery at Kukatpally Big Bazaar..331 Accepted
H0: There is no Significant association between Income
and Fashion & Clothing at Kukatpally Big Bazaar..574 Accepted
H0: There is no significant association between Income
and Home Appliances & décor at Kukatpally Big Bazaar..182 Accepted
H0: There is no significant association between Income
and Luggage at Kukatpally Big Bazaar..420 Accepted
H0: There is no significant association between Income
and Toys & Stationary at Kukatpally Big Bazaar..459 Accepted
H0: There is no significant association between Income
and Electronics at Kukatpally Big Bazaar..376 Accepted
H0: There is no significant association between Income
and Accessories at Kukatpally Big Bazaar..757 Accepted
H0: There is no significant association between Visit of
Big Bazaar and Service at Kukatpally Big Bazaar..000 Reject
81
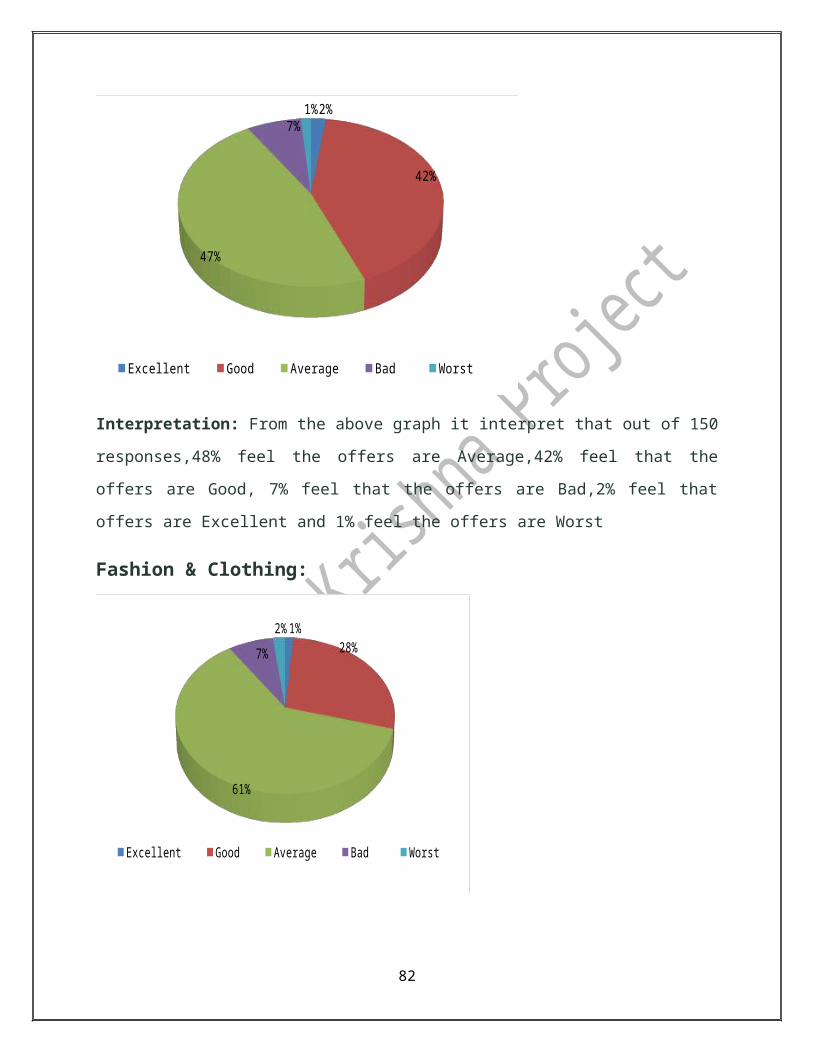
Frequency Test:
9) How did you get to know about Kukatpally Big Bazaar Store? Outdoor Advertisement / Newspaper Advertisement / Radio / TV / Family & Friends / Others (specify)
Outd
oor Adver
tisem
ent
New
spap
er A
dvertis
emen
t
Radio
Tv
Family
& F
riends
Oth
ers
63
24
0 2
18
0
Different Source Of Awareness
Interpretation: From the above graph it interpret that outdoor Advertisement has major influence to create Awareness followed by Newspaper Advertisement, Family & Friends and TV respectively.
10) If Hypermarket how did you get to know about change?
82
Source
Count
Outdoor Advertisement
63
Newspaper Advertisement 24
Radio 0
TV 2
Family & Friends 18
Others 0
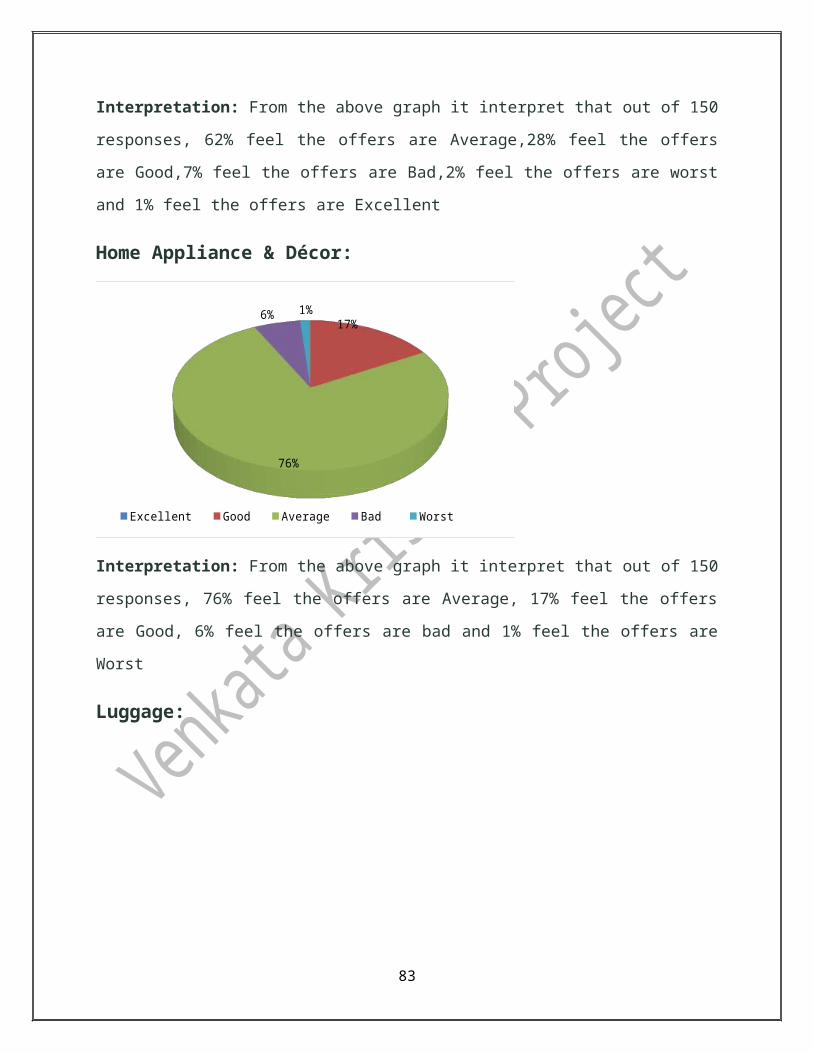
Outdoor Advertisement / Newspaper Advertisement / Radio / TV / Family & Friends /
Others (specify)
Outdoor Advert
isemen
t
Newsp
aper
Advertise
ment
Radio Tv
Family
& Frie
nds Others
58
26
0 1
16
0
83
Source Count
Outdoor Advertisement
58
Newspaper Advertisement
26
Radio 0
TV
1
Family & Friends 16
Others
0
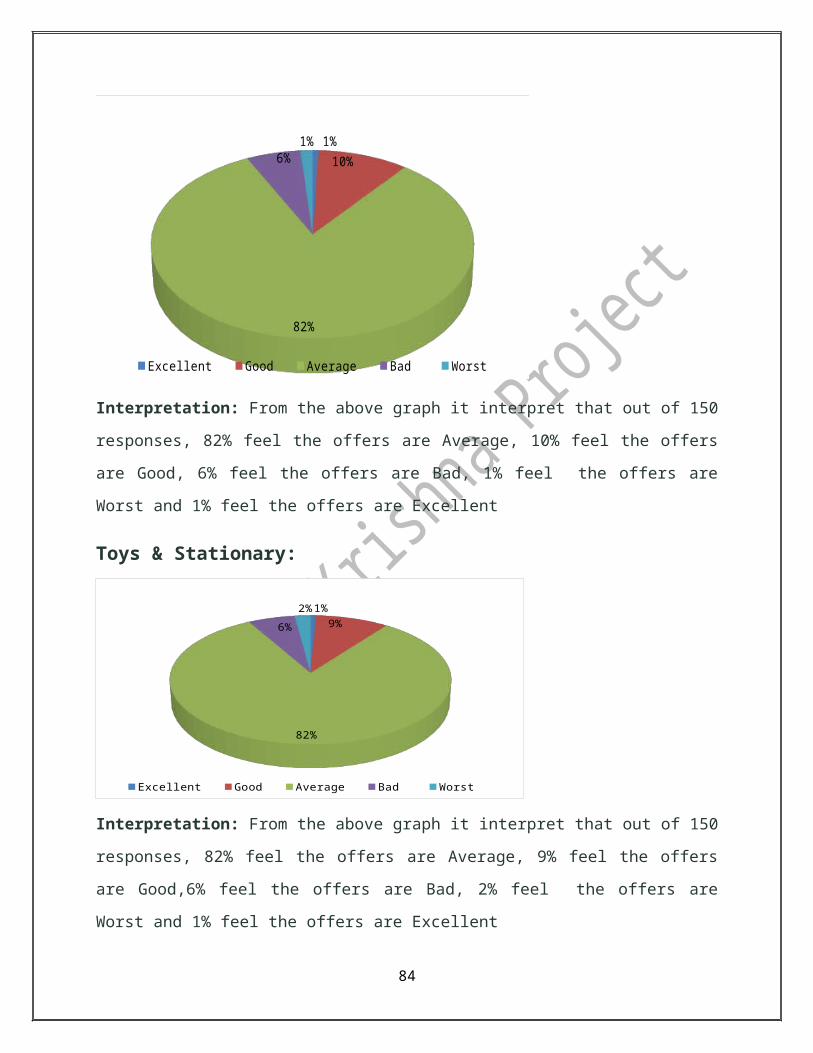
Interpretation: From the above graph it interpret that, outdoor Advertisement has major
influence to educate people about the change from FBB to Hypermarket followed by
Newspaper Advertisement, Family & Friends and TV respectively
11) What kind of products do you prefer to purchase at Big Bazaar?
Food Items & Grocery / Fashion & Clothing / Home appliance & Décor / Luggage / Toy &
Stationary / Electronics / Accessories.
Food Item
s & G
roce
ry
Fashion &
Clothing
Home applia
nces &
Déc
or
Luggage
Toy & Stat
ionary
Electro
nics
Acces
sorie
s
72
48
2316 15 14 15
Preference Of Products At Big Bazaar
84
Variety of Products Count
Food Items & Grocery 72
Fashion & Clothing 48
Home Appliances & Décor
23
Luggage 16
Toy & Stationary
15
Electronics 14
Accessories 15

Interpretation: From the above graph it interpret that, Food Items & Grocery hold major preference among the customers followed by Fashion& Clothing, Home appliance & Decor, Luggage, Toy& Stationary, Accessories and Electronics respectively.
12) Where do you prefer to shop Food Items / Grocery?
Big Bazaar / More (Megamart) / D-Mart / Others (specify)
Stores Count
Big Bazaar 54
More 76
D-Mart 58
Others 83
Big Bazaar More D-Mart Others
54
76
58
83
Interpretation: From the above graph it interpret that, most preferred store to purchase Food Items & Grocery are others followed with More, D-Mart and Big Bazaar.
85
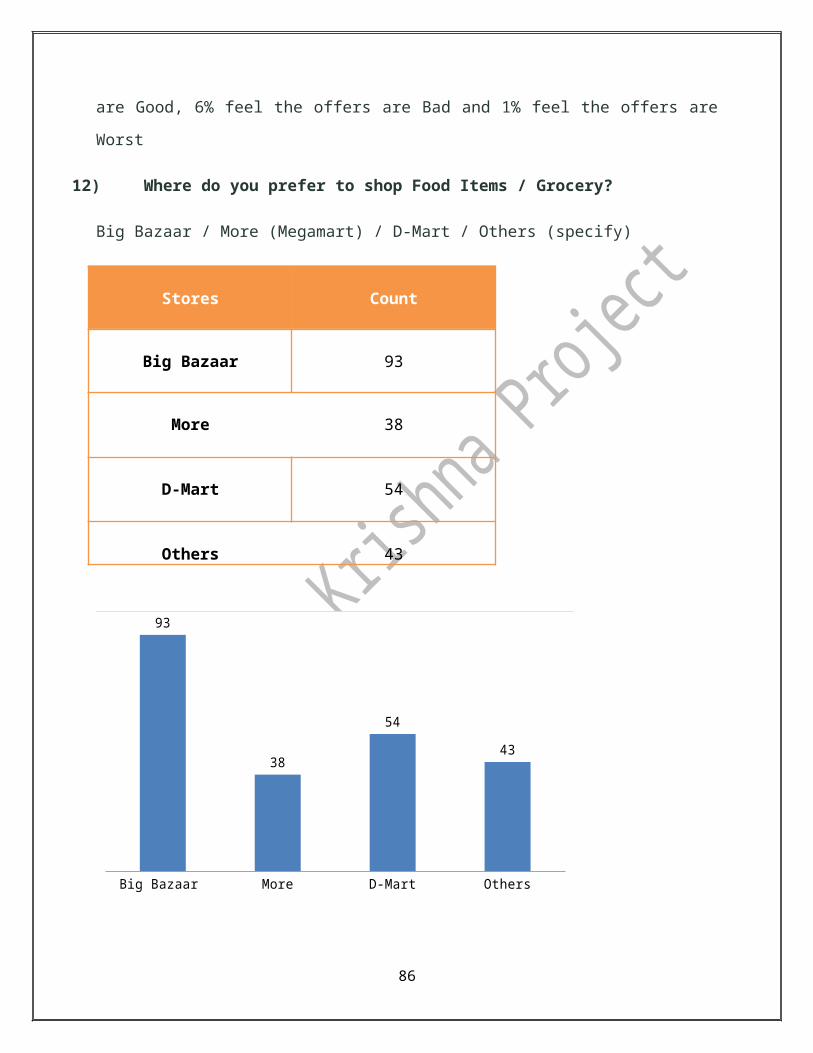
5.5.3 Limitations of the studyIt is not possible for any market study to make it accurate due to many hurdles in the
collection and computation of data. Some limitations of the study are listed below
Respondents show reluctance towards giving correct information.
Findings of the study are based on the assumption that respondents have disclosed in the
questionnaire.
Time constraint
The sample was limited to respondent residing in and around Kukatpally region and
customers visiting the store
86

Chapter 6FINDINGS, SUGGESTIONS & CONCLUSION
FINDINGS:
In this study we came across many factors that influence the consumers’ perception of a store
and their subsequent shopping and buying decisions. Here, I present the findings gathered and
the suggestions we offer to companies based on the data gathered and analyzed.
The age groups were identified as key factors impacting shopping and purchase decisions of
consumers. By analyzing the responses to this question, Researchers and, as well as companies,
can identify the Demographics of the population that visit retail outlets.
The highest number of respondents falls in the age group 26-35. It can be deduced that most of
the consumers who visit retail outlets regularly are the youth. The rest of the population who
visit the retail outlets under study can be listed in the following descending order of distribution
– the middle age group the student age group, the older age group, and senior citizens.
( i.e. Out of 336 samples it was found that, there are 29% of people are of age 26-35, 24% of
people are of age 36-45, 20% of people are of age 15-25, 19% of people are of age 45-60 and 8%
of people are of age >60.)
Consumers were also asked to indicate their gender. The object of this question is to
understand the demographics of the population under study. By analyzing the responses to this
question, we, the researcher, as well as companies, can identify the distribution in the number of
men and women who visit the retail outlets and appropriate decisions can be made keeping these
numbers in mind.
The Highest number of respondents were Male, as is depicted by the graph and chart
presented above. The number of Female respondents was less compared to the Male respondents.
Two deductions can be made from the above data collected: one, more men visit retail outlets
than women.
This can help the companies and researchers in undertaking future decisions and studies.
Since more men can be inferred to visit retail stores than women, companies can target their
87
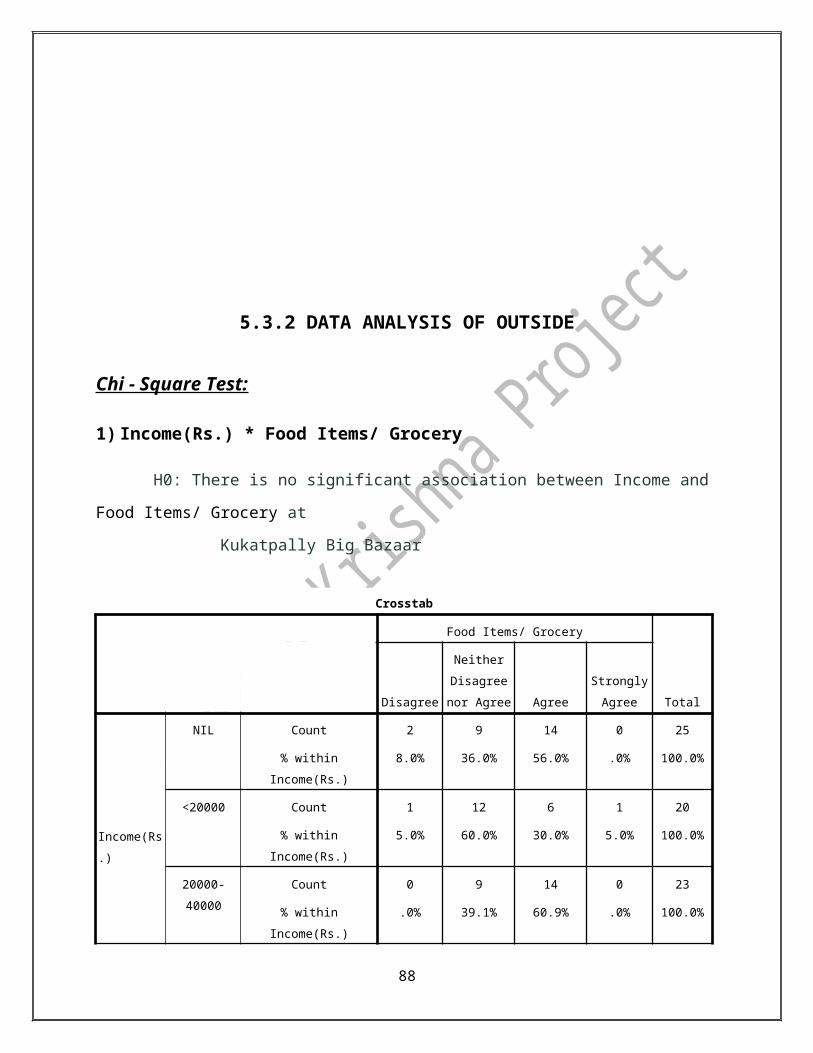
offerings and marketing strategies in two areas. Retail outlets can appeal to the men customers
by offering more products geared especially towards men. They can provide a shopping
experience that men are particularly attracted to.
Another way that retail chains can use the above data is to appeal to the women rather than
the men. Since, fewer women visit retail stores as against men, the companies have a large base
of potential customers. By providing products that are geared towards women and by providing a
shopping experience that attracts women, the retail chains can expand their customer base.
Inside:
During the project period there are totally 2 different types of offers executed is Wednesday
Bazaar and Weekends offers (i.e. on Saturdays and Sundays) by Big Bazaar. And the customer
walk-in was very good in these offers days
The sample size of the visitors in Big Bazaar is 150, out of which 102 are male and 48 are
Female
According to the study, we found that the visitors from the age group of 26-35 are more and
followed by 36-45, 46-60, 15-25 and >60
Out of 150 Samples, 59.33% of the respondents are employed, 20% of them are Housewife,
10.67% are Businessman and 10% are Students. This shows that, most of the employed
people prefer to buy in Big Bazaar
Based on the Income Levels of the Customer who visited Kukatpally Big Bazaar 30% of
customer are having salary of Rs. >40,000, 30% are having salary NIL and 27.3% are having
salary between Rs. 20,000 - 40,000 and only 12.67% having salary Rs. < 20,000
Majority of people visiting Big Bazaar are from Kukatpally followed by Vivekananda Nagar
and KPHB
Out of three catchments of Kukatpally region 75% of people belong to Middle Income Group
Out of 150 Samples, 100 customers feel that they came to Big Bazaar by seeing Outdoor
Advertisement, 61 customers feel that they came by seeing Newspaper Advertisement, 24
customers feel that they came by the advice of their Family & friends and 4 customers feel
that they came after watching the Advertisement in TV
88
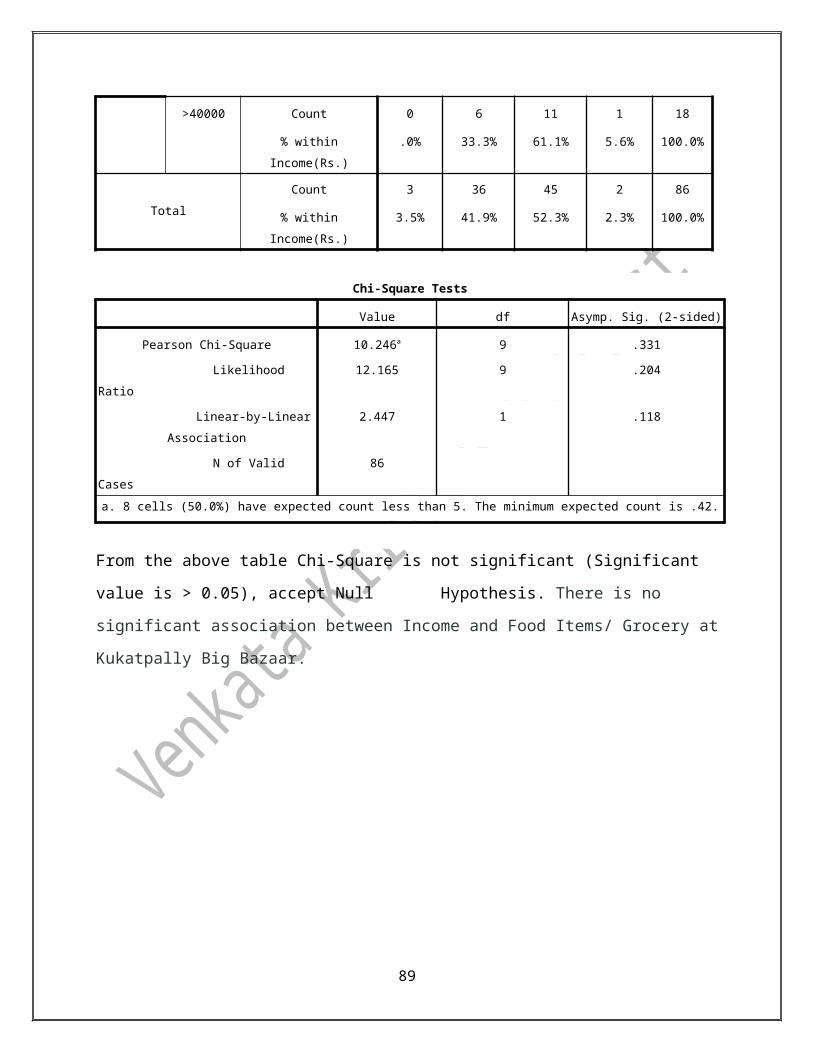
The Perception of Customer has been changed from FBB to Hypermarket during the period
due to the Advertisements
Out of three catchments of Kukatpally region 34.5% of customer prefer Food Items &
Grocery, 23.8% of customers prefer Fashion & Clothing, 10.6% of customers prefer Home
appliance & Décor, 8.1% of customers Prefer Electronics, 7.6% of customers prefer
Luggage, 7.6% of customers prefer Toy & Stationary and another 7.6% of customers prefer
Accessories
Big Bazaar is treated as the family destination for shopping. Number of people coming to Big
Bazaar with family is more than 60%. Followed by people coming to Big Bazaar with friends
is 15.33%
47.33% of the footfall to the Big Bazaar is on monthly basis whereas 29.33% of footfall is on
occasionally, 13.33% of footfall is on Weekly basis and 10% of footfall is on Fortnight
We have found that many people like to come in offer days like Wednesday Bazaar,
Weekends and festival Seasons
48.8% of the customers of income group between Rs. 20,000 - 40,000 feel that they are
satisfied with the offers and for the income Rs.>40,000 group the 51.1% of customers said it
was Good
More than 53.7% of the respondents feel that fbb apparels are of Average quality. This show
that, Big Bazaar has to work on the quality of cloths
The Satisfaction Level of all the other items like Fashion & Clothing, Home appliances &
décor, Luggage, Toys & Stationary, Electronics, Accessories are average
About 40.78% of the customers are preferred to purchase Food Items / Grocery at the Big
Bazaar.
More than 50% of the Customers feel that the Ambience and Service provided is good
89

Outside:
The sample size of the visitors in Big Bazaar is 186, out of which 116 are male and 70 are
Female
According to the study, we found that of respondents of age group 26-35 are more and
followed by 15-25, 36-45 ,45-60 and >60
Out of 186 Samples, 15% of the respondents are Students, 46.23% of them are Employed,
19.35% are Businessman and 19.35% are Housewife. This shows that, most of the employed
people prefer to buy in Big Bazaar
Out of 186 Samples we found that, the Income Levels of the Customers are 34.4% who is
having salary of NIL, 21.5% of the respondents are having income level of < Rs. 20,000,
20.9% of the respondents are having the income level between Rs. 20,000- 40,000 and
23.11% of the respondents are having income of Rs. >40,000
Out of 186 Samples only 86 respondents are aware of Kukatpally Big Bazaar and 100
respondents don’t know that there is Big Bazaar in Kukatpally. This shows that there is a
requirement of Promotional Activities for Big Bazaar in Kukatpally
Out of 86 Respondents who know that there is Big Bazaar in kukatpally maximum
respondents replied that they knew the change from FBB to Hypermarket
Based on the Respondents reply it is found that many people like to come in offer days like
Wednesday Bazaar, Weekends and festival Seasons
Out of 86 respondents, 41.86% of the footfall to the Big Bazaar is on monthly basis whereas
37.20% of footfall is on occasionally, 15.11% of footfall is on Weekly basis and 5.81% of
footfall is on Fortnight. This shows that most of the offers must be given during the
weekends, month starting so that the sales will be improved
61.1% of the customers of income group Rs. >40,000 feel that the offers are satisfied for
Food Items / Grocery
The Satisfaction Level of all the other items like Fashion & Clothing, Home appliances &
décor, Luggage, Toys & Stationary, Electronics, Accessories are average
More than 50% of the Customers feel that the Ambience and Service provided is good
90
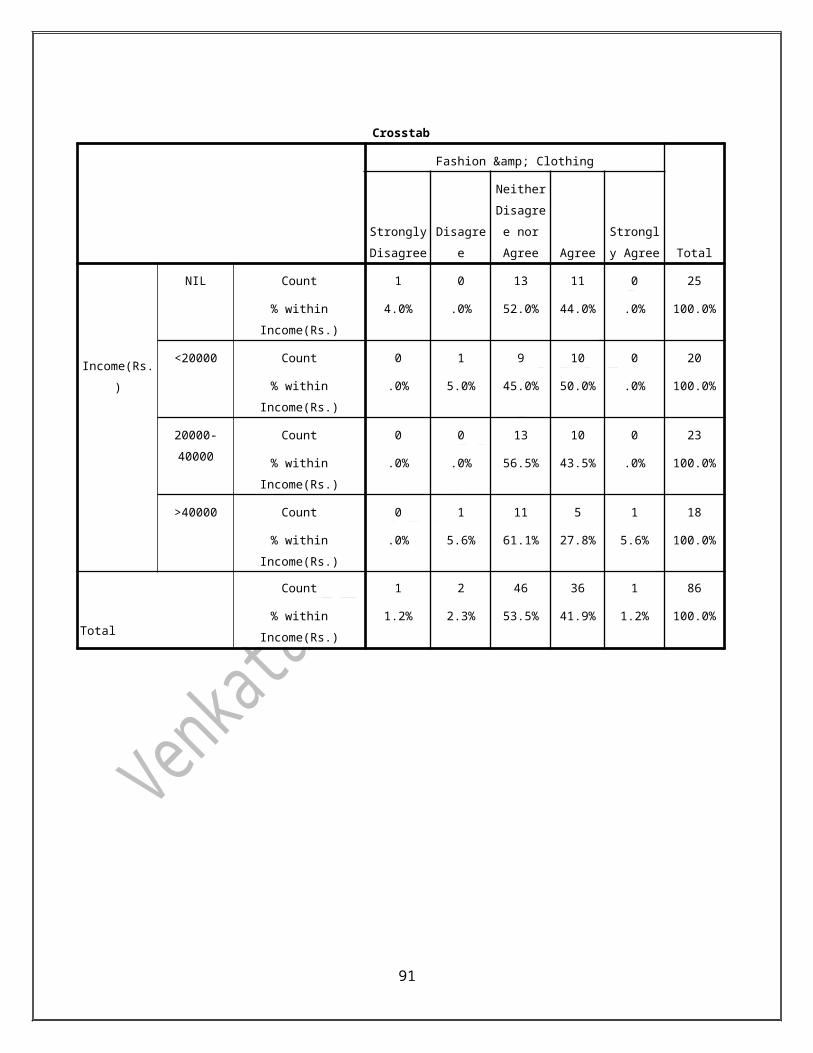
SUGGESTIONSPromotional Activities:
Out of 336 Samples, 50% of the respondents are aware of Big Bazaar by Outdoor
advertisement, followed by 25.59% by Newspaper and 12.5% by Family and Friends this
shows there is a huge scope for Outdoor Advertisement in promoting the Kukatpally Big
Bazaar
Outdoor Advertisement should be done around Manjeera Mall because majority of people
prefer it as their weekend destination
In Kukatpally catchment , majority (i.e. more than 80%) of the people are Telugu speaking
so best mode to advertise are through local newspapers (like EENADU, SAKSHI ) and Local
TV Channels
In these Medias, we need to provide awareness to the customers about the changes that has
been took place from FBB to Hypermarket.
From the study it is observed that 47.33% of the customers come to Big Bazaar on monthly
basis whereas 29.33% of footfall is on occasionally, 13.33% of footfall is on Weekly basis
and 10% of footfall is on Fortnight. Majority of customers come during month endings. So,
promotional Activities must be done during the Weekends and Month endings
Majority of Customers ( i.e. 34.5% of customer prefer Food Items & Grocery, 23.8% of
customers prefer Fashion & Clothing ) would like to buy Food Items & Grocery and also
Fashion & Clothing so, promotional activities must concentrate on the availability of
different Branded Items and the offers that Big Bazaar is Providing.
Out of the 336 Samples, 10.6% of customers prefer Home appliance & Décor, 8.1% of
customers Prefer Electronics, 7.6% of customers prefer Luggage, 7.6% of customers prefer
Toy & Stationary and another 7.6% of customers prefer Accessories. So, this shows we need
to promote these items by offers and also the availability of different brands to customers
Coming to the recent trends in Advertisement, there is a huge scope for Promoting the
Kukatpally Big Bazaar by using Apps and Social Media.
91
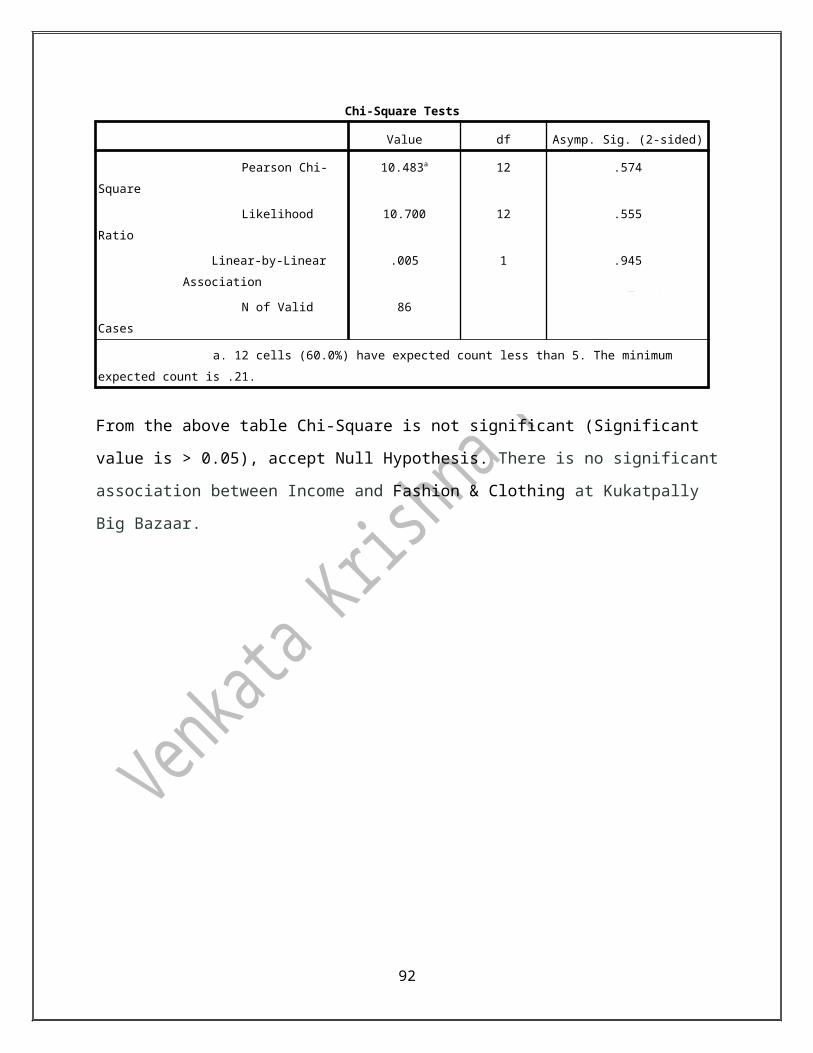
CONCLUSION
Big Bazaar is a major shopping complex for today‘s customers. It is a place where customers
find variety of products at a reasonable price. Big Bazaar has a good reputation of itself in the
market. It has positioned itself in the market as a discounted store. It holds a huge customer base.
The majority of customers belong to middle class family. The youth generation also likes
shopping and moving around Big Bazaar. Volume sales always take place in Big Bazaar.
Impulse buying behavior of customers comes in to play most of the times in Big Bazaar. Big
Bazaar is a hypermarket as it provides various kinds of goods like apparels, grocery, stationary,
food items, electronic items, leather items, watches, crockery, decorative items, sport items,
chocolates and many more. It competes with all the specialty stores of different products which
provide goods at a discounted rate all throughout the year. It holds a large customer base and it
seemed from the study that the customers are quite satisfied with Big Bazaar.
It has emerged as a hub of shopping specially for middle class people. Different types of
products starting from a baby food to pizzas wide range is available under one roof. Even most
of the people do their monthly shopping from Big Bazaar. People not only visit Big Bazaar to do
shopping but also visit for outing purpose as it provides a very nice ambience to its customers.
As people go to malls they just tend to move around Big Bazaar whether it is for shopping
purpose or for outing purpose. Grocery, apparels and food items are the products which
are demanded most by the customers of Kukatpally in Big Bazaar. The major drawback of Big
Bazaar is that it lacks in providing enough parking space for their customers. This may
discourage the customers to come to Big Bazaar and shop as they face difficulty in
parking their vehicles.
Even though some customers say that they don‘t feel problem in parking their vehicle, it is
because of the parking space available to them by the mall. As it is surveyed it seems that the
biggest competitors of Big Bazaar are the kirana stores, discounted specialty stores like D-Mart,
More, Reliance Retail, etc.
92

CHAPTER-7
ANNEXURE & BIBLIOGRAPHY
Effectiveness of Promotional Activities of Big Bazaar
1. Name :
2. Age : (15-25) / (26-35) / (36-45) / (46-60 ) / (>60)
3. Gender : Male / Female
4. Occupation : Students / Employed / Businessman / Housewife
5. Income (₨.per month) : NIL / <20,000 / 20,000 - 40,000 / > 40,000
6. Location :
7. Do you know about Kukatpally Big Bazaar?
(Yes / No)
8. How did you get to know about Kukatpally Big Bazaar Store?
Outdoor Advertisement / Newspaper Advertisement / Radio / TV / Family & Friends /
Others (specify)
9. What is your perception about the Kukatpally Store?
FBB (Fashion at Big Bazaar) / Hypermarket (Variety of products under one roof)
10. If Hypermarket how did you get to know about change?
Outdoor Advertisement / Newspaper Advertisement / Radio / TV / Family & Friends /
Others (specify)
11. What kind of products do you prefer to purchase at Big Bazaar?
Food Items & Grocery / Fashion & Clothing / Home appliance & Décor / Luggage / Toy &
Stationary / Electronics / Accessories
12. How often you visit Big Bazaar?
Weekly / Fortnight / Monthly / Occasionally
93
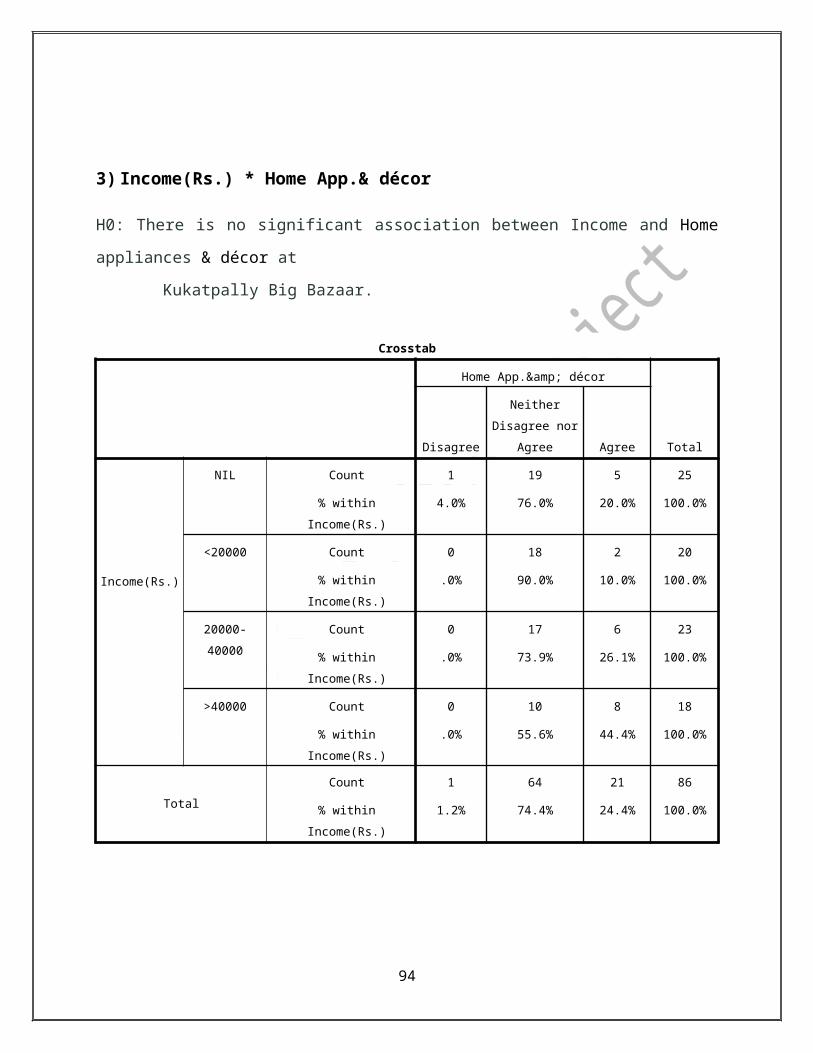
13. Are you satisfied with the offers provided?
(SD = Strongly Disagree, D = Disagree, N = neither Disagree nor Agree, A= Agree,
SA= Strongly Agree)
Items SD D N A SA
Food Items / Grocery
Fashion & Clothing
Home appliances & décor
Luggage
Toys & Stationary
Electronics
Accessories
14. Where do you prefer to shop Food Items / Grocery?
Big Bazaar / More (Mega mart) / D-Mart / Others (specify)
15. Do you like our Ambience and Services?
(SD = Strongly Disagree, D = Disagree, N = neither Disagree nor Agree, A= Agree,
SA= Strongly Agree)
SD D N A SA
16. Do you have any Suggestions?
94
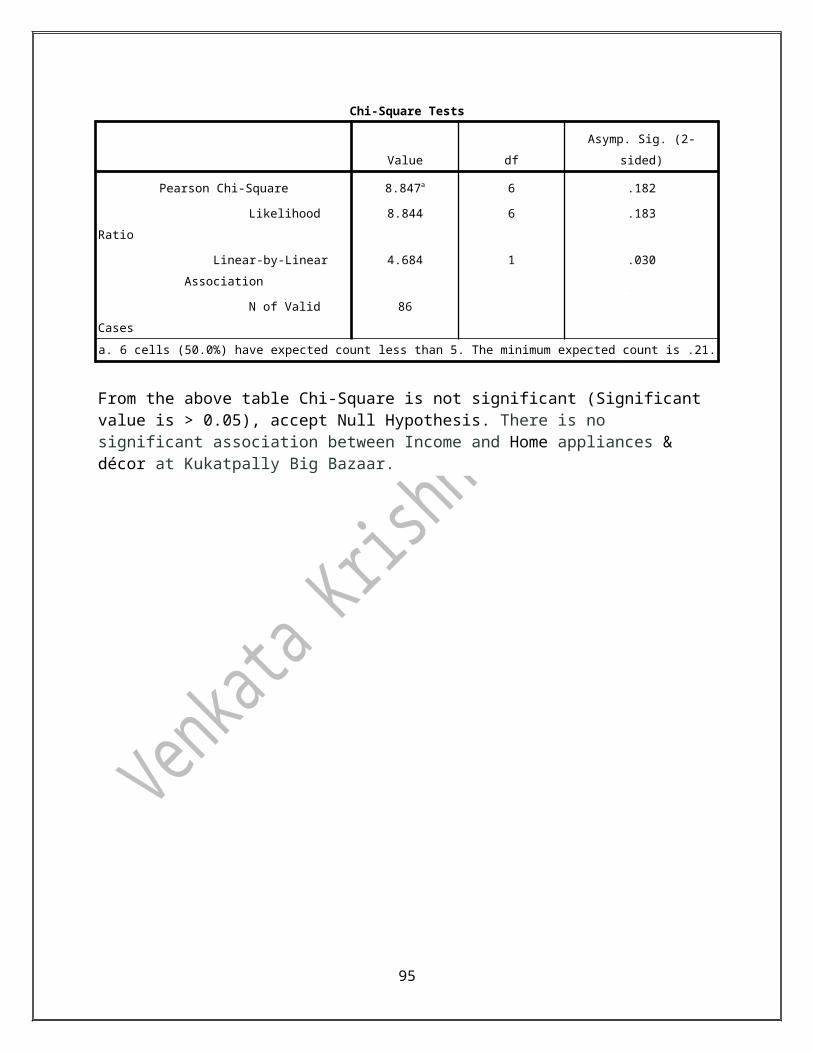
BibliographyText books:
Belch (1993): Introduction To Advertising And Promotion: An Integrated Marketing Communications Perspective; Second Edition, Irwin Publications.
Engel J.F, Warshaw, M.R and Kinnear T.C (1991), Promotional Strategy - Managing the Marketing Communications Process ; Seventh Edition, Irwin.
Kotler P (1995): Marketing Management: Analysis, Planning, Implementation and Control. Seventh
Lambin K (1975): "What is The Real Impact of Advertising?" Harvard Business Review, May - June 1975.
Werner Reinartz , Peter Saffert (2013) : “Creativity in Advertising when it works and when it doesn’t” Harvard Business Review, June 2013.
Web Sites:
1. http://www.rai.net.in/
2. http://www.futuregroup.in/
3. http://www.ibef.org/industry/retail-india.aspx
4. http://en.wikipedia.org/wiki/Future_Group
5. http://www.managementparadise.com/
6. http://www.academia.edu/
95
Recommended


![[IJET V2I5P19] Authors: D. Venkata Krishna, E. Mahesh, G. Kiran, G. Sai Suchethan, G. Chandra Mouli](https://img.pdfslide.net/doc/110x75/587096461a28ab412b8b6853/ijet-v2i5p19-authors-d-venkata-krishna-e-mahesh-g-kiran-g-sai-suchethan.jpg)