HP Software Performance Tour 2013 Mauro Ferrami Business Consultant, HP Software Baveno, Italy 20-21 June

© Copyright 2012 Hewlett-Packard Development Company, L.P. The information contained herein is subject to change without notice.
Big Data analytics per le IT Operations
Mauro Ferrami Business Consultant, HP Software

© Copyright 2012 Hewlett-Packard Development Company, L.P. The information contained herein is subject to change without notice. 3
Too much DATA Need the right solutions
to quickly search and analyze
ANALYZE
Being able to prevent or resolve issues quickly
Challenges for IT
UNKNOWN issues Don’t know what new
issues they might encounter
DETERMINE
KNOWN issues Need to be able to
monitor, prevent and resolve
PREVENT, RESOLVE
LOGS

© Copyright 2012 Hewlett-Packard Development Company, L.P. The information contained herein is subject to change without notice.
“Next-generation analytics is driving new ways of organizations to make decisions. This trend is … about using pattern recognition to optimize, simulate, and predict” - PC Magazine
“By 2016, 20% of Global 2000 enterprises will have an IT operations analytics architecture in place, up from less than 1% today” - Gartner
“Predictive analytics is emerging as a game-changer. It helps answer ‘What's next?’ and ‘What should we do about it?’“ - Forbes.com
© Copyright 2012 Hewlett-Packard Development Company, L.P. The information contained herein is subject to change without notice. 5
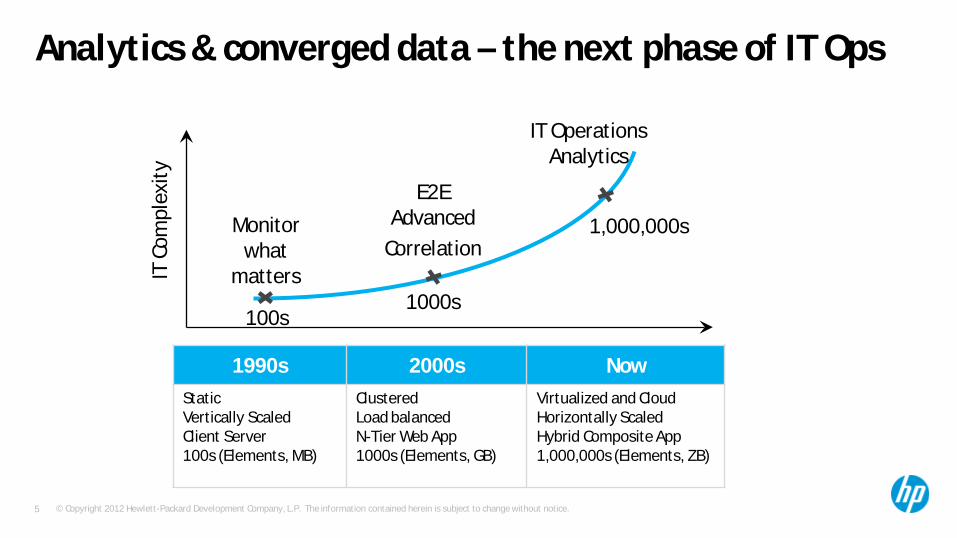
Analytics & converged data – the next phase of IT Ops
1990s 2000s Now
Static Vertically Scaled Client Server 100s (Elements, MB)
Clustered Load balanced N-Tier Web App 1000s (Elements, GB)
Virtualized and Cloud Horizontally Scaled Hybrid Composite App 1,000,000s (Elements, ZB)
IT C
ompl
exit
y
Monitor what
matters
E2E Advanced
Correlation
IT Operations Analytics
100s 1000s
1,000,000s

© Copyright 2012 Hewlett-Packard Development Company, L.P. The information contained herein is subject to change without notice. 6
Analytics & converged data – the next phase of IT Ops
1990s 2000s Now
Static Vertically Scaled Client Server 100s (Elements, MB)
Clustered Load balanced N-Tier Web App 1000s (Elements, GB)
Virtualized and Cloud Horizontally Scaled Hybrid Composite App 1,000,000s (Elements, ZB)
IT C
ompl
exit
y
HP OM
HP BAC
HP OMi
HP Operations Analytics
100s 1000s
1,000,000s

© Copyright 2012 Hewlett-Packard Development Company, L.P. The information contained herein is subject to change without notice. 7
Featuring the Run Time Service Model
Ensure optimal IT performance and availability…in a dynamic world
HP Business Service Management
Business Service Management
Forrester &
Gartner Leader Ops Analytics the
next big thing! Unique RTSM
engine Patented Analytics:
IT’s crystal ball Huge Installed
Base
Operations Intelligence Actionable insight from advanced analytics
Comprehensive visibility and monitoring of hybrid IT
Infrastructure Management ●●
Consolidated management, accelerated root cause analysis
Operations Bridge
End to end composite application performance management
Application Management

© Copyright 2012 Hewlett-Packard Development Company, L.P. The information contained herein is subject to change without notice. 8
Big Data Monitoring Cockpit - OMi Management Packs
Hadoop Distributed storage &
application processing
Vertica Interactive real-time
analytics
Oracle Relational Database for enterprise applications
Infrastructure System, OS, Virtual OS,
Cluster
Visibility into your entire big data infrastructure – from infrastructure to applications
Storage, Network, Servers, OS, Hypervisors, middleware, databases, Application Servers and Big data technologies
OMi
Run Time Service Model
Data Collection
Availability monitoring
Performance monitoring
Event Correlation
Real time graphs
Trend Reporting
© Copyright 2012 Hewlett-Packard Development Company, L.P. The information contained herein is subject to change without notice. 9
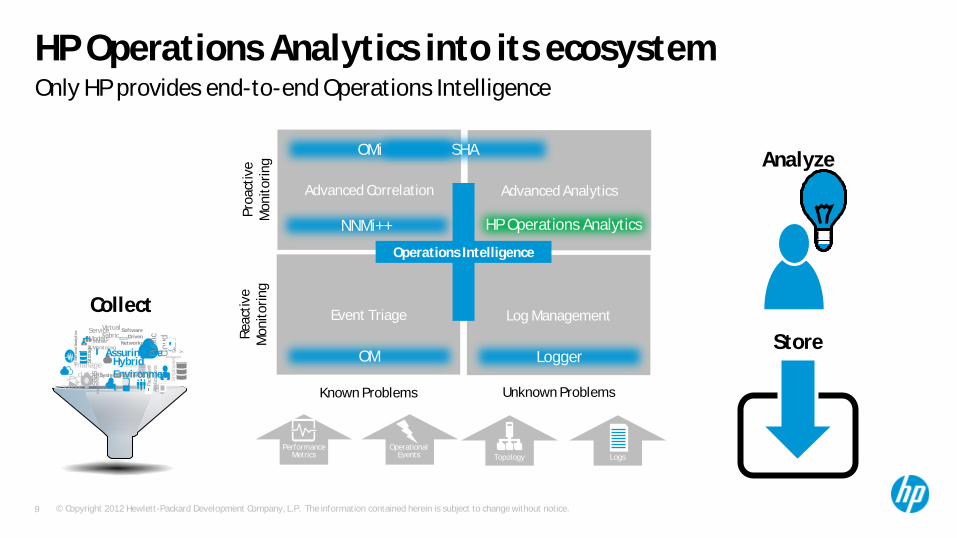
HP Operations Analytics into its ecosystem
Unknown Problems Known Problems
Event Triage Log Management
Rea
ctiv
e M
onit
orin
g
Advanced Analytics Advanced Correlation
Proa
ctiv
e M
onit
orin
g
Topology Operational
Events Performance
Metrics Logs
Analyze
Collect
managed cloud
trad
itio
nal d
c
saas
St
orag
e
App
●●
Software Driven
Networks
in-house custom apps
Assuring the Hybrid Environment Pa
ckag
ed
App
licat
ions
suppliers
Publ
ic
Clou
d
private cloud
Empl
oyee
s
IT M
etri
cs/A
naly
tics
Mobile Monitoring
Secu
rit
y
Virtual Fabric
Service Models
Systems Monitoring
Store
Only HP provides end-to-end Operations Intelligence
Operations Intelligence
OM Logger
SHA OMi
NNMi++ HP Operations Analytics

© Copyright 2012 Hewlett-Packard Development Company, L.P. The information contained herein is subject to change without notice. 10
Advanced analytics for IT Operations
HP Operations Analytics - Overview
Operations Analytics Platform (embedded Vertica)
HP Software
Application Mobile app Network Storage Cloud System
Guided Troubleshooting
HP Operations Analytics
Visual Analytics IT Search
Topology Operational
Events Performance
Metrics Logs
HP & Community Apps
3rd party
Data Collection

© Copyright 2012 Hewlett-Packard Development Company, L.P. The information contained herein is subject to change without notice. 11
IT Search Search for metrics, events, topology, and logs
Customer Problem IT Ops Data is so large and varied that Operations teams have difficulty searching through it to find information they need
User specified IT search context
Search Results. One or more of
• Metrics
• Events
• Topology
• Logs
HP Solution Search language and other search tools to provide search across metrics, events, topology, and log data of IT Ops
HP Differentiation Powerful and simple analytics query language to simplify search across all IT Ops Data (metrics, events, topology, and logs)

© Copyright 2012 Hewlett-Packard Development Company, L.P. The information contained herein is subject to change without notice. 12
Guided Troubleshooting Guiding user to relevant data for effective troubleshooting of complex problems
Customer Problem Operator has an unknown problem and doesn’t have the knowledge to diagnose it.
Context Pertinent Logs and Events
Analyzed and Context Pertinent
Metrics
User Entered Problem Context
Time context connects the
views
HP Solution Guided troubleshooting experience that provides the operator with pertinent metrics, event, topology, and log data based on context.
HP Differentiation Context driven guidance, dynamic dashboards that populate automatically based on problem context.

© Copyright 2012 Hewlett-Packard Development Company, L.P. The information contained herein is subject to change without notice. 13
Visual Analytics Visual insights to understand data patterns and relationships
Customer Problem Data volumes and complexity mean actionable insight is hard to find.
Dynamic Dashboard to build what you
want to see
Save Context for reuse and share
with others
Visualizations that let you “see ”
patterns in data
HP Solution Visual analytics that leverage Human Visual Perception for deriving patterns and trends from images, and providing actionable insight.
HP Differentiation Compelling visual presentation of IT Ops Big Data to rapidly create actionable insight. Dynamic, on demand dashboards. Saveable and shareable contexts.

© Copyright 2012 Hewlett-Packard Development Company, L.P. The information contained herein is subject to change without notice. 14
HP Operations Analytics provides actionable intelligence
Guided Troubleshooting Visual Analytics IT Search
Reduce Escalations Reduce Downtime
Faster Triage Visibility to non-Ops
Boost Collaboration Improve SLAs Faster

© Copyright 2012 Hewlett-Packard Development Company, L.P. The information contained herein is subject to change without notice. 15
Dynamic model driven behavioural learning and predictive analytics
Being Predictive : HP Service Health Analyzer
Collects Data Creates Baselines
Detects Anomalies Sends Event Investigate
Remediate
• Adaptive Baseline – detect metrics seasonality, trend and create dynamic baselines
• Topology Analysis – correlate metrics of related CIs across domains
• Temporal Analysis – differentiate between spikes and real anomalies
• Historical Analysis – compare with similar anomalies from the past
• Statistical Learning – learn normal system behavior and suppress noise

© Copyright 2012 Hewlett-Packard Development Company, L.P. The information contained herein is subject to change without notice. 16
Why HP Operations Analytics Advantage Benefit
Collect Collect anything from anywhere Comprehensive breadth & depth of collection
Store Store big data through high compression ratio, normalize and categorize data
Reduced cost of storing logs and unify machine data
Analyze Search through big data in seconds through a text-based searching
No need of domain expert to investigate deep into logs and events
Consolidate Single view into IT service health from metrics, 3rd party monitoring, logs and machine data
Reduce time to repair, resolve IT issues quickly and improve service levels
Correlate Industry leading correlation of all IT events based on a dynamic service model
Determine business impact and root cause of an IT issue
Modular Best price to performance ratio in the market with low TCO
Piece of mind through automated & comprehensive continuous monitoring
?

© Copyright 2012 Hewlett-Packard Development Company, L.P. The information contained herein is subject to change without notice.
Thank you
Recommended