Big Data Meets Infosec Visualiza4on
Forensics Challenge 10 Honeynet.org
Challenge
• Design and build a visualiza4on that describes the aAacks that were analyzed in FC5.
• Use the three prize winners’ solu4ons as references and to give you a head start on the data analysis.
• Use the FC5 dataset to create your FC10 visualiza4on.
Solu4on
• 4 Cloudera CDH3 Nodes • Containing HUE and Hive • Created “auth.log” table (Hive data parser) • Used exis4ng Apache log (Hive parser) • Imported FC5 log data to Hadoop Hive • Queried data and stored output to files • Used csv files for visualiza4ons
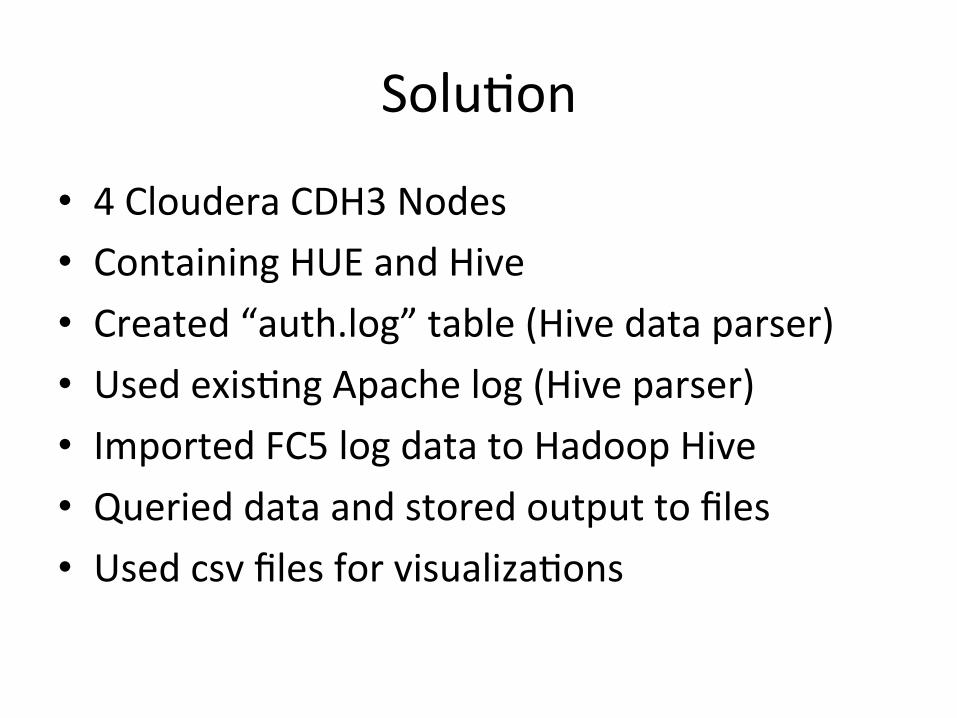
Hadoop
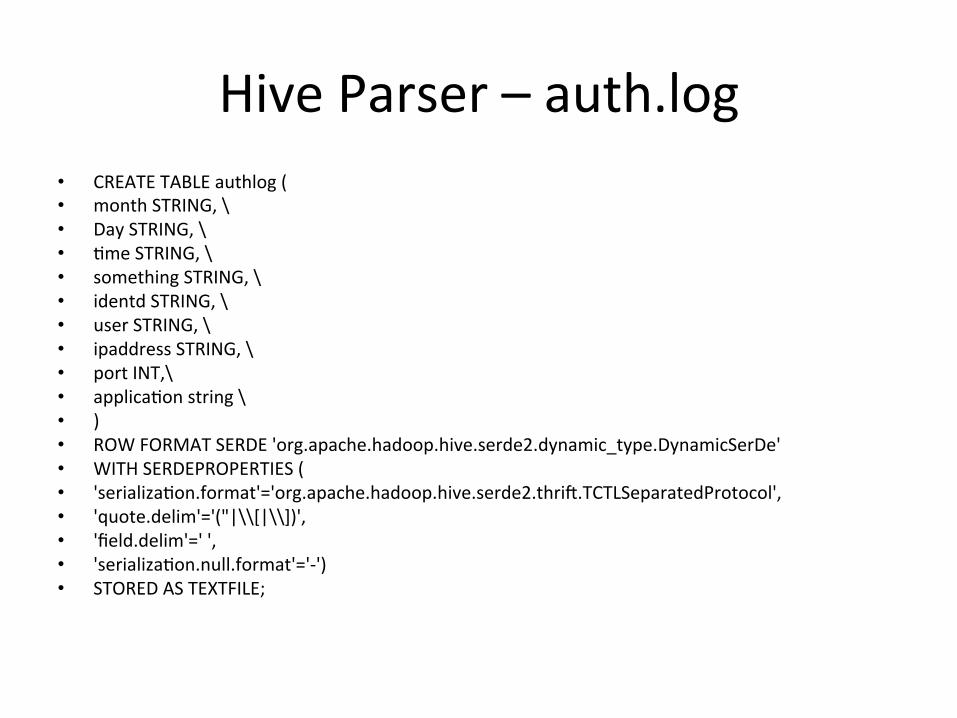
Hive Parser – auth.log • CREATE TABLE authlog ( • month STRING, \ • Day STRING, \ • 4me STRING, \ • something STRING, \ • identd STRING, \ • user STRING, \ • ipaddress STRING, \ • port INT,\ • applica4on string \ • ) • ROW FORMAT SERDE 'org.apache.hadoop.hive.serde2.dynamic_type.DynamicSerDe' • WITH SERDEPROPERTIES ( • 'serializa4on.format'='org.apache.hadoop.hive.serde2.thrid.TCTLSeparatedProtocol', • 'quote.delim'='("|\\[|\\])', • 'field.delim'=' ', • 'serializa4on.null.format'='-‐') • STORED AS TEXTFILE;
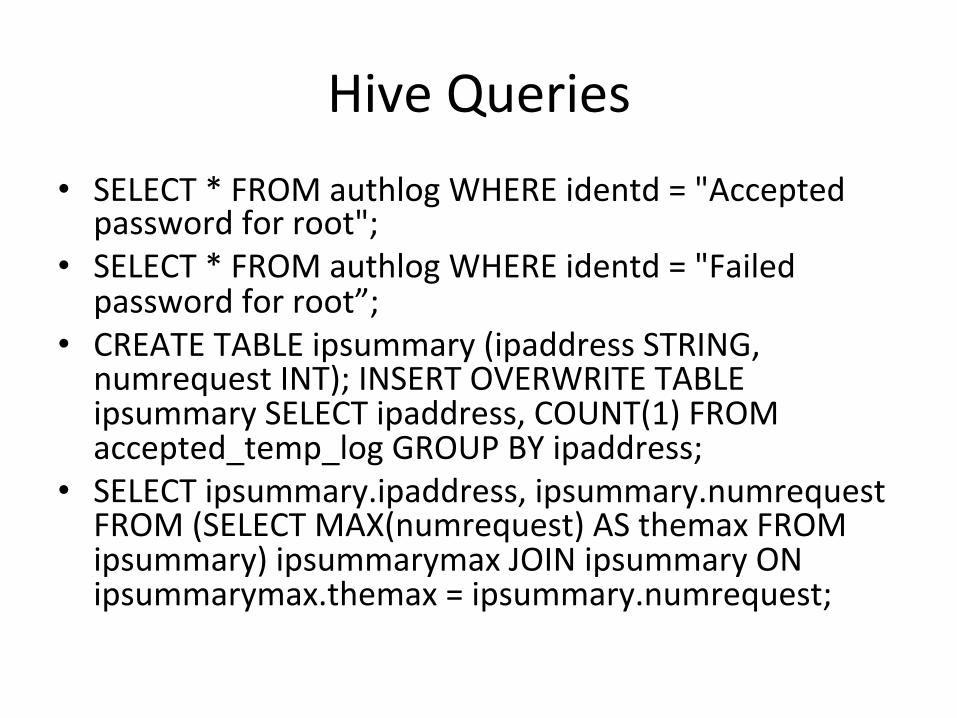
Hive Queries • SELECT * FROM authlog WHERE identd = "Accepted password for root";
• SELECT * FROM authlog WHERE identd = "Failed password for root”;
• CREATE TABLE ipsummary (ipaddress STRING, numrequest INT); INSERT OVERWRITE TABLE ipsummary SELECT ipaddress, COUNT(1) FROM accepted_temp_log GROUP BY ipaddress;
• SELECT ipsummary.ipaddress, ipsummary.numrequest FROM (SELECT MAX(numrequest) AS themax FROM ipsummary) ipsummarymax JOIN ipsummary ON ipsummarymax.themax = ipsummary.numrequest;
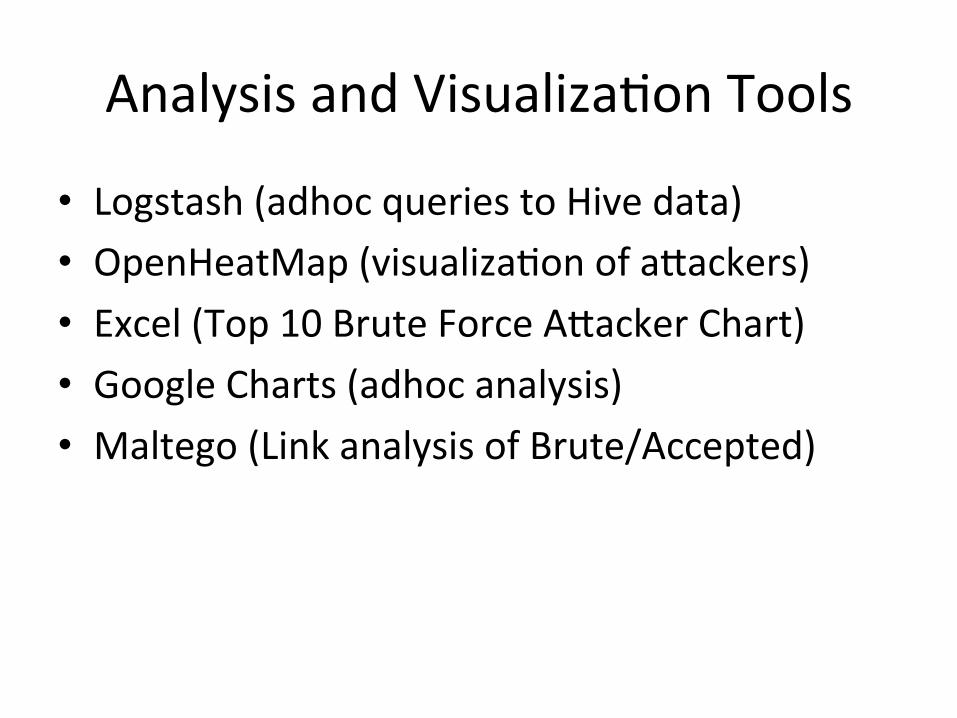
Analysis and Visualiza4on Tools
• Logstash (adhoc queries to Hive data) • OpenHeatMap (visualiza4on of aAackers) • Excel (Top 10 Brute Force AAacker Chart) • Google Charts (adhoc analysis) • Maltego (Link analysis of Brute/Accepted)

Brute Force Report World Report
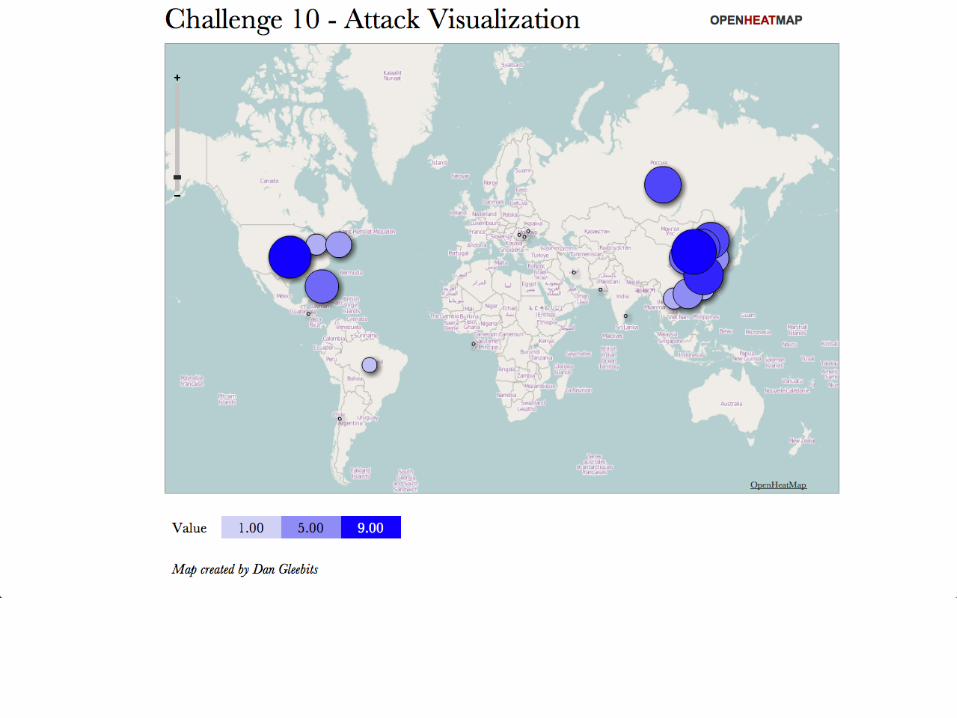
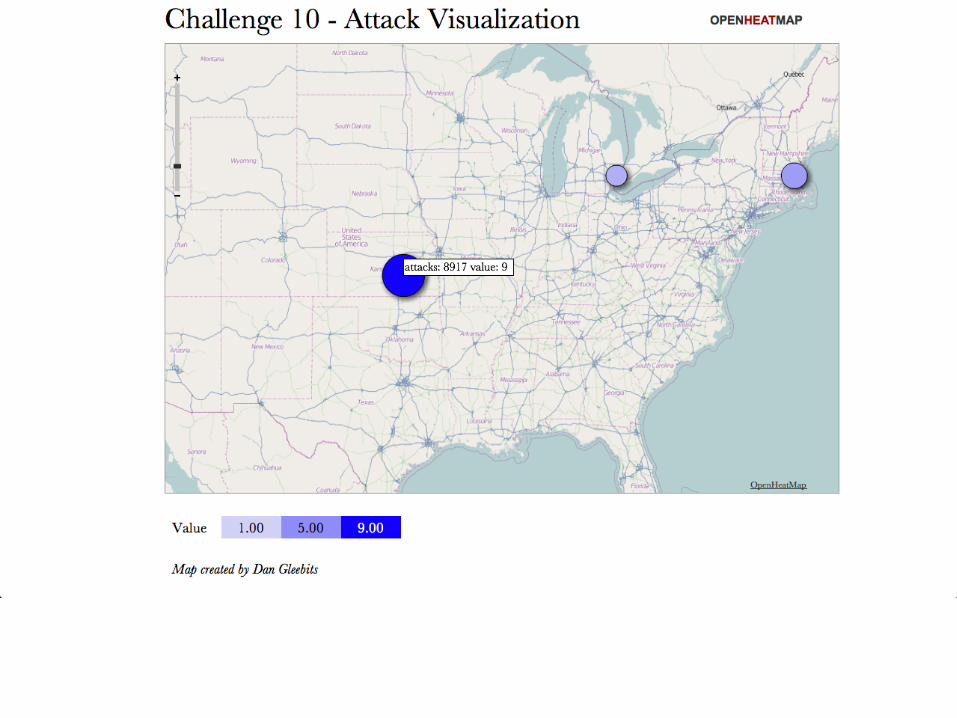
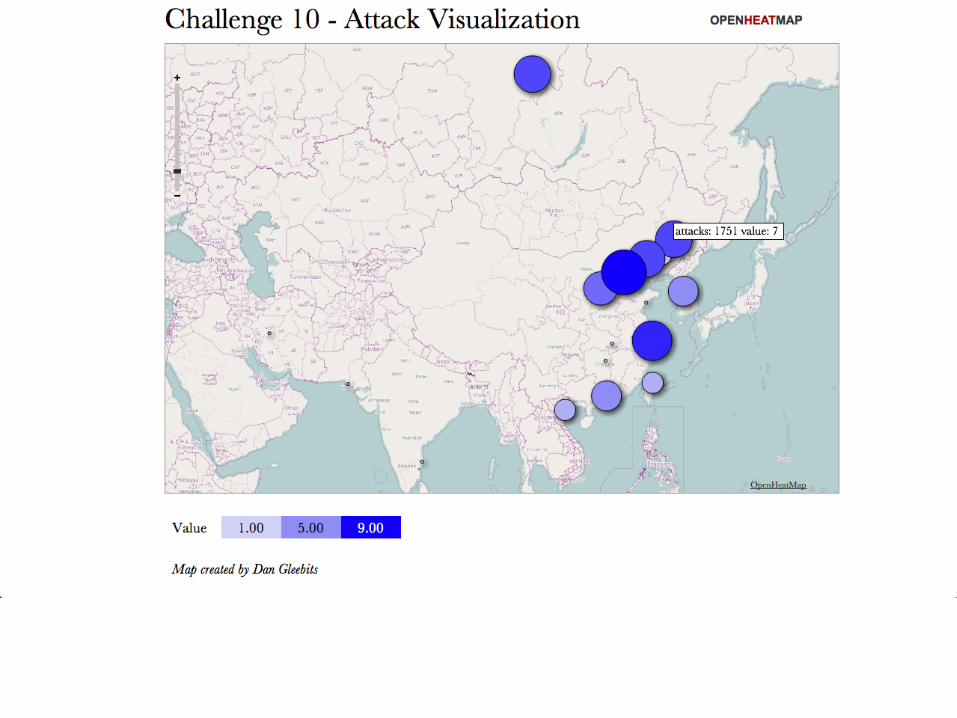

Link to Open Heat Map
• hAp://www.openheatmap.com/view.html?map=SqueakersDjambiCarrosserie

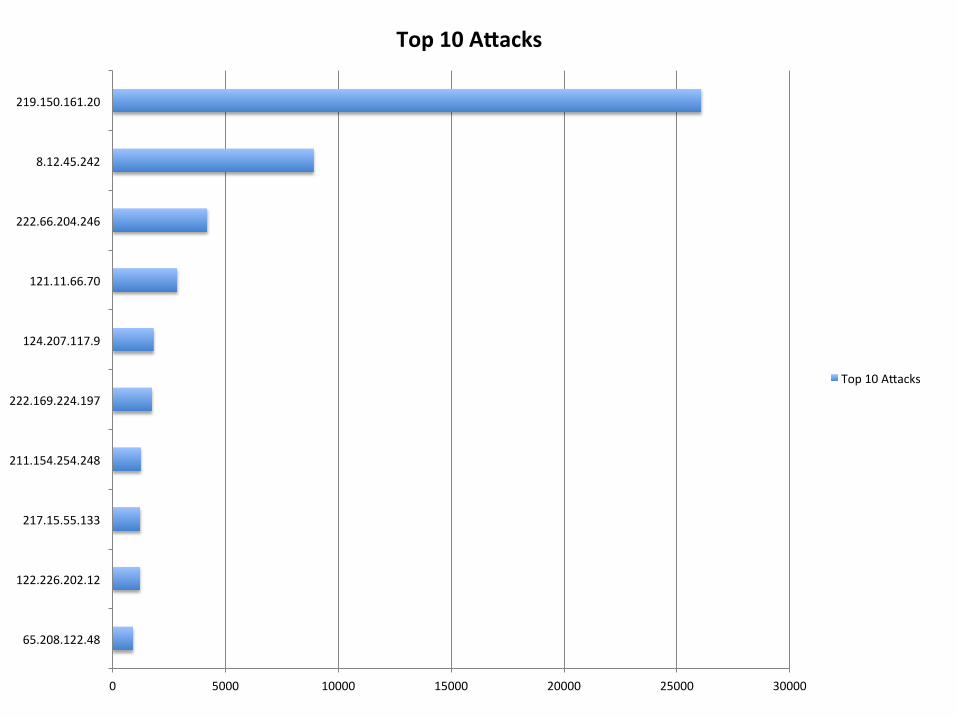
Top 10 Brute Force Report
0 5000 10000 15000 20000 25000 30000
65.208.122.48
122.226.202.12
217.15.55.133
211.154.254.248
222.169.224.197
124.207.117.9
121.11.66.70
222.66.204.246
8.12.45.242
219.150.161.20
Top 10 A(acks
Top 10 AAacks

Top 10 AAackers Word Cloud

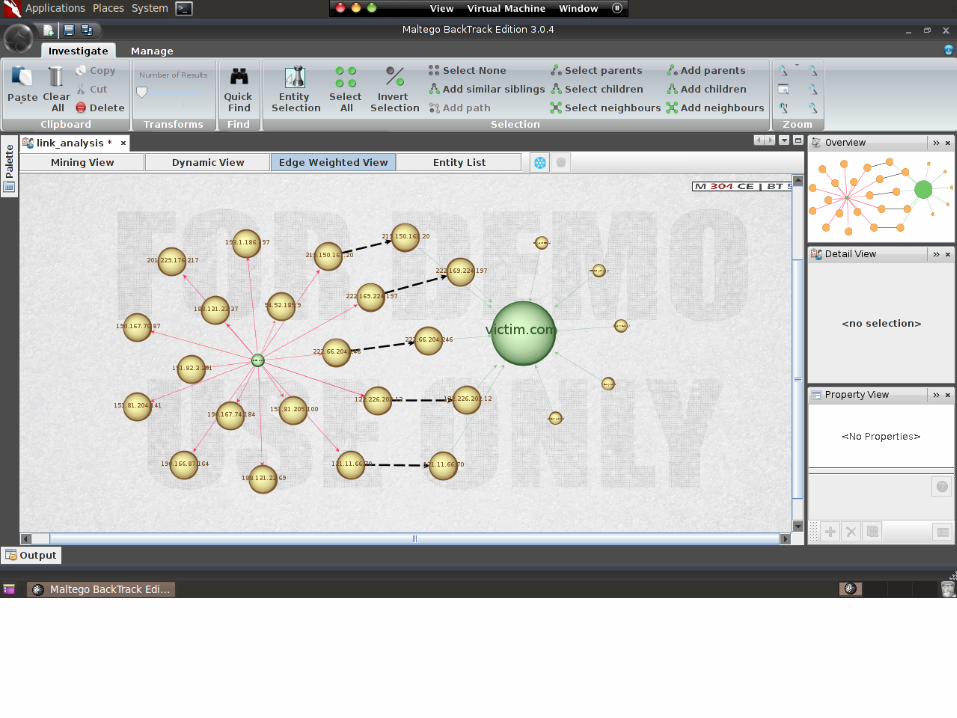
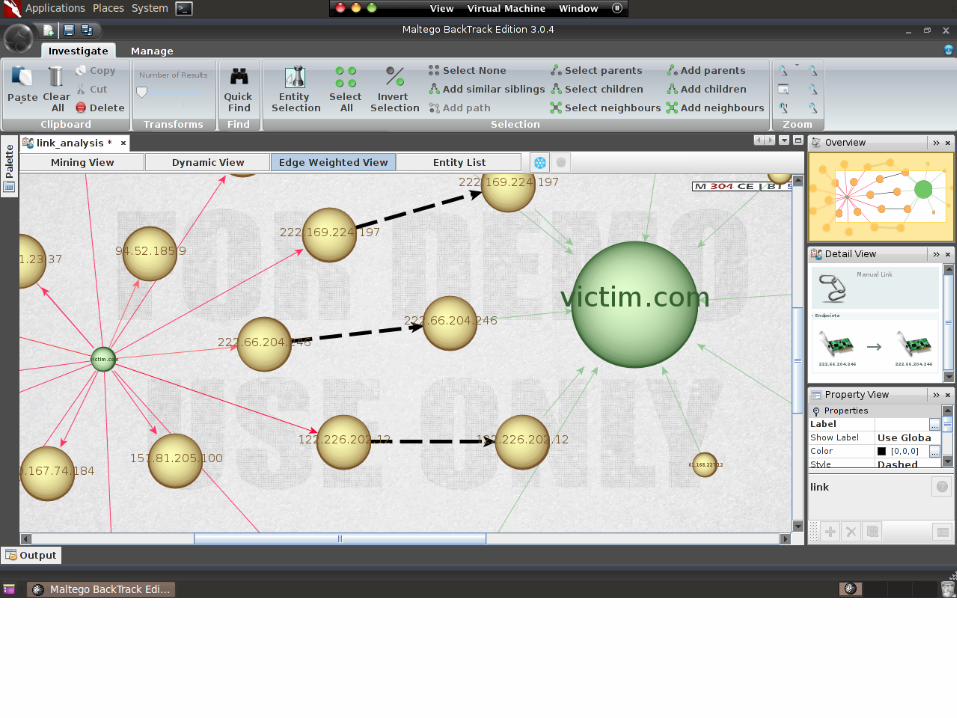
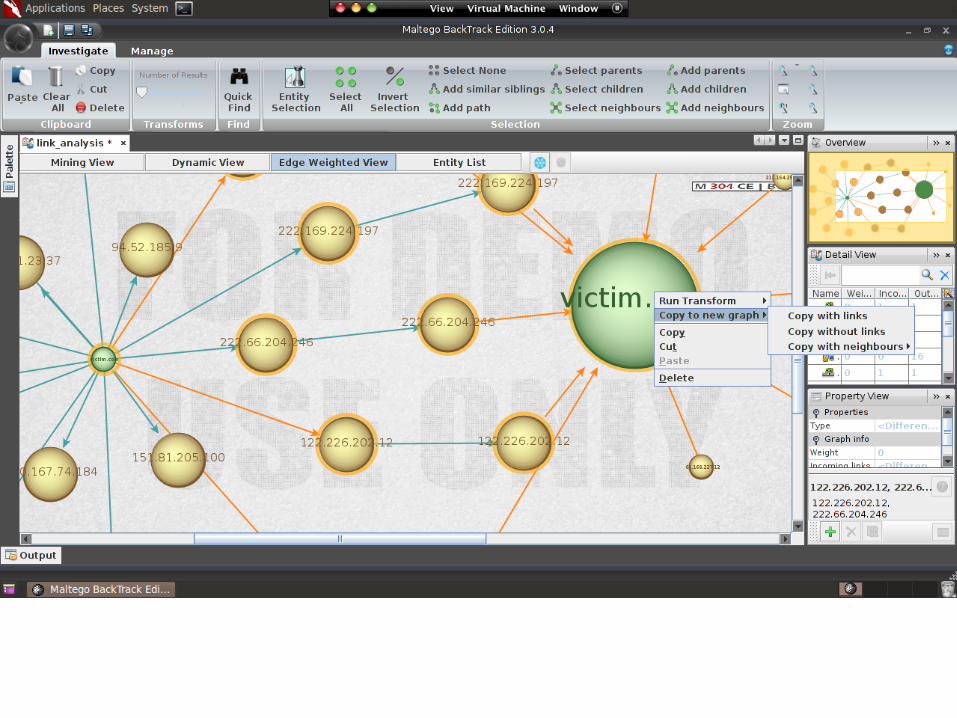
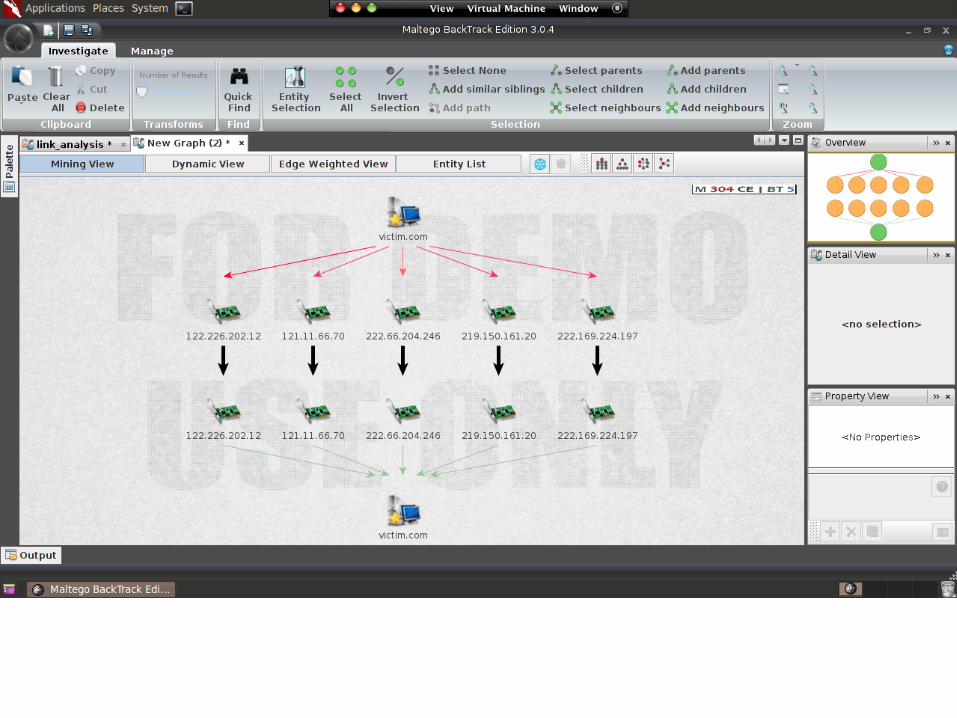
Successful login report
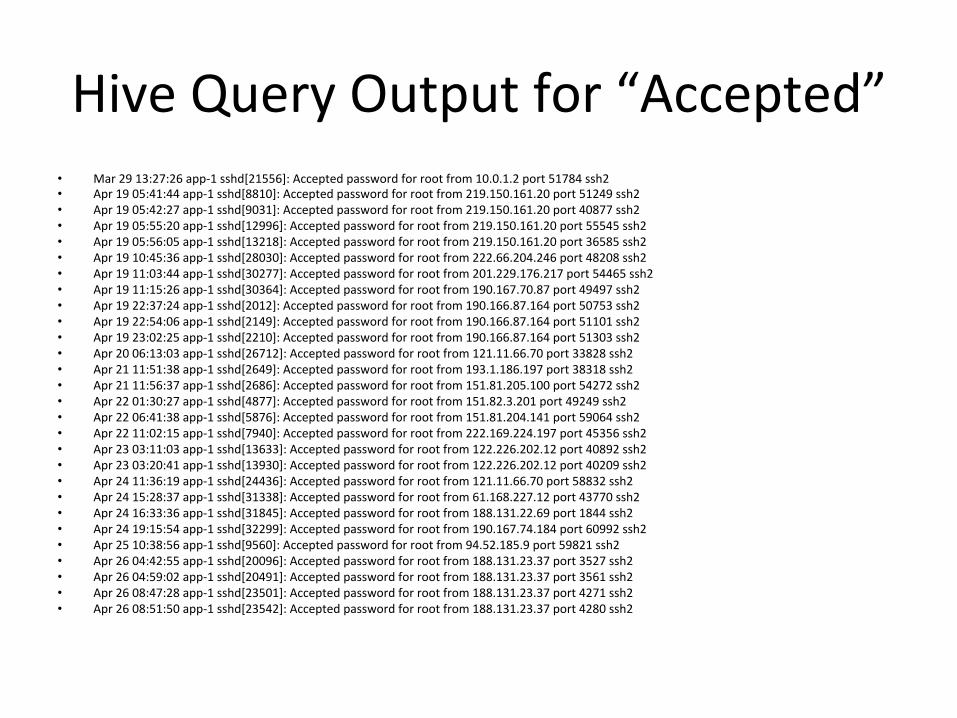
Hive Query Output for “Accepted” • Mar 29 13:27:26 app-‐1 sshd[21556]: Accepted password for root from 10.0.1.2 port 51784 ssh2 • Apr 19 05:41:44 app-‐1 sshd[8810]: Accepted password for root from 219.150.161.20 port 51249 ssh2 • Apr 19 05:42:27 app-‐1 sshd[9031]: Accepted password for root from 219.150.161.20 port 40877 ssh2 • Apr 19 05:55:20 app-‐1 sshd[12996]: Accepted password for root from 219.150.161.20 port 55545 ssh2 • Apr 19 05:56:05 app-‐1 sshd[13218]: Accepted password for root from 219.150.161.20 port 36585 ssh2 • Apr 19 10:45:36 app-‐1 sshd[28030]: Accepted password for root from 222.66.204.246 port 48208 ssh2 • Apr 19 11:03:44 app-‐1 sshd[30277]: Accepted password for root from 201.229.176.217 port 54465 ssh2 • Apr 19 11:15:26 app-‐1 sshd[30364]: Accepted password for root from 190.167.70.87 port 49497 ssh2 • Apr 19 22:37:24 app-‐1 sshd[2012]: Accepted password for root from 190.166.87.164 port 50753 ssh2 • Apr 19 22:54:06 app-‐1 sshd[2149]: Accepted password for root from 190.166.87.164 port 51101 ssh2 • Apr 19 23:02:25 app-‐1 sshd[2210]: Accepted password for root from 190.166.87.164 port 51303 ssh2 • Apr 20 06:13:03 app-‐1 sshd[26712]: Accepted password for root from 121.11.66.70 port 33828 ssh2 • Apr 21 11:51:38 app-‐1 sshd[2649]: Accepted password for root from 193.1.186.197 port 38318 ssh2 • Apr 21 11:56:37 app-‐1 sshd[2686]: Accepted password for root from 151.81.205.100 port 54272 ssh2 • Apr 22 01:30:27 app-‐1 sshd[4877]: Accepted password for root from 151.82.3.201 port 49249 ssh2 • Apr 22 06:41:38 app-‐1 sshd[5876]: Accepted password for root from 151.81.204.141 port 59064 ssh2 • Apr 22 11:02:15 app-‐1 sshd[7940]: Accepted password for root from 222.169.224.197 port 45356 ssh2 • Apr 23 03:11:03 app-‐1 sshd[13633]: Accepted password for root from 122.226.202.12 port 40892 ssh2 • Apr 23 03:20:41 app-‐1 sshd[13930]: Accepted password for root from 122.226.202.12 port 40209 ssh2 • Apr 24 11:36:19 app-‐1 sshd[24436]: Accepted password for root from 121.11.66.70 port 58832 ssh2 • Apr 24 15:28:37 app-‐1 sshd[31338]: Accepted password for root from 61.168.227.12 port 43770 ssh2 • Apr 24 16:33:36 app-‐1 sshd[31845]: Accepted password for root from 188.131.22.69 port 1844 ssh2 • Apr 24 19:15:54 app-‐1 sshd[32299]: Accepted password for root from 190.167.74.184 port 60992 ssh2 • Apr 25 10:38:56 app-‐1 sshd[9560]: Accepted password for root from 94.52.185.9 port 59821 ssh2 • Apr 26 04:42:55 app-‐1 sshd[20096]: Accepted password for root from 188.131.23.37 port 3527 ssh2 • Apr 26 04:59:02 app-‐1 sshd[20491]: Accepted password for root from 188.131.23.37 port 3561 ssh2 • Apr 26 08:47:28 app-‐1 sshd[23501]: Accepted password for root from 188.131.23.37 port 4271 ssh2 • Apr 26 08:51:50 app-‐1 sshd[23542]: Accepted password for root from 188.131.23.37 port 4280 ssh2

Successful intrusion -‐ visualiza4on • Import Failed logins and Accepted logins csv’s into Maltego
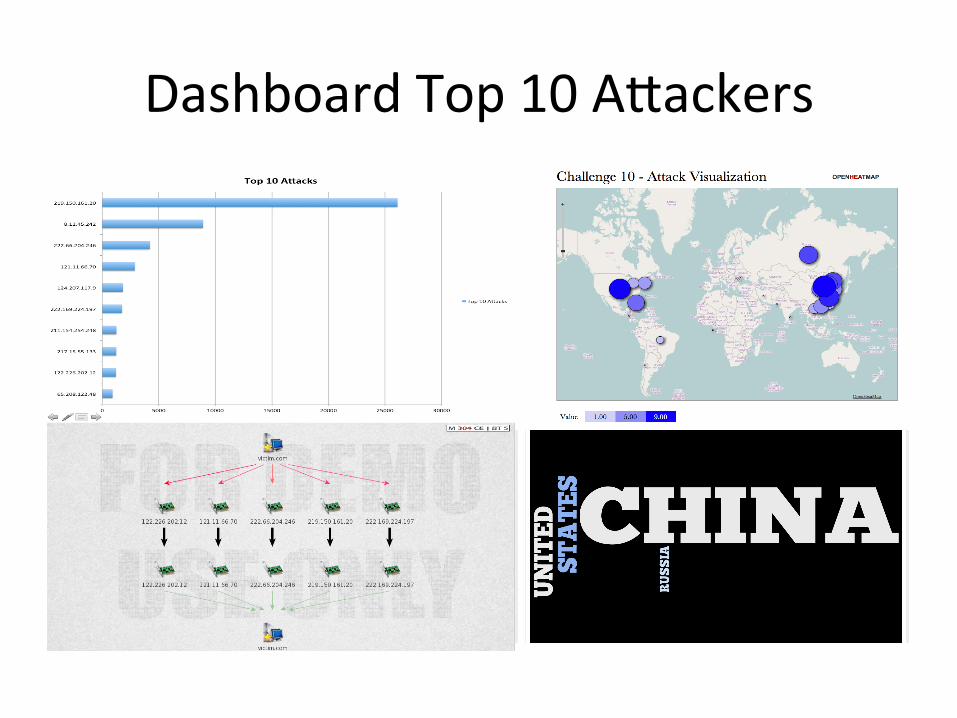
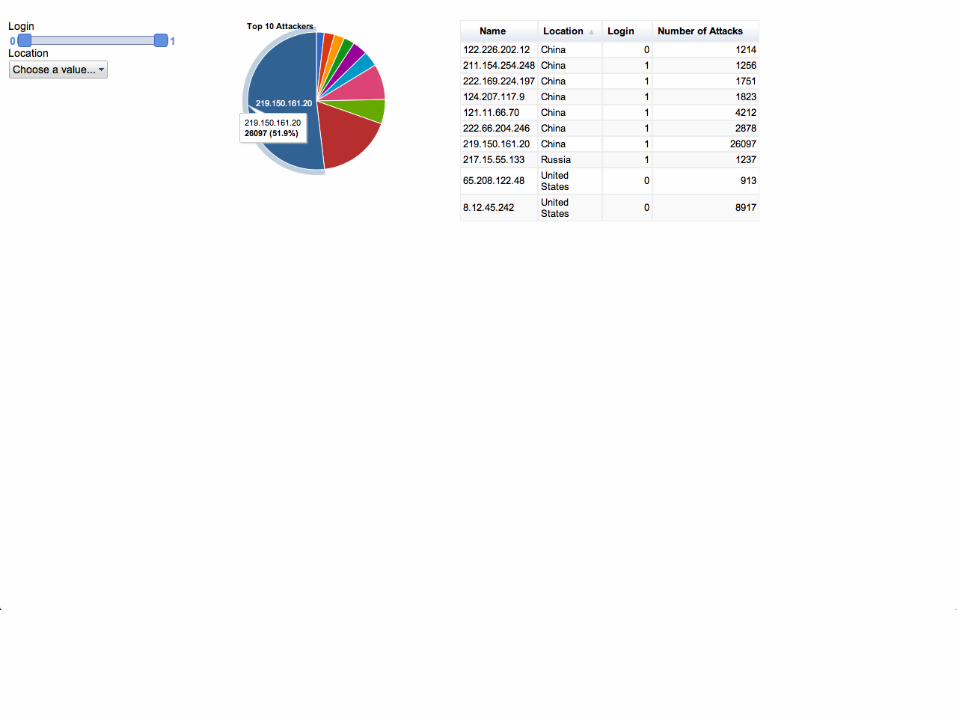
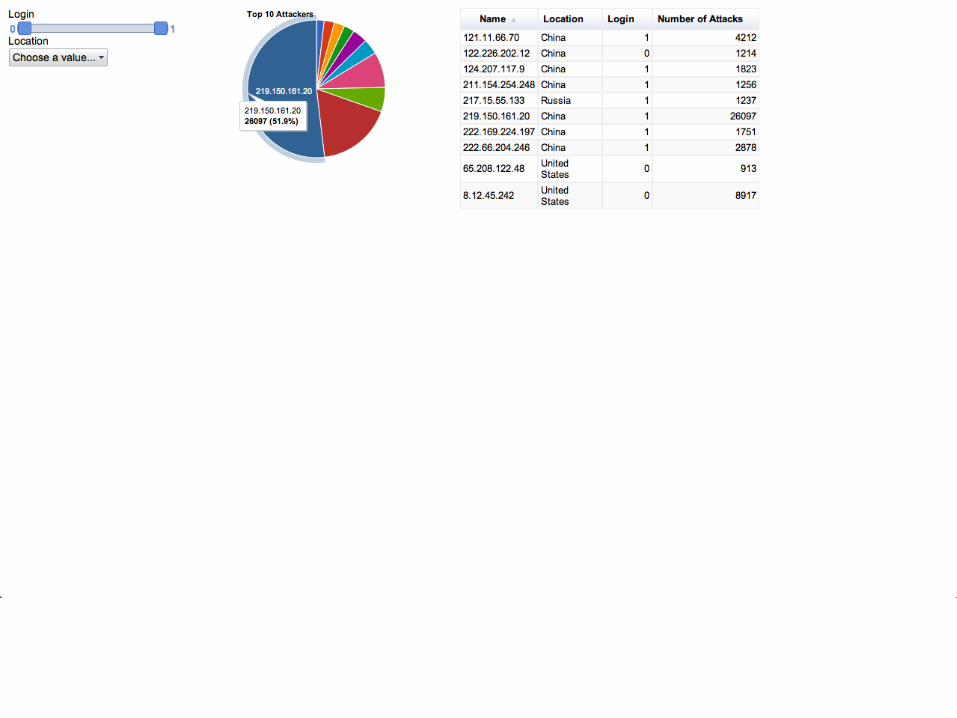
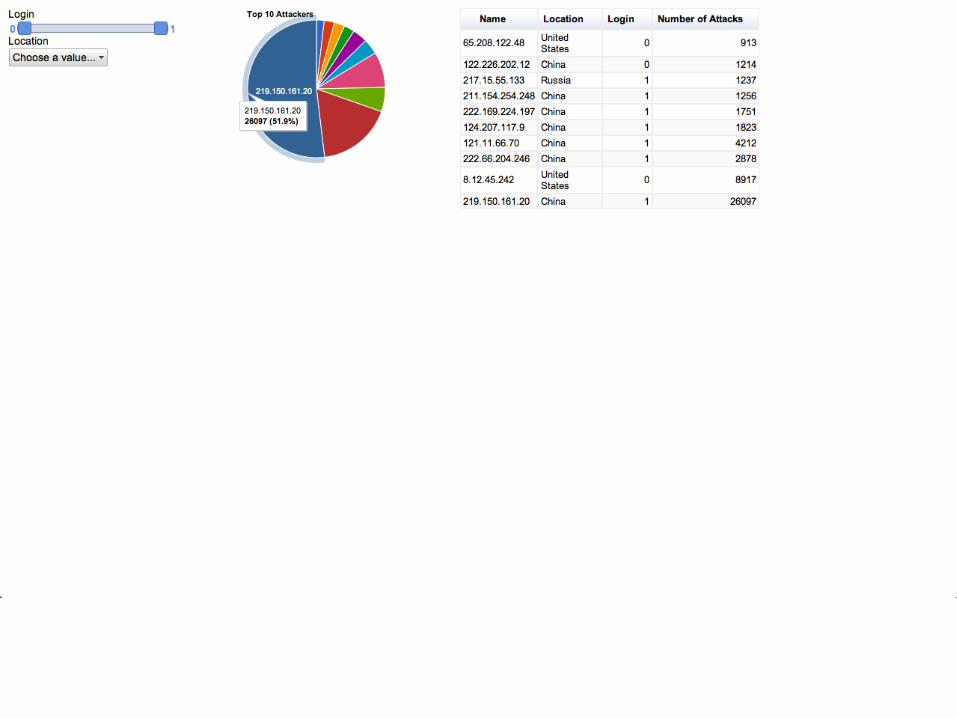
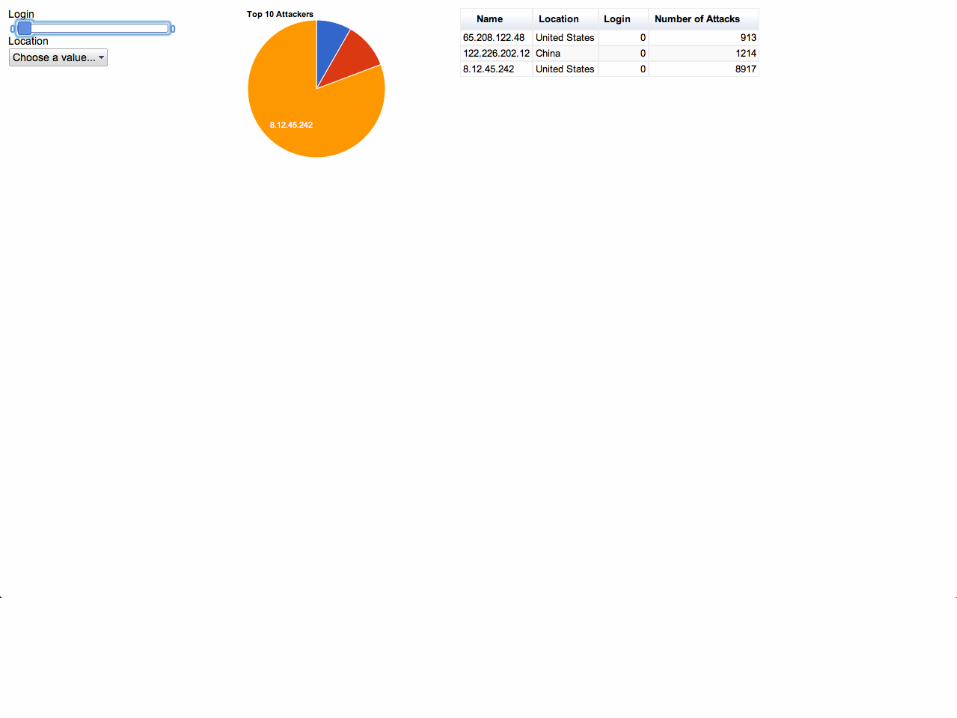
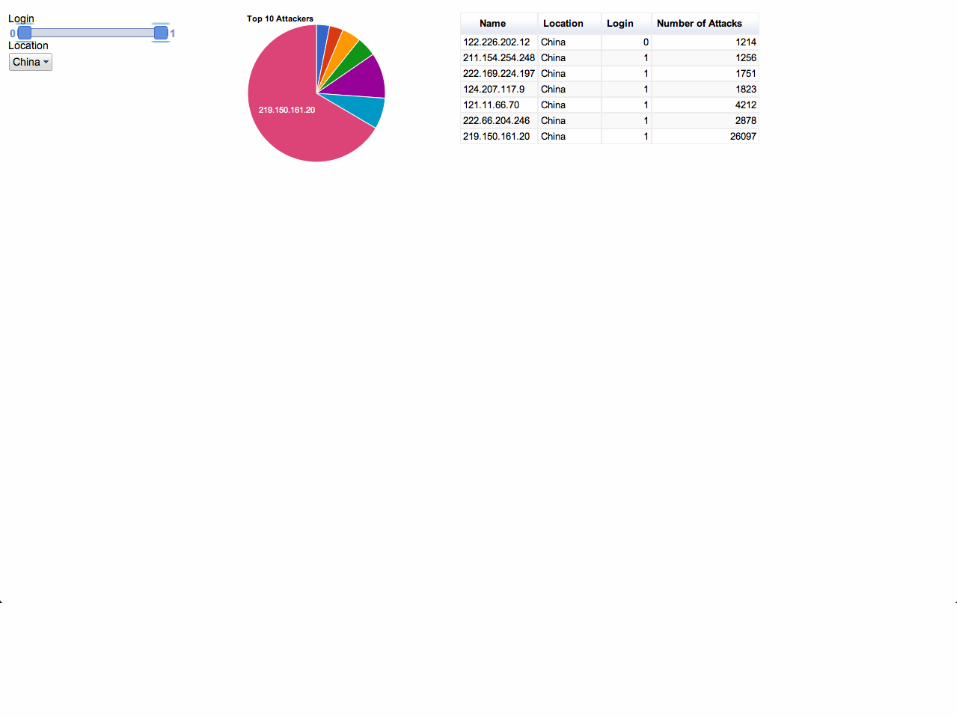
Dashboard Top 10 AAackers
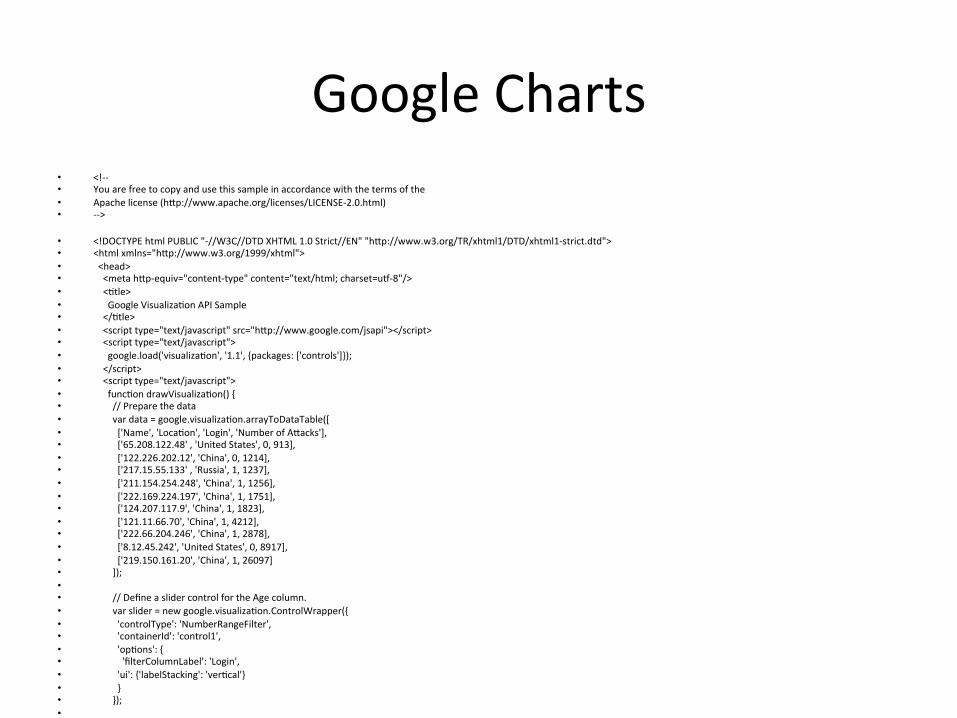
Google Charts • <!-‐-‐ • You are free to copy and use this sample in accordance with the terms of the • Apache license (hAp://www.apache.org/licenses/LICENSE-‐2.0.html) • -‐-‐>
• <!DOCTYPE html PUBLIC "-‐//W3C//DTD XHTML 1.0 Strict//EN" "hAp://www.w3.org/TR/xhtml1/DTD/xhtml1-‐strict.dtd"> • <html xmlns="hAp://www.w3.org/1999/xhtml"> • <head> • <meta hAp-‐equiv="content-‐type" content="text/html; charset=u{-‐8"/> • <4tle> • Google Visualiza4on API Sample • </4tle> • <script type="text/javascript" src="hAp://www.google.com/jsapi"></script> • <script type="text/javascript"> • google.load('visualiza4on', '1.1', {packages: ['controls']}); • </script> • <script type="text/javascript"> • func4on drawVisualiza4on() { • // Prepare the data • var data = google.visualiza4on.arrayToDataTable([ • ['Name', 'Loca4on', 'Login', 'Number of AAacks'], • ['65.208.122.48' , 'United States', 0, 913], • ['122.226.202.12', 'China', 0, 1214], • ['217.15.55.133' , 'Russia', 1, 1237], • ['211.154.254.248', 'China', 1, 1256], • ['222.169.224.197', 'China', 1, 1751], • ['124.207.117.9', 'China', 1, 1823], • ['121.11.66.70', 'China', 1, 4212], • ['222.66.204.246', 'China', 1, 2878], • ['8.12.45.242', 'United States', 0, 8917], • ['219.150.161.20', 'China', 1, 26097] • ]); • • // Define a slider control for the Age column. • var slider = new google.visualiza4on.ControlWrapper({ • 'controlType': 'NumberRangeFilter', • 'containerId': 'control1', • 'op4ons': { • 'filterColumnLabel': 'Login', • 'ui': {'labelStacking': 'ver4cal'} • } • }); • • // Define a category picker control for the Gender column • var categoryPicker = new google.visualiza4on.ControlWrapper({ • 'controlType': 'CategoryFilter', • 'containerId': 'control2', • 'op4ons': { • 'filterColumnLabel': 'Loca4on', • 'ui': { • 'labelStacking': 'ver4cal', • 'allowTyping': false, • 'allowMul4ple': false • } • } • }); • • // Define a Pie chart • var pie = new google.visualiza4on.ChartWrapper({ • 'chartType': 'PieChart', • 'containerId': 'chart1', • 'op4ons': { • 'width': 300, • 'height': 300, • 'legend': 'none', • '4tle': 'Top 10 AAackers', • 'chartArea': {'led': 15, 'top': 15, 'right': 0, 'boAom': 0}, • 'pieSliceText': 'label' • }, • // Instruct the piechart to use colums 0 (Name) and 3 (Donuts Eaten) • // from the 'data' DataTable. • 'view': {'columns': [0, 3]} • }); • • // Define a table • var table = new google.visualiza4on.ChartWrapper({ • 'chartType': 'Table', • 'containerId': 'chart2', • 'op4ons': { • 'width': '400px' • } • }); • • // Create a dashboard • new google.visualiza4on.Dashboard(document.getElementById('dashboard')). • // Establish bindings, declaring the both the slider and the category • // picker will drive both charts. • bind([slider, categoryPicker], [pie, table]). • // Draw the en4re dashboard. • draw(data); • } •
• google.setOnLoadCallback(drawVisualiza4on); • </script> • </head> • <body style="font-‐family: Arial;border: 0 none;"> • <div id="dashboard"> • <table> • <tr style='ver4cal-‐align: top'> • <td style='width: 300px; font-‐size: 0.9em;'> • <div id="control1"></div> • <div id="control2"></div> • <div id="control3"></div> • </td> • <td style='width: 700px'> • <div style="float: led;" id="chart1"></div> • <div style="float: led;" id="chart2"></div> • <div style="float: led;" id="chart3"></div> • </td> • </tr> • </table> • </div> • </body> • </html> • �

• // Define a category picker control for the Gender column • var categoryPicker = new google.visualiza4on.ControlWrapper({ • 'controlType': 'CategoryFilter', • 'containerId': 'control2', • 'op4ons': { • 'filterColumnLabel': 'Loca4on', • 'ui': { • 'labelStacking': 'ver4cal', • 'allowTyping': false, • 'allowMul4ple': false • } • } • }); • • // Define a Pie chart • var pie = new google.visualiza4on.ChartWrapper({ • 'chartType': 'PieChart', • 'containerId': 'chart1', • 'op4ons': { • 'width': 300, • 'height': 300, • 'legend': 'none', • '4tle': 'Top 10 AAackers', • 'chartArea': {'led': 15, 'top': 15, 'right': 0, 'boAom': 0}, • 'pieSliceText': 'label' • }, • // Instruct the piechart to use colums 0 (Name) and 3 (Donuts Eaten) • // from the 'data' DataTable. • 'view': {'columns': [0, 3]} • }); • • // Define a table • var table = new google.visualiza4on.ChartWrapper({ • 'chartType': 'Table', • 'containerId': 'chart2', • 'op4ons': { • 'width': '400px' • } •
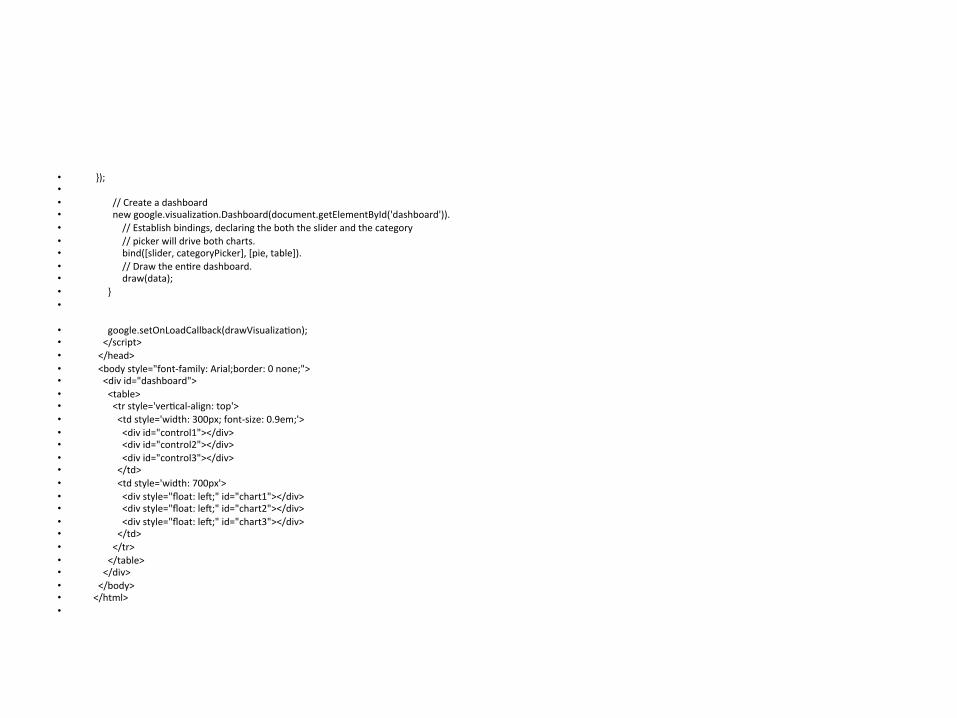
• }); • • // Create a dashboard • new google.visualiza4on.Dashboard(document.getElementById('dashboard')). • // Establish bindings, declaring the both the slider and the category • // picker will drive both charts. • bind([slider, categoryPicker], [pie, table]). • // Draw the en4re dashboard. • draw(data); • } •
• google.setOnLoadCallback(drawVisualiza4on); • </script> • </head> • <body style="font-‐family: Arial;border: 0 none;"> • <div id="dashboard"> • <table> • <tr style='ver4cal-‐align: top'> • <td style='width: 300px; font-‐size: 0.9em;'> • <div id="control1"></div> • <div id="control2"></div> • <div id="control3"></div> • </td> • <td style='width: 700px'> • <div style="float: led;" id="chart1"></div> • <div style="float: led;" id="chart2"></div> • <div style="float: led;" id="chart3"></div> • </td> • </tr> • </table> • </div> • </body> • </html> • �

Recommended