J BIOCHEM MOLECULAR TOXICOLOGYVolume 16, Number 6, 2002
Biochemical Characteristics of Purified Beef LiverNADPH–Cytochrome P450 ReductaseEmel Arinc and Haydar LelikJoint Graduate Program in Biochemistry, Department of Biological Sciences, Middle East Technical University, 06531 Ankara, Turkey;E-mail: [email protected]
Received 20 June 2002; revised 12 September 2002; accepted 5 October 2002
ABSTRACT: NADPH–cytochrome P450 reductase, anobligatory component of the cytochrome P450 depen-dent monooxygenase system, was purified to elec-trophoretic homogeneity from beef liver microsomes.The purification procedure involved the ion exchangechromatography of the detergent-solubilized micro-somes on first and second DEAE-cellulose columns,followed by 2′,5′-ADP Sepharose affinity chromatog-raphy. Further concentration of the enzyme and re-moval of Emulgen 913 and 2′-AMP were accomplishedon the final hydroxylapatite column. The enzyme waspurified 239-fold and the yield was 13.5%. Monomermolecular weight of the enzyme was estimated to be76000 ± 3000 (N = 5) by SDS-PAGE. The absolute ab-sorption spectrum of beef reductase showed two peaksat 455 and 378 nm, with a shoulder at 478 nm, charac-teristics of flavoproteins. The effects of cytochrome cconcentration, pH, and ionic strength on enzyme ac-tivity were studied. Reduction of cytochrome c withthe enzyme followed Michaelis–Menten kinetics, andthe apparent Km of the purified enzyme was foundto be 47.7 �M for cytochrome c when the enzyme ac-tivity was measured in 0.3 M potassium phosphatebuffer (pH 7.7). Stability of cytochrome c reductaseactivity was examined at 25 and 37◦C in the pres-ence and absence of 20% glycerol. The presence ofglycerol enhanced the stability of cytochrome c reduc-tase activity at both temperatures. Sheep lung micro-somal cytochrome P4502B and NADPH–cytochromeP450 reductase were also purified by the already ex-isting methods developed in our laboratory. Both beefliver and sheep lung reductases were found to be ef-fective in supporting benzphetamine and cocaine N-demethylation reactions in the reconstituted systemscontaining purified sheep lung cytochrome P4502Band synthetic lipid, phosphatidylcholine dilauroyl.C© 2002 Wiley Periodicals, Inc. J Biochem Mol Toxicol16:286–297, 2002; Published online in Wiley InterScience(www.interscience.wiley.com). DOI 10.1002/jbt.10054
Correspondence to: Emel Arinc.Contract Grant Sponsor: Turkish Academy of Sciences (TUBA).
c© 2002 Wiley Periodicals, Inc.
KEYWORDS: Cytochrome P450 Reductase; BeefLiver; Sheep Lung; Cytochrome P4502B; Kinetics;Benzphetamine; Cocaine
INTRODUCTION
NADPH–cytochrome P450 reductase (NADPH:ferrihemoprotein oxidoreductase, EC 1.6.2.4) is an inte-gral membrane flavoprotein that catalyzes the transferof electrons from NADPH to cytochrome P450 and isan essential component of the microsomal cytochromeP450 monooxygenase system. The monooxygenase sys-tem consists of NADPH–cytochrome P450 reductaseand a family of heme proteins, cytochromes P450,and is involved in oxidative metabolism of both en-dogenous and exogenous compounds [1–4]. Further-more, cytochrome P450 reductase is known to playimportant roles in the reductive metabolism of someanticancer drugs and antibiotics, as well as in lipidperoxidation and in the production of reactive oxygenspecies that can result in genotoxicity and cytotoxicity[5–8].
Functional and structural properties of cytochromeP450 reductase purified from microsomes of guinea pigliver [9], pig liver [10,11], pig kidney [10], sheep lungand liver [12,13], rat liver [14], rabbit liver [15], humanliver [16,17], and three fish species (scup liver [18], troutliver [19], and mullet liver [20]), and from a nonmam-malian species (house fly [21]) have been described indetail and some kinetic, structural, and functional dif-ferences are known. Cytochrome P450 reductase wasalso isolated from a plant species, Jerusalem artichoke,and the isolated reductase was found to be immuno-logically distinct from previously described reductases[22].
In recent years, there has been a great deal of in-terest in the study of metabolism of exogenous com-pounds such as veterinary drugs, chemical carcino-gens, antibiotics, growth factors by drug-metabolizingenzymes and formation of reactive oxygen species
286
Volume 16, Number 6, 2002 BEEF LIVER CYTOCHROME P450 REDUCTASE 287
in veterinary animals, especially in beef, cattle, andsheep. However, very little information is availableon the role of cytochrome P450 dependent monooxy-genases in drug and xenobiotic metabolism by beefliver, although beef liver has a very high nutri-tional value and is extensively consumed by hu-mans. Studies with beef have been concentrated pri-marily on the steroid biosynthesis in adrenal cor-tex where cytochrome P450 and cytochrome b5 playa significant role in the synthesis of different typesof steroids. Therefore, elucidation of the characteris-tics and activity of the beef hepatic cytochrome P450system and NADPH–cytochrome P450 reductase indrug and xenobiotic metabolism will make an im-portant contribution to a better understanding of thestructure and function of these enzymes, and theirrole in the metabolism of foreign compounds, in-cluding veterinary drugs. Different types of veteri-nary drugs and antibiotics are being used for ani-mal health in stockbreeding all over the world anda wide range of these drugs and antibiotics are me-tabolized by cytochrome P450 dependent monooxyge-nases and NADPH–cytochrome P450 reductase alone.This study was undertaken to purify amphipathic cy-tochrome P450 reductase from beef liver and charac-terize its spectral, structural, biocatalytic, and kineticproperties.
MATERIALS AND METHODS
Chemicals
Glycerol, sodium dodecyl sulfate (SDS), ethylene-diaminetetraacetic acid (EDTA), and methanol werepurchased from E. Merck, Darmstadt, Germany.Cytochrome c, DL-dithiothreitol (DTT), phenyl-methylsulfonyl fluoride (PMSF), ε-aminocaproicacid (ε-ACA), �-nicotinamide adenine dinucleotidephosphate (NADPH, reduced form), �-nicotinamideadenine dinucleotide phosphate (NADP+), L-�-phosphatidylcholine, dilauroyl (DPLC) were theproducts of Sigma, St. Louis, MI, USA. 2′,5′-ADPSepharose 4B was obtained from Pharmacia FineChemicals, Inc., Uppsala, Sweden. Hydroxylapatite(Bio-Gel HTP) was purchased from Bio-Rad Laborato-ries, Richmond, CA, USA. Emulgen 913 was a gift fromKao-Atlas Co., Ltd., Tokyo, Japan. Diethylaminoethyl(DEAE)-cellulose (DE microgranular preswollen) waspurchased from Whatman Biochemicals Ltd., Kent,England. Benzphetamine–HCl was kindly provided byDr. J. F. Stiver of UpJohn Co., USA. Cocaine–HCl waspurchased from Tarım ve Koy Isleri Bakanlıgı, ToprakMahsulleri Ofisi, Ankara-Turkiye. All other chemicalswere of the highest grade available commercially.
Preparation of Beef Liver and SheepLung Microsomes
Livers from well-bled healthy bovine (1–2 yearsold) and lungs from Akkaraman sheep (6–12 monthsold) were obtained from a local slaughterhouse(Mısırdalı Slaughterhouse Sincan, Ankara) immedi-ately after killing. Liver and lung microsomes wereprepared by differential centrifugation as describedpreviously [23] except that homogenization solutioncontained 2 mM EDTA, 0.25 mM ε-ACA, and 0.1 mMPMSF in 1.15% KCl. The washed microsomal pelletswere finally suspended in 25% glycerol containing 1mM EDTA. For each gram of liver and lung, 0.5 and0.3 mL suspensions were used, respectively. Micro-somes were gassed with nitrogen gas and stored inplastic bottles at −70◦C in deep freezer until used forpurification studies.
Purification of Beef Liver MicrosomalNADPH–Cytochrome P450 Reductase
NADPH–cytochrome P450 reductase of beef livermicrosomes was purified to apparent homogeneityfrom the detergent-solubilized microsomes by the com-bination and the refinement of methods previouslyused in this laboratory [12,13,20,24]. The purificationprocess involving two successive DEAE-cellulose col-umn and then 2′-5′-ADP Sepharose 4B column, and a fi-nal hydroxylapatite column chromatographies was re-peated six times to purify the beef reductase, with thehighest yield and specific content. All purification stepswere carried out at 0–4◦C.
Solubilization of Beef Liver Microsomes
Beef liver NADPH–cytochrome P450 reductasewas solubilized by the treatment of liver microsomeswith Emulgen 913 and sodium cholate. In a typicalpreparation, the microsomal suspension during thesolubilization contained 20% glycerol, 2 mM EDTA,0.1 mM DTT, 0.25 mM ε-ACA, 0.5 mM PMSF, 1% (v/v)Emulgen 913, 0.4% (w/v) cholate, and 6 mg/mL pro-tein in 10 mM potassium phosphate buffer (pH 7.85)(at 25◦C). A stock solution of 10% Emulgen 913 (v/v in20% glycerol) and then 10% cholate (w/v) were addeddropwise with stirring to give a final concentration of1% (v/v) Emulgen 913 and 0.4% (w/v) sodium cholateover 10 min. The mixture was stirred on a magneticstirrer in an ice bath for an additional 40 min and thencentrifuged at 87000 × g in type 35 rotor in Beckman ul-tracentrifuge for 120 min. The clear yellow supernatantwas taken. The pellet was discarded.
288 ARINC AND LELIK Volume 16, Number 6, 2002
First DEAE-Cellulose ColumnChromatography Step
The clear yellow solubilized microsomal fractionwas applied to a DEAE-cellulose column (3.0 × 34 cm)which was equilibrated with 20 mM potassium phos-phate buffer (pH 7.85) containing 20% glycerol, 2 mMEDTA, 0.1 mM DTT, 0.25 mM PMSF, 0.25 mM ε-ACA, 0.5% Emulgen 913, and 0.2% cholate (buffer I),at a flow rate of 150 mL/h. Following sample ap-plication, the column was extensively washed with2650 mL (approximately 11 column volumes) bufferI until NADH–cytochrome b5 reductase activity wascompletely eluted. During the washing of the column,cytochrome P450s and NADH–cytochrome b5 reduc-tase were eluted from the column in given order. Afterthe washing step, a 0.08 M KCl in buffer I (430 mL)was applied to the column in order to separate thecytochrome b5 from NADPH–cytochrome P450 reduc-tase. Cytochrome b5 was then eluted from the columnas a sharp peak. The major NADPH–cytochrome P450peak containing minor amounts of cytochrome b5 andcytochrome P450 was then obtained by the elution ofthe column with 0.15 M KCl in buffer I (400 mL). Furtherincreasing the KCl concentration of buffer I (340 mL) to0.3 M eluted the remaining cytochrome P450 reductase,cytochrome P450, and cytochrome b5 from the column.
Second DEAE-Cellulose ColumnChromatography Step
The fractions eluted from the first DEAE-cellulosecolumn in buffer I containing 0.15 M KCl with a highamount of NADPH–cytochrome P450 reductase activ-ity were pooled and diluted 6.25 times with buffer IIwithout potassium phosphate. Then, the diluted sam-ple was applied to a second DEAE-cellulose column(2.6 × 6 cm), previously equilibrated with buffer II(30 mM potassium phosphate buffer, pH 7.85, contain-ing 20% glycerol, 0.1 mM EDTA, 0.1 mM DTT, 0.25 mMPMSF, 0.25 mM ε-ACA, and 0.5% Emulgen 913). Af-ter sample application and washing steps, cytochromeb5 and minor amounts of cytochrome P450 reductasewere eluted from the column with 0.08 M KCl in bufferII (130 mL). The major cytochrome P450 reductase peakwas then eluted from the column by increasing theKCl concentration of buffer II (60 mL) to 0.3 M. Atthis step, cytochrome P450 reductase was concentratedabout 5.5 times.
Affinity Chromatography on 2′,5′-ADPSepharose 4B Column
The pooled cytochrome P450 reductase fractionseluted from the second DEAE-cellulose column with
0.3 M KCl in buffer II was dialyzed overnight againstbuffer III (50 mM potassium phosphate buffer, pH 7.1,containing 20% glycerol, 0.1 mM EDTA, 0.1 mM DTT,0.25 mM PMSF, 0.25 mM ε-ACA, and 0.1% Emulgen913) and then subjected to affinity chromatographyon 2′,5′-ADP Sepharose 4B column (0.7 × 6 cm), previ-ously equilibrated with buffer III. Sample was appliedto the column at a very slow rate of about 2 mL/h.Then the column was washed extensively with at least70 column volumes of 0.2 M potassium phosphate con-taining buffer III (160 mL). Almost all the impurities(cytochrome b5 and cytochrome P450) present in cy-tochrome P450 reductase fractions with minor amountsof cytochrome P450 reductase were eluted from the col-umn during sample application and washing steps. Af-ter that, seven column volumes (15.5 mL) of 20 mMbuffer III (2.5 times diluted buffer III, ε-ACA concentra-tion was kept constant at 0.25 mM) were passed throughthe same column. Then cytochrome P450 reductase waseluted from the column with approximately 60 mL of20 mM buffer III containing 2.5 mM 2′-AMP.
Hydroxylapatite ColumnChromatography Step
The pooled samples obtained from the previouscolumn were chromatographed on hydroxylapatitecolumn (1.5 × 2 cm), preequilibrated with buffer IV(20 mM potassium phosphate, pH 7.1, containing 20%glycerol, 0.1 mM EDTA, 0.1 mM DTT, 0.1 mM PMSF,0.1 mM ε-ACA, and 0.25% cholate) in order to re-move the 2′-AMP and Emulgen 913 from the sampleand concentrate the cytochrome P450 reductase. Fol-lowing sample application, the column was washedwith buffer IV (90 mL) until the absorbances of the col-umn effluents fell to zero at 280 nm which monitors thepresence of 2′-AMP and Emulgen 913 in the fractions.Then, NADPH–cytochrome P450 reductase was elutedfrom the column as a sharp peak (6.6 mL) by increasingthe potassium phosphate concentration of buffer IV to0.3 M.
Purification of Sheep Lung MicrosomalNADPH–Cytochrome P450 Reductase
NADPH–cytochrome P450 reductase was purifiedfrom sheep lung microsomes by slight modificationsof the already existing methods developed in our lab-oratory [12,24]. The purification procedure includesanion exchange chromatography of the detergent-solubilized microsomes on two successive DEAE-cellulose columns, affinity chromatography of the par-tially purified reductase on 2′,5′-ADP Sepharose 4Bcolumn, and further concentration and purification
Volume 16, Number 6, 2002 BEEF LIVER CYTOCHROME P450 REDUCTASE 289
of the reductase on a final hydroxylapatite column.During the sample application and washing stepsin first DEAE-cellulose column chromatography, frac-tions having the highest cytochrome P450 content werepooled and used for the subsequent purification of cy-tochrome P4502B.
Purification of Sheep Lung MicrosomalCytochrome P4502B
Sheep lung microsomal cytochrome P4502B waspurified according to the method of Adalı and Arinc[23] with slight modifications. The purification pro-cedure involved anion exchange chromatography ofdetergent-solubilized microsomes on an initial DEAE-cellulose column, and further purification of the par-tially purified cytochrome P4502B on first hydrox-ylapatite and second DEAE-cellulose columns. Fi-nally, cytochrome P4502B was further purified andconcentrated on a second hydroxylapatite columnchromatography.
Analytical Procedures
Protein concentration was determined according tothe method of Lowry et al. [25] using crystalline BSAas standard.
Cytochrome P450 content was measured by the de-tection of a peak around 447–452 nm when sampleswere reduced and gassed with CO on a Hitachi 220Adouble beam recording spectrophotometer using an ex-tinction coefficient of 91 mM−1 cm−1. The absorbancevalues used in calculation were the differences betweenthe absorbance values at 450 and 490 nm in the car-bon monoxide difference spectra of dithionite-reducedsamples [26].
The method described by Nishibayashi and Sato[27] was used for the determination of cytochrome b5concentrations of fractions. The concentration of cy-tochrome b5 was estimated from the initial dithionite-reduced minus oxidized difference spectrum using anextinction coefficient of 185 mM−1 cm−1 for the differ-ence in absorption between 424 and 410 nm.
The NADH–cytochrome b5 reductase activity infractions was measured spectrophotometrically ac-cording to the procedure reported by Strittmatter andVelick [28] in which ferricyanide acted as an electron ac-ceptor. The assay was based upon the measurement ofreduction of potassium ferricyanide at 420 nm. The en-zyme activity was calculated using the extinction coeffi-cient of 1.02 mM−1 cm−1 for the difference in absorbancebetween reduced minus oxidized form of ferricyanideat 420 nm.
NADPH-dependent cytochrome P450 reductaseactivity was measured spectrophotometrically by the
method of Masters et al. [29]. The assay depends on themeasurement of the rate of reduction of the artificialsubstrate, cytochrome c, at 550 nm. The assay mixturecontained 0.3 M potassium phosphate buffer (pH 7.7)containing 80 nmol cytochrome c, 130 nmol NADPH,and appropriate amounts of enzyme preparation in afinal volume of 0.8 mL. The enzyme activities were cal-culated using an extinction coefficient of 19.6 mM−1
cm−1 for the difference in absorbance between the re-duced minus oxidized form of cytochrome c at 550 nmas described by Yonetani [30]. One unit of reductase isdefined as the amount of enzyme catalyzing the reduc-tion of 1 �mol of cytochrome c per minute under thedescribed conditions, unless otherwise indicated.
The biocatalytic activities of the purified beef liverand sheep lung reductases were determined accordingto their ability to reconstitute N-demethylation reac-tions of benzphetamine and cocaine in the reconstitutedsystems containing purified sheep lung cytochromeP4502B and synthetic lipid. The method described byNash [31] and modified by Cochin and Axelrod [32]was used for the determination of benzphetamine andcocaine N-demethylation activities in the reconstitutedsystems by measuring the quantity of formaldehydeformed.
Sodium dodecyl sulfate-polyacrylamide gel elec-trophoresis (SDS-PAGE) was carried out to estimate themonomeric molecular weight of beef liver NADPH–cytochrome P450 reductase. Electrophoresis was per-formed on a 4% stacking gel and 8.5% separating gel in adiscontinuous buffer system according to Laemmli [33]with bovine serum albumin (Mr-68,000), catalase (Mr-60,000), glutamate dehydrogenase (Mr-53,000), and eggalbumin (Mr-45,000) as markers. The gels were fixedand stained for protein with 0.1% Coomassie blue in50% methanol and 12% acetic acid and destained bythe diffusion of unbound dye from gels with extensivewashing with 30% methanol and 7% acetic acid.
RESULTS
Purification of Cytochrome P450 Reductasefrom Beef Liver
NADPH–cytochrome P450 reductase was purified239-fold from Emulgen 913 and cholate solubilized beefliver microsomes in four steps with a final yield of 13.5%as shown in Table 1. The procedure is based in part onthe combined methods previously used in this labo-ratory, but include important modifications that haveimproved the reproducibility of the various steps aswell as the stability of reductase. The selection of opti-mal conditions during the elution of reductase fromthe chromatography columns was greatly aided by
290 ARINC AND LELIK Volume 16, Number 6, 2002
TABLE 1. Purification of NADPH–Cytochrome P450 Reductase from Beef Liver Microsomes
Cytochrome P450 Reductasea
Volume Protein Amount Activity Specific Activity Total Activity Recovery PurificationFractions (mL) (mg/mL) (nmol/min/mL) (nmol/min/mg protein) (nmol/min) (%) Fold
Microsomes 54 39.9 2423.2 60.7 130852.8 100 1Solubilized microsomes 325 3.54 507.4 143.3 164905.0 126 2.36DEAE-cellulose-1 173.9 0.34 502.6 1478.2 87402.1 67 24.4DEAE-cellulose-2 31.75 0.87 1644.0 1889.6 52195.4 40 31.12′,5′-ADP-Sepharose 39.25 0.0585 597.1 10200.0 23436.2 18 168.0
4B affinity chromatographyHydroxylapatite 6.6 0.185 2678.6 14507.0 17678.8 13.5 239.0
a NADPH–cytochrome P450 reductase activities were measured using cytochrome c as an artificial substrate electron acceptor, in 0.3 M phosphate buffer (pH 7.7)at 25◦C.
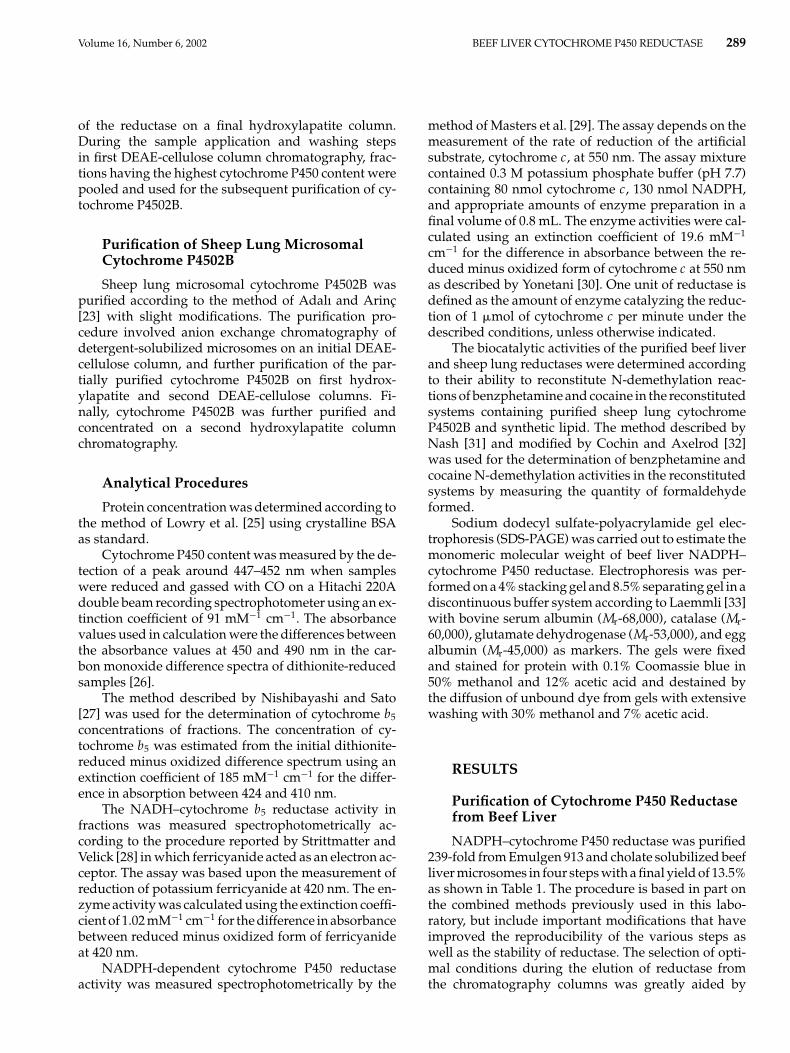
systematic electrophoretic analysis of the various frac-tions. The overall purification procedure used to purifycytochrome P450 reductase from beef liver microsomesis outlined in Figure 1.
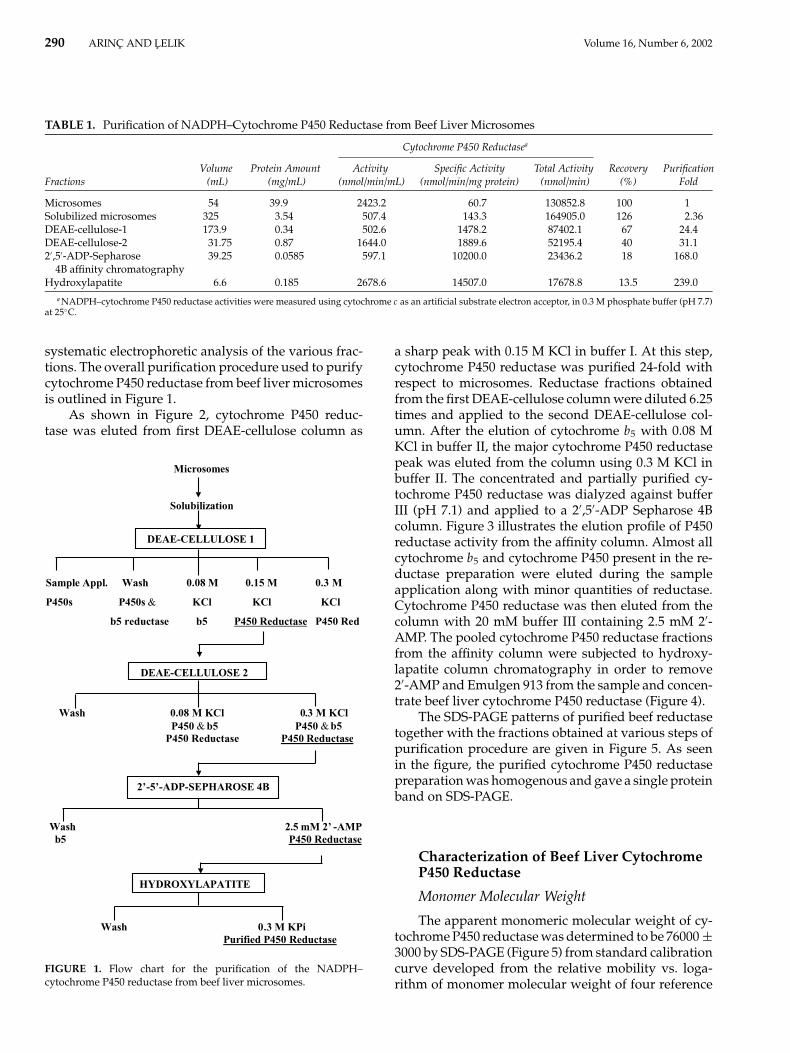
As shown in Figure 2, cytochrome P450 reduc-tase was eluted from first DEAE-cellulose column as
DEAE-CELLULOSE 1
DEAE-CELLULOSE 2
2’-5’-ADP-SEPHAROSE 4B
HYDROXYLAPATITE
Microsomes
Solubilization
Sample Appl. Wash 0.08 M 0.15 M 0.3 M
P450s P450s & KCl KCl KCl
b5 reductase b5 P450 Reductase P450 Red
Wash 0.08 M KCl 0.3 M KClP450 & b5 P450 & b5
P450 Reductase P450 Reductase
Wash 2.5 mM 2’ -AMPb5 P450 Reductase
Wash 0.3 M KPiPurified P450 Reductase
FIGURE 1. Flow chart for the purification of the NADPH–cytochrome P450 reductase from beef liver microsomes.
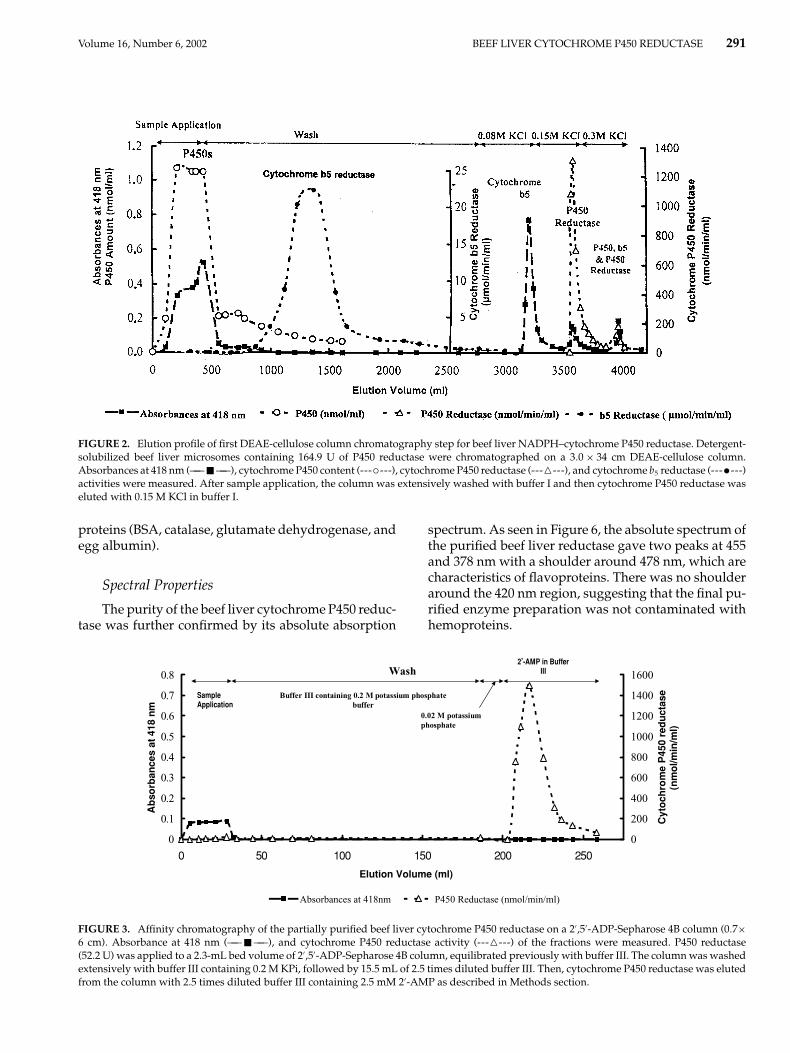
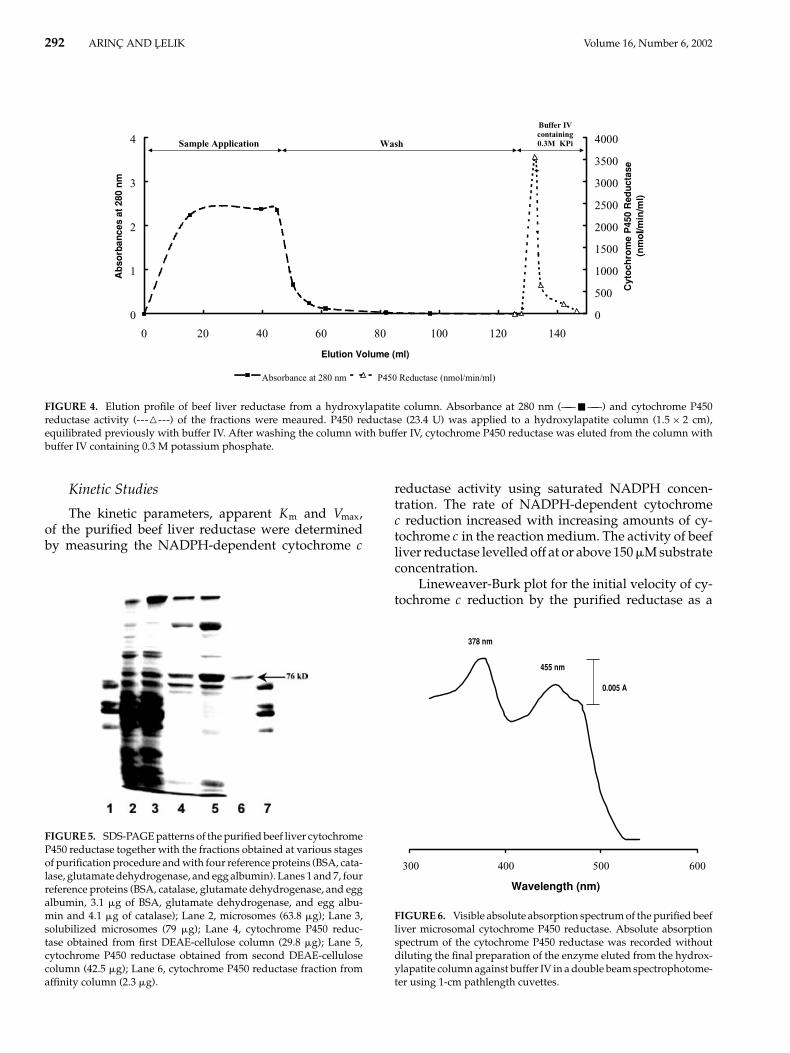
a sharp peak with 0.15 M KCl in buffer I. At this step,cytochrome P450 reductase was purified 24-fold withrespect to microsomes. Reductase fractions obtainedfrom the first DEAE-cellulose column were diluted 6.25times and applied to the second DEAE-cellulose col-umn. After the elution of cytochrome b5 with 0.08 MKCl in buffer II, the major cytochrome P450 reductasepeak was eluted from the column using 0.3 M KCl inbuffer II. The concentrated and partially purified cy-tochrome P450 reductase was dialyzed against bufferIII (pH 7.1) and applied to a 2′,5′-ADP Sepharose 4Bcolumn. Figure 3 illustrates the elution profile of P450reductase activity from the affinity column. Almost allcytochrome b5 and cytochrome P450 present in the re-ductase preparation were eluted during the sampleapplication along with minor quantities of reductase.Cytochrome P450 reductase was then eluted from thecolumn with 20 mM buffer III containing 2.5 mM 2′-AMP. The pooled cytochrome P450 reductase fractionsfrom the affinity column were subjected to hydroxy-lapatite column chromatography in order to remove2′-AMP and Emulgen 913 from the sample and concen-trate beef liver cytochrome P450 reductase (Figure 4).
The SDS-PAGE patterns of purified beef reductasetogether with the fractions obtained at various steps ofpurification procedure are given in Figure 5. As seenin the figure, the purified cytochrome P450 reductasepreparation was homogenous and gave a single proteinband on SDS-PAGE.
Characterization of Beef Liver CytochromeP450 Reductase
Monomer Molecular Weight
The apparent monomeric molecular weight of cy-tochrome P450 reductase was determined to be 76000 ±3000 by SDS-PAGE (Figure 5) from standard calibrationcurve developed from the relative mobility vs. loga-rithm of monomer molecular weight of four reference
Volume 16, Number 6, 2002 BEEF LIVER CYTOCHROME P450 REDUCTASE 291
FIGURE 2. Elution profile of first DEAE-cellulose column chromatography step for beef liver NADPH–cytochrome P450 reductase. Detergent-solubilized beef liver microsomes containing 164.9 U of P450 reductase were chromatographed on a 3.0 × 34 cm DEAE-cellulose column.Absorbances at 418 nm (—— � ——), cytochrome P450 content (---◦---), cytochrome P450 reductase (------), and cytochrome b5 reductase (---•---)activities were measured. After sample application, the column was extensively washed with buffer I and then cytochrome P450 reductase waseluted with 0.15 M KCl in buffer I.
proteins (BSA, catalase, glutamate dehydrogenase, andegg albumin).
Spectral Properties
The purity of the beef liver cytochrome P450 reduc-tase was further confirmed by its absolute absorption
0
0.1
0.2
0.3
0.4
0.5
0.6
0.7
0.8
0 50 100 150 200 250
Elution Volume (ml)
Ab
sorb
ance
sat
418
nm
0
200
400
600
800
1000
1200
1400
1600C
yto
chro
me
P45
0re
du
ctas
e(n
mo
l/ /min
//ml)
Absorbances at 418nm P450 Reductase (nmol/min/ml)
Sample Application
Buffer III containing 0.2 M potassium phosphatebuffer
2,-AMP in Buffer
III
0.02 M potassiumphosphate
Wash
FIGURE 3. Affinity chromatography of the partially purified beef liver cytochrome P450 reductase on a 2′,5′-ADP-Sepharose 4B column (0.7×6 cm). Absorbance at 418 nm (—— � ——), and cytochrome P450 reductase activity (------) of the fractions were measured. P450 reductase(52.2 U) was applied to a 2.3-mL bed volume of 2′,5′-ADP-Sepharose 4B column, equilibrated previously with buffer III. The column was washedextensively with buffer III containing 0.2 M KPi, followed by 15.5 mL of 2.5 times diluted buffer III. Then, cytochrome P450 reductase was elutedfrom the column with 2.5 times diluted buffer III containing 2.5 mM 2′-AMP as described in Methods section.
spectrum. As seen in Figure 6, the absolute spectrum ofthe purified beef liver reductase gave two peaks at 455and 378 nm with a shoulder around 478 nm, which arecharacteristics of flavoproteins. There was no shoulderaround the 420 nm region, suggesting that the final pu-rified enzyme preparation was not contaminated withhemoproteins.
292 ARINC AND LELIK Volume 16, Number 6, 2002
0
1
2
3
4
0 20 40 60 80 100 120 140
Elution Volume (ml)
Ab
sorb
ance
sat
280
nm
0
500
1000
1500
2000
2500
3000
3500
4000
Cyt
och
rom
eP
450
Red
uct
ase
(nm
ol/ l/m
in//m
l)
Absorbance at 280 nm P450 Reductase (nmol/min/ml)
Sample Application Wash
Buffer IVcontaining0.3M KPi
FIGURE 4. Elution profile of beef liver reductase from a hydroxylapatite column. Absorbance at 280 nm (—— � ——) and cytochrome P450reductase activity (------) of the fractions were meaured. P450 reductase (23.4 U) was applied to a hydroxylapatite column (1.5 × 2 cm),equilibrated previously with buffer IV. After washing the column with buffer IV, cytochrome P450 reductase was eluted from the column withbuffer IV containing 0.3 M potassium phosphate.
Kinetic Studies
The kinetic parameters, apparent Km and Vmax,of the purified beef liver reductase were determinedby measuring the NADPH-dependent cytochrome c
FIGURE 5. SDS-PAGE patterns of the purified beef liver cytochromeP450 reductase together with the fractions obtained at various stagesof purification procedure and with four reference proteins (BSA, cata-lase, glutamate dehydrogenase, and egg albumin). Lanes 1 and 7, fourreference proteins (BSA, catalase, glutamate dehydrogenase, and eggalbumin, 3.1 �g of BSA, glutamate dehydrogenase, and egg albu-min and 4.1 �g of catalase); Lane 2, microsomes (63.8 �g); Lane 3,solubilized microsomes (79 �g); Lane 4, cytochrome P450 reduc-tase obtained from first DEAE-cellulose column (29.8 �g); Lane 5,cytochrome P450 reductase obtained from second DEAE-cellulosecolumn (42.5 �g); Lane 6, cytochrome P450 reductase fraction fromaffinity column (2.3 �g).
reductase activity using saturated NADPH concen-tration. The rate of NADPH-dependent cytochromec reduction increased with increasing amounts of cy-tochrome c in the reaction medium. The activity of beefliver reductase levelled off at or above 150 �M substrateconcentration.
Lineweaver-Burk plot for the initial velocity of cy-tochrome c reduction by the purified reductase as a
Wavelength (nm)
378 nm
455 nm
0.005 A
300 400 500 600
FIGURE 6. Visible absolute absorption spectrum of the purified beefliver microsomal cytochrome P450 reductase. Absolute absorptionspectrum of the cytochrome P450 reductase was recorded withoutdiluting the final preparation of the enzyme eluted from the hydrox-ylapatite column against buffer IV in a double beam spectrophotome-ter using 1-cm pathlength cuvettes.
Volume 16, Number 6, 2002 BEEF LIVER CYTOCHROME P450 REDUCTASE 293
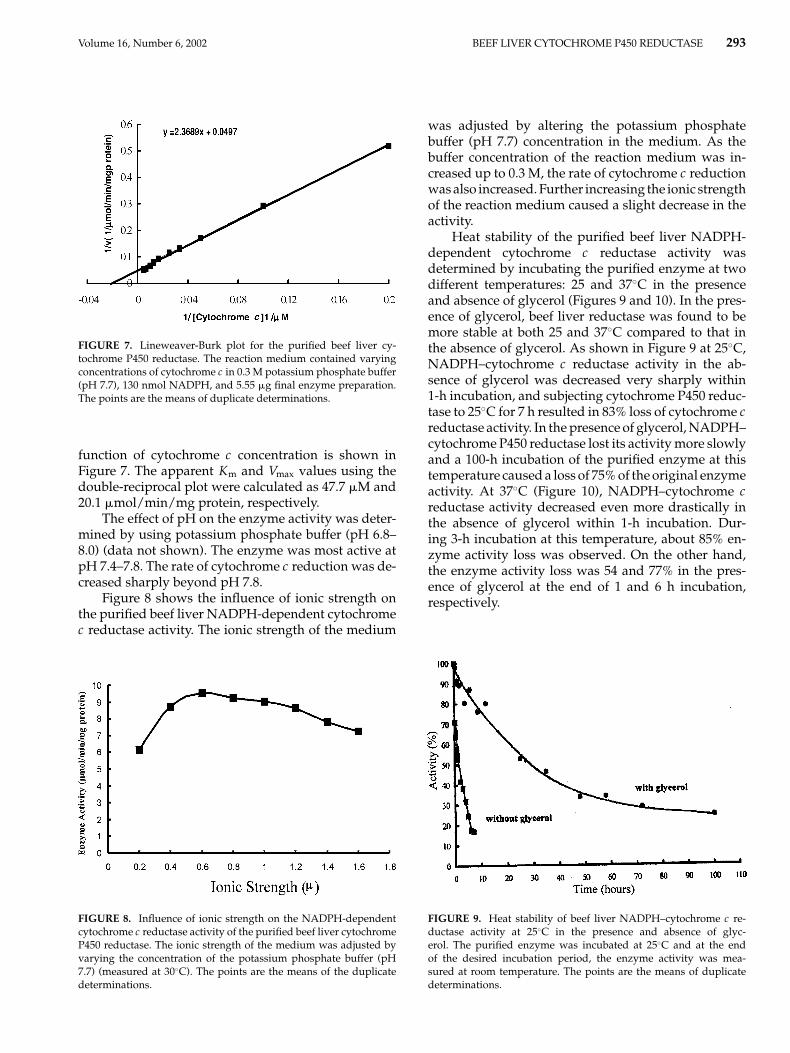
FIGURE 7. Lineweaver-Burk plot for the purified beef liver cy-tochrome P450 reductase. The reaction medium contained varyingconcentrations of cytochrome c in 0.3 M potassium phosphate buffer(pH 7.7), 130 nmol NADPH, and 5.55 �g final enzyme preparation.The points are the means of duplicate determinations.
function of cytochrome c concentration is shown inFigure 7. The apparent Km and Vmax values using thedouble-reciprocal plot were calculated as 47.7 �M and20.1 �mol/min/mg protein, respectively.
The effect of pH on the enzyme activity was deter-mined by using potassium phosphate buffer (pH 6.8–8.0) (data not shown). The enzyme was most active atpH 7.4–7.8. The rate of cytochrome c reduction was de-creased sharply beyond pH 7.8.
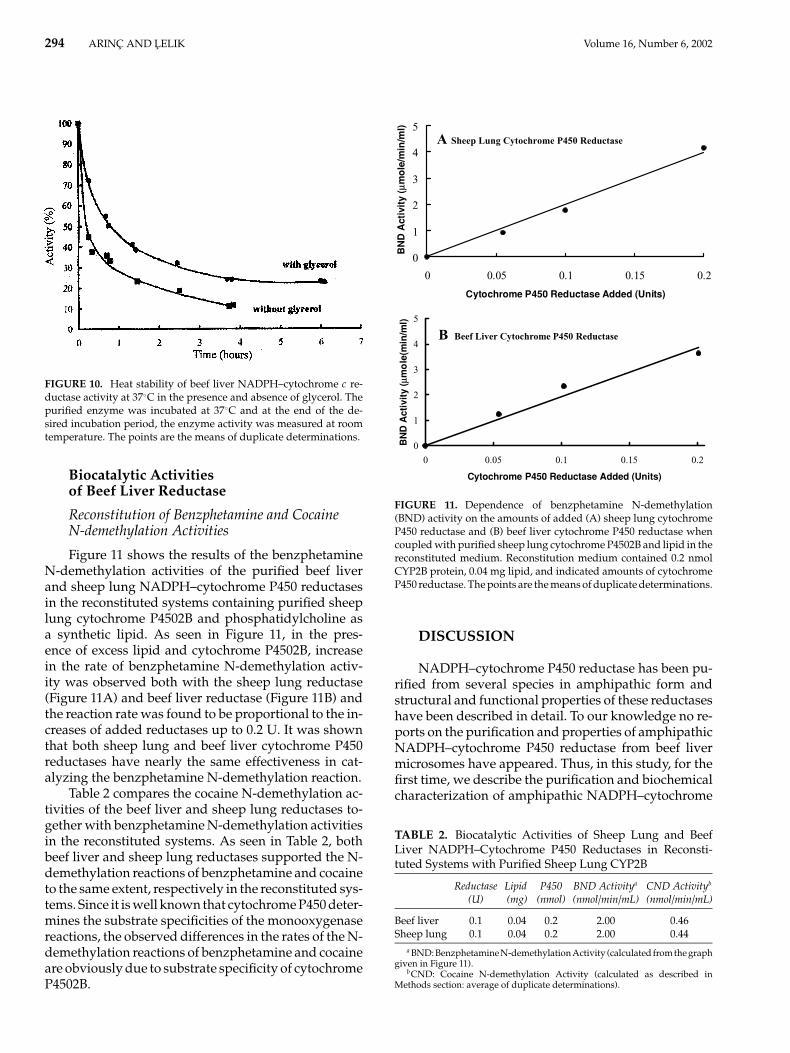
Figure 8 shows the influence of ionic strength onthe purified beef liver NADPH-dependent cytochromec reductase activity. The ionic strength of the medium
FIGURE 8. Influence of ionic strength on the NADPH-dependentcytochrome c reductase activity of the purified beef liver cytochromeP450 reductase. The ionic strength of the medium was adjusted byvarying the concentration of the potassium phosphate buffer (pH7.7) (measured at 30◦C). The points are the means of the duplicatedeterminations.
was adjusted by altering the potassium phosphatebuffer (pH 7.7) concentration in the medium. As thebuffer concentration of the reaction medium was in-creased up to 0.3 M, the rate of cytochrome c reductionwas also increased. Further increasing the ionic strengthof the reaction medium caused a slight decrease in theactivity.
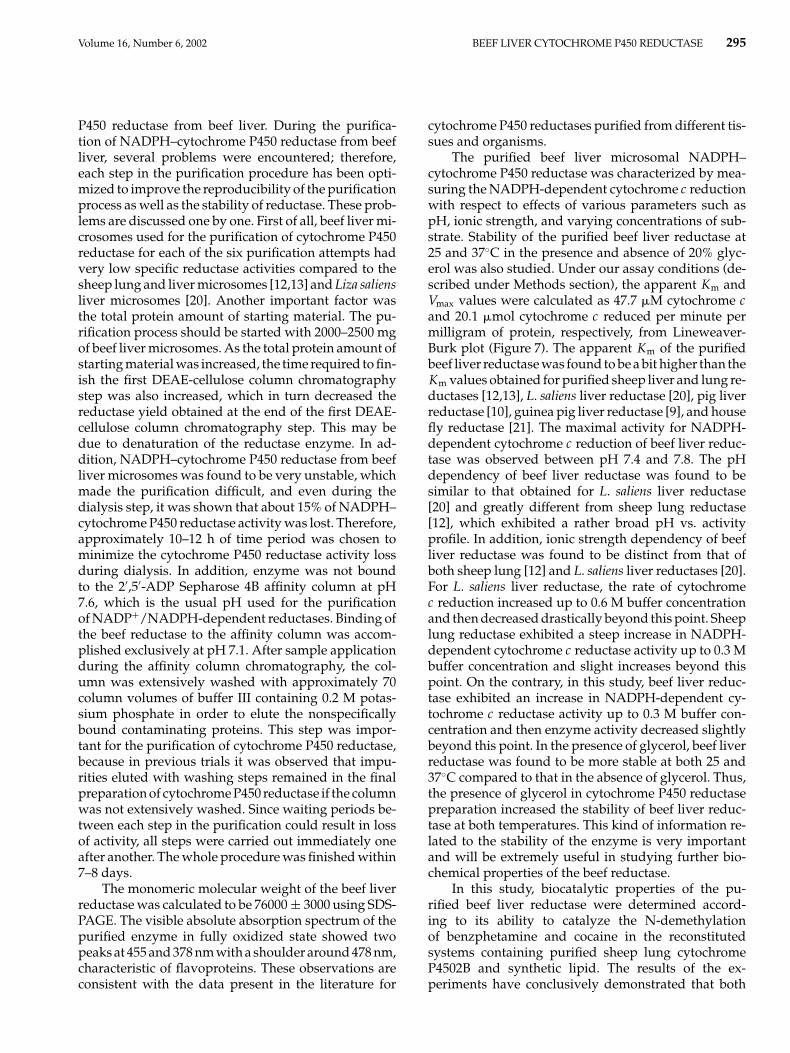
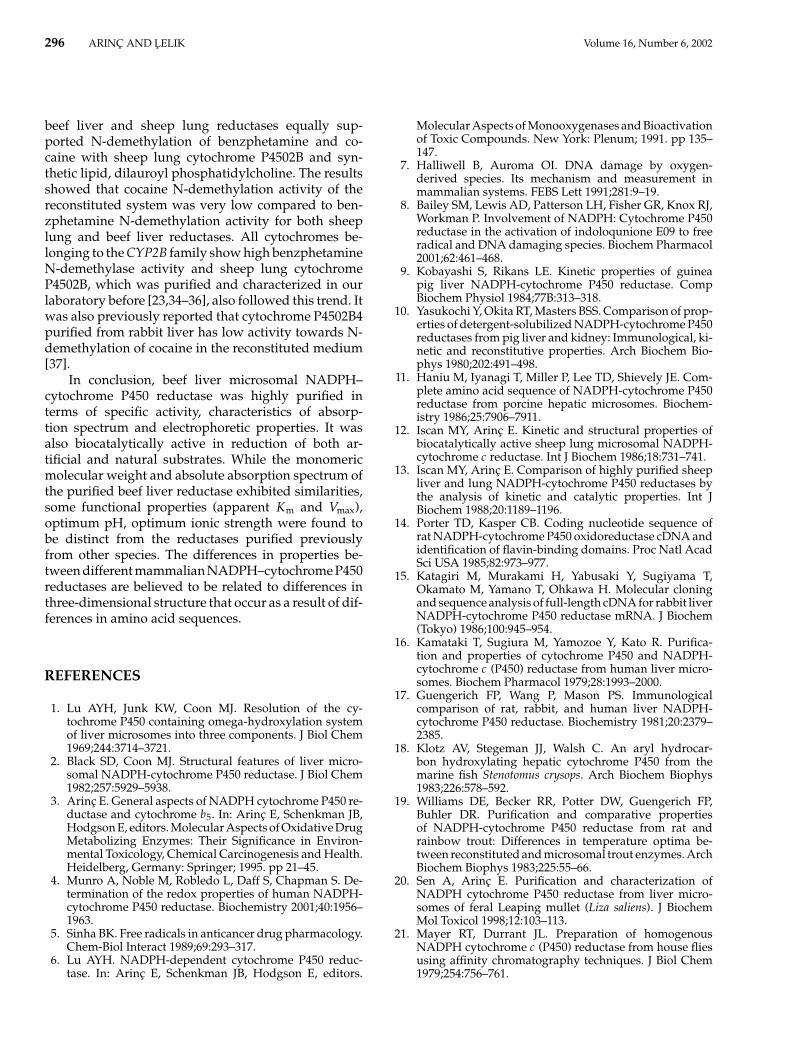
Heat stability of the purified beef liver NADPH-dependent cytochrome c reductase activity wasdetermined by incubating the purified enzyme at twodifferent temperatures: 25 and 37◦C in the presenceand absence of glycerol (Figures 9 and 10). In the pres-ence of glycerol, beef liver reductase was found to bemore stable at both 25 and 37◦C compared to that inthe absence of glycerol. As shown in Figure 9 at 25◦C,NADPH–cytochrome c reductase activity in the ab-sence of glycerol was decreased very sharply within1-h incubation, and subjecting cytochrome P450 reduc-tase to 25◦C for 7 h resulted in 83% loss of cytochrome creductase activity. In the presence of glycerol, NADPH–cytochrome P450 reductase lost its activity more slowlyand a 100-h incubation of the purified enzyme at thistemperature caused a loss of 75% of the original enzymeactivity. At 37◦C (Figure 10), NADPH–cytochrome creductase activity decreased even more drastically inthe absence of glycerol within 1-h incubation. Dur-ing 3-h incubation at this temperature, about 85% en-zyme activity loss was observed. On the other hand,the enzyme activity loss was 54 and 77% in the pres-ence of glycerol at the end of 1 and 6 h incubation,respectively.
FIGURE 9. Heat stability of beef liver NADPH–cytochrome c re-ductase activity at 25◦C in the presence and absence of glyc-erol. The purified enzyme was incubated at 25◦C and at the endof the desired incubation period, the enzyme activity was mea-sured at room temperature. The points are the means of duplicatedeterminations.
294 ARINC AND LELIK Volume 16, Number 6, 2002
FIGURE 10. Heat stability of beef liver NADPH–cytochrome c re-ductase activity at 37◦C in the presence and absence of glycerol. Thepurified enzyme was incubated at 37◦C and at the end of the de-sired incubation period, the enzyme activity was measured at roomtemperature. The points are the means of duplicate determinations.
Biocatalytic Activitiesof Beef Liver Reductase
Reconstitution of Benzphetamine and CocaineN-demethylation Activities
Figure 11 shows the results of the benzphetamineN-demethylation activities of the purified beef liverand sheep lung NADPH–cytochrome P450 reductasesin the reconstituted systems containing purified sheeplung cytochrome P4502B and phosphatidylcholine asa synthetic lipid. As seen in Figure 11, in the pres-ence of excess lipid and cytochrome P4502B, increasein the rate of benzphetamine N-demethylation activ-ity was observed both with the sheep lung reductase(Figure 11A) and beef liver reductase (Figure 11B) andthe reaction rate was found to be proportional to the in-creases of added reductases up to 0.2 U. It was shownthat both sheep lung and beef liver cytochrome P450reductases have nearly the same effectiveness in cat-alyzing the benzphetamine N-demethylation reaction.
Table 2 compares the cocaine N-demethylation ac-tivities of the beef liver and sheep lung reductases to-gether with benzphetamine N-demethylation activitiesin the reconstituted systems. As seen in Table 2, bothbeef liver and sheep lung reductases supported the N-demethylation reactions of benzphetamine and cocaineto the same extent, respectively in the reconstituted sys-tems. Since it is well known that cytochrome P450 deter-mines the substrate specificities of the monooxygenasereactions, the observed differences in the rates of the N-demethylation reactions of benzphetamine and cocaineare obviously due to substrate specificity of cytochromeP4502B.
0
1
2
3
4
5
0 0.05 0.1 0.15 0.2
Cytochrome P450 Reductase Added (Units)
BN
DA
ctiv
ity
(µm
ole
//min
//ml)
0
1
2
3
4
5
0 0.05 0.1 0.15 0.2
Cytochrome P450 Reductase Added (Units)
BN
DA
ctiv
ity
(µm
ole
(min
//ml)
A Sheep Lung Cytochrome P450 Reductase
B Beef Liver Cytochrome P450 Reductase
FIGURE 11. Dependence of benzphetamine N-demethylation(BND) activity on the amounts of added (A) sheep lung cytochromeP450 reductase and (B) beef liver cytochrome P450 reductase whencoupled with purified sheep lung cytochrome P4502B and lipid in thereconstituted medium. Reconstitution medium contained 0.2 nmolCYP2B protein, 0.04 mg lipid, and indicated amounts of cytochromeP450 reductase. The points are the means of duplicate determinations.
DISCUSSION
NADPH–cytochrome P450 reductase has been pu-rified from several species in amphipathic form andstructural and functional properties of these reductaseshave been described in detail. To our knowledge no re-ports on the purification and properties of amphipathicNADPH–cytochrome P450 reductase from beef livermicrosomes have appeared. Thus, in this study, for thefirst time, we describe the purification and biochemicalcharacterization of amphipathic NADPH–cytochrome
TABLE 2. Biocatalytic Activities of Sheep Lung and BeefLiver NADPH–Cytochrome P450 Reductases in Reconsti-tuted Systems with Purified Sheep Lung CYP2B
Reductase Lipid P450 BND Activitya CND Activityb
(U) (mg) (nmol) (nmol/min/mL) (nmol/min/mL)
Beef liver 0.1 0.04 0.2 2.00 0.46Sheep lung 0.1 0.04 0.2 2.00 0.44
a BND: Benzphetamine N-demethylation Activity (calculated from the graphgiven in Figure 11).
b CND: Cocaine N-demethylation Activity (calculated as described inMethods section: average of duplicate determinations).
Volume 16, Number 6, 2002 BEEF LIVER CYTOCHROME P450 REDUCTASE 295
P450 reductase from beef liver. During the purifica-tion of NADPH–cytochrome P450 reductase from beefliver, several problems were encountered; therefore,each step in the purification procedure has been opti-mized to improve the reproducibility of the purificationprocess as well as the stability of reductase. These prob-lems are discussed one by one. First of all, beef liver mi-crosomes used for the purification of cytochrome P450reductase for each of the six purification attempts hadvery low specific reductase activities compared to thesheep lung and liver microsomes [12,13] and Liza saliensliver microsomes [20]. Another important factor wasthe total protein amount of starting material. The pu-rification process should be started with 2000–2500 mgof beef liver microsomes. As the total protein amount ofstarting material was increased, the time required to fin-ish the first DEAE-cellulose column chromatographystep was also increased, which in turn decreased thereductase yield obtained at the end of the first DEAE-cellulose column chromatography step. This may bedue to denaturation of the reductase enzyme. In ad-dition, NADPH–cytochrome P450 reductase from beefliver microsomes was found to be very unstable, whichmade the purification difficult, and even during thedialysis step, it was shown that about 15% of NADPH–cytochrome P450 reductase activity was lost. Therefore,approximately 10–12 h of time period was chosen tominimize the cytochrome P450 reductase activity lossduring dialysis. In addition, enzyme was not boundto the 2′,5′-ADP Sepharose 4B affinity column at pH7.6, which is the usual pH used for the purificationof NADP+/NADPH-dependent reductases. Binding ofthe beef reductase to the affinity column was accom-plished exclusively at pH 7.1. After sample applicationduring the affinity column chromatography, the col-umn was extensively washed with approximately 70column volumes of buffer III containing 0.2 M potas-sium phosphate in order to elute the nonspecificallybound contaminating proteins. This step was impor-tant for the purification of cytochrome P450 reductase,because in previous trials it was observed that impu-rities eluted with washing steps remained in the finalpreparation of cytochrome P450 reductase if the columnwas not extensively washed. Since waiting periods be-tween each step in the purification could result in lossof activity, all steps were carried out immediately oneafter another. The whole procedure was finished within7–8 days.
The monomeric molecular weight of the beef liverreductase was calculated to be 76000 ± 3000 using SDS-PAGE. The visible absolute absorption spectrum of thepurified enzyme in fully oxidized state showed twopeaks at 455 and 378 nm with a shoulder around 478 nm,characteristic of flavoproteins. These observations areconsistent with the data present in the literature for
cytochrome P450 reductases purified from different tis-sues and organisms.
The purified beef liver microsomal NADPH–cytochrome P450 reductase was characterized by mea-suring the NADPH-dependent cytochrome c reductionwith respect to effects of various parameters such aspH, ionic strength, and varying concentrations of sub-strate. Stability of the purified beef liver reductase at25 and 37◦C in the presence and absence of 20% glyc-erol was also studied. Under our assay conditions (de-scribed under Methods section), the apparent Km andVmax values were calculated as 47.7 �M cytochrome cand 20.1 �mol cytochrome c reduced per minute permilligram of protein, respectively, from Lineweaver-Burk plot (Figure 7). The apparent Km of the purifiedbeef liver reductase was found to be a bit higher than theKm values obtained for purified sheep liver and lung re-ductases [12,13], L. saliens liver reductase [20], pig liverreductase [10], guinea pig liver reductase [9], and housefly reductase [21]. The maximal activity for NADPH-dependent cytochrome c reduction of beef liver reduc-tase was observed between pH 7.4 and 7.8. The pHdependency of beef liver reductase was found to besimilar to that obtained for L. saliens liver reductase[20] and greatly different from sheep lung reductase[12], which exhibited a rather broad pH vs. activityprofile. In addition, ionic strength dependency of beefliver reductase was found to be distinct from that ofboth sheep lung [12] and L. saliens liver reductases [20].For L. saliens liver reductase, the rate of cytochromec reduction increased up to 0.6 M buffer concentrationand then decreased drastically beyond this point. Sheeplung reductase exhibited a steep increase in NADPH-dependent cytochrome c reductase activity up to 0.3 Mbuffer concentration and slight increases beyond thispoint. On the contrary, in this study, beef liver reduc-tase exhibited an increase in NADPH-dependent cy-tochrome c reductase activity up to 0.3 M buffer con-centration and then enzyme activity decreased slightlybeyond this point. In the presence of glycerol, beef liverreductase was found to be more stable at both 25 and37◦C compared to that in the absence of glycerol. Thus,the presence of glycerol in cytochrome P450 reductasepreparation increased the stability of beef liver reduc-tase at both temperatures. This kind of information re-lated to the stability of the enzyme is very importantand will be extremely useful in studying further bio-chemical properties of the beef reductase.
In this study, biocatalytic properties of the pu-rified beef liver reductase were determined accord-ing to its ability to catalyze the N-demethylationof benzphetamine and cocaine in the reconstitutedsystems containing purified sheep lung cytochromeP4502B and synthetic lipid. The results of the ex-periments have conclusively demonstrated that both
296 ARINC AND LELIK Volume 16, Number 6, 2002
beef liver and sheep lung reductases equally sup-ported N-demethylation of benzphetamine and co-caine with sheep lung cytochrome P4502B and syn-thetic lipid, dilauroyl phosphatidylcholine. The resultsshowed that cocaine N-demethylation activity of thereconstituted system was very low compared to ben-zphetamine N-demethylation activity for both sheeplung and beef liver reductases. All cytochromes be-longing to the CYP2B family show high benzphetamineN-demethylase activity and sheep lung cytochromeP4502B, which was purified and characterized in ourlaboratory before [23,34–36], also followed this trend. Itwas also previously reported that cytochrome P4502B4purified from rabbit liver has low activity towards N-demethylation of cocaine in the reconstituted medium[37].
In conclusion, beef liver microsomal NADPH–cytochrome P450 reductase was highly purified interms of specific activity, characteristics of absorp-tion spectrum and electrophoretic properties. It wasalso biocatalytically active in reduction of both ar-tificial and natural substrates. While the monomericmolecular weight and absolute absorption spectrum ofthe purified beef liver reductase exhibited similarities,some functional properties (apparent Km and Vmax),optimum pH, optimum ionic strength were found tobe distinct from the reductases purified previouslyfrom other species. The differences in properties be-tween different mammalian NADPH–cytochrome P450reductases are believed to be related to differences inthree-dimensional structure that occur as a result of dif-ferences in amino acid sequences.
REFERENCES
1. Lu AYH, Junk KW, Coon MJ. Resolution of the cy-tochrome P450 containing omega-hydroxylation systemof liver microsomes into three components. J Biol Chem1969;244:3714–3721.
2. Black SD, Coon MJ. Structural features of liver micro-somal NADPH-cytochrome P450 reductase. J Biol Chem1982;257:5929–5938.
3. Arinc E. General aspects of NADPH cytochrome P450 re-ductase and cytochrome b5. In: Arinc E, Schenkman JB,Hodgson E, editors. Molecular Aspects of Oxidative DrugMetabolizing Enzymes: Their Significance in Environ-mental Toxicology, Chemical Carcinogenesis and Health.Heidelberg, Germany: Springer; 1995. pp 21–45.
4. Munro A, Noble M, Robledo L, Daff S, Chapman S. De-termination of the redox properties of human NADPH-cytochrome P450 reductase. Biochemistry 2001;40:1956–1963.
5. Sinha BK. Free radicals in anticancer drug pharmacology.Chem-Biol Interact 1989;69:293–317.
6. Lu AYH. NADPH-dependent cytochrome P450 reduc-tase. In: Arinc E, Schenkman JB, Hodgson E, editors.
Molecular Aspects of Monooxygenases and Bioactivationof Toxic Compounds. New York: Plenum; 1991. pp 135–147.
7. Halliwell B, Auroma OI. DNA damage by oxygen-derived species. Its mechanism and measurement inmammalian systems. FEBS Lett 1991;281:9–19.
8. Bailey SM, Lewis AD, Patterson LH, Fisher GR, Knox RJ,Workman P. Involvement of NADPH: Cytochrome P450reductase in the activation of indoloqunione E09 to freeradical and DNA damaging species. Biochem Pharmacol2001;62:461–468.
9. Kobayashi S, Rikans LE. Kinetic properties of guineapig liver NADPH-cytochrome P450 reductase. CompBiochem Physiol 1984;77B:313–318.
10. Yasukochi Y, Okita RT, Masters BSS. Comparison of prop-erties of detergent-solubilized NADPH-cytochrome P450reductases from pig liver and kidney: Immunological, ki-netic and reconstitutive properties. Arch Biochem Bio-phys 1980;202:491–498.
11. Haniu M, Iyanagi T, Miller P, Lee TD, Shievely JE. Com-plete amino acid sequence of NADPH-cytochrome P450reductase from porcine hepatic microsomes. Biochem-istry 1986;25:7906–7911.
12. Iscan MY, Arinc E. Kinetic and structural properties ofbiocatalytically active sheep lung microsomal NADPH-cytochrome c reductase. Int J Biochem 1986;18:731–741.
13. Iscan MY, Arinc E. Comparison of highly purified sheepliver and lung NADPH-cytochrome P450 reductases bythe analysis of kinetic and catalytic properties. Int JBiochem 1988;20:1189–1196.
14. Porter TD, Kasper CB. Coding nucleotide sequence ofrat NADPH-cytochrome P450 oxidoreductase cDNA andidentification of flavin-binding domains. Proc Natl AcadSci USA 1985;82:973–977.
15. Katagiri M, Murakami H, Yabusaki Y, Sugiyama T,Okamato M, Yamano T, Ohkawa H. Molecular cloningand sequence analysis of full-length cDNA for rabbit liverNADPH-cytochrome P450 reductase mRNA. J Biochem(Tokyo) 1986;100:945–954.
16. Kamataki T, Sugiura M, Yamozoe Y, Kato R. Purifica-tion and properties of cytochrome P450 and NADPH-cytochrome c (P450) reductase from human liver micro-somes. Biochem Pharmacol 1979;28:1993–2000.
17. Guengerich FP, Wang P, Mason PS. Immunologicalcomparison of rat, rabbit, and human liver NADPH-cytochrome P450 reductase. Biochemistry 1981;20:2379–2385.
18. Klotz AV, Stegeman JJ, Walsh C. An aryl hydrocar-bon hydroxylating hepatic cytochrome P450 from themarine fish Stenotomus crysops. Arch Biochem Biophys1983;226:578–592.
19. Williams DE, Becker RR, Potter DW, Guengerich FP,Buhler DR. Purification and comparative propertiesof NADPH-cytochrome P450 reductase from rat andrainbow trout: Differences in temperature optima be-tween reconstituted and microsomal trout enzymes. ArchBiochem Biophys 1983;225:55–66.
20. Sen A, Arinc E. Purification and characterization ofNADPH cytochrome P450 reductase from liver micro-somes of feral Leaping mullet (Liza saliens). J BiochemMol Toxicol 1998;12:103–113.
21. Mayer RT, Durrant JL. Preparation of homogenousNADPH cytochrome c (P450) reductase from house fliesusing affinity chromatography techniques. J Biol Chem1979;254:756–761.
Volume 16, Number 6, 2002 BEEF LIVER CYTOCHROME P450 REDUCTASE 297
22. Benveniste I, Lesot A, Hasenfratz M-P, Durst F. Immuno-chemical characterization of NADPH-cytochrome P450reductase from Jerusalem artichoke and other higher plants.Biochem J 1989;259:847–853.
23. Adalı O, Arinc E. Electrophoretic, spectral, catalyticand immunochemical properties of highly purifiedcytochrome P450 from sheep lung. Int J Biochem1990;22:1433–1444.
24. Arinc E, Aydogmus A. Lung microsomal p-nitrophenolhydroxylase-characterization and reconstitution of its ac-tivity. Comp Biochem Physiol 1990;97B:455–460.
25. Lowry OH, Rosebrough NJ, Farr AL, Randall RJ. Proteinmeasurement with the Folin phenol reagent. J Biol Chem1951;193:265–275.
26. Omura T, Sato R. The carbon monoxide-binding pigmentof liver microsomes. I. Solubilization, purification andproperties. J Biol Chem 1964;239:2379–2385.
27. Nishibayashi H, Sato R. Preparation of hepatic microso-mal particles containing P-450 as sole heme constituentand absolute spectra of P-450. Biochem J 1968;63:766–779.
28. Strittmatter P, Velick SF. The purification and proper-ties of microsomal cytochrome reductase. J Biol Chem1957;228:785–799.
29. Masters BSS, Williams CH, Kamin H. The preparationand properties of microsomal TPNH-cytochrome c reduc-tase from pig liver. In: Colowick SP, Kaplan NO, editors.Methods in Enzymology. New York: Academic Press;1967. Vol. 10, pp 565–573.
30. Yonetani T. Studies on cytochrome c peroxidase. II. Stoi-chiometry between enzyme, H2O2 and ferrocytochromec and enzymic determination of extinction coefficients ofcytochrome c. J Biol Chem 1965;210:4509–4514.
31. Nash T. The colorimetric estimation of formaldehyde bymeans of the Hantzsch reaction. Biochem J 1953;55:416–421.
32. Cochin J, Axelrod J. Biochemical and pharmacologicalchanges in the rat following chronic administration ofmorphine, nalorphine, and normorphine. J PharmacolExp Ther 1959;125:105–110.
33. Laemmli UK. Cleavage of structural proteins duringthe assembly of the head of bacteriophages T4. Nature1970;227:680–684.
34. Arinc E. Extrahepatic microsomal forms: Lung microso-mal cytochrome P450 isozymes. In: Schenkman JB, GreimH, editors. Handbook of Experimental Pharmacology.New York: Springer; 1993. pp 373–386.
35. Arinc E, Hanukoglu I, Sen A, Adalı O. Tissue- andspecies-dependent expression of sheep lung microso-mal cytochrome P4502B(LgM2). Biochem Mol Biol Int1995;37(6):1121–1126.
36. Adalı O, Abu-Baker T, Arinc E. Immunochemical andsub-structural characterization of sheep lung cytochromeP450LgM2. Int J Biochem Cell Biol 1996;28(3):363–372.
37. Poet TS, McQueen CA, Halpert JR. Participation of cy-tochromes P4502B and P4503A in cocaine toxicity in rathepatocytes. Drug Metab Dispos 1996;24(1):74–80.
Recommended