Blackmore
BUY-SIDE PRIVATE EQUITY ADVISORY
• A Introduction to Private Equity and How to Succeed
partners

Agenda
Why Now?
How Private Equity Creates Value
Blackmore Programs
What are the Options
Deal Shopping Process
What is an Actionable Deal
What Blackmore Provides Determinants of Growth in 2012
What is Private Equity?
Sample Project Time-Line
Debt Market Summary
Who are the Investors?
Next Steps
Private Equity Acquisition Process
Private Equity Fund Structure
What is a P/E Intermediary?
Current Trend in Private Equity
Types of Transaction by P/E
Types of Deals Blackmore Looks for
Your Role
19 3
4
5
8
9
12
15
17
18
50
40
36
35
30
22
52
53
54
14

Blackmore Provides
• are considered a respected intermedary by the industry • are paid by PE to help, place you in a company or share closing fees with you Maintain relationships with… • 1,500 PE firms in U.S. • 8,000 PE firms globally • We narrow focus to 50 – 200 specific PE groups.
• Provide “back-ups” in case deal falls through.
• Option to Co-invest in company
• Significantly lower sale price than investment banking sale = More initial wealth creation for you •Receive Finders/Consulting fee for “lining up” deals.
•Experienced guidance through acquisition Process.
• Payment from Private equity firm.
You Gain We…

Compensation Fee Seller - 98% Executuve Fee- .08%
Blackmore Fee- 1.2% Compensation
• Placed executives receive a minimum of 5% equity in new company, without capital investment. • Generally increased salaries and bonus packages.
If you do not meet the buyers requirements to run a company then you can benefit from our Finder Program •Line up deals and get paid out of our Fee •From 5% -40%
Blackmore Programs
Connectors Backed
Executives Requirements
• +10 years of industry experience • Direct operational P/L responsibilities of +$100 M (or, approximately double size of acquired company) • References that support you as CEO •Previous role as CEO, COO, GM, President, VP operations
And/Or
What is an Actionable Deal? • Companies whose owners are willing and ready to sell
•Industry Agnostic
•Middle Market Companies $35 - $200 M in revenue
•EBITDA between $5 million and $15 million
•Distressed Companies
Carve- Outs, LBOs, LBIs
• Companies located in the U.S. Canada
•Companies that are not represented by investments banks
• What are the signs of a good target?
• Unnatural ownership/neglected divisions
• Estate plans/Family Transition
• Broken Process/investment banks unable to sell
Potential growth of 2x - 3x within 3-5 years.
Operating margins of at least 10%
Growth through acquisition – Potential Add-on targets
Large fragmented markets
Generational transitions – Companies with Subcontractors looking for
succession plans.
High barrier to entry from competitors – I.P. assets, sole source position.
Customer diversification (no customer concentration of greater than
30%)

WHY IS NOW A GREAT TIME TO BUY A BUSINESS?

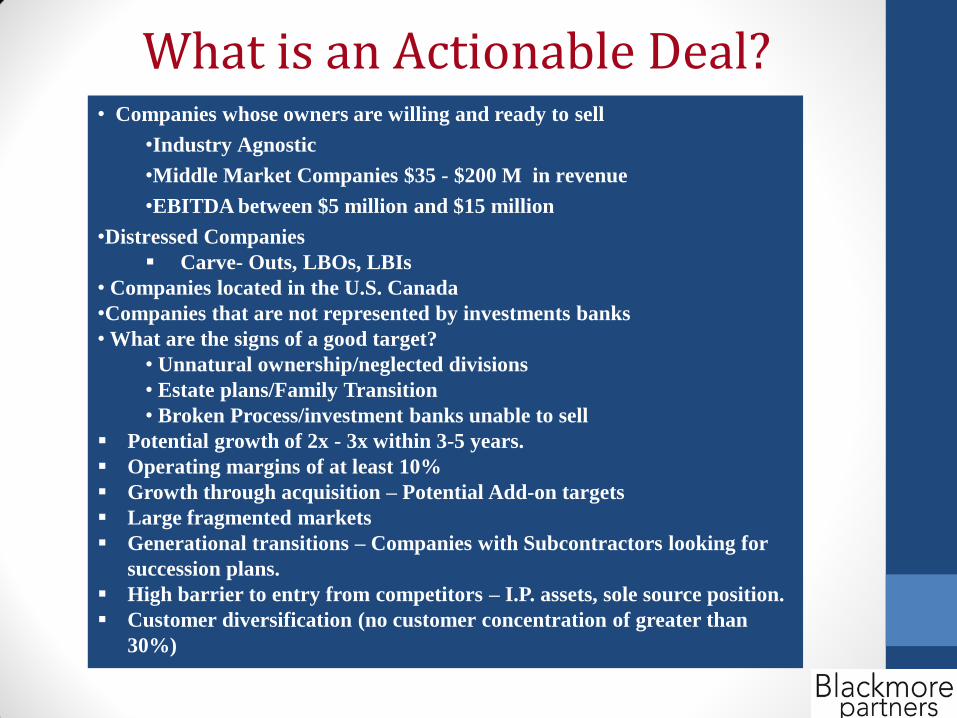
Deterrents to Growth in 2012 are Similar to Those in 2011
• ISM – Purchasing Managers Index data continues to bounce around indicating no further momentum in the economy
• Unemployement rate will continue to hoover around 10%
• Significatant drag from the state and local sectors
• Large overhand of unused industrial capacity and vacant homes
• Limited credit availability remains a problem
• Concerns of European sovereign debt will continue

Ten-year transfer cycle
Current seller’s market Taxes are going up in 2013
In the next 15 years, eight million business owners will exit
The number of buyers will remain stable
More supply and limited demand means a lower multiple paid for businesses
Post recession means many markets are
at bottom of cycle and will reverse course
Deal timeline
We can get deals funded in as little as 90 days from now if there is a ready, willing and able seller.
A sale will take from 12 to 24 months to complete in our normal process.
An owner considering retirement in the near future is advised to begin the selling process as early as possible
Why now?
Source: Rob Slee – Midas Nation
Create true wealth by gaining equity in your company


WHAT ARE THE OPTIONS?

What are the options?
Start your own business
Less capital needed for investment
Pride of building own company
Time consuming to establish
Initial cash flow issues
Buy a company without partners
Structure and organization in place
100% of equity and ability to control
Potentially smaller business
Limited resources and capabilities
Employ CEO for succession plan
opportunity
Less capital needed
Reasonable transition time
Ego of owner
Inability to control timing, direction
Buy a company with PE partner
Able to buy bigger company
Capital and expertise provided
Private equity could be ruthless
Short time frame for value creation
Pros & Cons Options Goals
Ownership of a
business

Buying With Private Equity Partner
ON ACQUISITION ON EXIT
Revenue $ 25,000,000 $ 32,000,000
Revenue Growth 28%
EBITDA
5,000,000 20.0%
8,000,000 25.0%
EBITDA Growth 60%
EBITDA Multiple 4.0X 5.0X
Enterprise Value 20,000,000 40,000,000
Typical Structure
Debt 12,000,000 60.0% 12,000,000 30.0%
Equity 8,000,000 40.0% 28,000,000 70.0%
20,000,000 100.0% 40,000,000 100.0%
Injected Equity
Management Team 500,000 6.3% 3,990,000 14.3%
PEG 7,500,000 93.8% 24,010,000 85.8%
$ 8,000,000 100.0% $ 28,000,000 100.0%
Increase in management ownership with stock options 8%
Buying with no Partner
ON ACQUISITION ON EXIT
Revenue $ 2,083,333 $ 6,514,286
Revenue Growth 213%
EBITDA 416,667 20.0%
1,628,571 25.0%
EBITDA Growth 291%
EBITDA Multiple 3.0X 3.5X
Enterprise Value 1,250,000 5,700,000
Typical Structure
Debt 750,000 60.0% 1,710,000 30.0%
Equity 500,000 40.0% 3,990,000 70.0%
1,250,000 100.0% 5,700,000 100.0%
Injected Equity
Management Team 500,000 100.0% 3,990,000 100.0%
PEG - 0.0% - 0.0%
$ 500,000 100.0% $ 3,990,000 100.0%
What are the options?
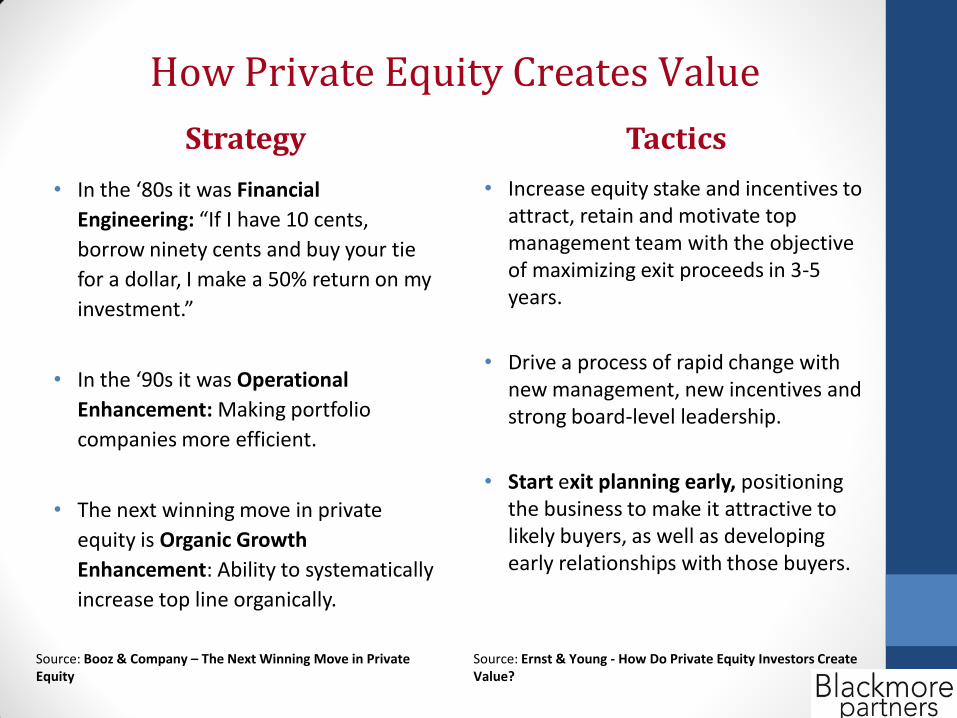
Strategy
• In the ‘80s it was Financial
Engineering: “If I have 10 cents,
borrow ninety cents and buy your tie
for a dollar, I make a 50% return on my
investment.”
• In the ‘90s it was Operational
Enhancement: Making portfolio
companies more efficient.
• The next winning move in private
equity is Organic Growth
Enhancement: Ability to systematically
increase top line organically.
Tactics
• Increase equity stake and incentives to attract, retain and motivate top management team with the objective of maximizing exit proceeds in 3-5 years.
• Drive a process of rapid change with new management, new incentives and strong board-level leadership.
• Start exit planning early, positioning the business to make it attractive to likely buyers, as well as developing early relationships with those buyers.
How Private Equity Creates Value
Source: Ernst & Young - How Do Private Equity Investors Create Value?
Source: Booz & Company – The Next Winning Move in Private Equity

THE PRIVATE EQUITY PROCESS
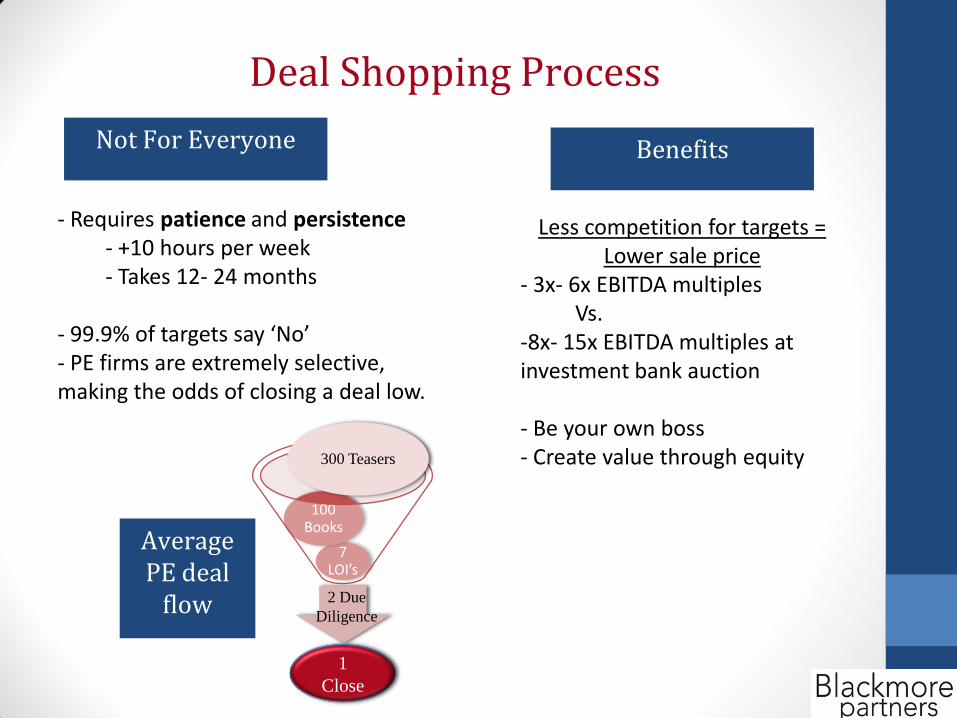
Deal Shopping Process
Not For Everyone
- Requires patience and persistence - +10 hours per week - Takes 12- 24 months
- 99.9% of targets say ‘No’ - PE firms are extremely selective, making the odds of closing a deal low.
7 LOI’s
100 Books
300 Teasers
2 Due
Diligence
1
Close
Average PE deal
flow
Benefits
Less competition for targets = Lower sale price
- 3x- 6x EBITDA multiples Vs. -8x- 15x EBITDA multiples at investment bank auction - Be your own boss - Create value through equity
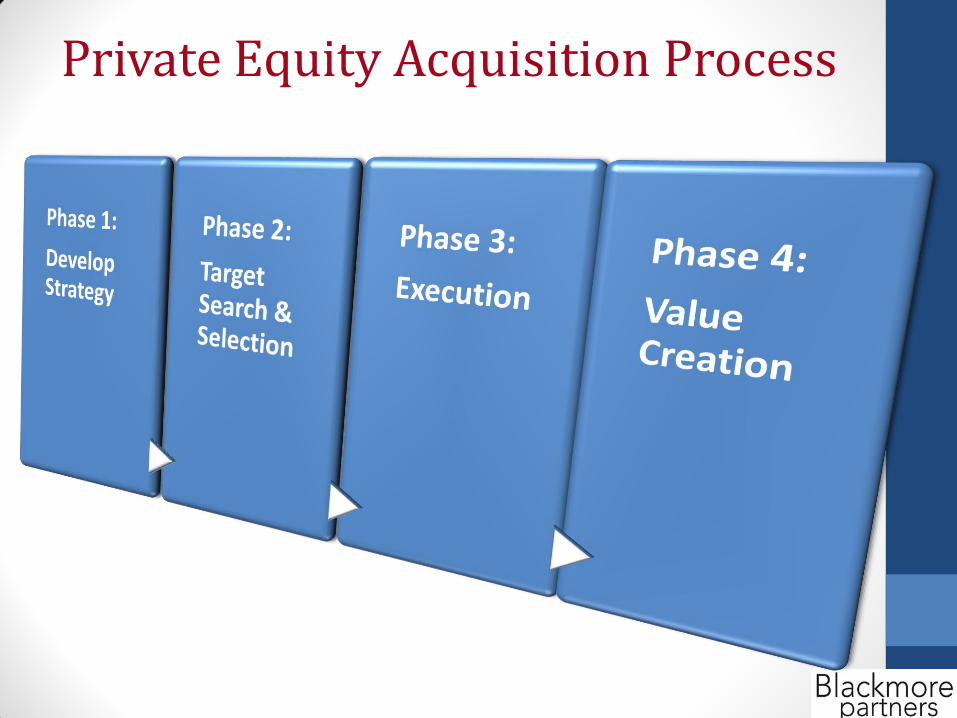
Private Equity Acquisition Process

Key activities and deliverables
Develop Strategy
Target Search & Selection
Execution Value
Creation
Establish relationship with qualified target businesses and PE partner
Executive acquisition process
Goals and outcomes
Create a vision and focus to establish the acquisition framework
Work toward closing a transaction with a PE partner
Drive innovation to achieve competitive advantage and a streamlined organization
Industry niche selection and research
Acquisition criteria summary
Buy-side teaser Executive’s
resume
Initial identification and screening
Target and PE profiling and contacting
Target and PE selection
Letter of intent Due diligence Investment
information memo and financial model
Finalize the deal
Align management and incentives
Establish and execute business plan
Operational improvements
Phase 1 Phase 2 Phase 3 Phase 4
Private Equity Acquisition Process

Backed Executives
Connectors
Next Steps
1. This is a formal process in which we meet every two weeks by phone. All meetings are 15-30 minutes. • Schedule a 1 to 1phone meeting by emailing • [email protected]
2. The process will take 10 hrs a week. I will email you the next steps, involving approximately of 2hrs due diligence on your part. 3. We will identify 100’s target by searching our database (NAICS) and by
Blackmore paying brokers who will search for targets on your behalf. In addition, we will reach out to our 8000 execs on linkedin to help you.
1. We can make this a formal process or ad-hoc 2. Send me a note at [email protected] to set up 1- to - 1 phone meeting to discuss opportunities.

What is Private Equity?
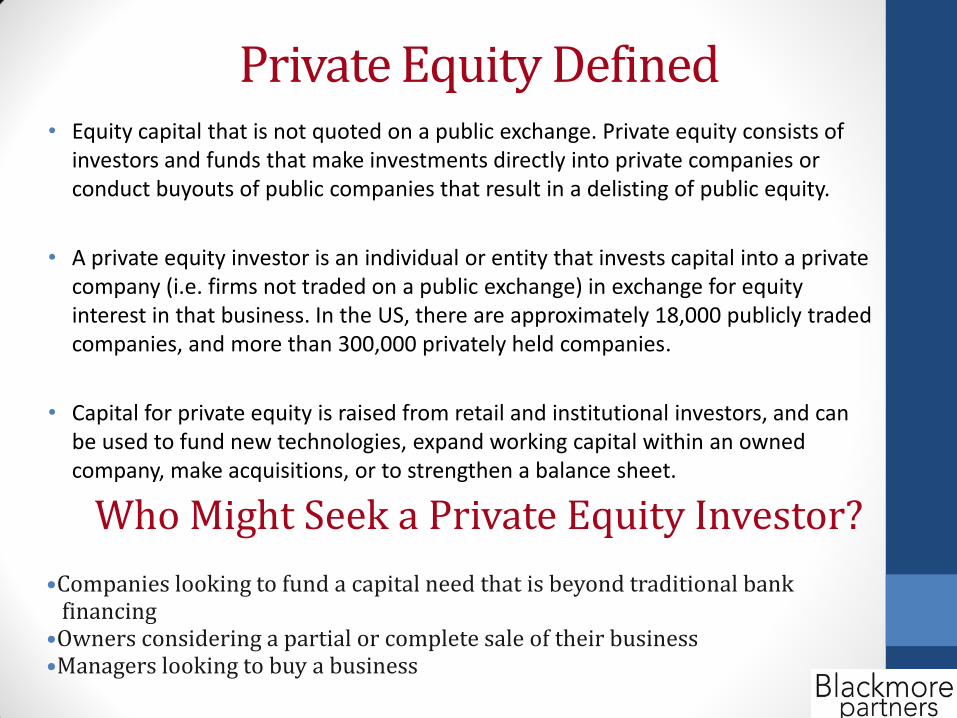
Private Equity Defined • Equity capital that is not quoted on a public exchange. Private equity consists of
investors and funds that make investments directly into private companies or conduct buyouts of public companies that result in a delisting of public equity.
• A private equity investor is an individual or entity that invests capital into a private company (i.e. firms not traded on a public exchange) in exchange for equity interest in that business. In the US, there are approximately 18,000 publicly traded companies, and more than 300,000 privately held companies.
• Capital for private equity is raised from retail and institutional investors, and can be used to fund new technologies, expand working capital within an owned company, make acquisitions, or to strengthen a balance sheet.
Who Might Seek a Private Equity Investor?
•Companies looking to fund a capital need that is beyond traditional bank financing •Owners considering a partial or complete sale of their business •Managers looking to buy a business

A Brief History of Private Equity
• During the 25 years from 1980 to 2005, the top-quartile private equity firms generated annualized returns to investors of 39.1percent (net of all fees and expenses). By contrast, the S&P 500 returned 12.3 percent a year during the same period.
• Since 2006 the returns have declined and even become negative during the recession

Companies Owned by Private Equity
• J.D. Byrider
• AMC Theaters
• Linens ‘N Things
• Hertz
• Michael’s
• J. Crew
• Petco
• Travelocity
• Toys ‘R Us
• LL Bean
• Levi’s
• Bausch & Lomb
• Polaroid

Who are the investors?
• Public pension funds, university endowments, and leading foundations; these funds represent the single largest group of investors in PE and collectively accounted for one-third of all capital allocated to private equity in 2006
• Individual Investors, Other institutional investors (insurance)
Private equity strategies. EXAMPLES OF PRIVATE EQUITY FIRMS:
MOST PRIVATE EQUITY INVESTORS WILL LIMIT THEIR INVESTMENTS TO ONE OR TWO OF THE FOLLOWING STRATEGIES:
• Angel investing • Venture capital • Leveraged buyouts
(LBO)
• Growth capital • Distressed
investments • Mezzanine capital
PE Strategies and Firms
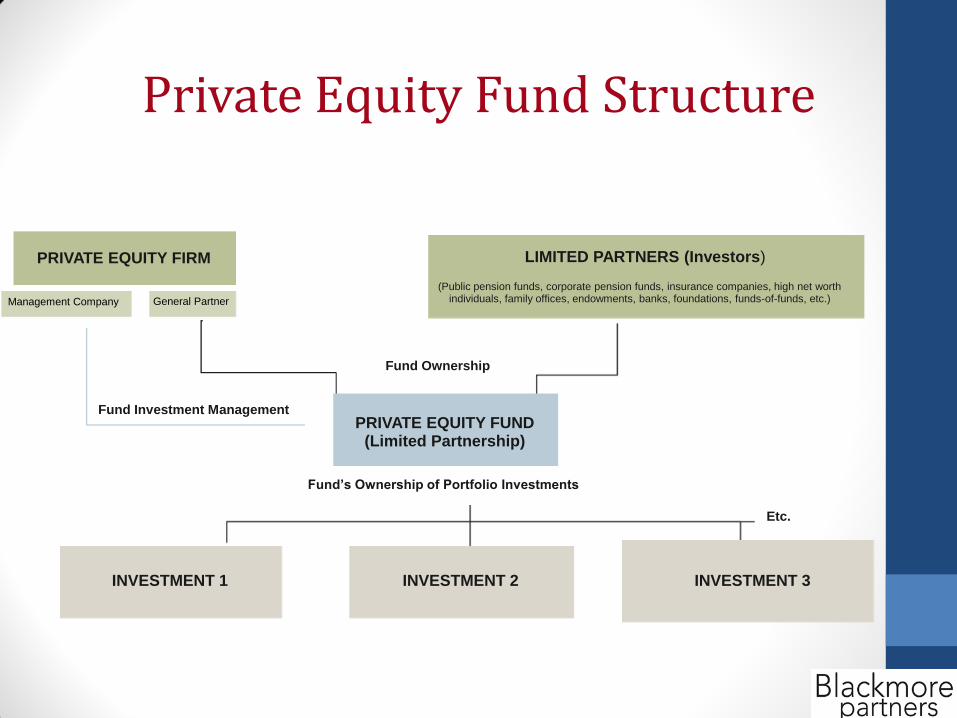
Private Equity Fund Structure
Etc.
Fund Ownership
PRIVATE EQUITY FIRM
Management Company
INVESTMENT 1 INVESTMENT 3 INVESTMENT 2
Fund Investment Management
Fund’s Ownership of Portfolio Investments
General Partner
PRIVATE EQUITY FUND
(Limited Partnership)
LIMITED PARTNERS (Investors)
(Public pension funds, corporate pension funds, insurance companies, high net worth individuals, family offices, endowments, banks, foundations, funds-of-funds, etc.)

Sources of capital for PE funds
• Firms with a dedicated fund, with the majority of the capital sourced from institutional investors (i.e. pension funds, banks, endowments, etc.) and accredited investors (i.e. high net worth individual investors)
• Firms that raise capital from investors on a per-deal basis (pledge funds)
THERE ARE TWO TYPES OF PRIVATE EQUITY FIRMS:
• Typical investment period is 3−10 years, after which capital is distributed to investors
• Rates of return are higher than public market returns, typically 15−30%, depending on the strategy
INVESTMENT DURATION AND RETURNS.
What is a Private Equity Intermediary?
• A PE intermediary sources (informs) deals to private equity firms for a fee.
• Blackmore gets “target” companies from its network of CEOs, which is termed a “deal”
• These deals are pitched to Private Equity firms as an investment package with 2 parts:
1. A CEO and management team
2. A specific company or companies

Types of Transactions by PE
• LBO (Leveraged Buy-out): The acquisition of another company using a significant amount of borrowed money (bonds or loans) to meet the cost of acquisition. Often, the assets of the company being acquired are used as collateral for the loans in addition to the assets of the acquiring company. The purpose of leveraged buyouts is to allow companies to make large acquisitions without having to commit a lot of capital.
• MBO (Management Buy-out): When the managers and/or executives of a company purchase controlling interest in a company from existing shareholders.


More Types of Transactions by PE
• Management Buy-In (MBI): Outside executive team is buying out the current management/owners
• Corporate Carve-out/Spinoff: Corporation is selling off/divesting a division of its company-can be an MBO or MBI
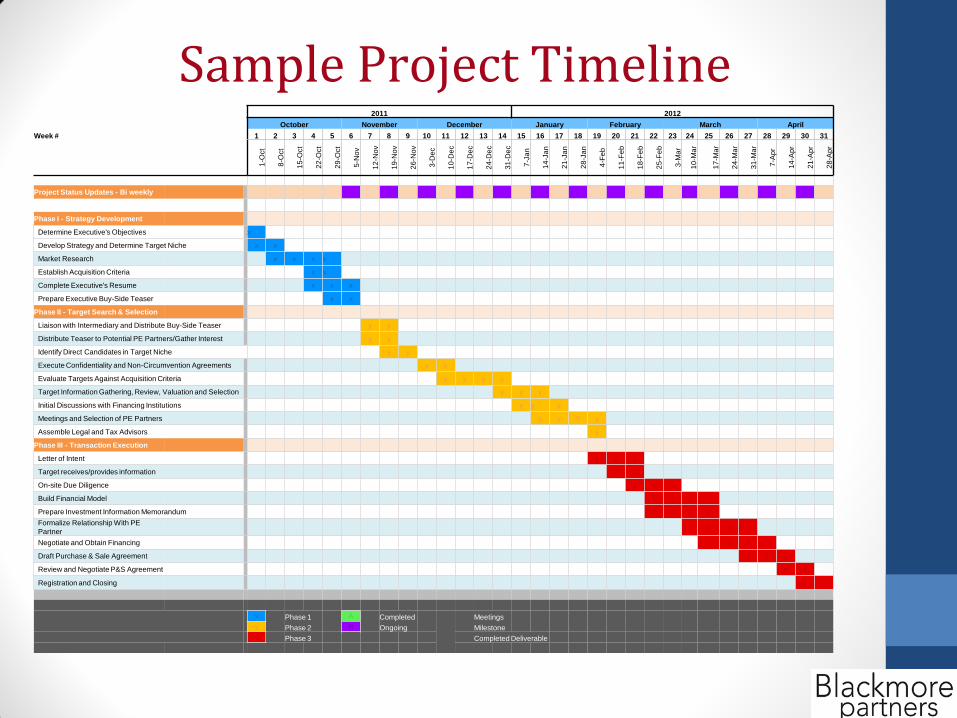
Sample Project Timeline 2011 2012
October November December January February March April
Week # 1 2 3 4 5 6 7 8 9 10 11 12 13 14 15 16 17 18 19 20 21 22 23 24 25 26 27 28 29 30 31
1-O
ct
8-O
ct
15
-Oct
22
-Oct
29
-Oct
5-N
ov
12
-No
v
19
-No
v
26
-No
v
3-D
ec
10
-De
c
17
-De
c
24
-De
c
31
-De
c
7-J
an
14
-Ja
n
21
-Ja
n
28
-Ja
n
4-F
eb
11
-Fe
b
18
-Fe
b
25
-Fe
b
3-M
ar
10
-Ma
r
17
-Ma
r
24
-Ma
r
31
-Ma
r
7-A
pr
14
-Ap
r
21
-Ap
r
28
-Ap
r
Project Status Updates - Bi weekly
Phase I - Strategy Development
Determine Executive's Objectives x
Develop Strategy and Determine Target Niche x x
Market Research x x x x
Establish Acquisition Criteria x x
Complete Executive's Resume x x x
Prepare Executive Buy-Side Teaser x x
Phase II - Target Search & Selection
Liaison with Intermediary and Distribute Buy-Side Teaser y y
Distribute Teaser to Potential PE Partners/Gather Interest y y
Identify Direct Candidates in Target Niche y y
Execute Confidentiality and Non-Circumvention Agreements y y
Evaluate Targets Against Acquisition Criteria y y y y
Target Information Gathering, Review, Valuation and Selection y y y
Initial Discussions with Financing Institutions y y y
Meetings and Selection of PE Partners y y Y y
Assemble Legal and Tax Advisors y
Phase III - Transaction Execution
Letter of Intent z z z
Target receives/provides information z z
On-site Due Diligence z z z
Build Financial Model z z z z
Prepare Investment Information Memorandum z z z z
Formalize Relationship With PE
Partner z z z z
Negotiate and Obtain Financing z z z z
Draft Purchase & Sale Agreement z z z
Review and Negotiate P&S Agreement z z
Registration and Closing z z
x Phase 1 A Completed Meetings
y Phase 2 B Ongoing Milestone
z Phase 3 Completed Deliverable
Backed Executives
Acquisition Advisors
Next Steps
1. This is a formal process in which we meet every two weeks by phone. All meetings are 15-30 minutes.
Schedule a 1 on 1 phone meeting by emailing [email protected]
2. The process will take 10 hrs a week. I will email you the next steps, involving approximately of 2 hours of due diligence on your part. 3. We will identify 100’s target by searching our database (NAICS) and by
Blackmore paying brokers who will search for targets on your behalf. In addition, we will reach out to our 8000 execs on linkedin to help you.
1. We can make this a formal process or ad-hoc 2. Send me a note at [email protected] to set up 1 on 1 phone meeting to discuss opportunities.


Pre-Seed Seed Venture and
Early Stage Growth and Expansion
Buyout and Recapitalization
• Pre-revenue/start-up
• Building management team
• Early stage product
development
• Significant market opportunity
• $500K-5MM in revenue
• Management team near
complete
• Commercial acceptance
• Significant market
opportunity
• Profitable, with TTM revenue of $3MM+
• Mature management team
• Year-over-year revenue
growth
• Defensible market position
• Revenue greater than $10MM
• Mature management team
• Growth strategy − organic or
acquisition
• Defensible market position
Seed and Angel Venture Capital
Private Equity
Mezzanine Funding
Distressed Investments
Private Equity Investment Strategies

Mission of Private Equity Funds
• Ultimately, the mangers of private equity firms understand that they must improve the underlying value of the companies they own over time to generate the returns their investors demand and to attract the capital they will want to raise for future funds.
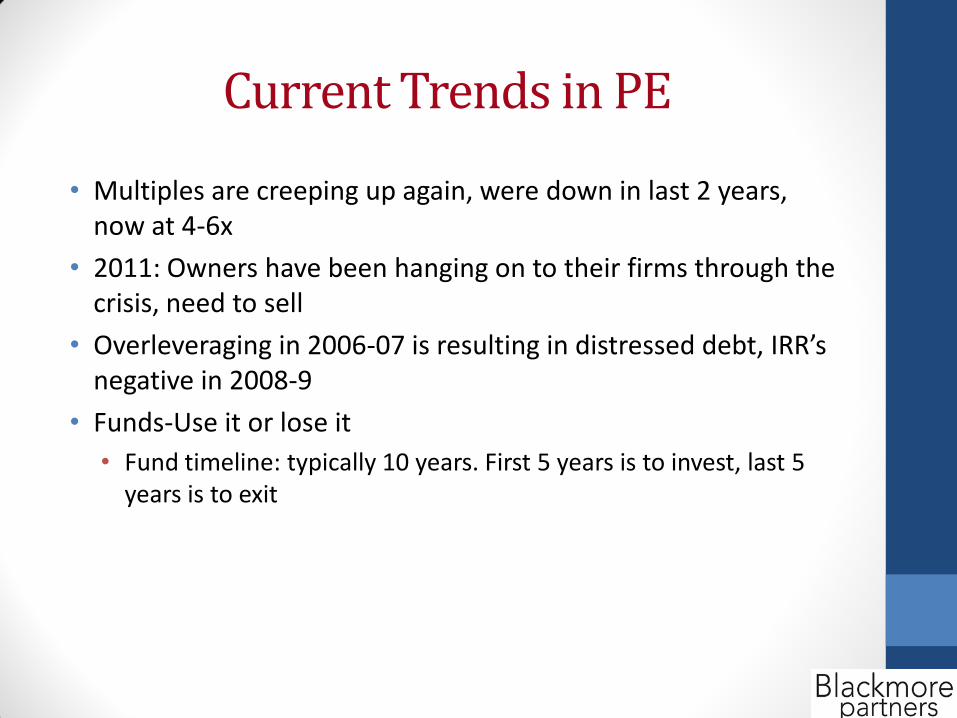
Current Trends in PE
• Multiples are creeping up again, were down in last 2 years, now at 4-6x
• 2011: Owners have been hanging on to their firms through the crisis, need to sell
• Overleveraging in 2006-07 is resulting in distressed debt, IRR’s negative in 2008-9
• Funds-Use it or lose it
• Fund timeline: typically 10 years. First 5 years is to invest, last 5 years is to exit

$40 $83
$126
$174
$305
$570
$195
$62
$158
$100
840
1,221
1,679
2,029
2,519
3,025
2,216
1,363
1,778
1,244
0
500
1,000
1,500
2,000
2,500
3,000
3,500
$0
$100
$200
$300
$400
$500
$600
2002 2003 2004 2005 2006 2007 2008 2009 2010 2011*
Capital Invested ($B) # of Deals Closed *Through 3Q 2011 Source: PitchBook
U.S. PE on Pace for Similar Year to 2010 Number of Deals Closed (red line) and Total Capital Invested by Year (blue bars)
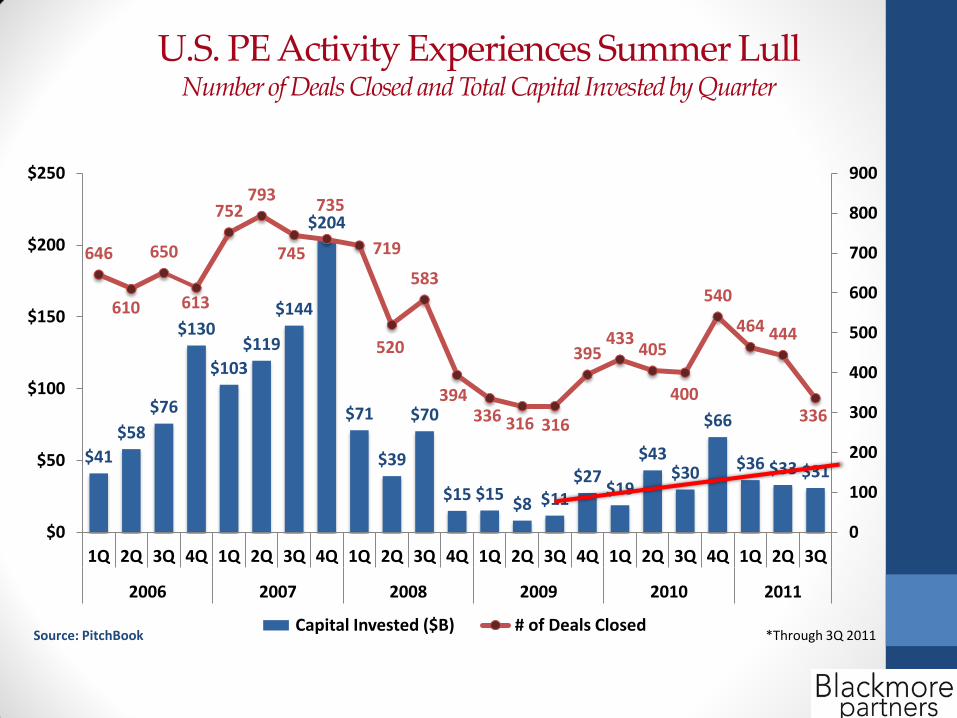
$41
$58
$76
$130
$103
$119
$144
$204
$71
$39
$70
$15 $15 $8 $11
$27 $19
$43 $30
$66
$36 $33 $31
646
610
650
613
752 793
745
735
719
520
583
394 336 316 316
395 433
405
400
540
464 444
336
0
100
200
300
400
500
600
700
800
900
$0
$50
$100
$150
$200
$250
1Q 2Q 3Q 4Q 1Q 2Q 3Q 4Q 1Q 2Q 3Q 4Q 1Q 2Q 3Q 4Q 1Q 2Q 3Q 4Q 1Q 2Q 3Q
2006 2007 2008 2009 2010 2011
Capital Invested ($B) # of Deals Closed *Through 3Q 2011 Source: PitchBook
U.S. PE Activity Experiences Summer Lull Number of Deals Closed and Total Capital Invested by Quarter
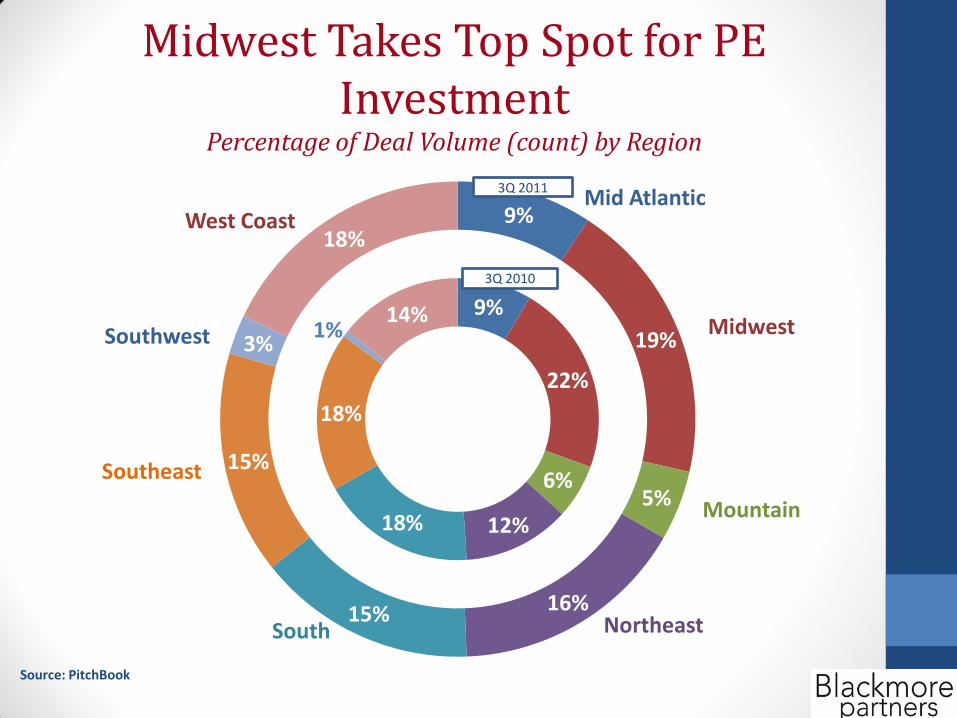
9%
22%
6%
12% 18%
18%
1% 14%
Mid Atlantic
Midwest
Mountain
Northeast South
Southeast
Southwest
West Coast 9%
19%
5%
16% 15%
15%
3%
18%
3Q 2011
3Q 2010
Source: PitchBook
Midwest Takes Top Spot for PE Investment
Percentage of Deal Volume (count) by Region
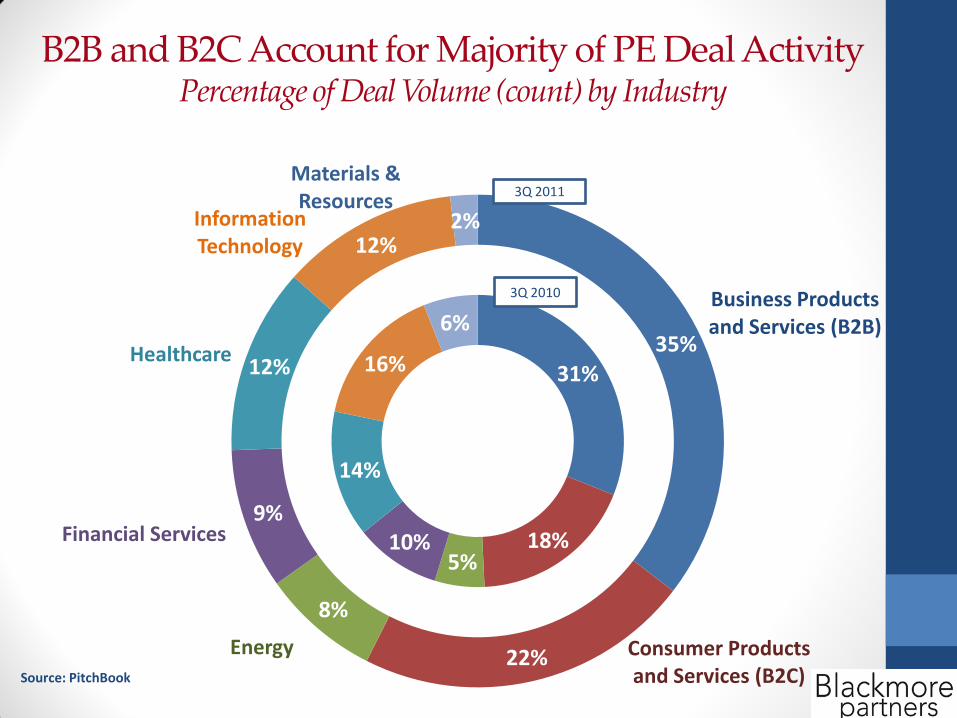
31%
18% 5%
10%
14%
16%
6% Business Products and Services (B2B)
Consumer Products and Services (B2C)
Energy
Financial Services
Healthcare
Information Technology
Materials & Resources
35%
22%
8%
9%
12%
12% 2%
3Q 2011
3Q 2010
Source: PitchBook
B2B and B2C Account for Majority of PE Deal Activity Percentage of Deal Volume (count) by Industry
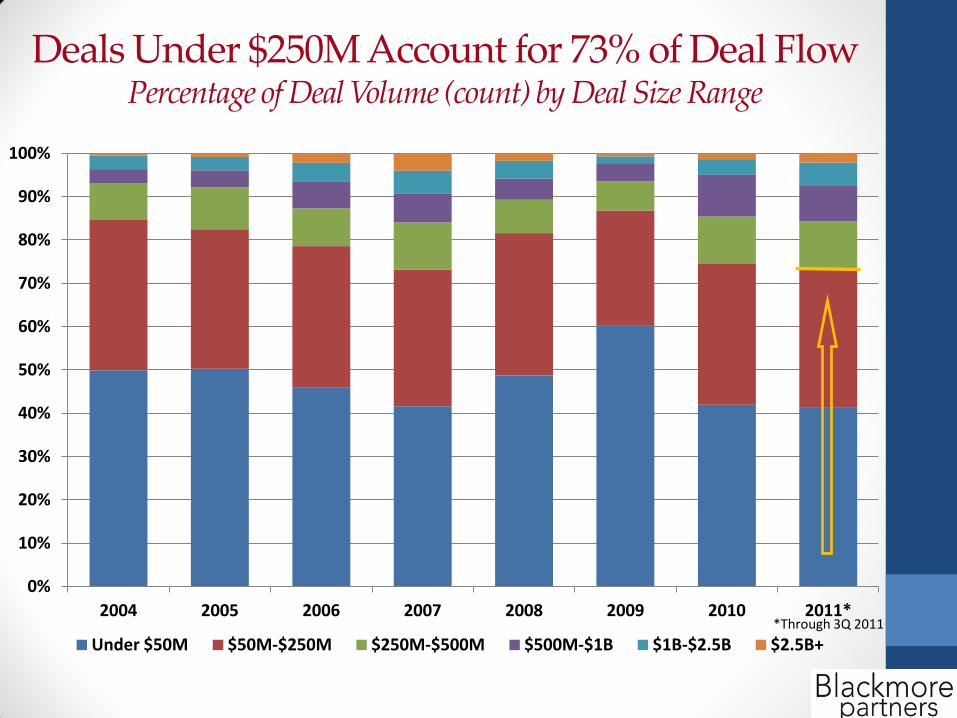
0%
10%
20%
30%
40%
50%
60%
70%
80%
90%
100%
2004 2005 2006 2007 2008 2009 2010 2011*
Under $50M $50M-$250M $250M-$500M $500M-$1B $1B-$2.5B $2.5B+ *Through 3Q 2011
Deals Under $250M Account for 73% of Deal Flow Percentage of Deal Volume (count) by Deal Size Range
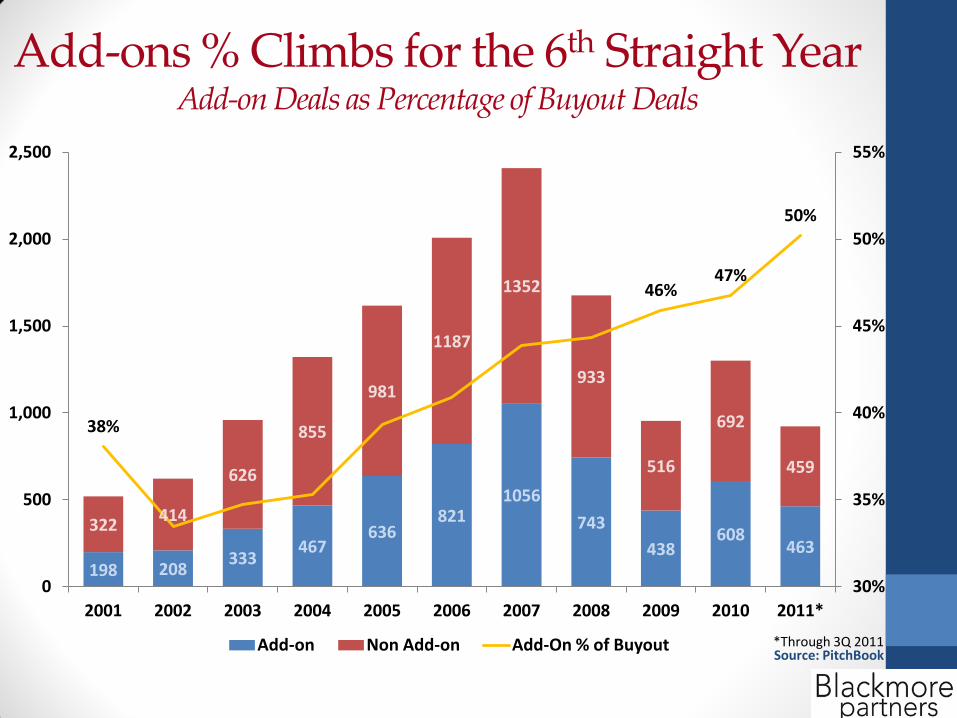
Add-ons % Climbs for the 6th Straight Year Add-on Deals as Percentage of Buyout Deals
198 208 333
467 636
821 1056
743
438 608
463 322
414
626
855
981
1187
1352
933
516
692
459
38%
46% 47%
50%
30%
35%
40%
45%
50%
55%
0
500
1,000
1,500
2,000
2,500
2001 2002 2003 2004 2005 2006 2007 2008 2009 2010 2011*
Add-on Non Add-on Add-On % of Buyout Source: PitchBook *Through 3Q 2011

48% 48%
51%
45%
40%
58% 56%
63%
71%
67%
62%
59%
35%
40%
45%
50%
55%
60%
65%
70%
75%
2002 2003 2004 2005 2006 2007 2008 2009 2010 2011*
Under $250M $250M - $1B Over $1B Source: PitchBook *Through 3Q 2011
LBOs Over $1B Using the Most Debt Percentage of Debt Used in Buyouts

4.27
3.85
4.23 3.97
3.68 3.60 3.85 3.92
4.71 4.83
0
1
2
3
4
5
6
2002 2003 2004 2005 2006 2007 2008 2009 2010 2011*
Year
s H
eld
Median Time to Exit - Yr Source: PitchBook
*Through 3Q 2011
PE Firms Holding onto Companies Longer Median Time from Buyout to Exit

U.S. PE Fundraising Experiences Summer Lull Number of Funds Closed and Total Capital Raised by Quarter
$99 $94 $73 $41 $62 $35 $12 $30 $28 $22 $26 $10 $37 $25 $17
121
58
46 43
58
31
12
31
49
31 26 27
41 34
27
0
20
40
60
80
100
120
140
$0
$20
$40
$60
$80
$100
$120
1Q 2Q 3Q 4Q 1Q 2Q 3Q 4Q 1Q 2Q 3Q 4Q 1Q 2Q 3Q
2008 2009 2010 2011
Capital Raised ($B) # of Funds Closed *Through 3Q 2011 Source: PitchBook

“Over the last few years, there has been a spectacular accumulation of PE dry powder. The U.S. PE capital overhang steadily increased each year from $197 billion in 2004 to $521 billion in 2009. However, it crested in 2009 before dropping to $477 billion as of September 30, 2010. About three-fourths of that dry powder is sitting in funds with vintage years from 2007 to 2009. While the large amount of dry powder is allowing PE firms to pursue bigger, more expensive companies, it has also contributed to a tough fundraising environment, as limited partners wait on distributions before committing capital to new funds.” PITCHBOOK DATA
Recent PE Trend: Dry Powder
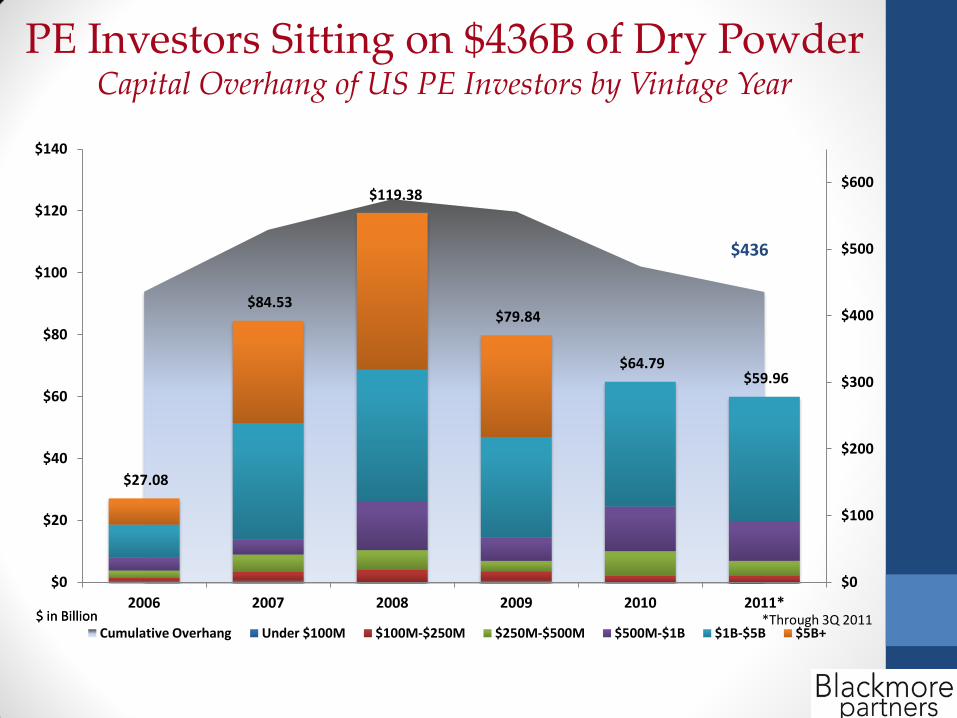
PE Investors Sitting on $436B of Dry Powder Capital Overhang of US PE Investors by Vintage Year
$27.08
$84.53
$119.38
$79.84
$64.79 $59.96
$0
$100
$200
$300
$400
$500
$600
$0
$20
$40
$60
$80
$100
$120
$140
2006 2007 2008 2009 2010 2011*
Cumulative Overhang Under $100M $100M-$250M $250M-$500M $500M-$1B $1B-$5B $5B+ $ in Billion $ in Billion
$436
*Through 3Q 2011

Types of Deals Blackmore Looks for
• Headquarters & Majority of Operations in the United States
• Revenues of $30 million+
• EBITDA of $3 million+
• Distressed Opportunities
• CEOs with Operating Experience and $100 million+ Profit/Loss
Your Role
• Understanding a business plan including operations and financials
• Writing a teaser for that plan
• Pitching the deal to different private equity firms based on geographic location, industry, size($)
• Talking to PE firms with the executive of the deal to close the PE buyout
Recommended