BRAZILIAN AGRO-INDUSTRY: THE SITUATION OF THE SECTOR AND PROJECTIONS FOR 2019


BRAZILIAN AGRO-INDUSTRY: THE SITUATION OF THE SECTOR AND PROJECTIONS FOR 2019

EXECUTIVE SUMMARY2
Founder and First PresidentLuiz Simões Lopes
PresidentCarlos Ivan Simonsen Leal
Vice-PresidentsSergio Franklin Quintella, Francisco Oswaldo Neves Dornelles, & Marcos Cintra Cavalcante de Albuquerque
BOARD OF DIRECTORS
PresidentCarlos Ivan Simonsen Leal
Vice-PresidentsSergio Franklin Quintella, Francisco Oswaldo Neves Dornelles & Marcos Cintra Cavalcanti de Albuquerque
Voting MembersArmando Klabin, Carlos Alberto Pires de Carvalho e Albuquerque, Cristiano Buarque Franco Neto, Ernane Galvêas, José Luiz Miranda, Lindolpho de Carvalho Dias, Marcílio Marques Moreira, Roberto Paulo Cezar de Andrade.
DeputiesAldo Floris, Antonio Monteiro de Castro Filho, Ary Oswaldo Mattos Filho, Eduardo Baptista Vianna, Gilberto Duarte Prado, Jacob Palis Júnior, José Ermírio de Moraes Neto, Marcelo José Basílio de Souza Marinho, Mauricio Matos Peixoto.
BOARD OF TRUSTEES
PresidentCarlos Alberto Lenz César Protásio
Vice-PresidentsJoão Alfredo Dias Lins (Klabin Irmãos e Cia)
Voting MembersAlexandre Koch Torres de Assis, Andrea Martini (Souza Cruz S.A.), Antonio Alberto Gouvea Vieira, Eduardo M. Krieger, Rui Costa (Governador do Estado da Bahia), José Ivo Sartori (Governador do Estado do Rio Grande Do Sul), José Carlos Cardoso (IRB - Brasil Resseguros S.A.), Luiz Chor, Marcelo Serfaty, Márcio João de Andrade Fortes, Murilo Portugal Filho (Federação Brasileira de Bancos), Orlando dos Santos Marques (Publicis Brasil Comunicação Ltda.), Pedro Henrique Mariani Bittencourt (Banco BBM S.A.), Raul Calfat (Votorantim Participações S.A.), Ronaldo Mendonça Vilela (Sindicato das Empresas de Seguros Privados, de Previdência Complementar e de Capitalização nos Estados do Rio de Janeiro e do Espírito Santo), Sandoval Carneiro Junior & Willy Otto Jorden Neto
DeputiesCesar Camacho, Clóvis Torres (Vale S.A.), José Carlos Schmidt Murta Ribeiro, LuizIldefonso Simões Lopes (Brookfield Brasil Ltda.), Luiz Roberto Nascimento Silva, Manoel Fernando Thompson Motta Filho, Nilson Teixeira (Banco de Investimentos Crédit Suisse S.A.), Olavo Monteiro de Carvalho (Monteiro Aranha Participações S.A.), Patrick de Larragoiti Lucas (Sul América Companhia Nacional de Seguros), Rui Barreto, Sergio Andrade e Victório Carlos de Marchi
HeadquartersPraia de Botafogo, 190, Rio de Janeiro – RJ, CEP 22250-900 ou Caixa Postal 62.591CEP 22257-970, Tel: (21) 3799-5498, www.fgv.br
Institution of technical-scientific, educational and philanthropic character, created onDecember 20th, 1944, as a legal entity of private law with the objective to act, broadly, in all subjects of scientific character, with emphasis on social sciences: administration, law and economics, contributing for the socioeconomical development of the country.
Executive DirectorCesar Cunha Campos
Technical DirectorRicardo Simonsen
Project DirectorSidnei Gonzalez
CREDITS
Technical TeamEvandro FaulinFelippe SerigatiTalita Priscila Pinto
Editorial CoordinationManuela Fantinato
Design CoordinationPatricia Werner
Graphic DesignJulia Travassos
LayoutCafé.art.br
Photoswww.shutterstock.com
This issue is avaiable for download at FGVProjetos’ website: www.fgv.br/fgvprojetos

EXECUTIVE SUMMARY
EXECUTIVE SUMMARY .................................................................................................................... 05
1. THE BRAZILIAN AGRO-INDUSTRIAL PRODUCTION INDEX (IPAGRO) ....................... 27
2. WHAT HAPPENED TO THE PRODUCTION OF BRAZILIAN AGRO-INDUSTRIES IN 2018? 33
3. THE INFLUENCE OF THE EXTERNAL SECTOR IN THE PERFORMANCE
OF AGRO-INDUSTRY ........................................................................................................................ 53
4. PROJECTIONS FOR AGRO-INDUSTRY FOR THE NEXT THREE YEARS
(2019 TO 2021) ...................................................................................................................................... 61
ATTACHMENTS ..............................................................................................................................................83
ATTACHMENT 1 – COMPOSITION OF THE AGRO-INDUSTRIAL PRODUCTION IN-
DEX - BY CNAE ............................................................................................................................83
ATTACHMENT 2 – STRUCTURE OF WEIGHTS FOR THE COMPOSITION OF THE
AGRO-INDUSTRIAL PRODUCTION INDEX .........................................................................87
ATTACHMENT 3 – ECONOMETRIC MODEL FOR AGRO-INDUSTRIES ....................... 91
ATTACHMENT 4 – ECONOMETRIC MODEL FOR THE FOOD AND BEVERAGE
GROUP ............................................................................................................................................................................95
ATTACHMENT 5 – ECONOMETRIC MODEL FOR THE NON-FOOD GROUP ............99

EXECUTIVE SUMMARY4

5BRAZILIAN AGRO-INDUSTRY: THE SITUATION OF THE SECTOR AND PROJECTIONS FOR 2019
RESUMO EXECUTIVO
The production of Brazilian agribusiness extends far beyond the production of raw mate-
rials derived from agricultural activities. This idea was present in the series of studies on the
Brazilian agro-industrial chains produced until this moment. In this direction, in the previous
studies, the following sectors of the agro-industrial chains were detailed:
Milk and dairy products;
Meat complex (beef, poultry and pork);
Wheat and derivatives;
Coffee;
Juices and teas;
Candies, peanuts and chocolate;
Cachaça;
Wines and beers.
In this report, which closes this series, will be presented the entire group of agro-industry
from the Brazilian Food and Beverage through a collection of data with an unpreceden-
ted aggregation. That s not a new information that Brazil is a country with a strong and
competitive agricultural activity in the international market. However, it is not released
that Brazilian production of agro-industrial products (i.e. of those manufactured products
whose main raw materials derived from agricultural activities) it is responsible for a sig-
nificant fraction of Brazilian industrial production (35.6%), as well as being responsible
for one robust balance of the national trade balance (US$ 28.4 billion).
In this direction, through the data of the IBGE Monthly Industrial Survey, it was created
the Brazilian Agro-industrial Production Index (IPAgro). This index, which allows mon-
thly monitoring of the evolution of the national agro-industry since 2002, is composed
of the two main segments of the agro-industry: Food and Beverage agro-industry;
and Agro-industry of Non-Food products. The aim of this report is to present the
agro-industry of Food and Beverages, presenting in detail the evolution in recent ye-
ars, especially in 2018, as well as its interactions with international trade. Finally, once
EXECUTIVE SUMMARY6
described the macroeconomic variables that influence the performance of this sector
have been made, this report, using econometric models, will also present projections
for the agro-industry of Foods and Beverages for the next three years (from 2019 to
2021) considering three scenarios (baseline, optimistic and pessimistic).
In summary, this report demonstrate that the Brazilian agro-industry of food and
beverages:
It is responsable for a relevant fraction of national industrial activity;
It follows the same trends observed for the general industry and, therefore, has
less connection with the movements of agricultural markets;
Due to the less elastic demand of its products, it tends to respond to economic
fluctuations in a more modest way;
Has a structurally surplus trade balance; and
It should register expansion in the coming years; however, the intensity of this
growth is strongly associated with the performance of the Brazilian economy,
the confidence of the industrial entrepreneur and the level at which the exchan-
ge rate should operate.
The next paragraphs of these results will be presented in more detail.
WHAT IS THE BRAZILIAN AGRO-INDUSTRY?
From the classic agribusiness definition from Davis and Rolemberg (1957) 1, this report
delimits agro-industry as the group of activities related to (i) the transformation of raw
materials used by agricultural production (such as inputs, tractors and other machinery
and equipment) and (ii) the transformation of agricultural raw materials into manufactured
products (such as food and beverage production). The evolution of the production from
agro-industry products was measured based on data available with the national scope
of IBGE's Monthly Industrial Survey (PIM). With this data, it was possible to construct the
Brazilian Agro-industrial Production Index (IPAgro) composed of two main segments:
Food and Beverages; and Non-Food Products. Figure I describes the IPAgro's breakdowns
and shows the weight of each segment/sector within the index.
1 DAVIS, J. H.; GOLDBERG, R.A. A concept of agribusiness. Division of Research. Graduae School of Business Admin-
istration. Boston: Harvard University, 1957.

7BRAZILIAN AGRO-INDUSTRY: THE SITUATION OF THE SECTOR AND PROJECTIONS FOR 2019
Figure I
STRUCTURE OF THE AGRO-INDUSTRIAL PRODUCTION INDEX
AGRO-INDUSTRY
(100.0%)
FOOD ANDBEVERAGE
(51.6%)
NON-FOODPRODUCTS
(48.4%)
BIOFUELS
(3.1%)
RUBBER
(3.4%)
TOBACCO
(3.8%)
AGRICULTURALINPUTS
(7.9%)
FORESTPRODUCTS
(12.7%)
TEXTILES
(17.4%)
FOOD
(41.3%)BEVERAGE
(10.3%)
ANIMAL ORIGIN
(21.6%)
VEGETAL ORIGIN
(19.7%)
ALCOHOLIC
(5.2%)
NON-ALCOHOLIC
(5.1%)
Source: Prepared by FGV.
* In parentheses, the weight of each sector in IPAgro.
As can be observed from Figure I, all the main sectors that make up the agro-industry
of foods and beverages were detailed in isolation in previous studies in this series. In this
latest report, based on this unprecedented aggregation of the numbers available in the
IBGE Monthly Industrial Survey, it was possible to analyze the performance of the Brazilian
food and beverage agro-industry aggregate, comparing its evolution with some of the
main macroeconomic variables and with the other large agro-industry segment, namely
the production of non-food products.

EXECUTIVE SUMMARY8
HOW THE AGRO-INDUSTRY INTERACT WITH THE REST OF THE ECONOMY?
Once with the data available of agro-industry, it was clear that this sector follows the same
trends as the Brazilian economy and the national industry (Graph I). In other words, the
analyses about the scenarios for the Brazilian economy can be extrapolated to evaluate
the trajectory of the agro-industry, but with one important note: economic fluctuations
tend to be less intense in agro-industry. According to Figure III, behind this characteris-
tic is precisely the behavior of the beverage food segment of the agro-industry; as the
demand for these goods is, on average, more inelastic, it is natural that their response
to economic fluctuations should be less intense. Still according to Graph II, it is worth to
mention that the movements in the segment of non-food products of the agro-industry
presented higher adherence to the oscillations of the Brazilian general industry.
Graph I
EVOLUTION OF AGRO-INDUSTRY AND GENERAL INDUSTRY (CUMULATIVE VARIATION IN 12 MONTHS -%)
-15.0
-10.0
-5.0
0.0
5.0
10.0
15.0
dec-
03
nov-
04
oct-05
sep-
06
aug-
07
jul-0
8
jun-
09
may
-10
apr-11
mar
-12
feb-
13
jan-
14
dec-
14
nov-
15
oct-16
sep-
17
aug-
18
AGRO-INDUSTRY GENERAL INDUSTRY
Source: IBGE 2. Prepared by FGV.
2 Available at: https://sidra.ibge.gov.br/tabela/3650

9BRAZILIAN AGRO-INDUSTRY: THE SITUATION OF THE SECTOR AND PROJECTIONS FOR 2019
Graph II
EVOLUTION OF AGRO-INDUSTRY, FOOD AND BEVERAGE AND NON-FOOD PRODUCTS (ACCUMULATED VARIATION IN 12 MONTHS -%)
-15.0
-10.0
-5.0
0.0
5.0
10.0
dec-
03
jul-04
feb-
05
sep-
05
apr-
06
nov-
06
jun-
07
jan-
08
aug-
08
mar
-09
oct-
09
may
-10
dec-
10ju
l-11
feb-
12se
p-12
apr-
13no
v-13
jun-
14ja
n-15
aug-
15m
ar-16
oct-
16m
ay-17
dec-
17ju
l-18
AGRO-INDUSTRY FOOD AND BEVERAGE NON-FOOD PRODUCTS
Source: IBGE 3. Prepared by FGV.
Finally, although the agro-industry, whether it be food and drink, whether it is non-food
products, respond in the same direction as the national industry to the movements of
the economy, this response occurs in different intensities. This information is crucial to
analyze the performance of the sector in 2018 and to design scenarios for agro-industry
for the coming years.
3 Available at: https://sidra.ibge.gov.br/tabela/3650

EXECUTIVE SUMMARY10
HOW WAS THE YEAR 2018 FOR THE AGRO-INDUSTRY?
In the previous section, it was clear that agro-industry, in its two main segments (food
and beverages, and non-food products), goes in line with the national economic scenario.
However, although they follow the same trend, each segment has particular characte-
ristics that condition the intensity of its responses to economic shocks. This reflection is
important to explain the performance of these segments during 2018.
In 2017, the Brazilian economy showed consistent signs that it could return a growth
trajectory more robust and sustainable. This dynamic even surpassed the year 2018, as
illustrated by the evolution of Focus's projections for the growth of the Brazilian economy
in 2018. As can be seen in Graph III, since the end of the third quarter of 2017, the market
has been forming the expectation that the Brazilian economy would grow more and more
rapidly in 2018. In March 2018, economic growth in the year reached almost 3.0% per year
However, from that moment on, two major events disrupted the economy and, conse-
quently, retracted those projections:
The proximity of the elections and the end of the term of President Michel Temer,
the political capital of the government was eroding and undermining the expec-
tation that it would be possible to approve in 2018 some of the most important
economic reforms, with special emphasis on pension reform; and
The truck drivers' strike that began in the third week of May, however, whose
effects affected the performance of practically the economic sectors, including
agro-industry and its segments.

11BRAZILIAN AGRO-INDUSTRY: THE SITUATION OF THE SECTOR AND PROJECTIONS FOR 2019
Graph III
EVOLUTION OF THE FORECAST GDP GROWTH FROM 2018 (% YOY)
1.25
1.00
1.20
1.40
1.60
1.80
2.00
2.20
2.40
2.60
2.80
3.00
01/
02/
2017
01/
30/2
017
03/
01/
2017
03/
29/2
017
04/
28/2
017
05/
29/2
017
06/
27/2
017
07/
25/2
017
08/
22/2
017
09/
20/2
017
10/1
9/20
1711/2
0/2
017
12/1
8/20
1701/
17/2
018
02/
16/2
018
03/
16/2
018
04/
16/2
018
05/
15/2
018
06/
13/2
018
07/
11/2
018
08/
08/
2018
09/
05/
2018
10/0
4/20
1811/0
5/20
1812
/04/
2018
01/
03/
2019
01/
31/2
019
Source: Focus Bulletin 4 from 02/01/2017 until 27/02/2019 – median.
Again, observing the evolution of Brazilian GDP growth expectations throughout 2018,
it is clear how strong the truck drivers' strike affected the country's economy. The num-
bers practically "speak for themselves": on March 7, 2018, the Focus Bulletin showed a
GDP growth projection of 2.9% for the year. On June 21, 2018, one month after the first
day of the strike, the growth forecast of the Brazilian economy was only 1.6% YoY. At the
end of the year, the median of the projections already operated at 1.3% YoY. Finally, from
the official IBGE numbers released at the end of February 2019, the Brazilian GDP ended
the year 2018 with an expansion of 1.1%; clearly below the value projected by the market
prior to the truck strike (Graph iv).
4 - Available at: https://www3.bcb.gov.br/expectativas/publico/consulta/serieestatisticas

EXECUTIVE SUMMARY12
Graph IV
GDP GROWTH IN 2018, FROM THE PRODUCTION PERSPECTIVE (% YOY)
1.1
0.1
0.6
1.3
GDP LIVESTOCK FARMING INDUSTRY SERVICES
Source: IBGE 5.
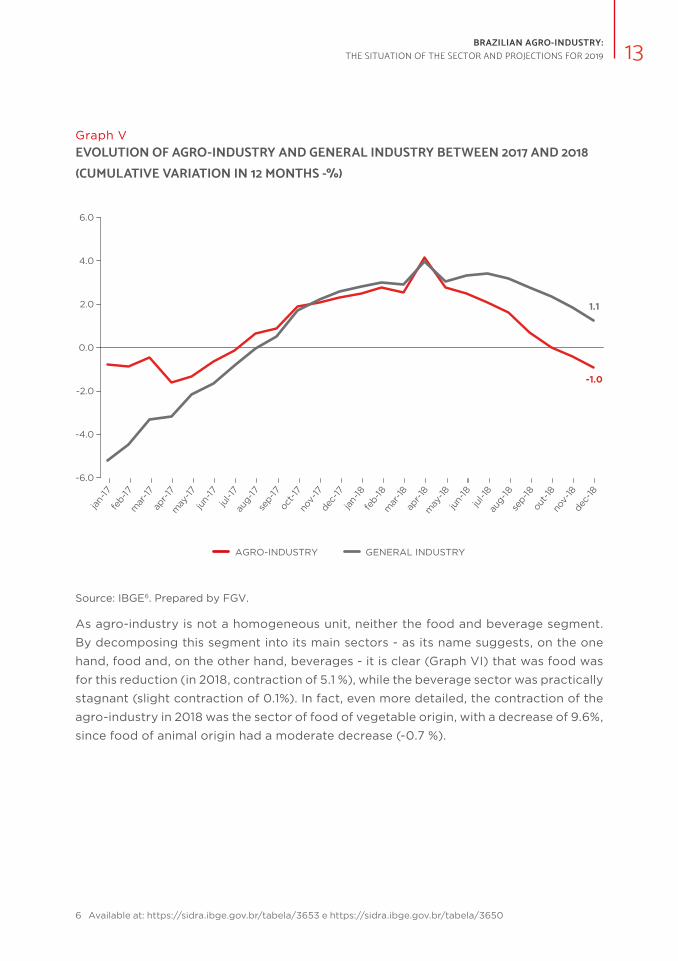
Like the Brazilian economy, both industry and agro-industry were catching up on their
growth in 2017, but with a strong slowed during 2018, notably after the truck drivers’ strike.
However, each segment responded to this situation with different intensities: while the
general industry slowed but ended the year with a positive growth of 1.1%, the agro-indus-
try ended the year in the negative field, with a contraction of 1.0 % over 2017 (Graph V).
5 Available at: https://sidra.ibge.gov.br/tabela/5932
13BRAZILIAN AGRO-INDUSTRY: THE SITUATION OF THE SECTOR AND PROJECTIONS FOR 2019
Graph V
EVOLUTION OF AGRO-INDUSTRY AND GENERAL INDUSTRY BETWEEN 2017 AND 2018 (CUMULATIVE VARIATION IN 12 MONTHS -%)
-1.0
1.1
-6.0
-4.0
-2.0
0.0
2.0
4.0
6.0
jan-
17fe
b-17
mar
-17
apr-
17m
ay-17
jun-
17ju
l-17
aug-
17se
p-17
oct-
17no
v-17
dec-
17ja
n-18
feb-
18m
ar-18
apr-
18m
ay-18
jun-
18ju
l-18
aug-
18se
p-18
out-
18no
v-18
dec-
18
AGRO-INDUSTRY GENERAL INDUSTRY
Source: IBGE 6. Prepared by FGV.
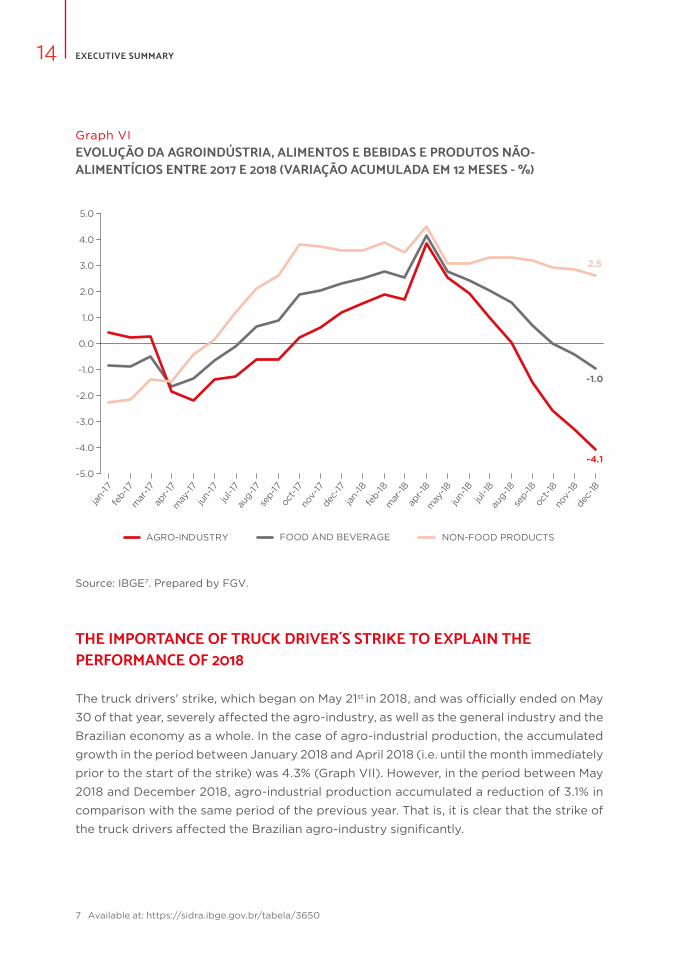
As agro-industry is not a homogeneous unit, neither the food and beverage segment.
By decomposing this segment into its main sectors - as its name suggests, on the one
hand, food and, on the other hand, beverages - it is clear (Graph VI) that was food was
for this reduction (in 2018, contraction of 5.1 %), while the beverage sector was practically
stagnant (slight contraction of 0.1%). In fact, even more detailed, the contraction of the
agro-industry in 2018 was the sector of food of vegetable origin, with a decrease of 9.6%,
since food of animal origin had a moderate decrease (-0.7 %).
6 Available at: https://sidra.ibge.gov.br/tabela/3653 e https://sidra.ibge.gov.br/tabela/3650
EXECUTIVE SUMMARY14
Graph VI
EVOLUÇÃO DA AGROINDÚSTRIA, ALIMENTOS E BEBIDAS E PRODUTOS NÃO-ALIMENTÍCIOS ENTRE 2017 E 2018 (VARIAÇÃO ACUMULADA EM 12 MESES - %)
-1.0
-4.1
2.5
-5.0
-4.0
-3.0
-2.0
-1.0
0.0
1.0
2.0
3.0
4.0
5.0
jan-
17fe
b-17
mar
-17
apr-
17m
ay-17
jun-
17ju
l-17
aug-
17se
p-17
oct-
17no
v-17
dec-
17ja
n-18
feb-
18m
ar-18
apr-
18m
ay-18
jun-
18ju
l-18
aug-
18se
p-18
oct-
18no
v-18
dec-
18
AGRO-INDUSTRY FOOD AND BEVERAGE NON-FOOD PRODUCTS
Source: IBGE 7. Prepared by FGV.
THE IMPORTANCE OF TRUCK DRIVER´S STRIKE TO EXPLAIN THE PERFORMANCE OF 2018
The truck drivers' strike, which began on May 21st in 2018, and was officially ended on May
30 of that year, severely affected the agro-industry, as well as the general industry and the
Brazilian economy as a whole. In the case of agro-industrial production, the accumulated
growth in the period between January 2018 and April 2018 (i.e. until the month immediately
prior to the start of the strike) was 4.3% (Graph VII). However, in the period between May
2018 and December 2018, agro-industrial production accumulated a reduction of 3.1% in
comparison with the same period of the previous year. That is, it is clear that the strike of
the truck drivers affected the Brazilian agro-industry significantly.
7 Available at: https://sidra.ibge.gov.br/tabela/3650

15BRAZILIAN AGRO-INDUSTRY: THE SITUATION OF THE SECTOR AND PROJECTIONS FOR 2019
This reduction on performance after the strike also occurred in the two segments of the
agro-industry, but with greater intensity in food and beverage production than in the non-
-food segment (Graph VIII). Before the strike, the food and beverage segment accumulated
growth of 4.1%, however, in the period after the strike, the production of this group redu-
ced by 7.2%. In the case of non-food products, despite the notable deceleration caused
by the standstill, accumulated growth in the post-strike period was not negative (1.8%).
Graph VII
AGGREGATE GROWTH IN THE PRODUCTION PERIOD OF AGRO-INDUSTRY, FOOD AND BEVERAGE AND NON-FOOD PRODUCTS (%)
4.3
-3.1
4.5
1.8
4.1
-7.2
AGRO-INDUSTRY NON-FOOD PRODUCTS FOOD AND BEVERAGE
JAN/18 TO APR/18 MAY/18 TO DEC/18
Source: IBGE 8. Prepared by FGV.
8 Available at: ttps://sidra.ibge.gov.br/tabela/3650

EXECUTIVE SUMMARY16
THE CONTRIBUTION OF THE EXTERNAL SECTOR TO THE PERFORMANCE OF AGRO-INDUSTRY
It is almost universally known that Brazil is a major exporter of products associated with
agribusiness, accumulating persistent surpluses in the trade balance of the sector. However,
in general, the complete numbers of the agro-industry are not counted in these analyzes.
Therefore, does the agro-industry also have a surplus trade balance or is this positive
balance restricted to agricultural products?
According to the Comex Stat numbers, and organized the same segments and sectors of
the Agro-industrial Production Index, the Brazilian agro-industry trade balance has also
been persistently surplus (Graph VIII). However, this surplus is not widespread within the
agro-industry. While the food and beverage segment has been consistently in surplus, Brazil
has recorded continuous deficits in the trade balance of non-food products (Graph IX).
For example, in 2018, agro-industry exports surpassed their imports by US$ 28.4 billion.
In a disaggregated way, while the balance of trade in the food and beverage segment was
a surplus of US$ 28.7 billion, that of non-food products was a deficit of US$ 269.6 million.
Graph VIII
BRAZILIAN AGRO-INDUSTRY TRADE BALANCE (IN US$ BILLION)
23.421.8
32.9
30.9
27.2 27.5
31.132.0
28.4
2010 2011 2012 2013 2014 2015 2016 2017 2018
Source: Prepared by FGV based on data from Comex Stat 9.
9 Available at: http://comexstat.mdic.gov.br/pt/geral

17BRAZILIAN AGRO-INDUSTRY: THE SITUATION OF THE SECTOR AND PROJECTIONS FOR 2019
Graph IX
TRADE BALANCE OF THE FOOD AND BEVERAGE AND THE INDUSTRY OF NON-FOOD PRODUCTS (US$ BILLION)
28.7
-0.3
-10.0
-5.0
0.0
5.0
10.0
15.0
20.0
25.0
30.0
35.0
40.0
2010
2011
2012
2013
2014
2015
2016
2017
2018
2010
2011
2012
2013
2014
2015
2016
2017
2018
FOOD AND BEVERAGE NON-FOOD PRODUCTS
Source: Prepared by FGV based on data from the Comex Stat 10.
Disaggregating the segment of food and beverages, it is observed that who really made
positive the commercial balance of the agro-industry was the food sector (balance of
US$ 29.4 billion), since the beverage sector had a deficit of US$ 676.4 million. By decom-
posing, the food sector, it is clear that both the food sub-sector of plant origin and that
of food of animal origin have surplus balances (of US$ 16.1 billion and US$ 13.3 billion,
respectively) (Graph X).
10 Available at: http://comexstat.mdic.gov.br/pt/geral

EXECUTIVE SUMMARY18
Graph X
TRADE BALANCE OF FOOD OF PLANT ORIGIN AND FOOD OF ANIMAL ORIGIN AND ITS ACTIVITIES (IN US$ BILLION)
16.09
Veg
etab
le O
rigin
6.86
Oil
and
Fat
6.52
Suga
r Ref
inin
g
2.20
Can
ned
0.53
Cof
fee
Grin
ding
0.08
Ric
e
-0.11
Whe
at G
rindi
ng
13.27
Ani
mal
Orig
in
7.33Sl
augh
ter of
Sw
ine
and
Poul
try
6.63
Slau
ghte
r of
Nea
t
0.19
Mea
t Pr
oduc
ts
-0.41
Fish
-0.47
Dai
ry P
rodu
cts
Source: Prepared by FGV based on data from Comex Stat 11.
Despite the accumulated surplus in 2018, compared to 2017, this balance was 11.4% lower.
This retraction in the balance goes in the same direction of the contraction of the agro-
-industry production in the same year. That is, possibly part of the contraction of agro-in-
dustrial production (-1.0%) in 2018 occurred due to the reduction in exports of products
related to the agro-industry, since while imports of these goods increased by 8.6%, ex-
ports declined by -2.8% in the year. Finally, the reduction in the production of food and
beverage industry (-4.1%) may also be correlated with the reduction in exports (-10.0%)
of the products of this group. The expansion of agro-industrial production of Non-Food
Products (2.5%) should have been positively impacted by the increase in exports (13.2%)
of the products of this group in 2018 (Graph XI).
11 Available at: http://comexstat.mdic.gov.br/pt/geral

19BRAZILIAN AGRO-INDUSTRY: THE SITUATION OF THE SECTOR AND PROJECTIONS FOR 2019
Graph XI
ANNUAL VARIATION OF EXPORTS AND IMPORTS OF AGRO-INDUSTRY AND THEIR GROUPS IN 2018 (% YOY)
-2.8%
8.6%
-10.0%
-1.9%
13.2%12.2%
EXPORTS IMPORTS
AGRO-INDUSTRY NON-FOOD PRODUCTS FOOD AND BEVERAGE
Source: Prepared by FGV based on data from Comex Stat 12.
WHAT ARE THE SCENARIOS FOR AGRO-INDUSTRY THE NEXT THREE YEARS (2019 TO 2021)?
Once an index was built that allows to follow the evolution of the food and beverage in-
dustry in Brazil, besides to be possible to compare its performance with that presented by
the other segments of the national agro-industry, it was also possible to estimate a group
of models to project the sector's trajectory to the next triennium (2019 to 2021) in three
distinct scenarios (baseline, optimistic and pessimistic) 13. From the estimated models, it
was clear that the performance of the food and beverage agro-industry responds to the
movements of three main variables:
12 Available at: http://comexstat.mdic.gov.br/pt/geral
13 Details of the models and their estimation process will not be presented here in the Executive Summary but are
described in Chapter 4 of this report.

EXECUTIVE SUMMARY20
Central Bank Economic Activity Index (IBC-Br): This index is a contemporary
monthly indicator of national economic activity and is used by analysts as a
proxy for the behavior of Brazilian GDP. According to the estimated model, at
each growth of 1% of GDP, the food and beverage agro-industry absorbs an
expansion of, on average, 0.87%. It is important to highlight that this result was
already present in Graph i, where it was clear that the food and beverage sector
follows the fluctuations of economic activity, but in a less intense way;
Confidence Index of the Transformation Industry of the Getulio Vargas
Foundation (ICI-FGV): This index reflects the expectation of the industrial
company for both the actual economic conditions and their perception of future
conjuncture. On average, a 1% increase in the confidence of industrial business
and reflects in an expansion of 0.17%, no volume of production of food and be-
verage agro-industry;
Exchange Rate: according to the estimated model, there is a positive relation
between the variation of the exchange rate and the volume of production of the
food and beverage agro-industry. In other words, if the economic activity and
the industrial entrepreneur's confidence are kept constant, the more the real is
depreciated (the higher the value of the exchange rate), the greater the growth
of this segment of the agro-industry. In numbers: at each 1% increase in the value
of the exchange rate, the volume produced tends to grow, on average of 0.14%.
Based on these relationships (in reality, elasticities) between the variables described abo-
ve and the production volume of the food and beverage agro-industry, three scenarios
were assumed for the Brazilian economy:
Baseline scenario, it was assumed that there would still be turbulence on the
political side in 2019 and that the government would therefore have difficulty
approving the necessary reforms and would be able to make more limited ver-
sions available. For the two subsequent years (2020 and 2021), it was assumed
that, on the one hand, reforms, even if limited, would slightly boost the expan-
sion of the economy, but on the other, the government's political capital will be
running out in a reasonably accelerated. With this, the following values were
assumed for the variables previously described:
21BRAZILIAN AGRO-INDUSTRY: THE SITUATION OF THE SECTOR AND PROJECTIONS FOR 2019
The IBC-Br (proxy for GDP) is growing more rapidly in 2019 (2.28%) and 2020
(2.80%), but loses its breath in 2021 (2.50%). These values are in line with the pro-
jections available in the Focus Survey of the Central Bank and this dynamics is
explained by the continuity of the slow recovery of the economy started in 2017;
Due to economic recovery and even limited approval of structural reforms, it
was assumed that the industrial entrepreneur's confidence (ICI-FGV) should
grow 10.0% in 2019 and 7.5% in 2020 and 2021. For these values, the ICI growth
rates of 2017 (12.5%, more optimistic) and 2018 (6.6%, less optimistic) were used;
With the moderate recovery of the economy, Central Bank Focus Survey pro-
jections suggest that the real should continue its devaluation trajectory, but at
a much more moderate pace than that observed in 2018 (14.5%). In light of this,
Focus's projections point to an exchange rate growth of 1.37% in 2019, from
1.92% in 2020 and 2.74% in 2021.
Optimistic scenario, it was assumed that the government could approve the
reform agenda with relative ease. These results boost the economy more subs-
tantially and give President Jair Bolsonaro's team more lasting political capital.
For the years 2020 and 2021, the optimistic scenario is associated with the
"harvesting" of the fruits of this reform agenda. With this, the following values
were assumed for the variables previously described:
The IBC-Br (proxy for GDP) has grown in the three years (2019 to 2021) at a pace
similar to that observed in 2013, the last year in which the economy showed a
more robust growth rate (above 3.0%). Thus, using the projection ceiling of the
Focus Survey of the Central Bank, the IBC-Br is expected to grow by 3.13% in
2019, 3.70% in 2020 and 3.50% in 2021;
Due to the presumption of a somewhat more favorable pace of expansion of the
economy and the maintenance of the strength of the government's political ca-
pital, the confidence of the industrial entrepreneur (ICI-FGV) increases again at
a stronger pace, as observed in 2017 : 15% in 2019 and 10% in the next two years;
With the economy growing more robustly and the industrial entrepreneur's
confidence showing significant expansion, the trend is that Brazil will become
increasingly attractive to foreign investors and that, therefore, the real will
appreciate. Thus, using the Focus Survey projections floor, in this scenario,
the exchange rate is expected to shrink from 5.21% in 2019, from 10.41% in
2020 to 9.59% in 2021.

EXECUTIVE SUMMARY22
Pessimistic scenario, was assumed that, given the difficulties of forming a
majority with the Congress and due to the problems/denunciations involving
people close to the president, the reform agenda did not advance and, finally,
economic growth lost its breath. This situation would lead to stagnation in the
labor market, the credit market and the expectations of the agents for the next
three years (2019, 2020 and 2021). With this, the following values were assumed
for the variables previously described:
Due to the deterioration of the political capital of the government, the necessary
reforms do not evolve in Congress, the recovery of the labor market is com-
promised, as the credit market is stagnant, reflecting negatively the economic
growth of the country. In this scenario, the IBC-Br (proxy for GDP) is expected
to grow only 1.20% in 2019, and to maintain a constant growth of 2.0% in 2020
and 2021 - in line with the floor of the Focus Survey Central bank;
Given the dynamics of the slow recovery of the economy and the erosion of the
government, the industrial entrepreneur's confidence (ICI-FGV) is expected to
deteriorate, with a steady decline of 10.0% between 2019 and 2021;
Lastly, with the economy growing little and the industrial entrepreneur's con-
fidence declining, the tendency is for the real to lose more and more value. In
view of this, the exchange rate is expected to grow by 8.22% in 2019, from 19.73%
in 2020 and by 25.75% in 2021 - again, in line with the projection ceiling of the
Focus Survey of the Central Bank.
Table I presents an overview of the assumptions for each variable and that will be used
in the projections detailed in the sequence.

23BRAZILIAN AGRO-INDUSTRY: THE SITUATION OF THE SECTOR AND PROJECTIONS FOR 2019
Table I
SUMMARY OF THE ASSUMPTIONS FOR THE SIMULATION OF THE SCENARIOS PROJECTS FOR THE FOOD AND BEVERAGE AGRO-INDUSTRY
PERÍODO
SCENARIOS
PESSIMISTIC BASELINE OPTIMISTIC
GDP (% YoY)
2019 1.20 2.28 3.13
2020 2.00 2.80 3.70
2021 2.00 2.50 3.50
Trust of the entrepreneur
2019 -10.00 10.00 15.00
2020 -10.00 7.50 10.00
2021 -10.00 7.50 10.00
Exchange rate (% YoY)
(ref. 2018: R$ 3.65 / US$)
2019 8.22 1.37 -5.21
2020 19.73 1.92 -10.41
2021 25.75 2.74 -9.59
Exchange rate (R$ / US$)
(end of period)
2019 3.95 3.70 3.46
2020 4.73 3.77 3.10
2021 5.95 3.88 2.81
Source: Research Focus Central Bank 14, Prepared by FGV.
14 Available at: https://www3.bcb.gov.br/expectativas/publico/consulta/serieestatisticas

EXECUTIVE SUMMARY24
PROJECTIONS FOR AGRO-INDUSTRY OF FOOD AND BEVERAGE FOR THE NEXT THREE YEARS (2019-2021)
Considering the assumed model and the premises adopted, is estimated that, in the base-
line scenario, food and beverage production is expected to grow by 2.83% in the baseline
scenario in 2019 compared to the previous year. However, in a pessimistic scenario, the
food and beverage industry may show a more modest expansion in 2019 (0.49%) and, in
an optimistic scenario, the projection is strong (3.34%). For the years 2020 and 2021, it is
projected that the food and beverage industry should grow at the same rate as in 2019,
with a 2.95% expansion for 2020 and 2.83% YoY for 2021 (Graph XI).
Graph XI
PROJECTED VALUES FOR THE GROWTH OF THE INDUSTRIAL PRODUCTION OF FOOD AND BEVERAGES BETWEEN 2019 AND 2021 (% YOY)
0.49
2.83
3.34
2.15
2.95
2.65 2.74 2.832.60
2019 2020 2021
PESSIMISTIC BASELINE OPTIMISTIC
Source: IBGE 15. Prepared by FGV.
To put these growth rates in perspective, the same variables were used to model the perfor-
mance of the total agro-industry and the same premises to simulate the same three scenarios
(baseline, optimistic and pessimistic). From these numbers, is estimated that, in the baseline
scenario, the total agro-industry production, in the baseline scenario, is expected to grow by
15 Available at: https://sidra.ibge.gov.br/tabela/3650
25BRAZILIAN AGRO-INDUSTRY: THE SITUATION OF THE SECTOR AND PROJECTIONS FOR 2019
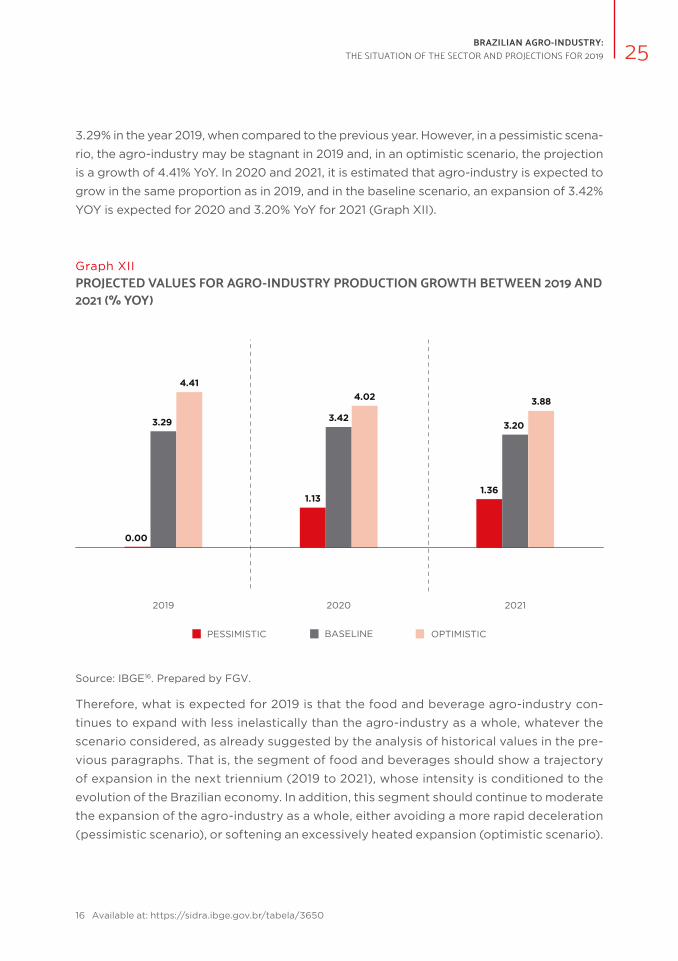
3.29% in the year 2019, when compared to the previous year. However, in a pessimistic scena-
rio, the agro-industry may be stagnant in 2019 and, in an optimistic scenario, the projection
is a growth of 4.41% YoY. In 2020 and 2021, it is estimated that agro-industry is expected to
grow in the same proportion as in 2019, and in the baseline scenario, an expansion of 3.42%
YOY is expected for 2020 and 3.20% YoY for 2021 (Graph XII).
Graph XII
PROJECTED VALUES FOR AGRO-INDUSTRY PRODUCTION GROWTH BETWEEN 2019 AND 2021 (% YOY)
0.00
3.29
4.41
1.13
3.42
4.02
1.36
3.20
3.88
2019 2020 2021
PESSIMISTIC BASELINE OPTIMISTIC
Source: IBGE 16. Prepared by FGV.
Therefore, what is expected for 2019 is that the food and beverage agro-industry con-
tinues to expand with less inelastically than the agro-industry as a whole, whatever the
scenario considered, as already suggested by the analysis of historical values in the pre-
vious paragraphs. That is, the segment of food and beverages should show a trajectory
of expansion in the next triennium (2019 to 2021), whose intensity is conditioned to the
evolution of the Brazilian economy. In addition, this segment should continue to moderate
the expansion of the agro-industry as a whole, either avoiding a more rapid deceleration
(pessimistic scenario), or softening an excessively heated expansion (optimistic scenario).
16 Available at: https://sidra.ibge.gov.br/tabela/3650

CHAPTER 1 THE BRAZILIAN AGRO-INDUSTRIAL PRODUCTION INDEX (IPAGRO)26

27BRAZILIAN AGRO-INDUSTRY: THE SITUATION OF THE SECTOR AND PROJECTIONS FOR 2019
1. THE BRAZILIAN AGRO-INDUSTRIAL PRODUCTION INDEX (IPAgro)
In the classic concept (Davis and Goldberg, 1957) the agribusiness in defines as the sum
total of all operations and transactions involved from production operations, in agricultural
and livestock units, to the processing, distribution and consumption of agricultural products
in natura or industrialized.
From this definition, the agribusiness it is usually divided in three parts:
Upstream (or “before the farm gate”): represented by industry and commerce
that provide inputs for rural production;
Agricultural and livestock (or “inside the farm gate”): represented by rural pro-
ducers; and
Downstream (or “after the farm gate”): represented by the activities of pur-
chase, transportation, processing and sale of agricultural products to the final
consumer.
The agro-industry can be defined, in this study, as a group of activities related to the trans-
formation of raw materials used both by agricultural production (such as inputs), as the
transformation of raw materials from agriculture (e.g. production of food and beverages).
Therefore, it is clear that agro-industry is a subset of a larger group called agribusiness,
being rather a subset of agriculture. The agro-industry, in this study, is composed by the
sectors presented in Table 1.1.

CHAPTER 1 THE BRAZILIAN AGRO-INDUSTRIAL PRODUCTION INDEX (IPAGRO)28
Table 1.1
AGRO-INDUSTRY SECTORS
SECTOR LINK WITH AGRICULTURE
AGRICULTURAL SUPPLIES Before the farm gate
FOODS After the farm gate
BEVERAGES After the farm gate
BIOFUELS After the farm gate
RUBBER After the farm gate
TOBACCO After the farm gate
FORESTRY PRODUCTS After the farm gate
TEXTILE After the farm gate
Source: Prepared by FGV

29BRAZILIAN AGRO-INDUSTRY: THE SITUATION OF THE SECTOR AND PROJECTIONS FOR 2019
1.1. HOW THE AGRO-INDUSTRIAL PRODUCTION INDEX WAS BUILT?
The Agro-industrial Production Index was constructed based on the Monthly Industrial
Survey - Physical Production (PIM-PF) of the Brazilian Institute of Geography and Statistics
(IBGE).
According to the IBGE, the PIM-PF 1 has the objective to serve as an approximate mea-
sure of the short-term evolution of the value added of the industry, presenting monthly
data since January 2012. The scope of the PIM-PF is national; however, the estimation is
performed considering information from only 14 units of the federation 2.
Because it is based on the PIM-PF, the Agro-industrial Production Index, in turn, it in-
tends to be a measure of the short-term evolution of the added value of agro-industry;
and has the characteristics that the research elaborated by the IBGE, that is, has monthly
frequency, with data from January 2012 and national coverage, considering the same 14
units of the Federation for their estimation. In addition, the sectors that were incorpora-
ted into the Agro-industrial Production Index are a subset of the sectors disseminated
by IBGE through the PIM-PF.
From this, the Agro-industrial Production Index is composed of two groups: (i) Food and
Beverages; and (ii) Non-Food Products. The Food and Beverage group, is made up of
two sectors (Food and Beverage), and the Food sector is subdivided into two subsectors
(Foods of Animal Origin and Foods of Vegetal Origin) and the Beverages sector is sub-
divided into Alcoholic Beverages and Non-Alcoholic Beverages. The group of Non-Food
Products is composed by the following sectors: Biofuels, Rubber, Tobacco, Agricultural
Inputs, Forest Products and Textiles.
1 Available at: https://www.ibge.gov.br/estatisticas-novoportal/economicas/industria/9294-pesquisa-industrial-men-
sal-producao-fisica-brasil.html?=&t=conceitos-e-metodos
2 Brazil, is a union of 27federal units and the 14 federal units with availed data are: Amazonas, Pará, Ceará, Pernam-
buco, Bahia, Minas Gerais, Espírito Santo, Rio de Janeiro, São Paulo, Paraná, Santa Catarina, Rio Grande do Sul, Mato
Grosso and Goiás.

CHAPTER 1 THE BRAZILIAN AGRO-INDUSTRIAL PRODUCTION INDEX (IPAGRO)30
Figure 1.1
STRUCTURE OF THE AGRO-INDUSTRIAL PRODUCTION INDEX
AGRO-INDUSTRY
(100.0%)
FOOD ANDBEVERAGE
(51.6%)
NON-FOODPRODUCTS
(48.4%)
BIOFUELS
(3.1%)
RUBBER
(3.4%)
TOBACCO
(3.8%)
AGRICULTURALINPUTS
(7.9%)
FORESTPRODUCTS
(12.7%)
TEXTILES
(17.4%)
FOOD
(41.3%)BEVERAGE
(10.3%)
ANIMAL ORIGIN
(21.6%)
VEGETAL ORIGIN
(19.7%)
ALCOHOLIC
(5.2%)
NON-ALCOHOLIC
(5.1%)
Source: Prepared by FGV.
Each sector and subsector was composed of a group of codes of the National Classification
of Economic Activities (CNAEs) published by IBGE through PIM-PF. The composition of
each sector and subsector is presented in Attachment 1. The weighting structure used for
the creation of the Agro-industrial Production Index followed the weighting structure used
by the IBGE for the development of the index of the manufacturing industry. However,
the weights used in the processing industry were normalized to the agro-industry. The
weights considered are presented in Attachment 2.
Through the weighting structure used to construct the agro-industrial production indi-
ces it is clear, therefore, that the agro-industry is not only composed of food, since the
Food and Beverage group has a weight of 51.6% in the Agro-industrial Production Index,
while the group of Non-Food Products has a weight of 48.4%, as can be seen in Table 1.2.

31BRAZILIAN AGRO-INDUSTRY: THE SITUATION OF THE SECTOR AND PROJECTIONS FOR 2019
Table 1.2
AGGREGATE WEIGHT STRUCTURE FOR THE COMPOSITION OF THE AGRO-INDUSTRIAL PRODUCTION INDEX
FOODS AND BEVERAGES GROUP 51.6%
FOODS Sector 41.3%
ANIMAL ORIGIN Sub-sector 21.6%
VEGETABLE ORIGIN Sub-sector 19.7%
BEVERAGES Sector 10.3%
ALCOHOLIC Sub-sector 5.2%
NON-ALCOHOLIC Sub-sector 5.1%
NON-FOOD PRODUCTS GROUP 48.4%
BIOFUELS Sector 3.1%
RUBBER Sector 3.4%
TOBACCO Sector 3.8%
AGRICULTURAL SUPPLIES Sector 7.9%
FORESTRY PRODUCTS Sector 12.7%
TEXTILE Sector 17.4%
Source: Prepared by FGV.
Based on the methodology presented for the construction of the Agro-industrial Production
Index, it is possible to follow the performance of the Brazilian agro-industry since 2002.

CHAPTER 1 THE BRAZILIAN AGRO-INDUSTRIAL PRODUCTION INDEX (IPAGRO)32
33BRAZILIAN AGRO-INDUSTRY: THE SITUATION OF THE SECTOR AND PROJECTIONS FOR 2019
2. WHAT HAPPENED TO THE PRODUCTION OF BRAZILIAN AGRO-INDUSTRY IN 2018?
2.1 AGRO-INDUSTRY AND BRAZILIAN ECONOMY
In 2018, the Brazilian agro-industry sector reduced 1.0% compared to 2017. To understand
this performance, it is important to analyze what happened to the Brazilian economy,
since the agro-industry is not disconnected from the economy as a whole.
The Brazilian economy was resuming a growth trajectory in 2017, however, in 2018, this
recovery slowed, influenced, mainly, by two major events. By one hand, the political wear
of the Michel Temer government increased, as the market lost its belief that some more
substantial structural reform would be approved; and on by another hand, there was
the truck drivers' strike, which was the decisive factor for the slowdown of the Brazilian
economy in 2018.
By observing the growth expectations for Brazil's GDP throughout 2018, it is clear how
strong the truck drivers' strike impacted the country's economy. It is observed that from
the last quarter of 2017 until the first quarter of 2018, the market projected an increasing
growth of the Brazilian economy for the year 2018. However, from the middle of March/2018,
this optimism began to lose strength and the market began to project a smaller growth
than it had been projected and, in May/2018, the month in which the truckers' strike oc-
curred, the growth projections dropped and did not recover again.
To illustrate, on March 7 of 2018, the Focus Bulletin presented a GDP growth projection
of 2.9% for the year. On June 21 of 2018, one month after the first day of the truckers
'strike, the Brazilian economy's growth projection was only 1.6% YoY. Clearly, the truck
drivers' strike caused a structural break in the series of GDP projections for the year
2018 (Graph 2.1).

CHAPTER 2 WHAT HAPPENED TO THE PRODUCTION OF BRAZILIAN AGRO-INDUSTRIES IN 2018?34
Finally, the Brazilian GDP ended the year 2018 with an expansion of 1.1%, a figure well below
that projected by the market in the moments before to the truck drivers' strike (Graph 2.2).
Graph 2.1
EVOLUTION OF THE FORECAST GDP GROWTH OF 2018 (% YOY)
1.25
1.00
1.20
1.40
1.60
1.80
2.00
2.20
2.40
2.60
2.80
3.00
01/
02/
2017
01/
30/2
017
03/
01/
2017
03/
29/2
017
04/
28/2
017
05/
29/2
017
06/
27/2
017
07/
25/2
017
08/
22/2
017
09/
20/2
017
10/1
9/20
1711/2
0/2
017
12/1
8/20
1701/
17/2
018
02/
16/2
018
03/
16/2
018
04/
16/2
018
05/
15/2
018
06/
13/2
018
07/
11/2
018
08/
08/
2018
09/
05/
2018
10/0
4/20
1811/0
5/20
1812
/04/
2018
01/
03/
2019
01/
31/2
019
Source: Focus Bulletin 1 from 02/01/2017 until 27/02/2019 – median.
1 Available at: https://www3.bcb.gov.br/expectativas/publico/consulta/serieestatisticas

35BRAZILIAN AGRO-INDUSTRY: THE SITUATION OF THE SECTOR AND PROJECTIONS FOR 2019
Graph 2.2
GDP GROWTH IN 2018, FROM THE PRODUCTION PERSPECTIVE (% YOY)
1.1
0.1
0.6
1.3
GDP LIVESTOCK FARMING INDUSTRY SERVICES
Source: IBGE 2.
The truck drivers' strike impacted negatively several segments of the Brazilian economy,
including industry and agro-industry. In view of this, it is important to note that, although
industry and agro-industry are not equal, since agro-industry is a subset of industry, they
follow the same standards.
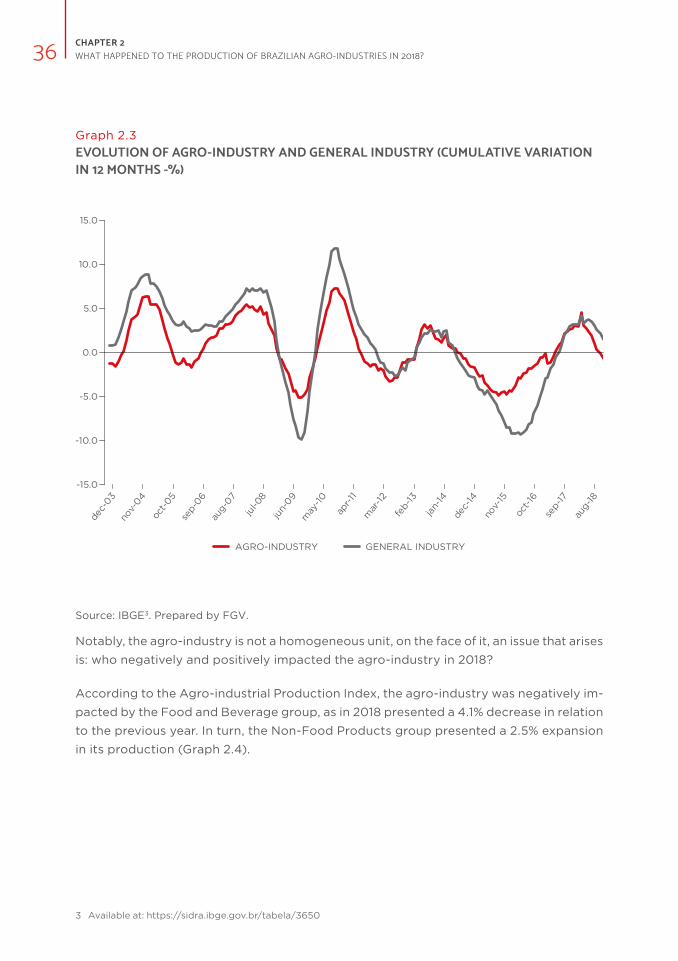
This can be seen in Graph 2.3, which shows how the growth of agro-industry and indus-
try, that generally presented the same pattern of behavior. However, it is noted that the
production of agro-industry presents lower volatility than that of the general industry.
The hypothesis to explain this lower agro-industry volatility is the greater participation
of the food group, which tends to have a more inelastic demand in the Agro-industrial
Production Index compared to the general industry.
Although agro-industry and general industry have the same pattern of behavior and be
immersed in the same situation, they have particular dynamics and respond to shocks at
different intensities. For example, in 2017, both had a tendency to grow, with the strike of
the truckers both lost their breath, however, agro-industry decelerated much more intensely
than the general industry. On face this, the general industry slowed its growth throughout
2018, but ended the year with growth of 1.1%. In turn, agro-industry decelerated its produc-
tion expansion and ended the year in a negative field, with a reduction of 1.0%, compared
to 2017 (Graph 2.3).
2 Available at: https://sidra.ibge.gov.br/tabela/5932
CHAPTER 2 WHAT HAPPENED TO THE PRODUCTION OF BRAZILIAN AGRO-INDUSTRIES IN 2018?36
Graph 2.3
EVOLUTION OF AGRO-INDUSTRY AND GENERAL INDUSTRY (CUMULATIVE VARIATION IN 12 MONTHS -%)
-15.0
-10.0
-5.0
0.0
5.0
10.0
15.0
dec-
03
nov-
04
oct-05
sep-
06
aug-
07
jul-0
8
jun-
09
may
-10
apr-11
mar
-12
feb-
13
jan-
14
dec-
14
nov-
15
oct-16
sep-
17
aug-
18
AGRO-INDUSTRY GENERAL INDUSTRY
Source: IBGE 3. Prepared by FGV.
Notably, the agro-industry is not a homogeneous unit, on the face of it, an issue that arises
is: who negatively and positively impacted the agro-industry in 2018?
According to the Agro-industrial Production Index, the agro-industry was negatively im-
pacted by the Food and Beverage group, as in 2018 presented a 4.1% decrease in relation
to the previous year. In turn, the Non-Food Products group presented a 2.5% expansion
in its production (Graph 2.4).
3 Available at: https://sidra.ibge.gov.br/tabela/3650

37BRAZILIAN AGRO-INDUSTRY: THE SITUATION OF THE SECTOR AND PROJECTIONS FOR 2019
Graph 2.4
EVOLUTION OF AGRO-INDUSTRY, FOOD AND BEVERAGE AND NON-FOOD PRODUCTS (ACCUMULATED VARIATION IN 12 MONTHS -%)
-15.0
-10.0
-5.0
0.0
5.0
10.0
dec-
03
jul-04
feb-
05
sep-
05
apr-
06
nov-
06
jun-
07
jan-
08
aug-
08
mar
-09
oct-
09
may
-10
dec-
10ju
l-11
feb-
12se
p-12
apr-
13no
v-13
jun-
14ja
n-15
aug-
15m
ar-16
oct-
16m
ay-17
dec-
17ju
l-18
AGRO-INDUSTRY FOOD AND BEVERAGE NON-FOOD PRODUCTS
Source: IBGE 4. Prepared by FGV.
Within the group of Food and Beverage group, the Food sector was the one that nega-
tively impacted the agro-industry sector in 2018, while the Beverage sector presented a
stable performance compared to 2017 (-0.1%), (Graph 2.5).
Within the Food sector, the sub-sector of Foods of Vegetal Origin declined significantly
(-9.6%), while the sub-sector of Foods of Animal Origin little reduced (-0.7), sustained
mainly by the good performance of Meat Products (CNAE 10.13) (9.18%) and slaughter
of cattle, except pork (CNAE 10.11) (4.9%).
4 Available at: https://sidra.ibge.gov.br/tabela/3650

CHAPTER 2 WHAT HAPPENED TO THE PRODUCTION OF BRAZILIAN AGRO-INDUSTRIES IN 2018?38
Graph 2.5
EVOLUTION OF THE FOOD AND BEVERAGE GROUP AND ITS SECTORS AND THE SUB-SECTORS (CUMULATIVE VARIATION IN THE YEAR -%)
-4.1-5.1
-0.7
-9.6
-0.1
-1.4
1.3
FOO
D A
ND
BEVERAGE
FOO
DS
ANIM
AL
ORIG
IN
VEGETA
BLE O
RIGIN
BEVERAGE
ALC
OHO
LIC
NO
N-A
LCO
HO
LIC
Source: Prepared by FGV.
Regarding the Non-Food Products group, only the sectors of Tobacco (-3.9%) and Textile
(-2.7%) showed a decline in production in 2018, while the other sectors contributed po-
sitively to the performance of the agro-industry (Graph 2.6).
Therefore, it is clear that the result of agro-industrial production in 2018 was not worse
because of the good performance of Non-Food Products and bovine protein (within the
sub-sector of Foods of Animal Origin).

39BRAZILIAN AGRO-INDUSTRY: THE SITUATION OF THE SECTOR AND PROJECTIONS FOR 2019
Graph 2.6
EVOLUTION OF THE NON-FOOD PRODUCTS GROUP AND THEIR SECTORS (ACCUMULATED VARIATION IN THE YEAR - %)
2.5
19.8
1.0
-3.9
4.8 4.5
-2.7
NON-F
OOD
PRODUCTS
BIO
FUEL
S
RUBBER
TOBACCO
AGRIC
ULT
URAL
SUPP
LIES
FORES
TRY
PRODUCTS
TEXTI
LE
Source: Prepared by FGV.
2.2. THE TRUCK DRIVERS' STRIKE
The truck drivers' strike, which began on May 21 of 2018 and was officially ended on May
30 of the same year, severely affected the agro-industry, as well as the general industry
and the Brazilian economy as a whole.
In the case of agro-industrial production, the accumulated growth in the period between
January/2018 and April/2018 (month immediately before the month of the strike) was
4.3%. However, in the period between May/2018 and December/2018, agro-industrial
production accumulated a reduction of 3.1% in comparing with the same period of the
previous year. That is, it is clear that the strike of the truck drivers affected the Brazilian
agro-industry significantly (Graph 2.7).

CHAPTER 2 WHAT HAPPENED TO THE PRODUCTION OF BRAZILIAN AGRO-INDUSTRIES IN 2018?40
This reduction in post-strike performance also occurred in the agro-industry groups,
however, it occurred with greater intensity in the Food and Beverage group than in the
Non-Food Products group.
Before the strike, the Food and Beverage group accumulated a growth of 4.1%. In the
post-strike period, the production of this group reduced 7.2%. In the case of Non-Food
Products, despite the notable impact of the strike, the accumulated growth in the post-
-strike period was not negative (1.8%) (Graph 2.7).
Graph 2.7
CRESCIMENTO ACUMULADO NO PERÍODO DA PRODUÇÃO DA AGROINDÚSTRIA, DE ALIMENTOS E BEBIDAS E PRODUTOS NÃO-ALIMENTÍCIOS (%)
4.3
-3.1
4.5
1.8
4.1
-7.2
AGRO-INDUSTRY NON-FOOD PRODUCTS FOOD AND BEVERAGE
JAN/18 TO APR/18 MAY/18 TO DEC/18
Source: IBGE 5. Prepared by FGV.
Another way for observing the impact of the truckers' strike on the production of the agro-
-industry and its sectors and sub-sectors, is to analyze the inter-annual variation (that is,
comparing a month with the same month of the previous year), avoiding possible distor-
tions of seasonality.
5 Available at: ttps://sidra.ibge.gov.br/tabela/3650

41BRAZILIAN AGRO-INDUSTRY: THE SITUATION OF THE SECTOR AND PROJECTIONS FOR 2019
In April/2018, the month before the strike, agro-industrial production grew 10.3% in rela-
tion to the same month of the previous year, while in May/2018, the month of the strike,
agro-industry showed a significant reduction of 11,4% for the same basis of comparison.
The retraction presented in May/2018 is already impressive in itself, however, it also points
attention to the fact that the strike of the truck drivers caused not only a punctual im-
pact in May/2018, but a prolonged shock for the rest of 2018, a agro-industry started to
show growth rates far below what it had been presenting and, subsequently, it showed
successive retractions (Graph 2.8).
Graph 2.8
INTER-ANNUAL GROWTH (T-12) OF AGRO-INDUSTRY PRODUCTION (%)
10.3
-11.4
-4.2
-15.0
-10.0
-5.0
0.0
5.0
10.0
15.0
dec-
16
feb-
17m
ar-17
jan-
17
apr-
17m
ay-17
jun-
17ju
l-17
aug-
17se
p-17
oct-
17no
v-17
dec-
17ja
n-18
feb-
18m
ar-18
apr-
18m
ay-18
jun-
18
aug-
18se
p-18
jul-1
8
oct-
18no
v-18
dec-
18
Source: Prepared by FGV.

CHAPTER 2 WHAT HAPPENED TO THE PRODUCTION OF BRAZILIAN AGRO-INDUSTRIES IN 2018?42
The pattern of behavior observed in agro-industrial production, in the inter-annual com-
parison, can also be visualized in the Food and Beverage group. That is, in April/2018,
the Food and Beverage group showed an increase of 11.6% in comparison with the same
month of 2017. In May/2018, in turn, the production of this group reduced by 14.6 %. Finally,
from May/2018 to December/18, the Food and Beverage group remained in the negative
field, not being able to recover from the shock caused by the truckers' strike (Graph 2.9).
Graph 2.9
INTER-ANNUAL GROWTH (T-12) OF FOOD AND BEVERAGE PRODUCTION (%)
11.6
-14.6
-6.4
-15.0
-20.0
-10.0
-5.0
0.0
5.0
10.0
15.0
dec-
16
feb-
17m
ar-17
jan-
17
apr-
17m
ay-17
jun-
17ju
l-17
aug-
17se
p-17
oct-
17no
v-17
dec-
17ja
n-18
feb-
18m
ar-18
apr-
18m
ay-18
jun-
18
aug-
18se
p-18
jul-1
8
oct-
18no
v-18
dec-
18
Source: Prepared by FGV.

43BRAZILIAN AGRO-INDUSTRY: THE SITUATION OF THE SECTOR AND PROJECTIONS FOR 2019
By analyzing the Food and Beverage group in its sectors (Food vs. Beverage), it is ve-
rified that the impact of the truckers strike was more intense in the Food sector than in
the Beverage sector. In April/2018, the Food sector grew 11.6% in relation to the same
month of the previous year, however, in the month of the strike (May/2018), the sector's
production reduced 14.5%, and since then the sector has suffered production decrease
in all subsequent months of 2018 (Graph 2.10).
Regarding the Beverage sector, it clearly also that felt the effects of the truck drivers'
strike, however, the sector had recovered in its production in the following two months,
but has since retracted since then (Graph 2.11).
Graph 2.10
INTER-ANNUAL GROWTH (T-12) OF FOOD PRODUCTION (%)
11.6
-14.5
-7.9
-15.0
-20.0
-10.0
-5.0
0.0
5.0
10.0
15.0
dec-
16
feb-
17m
ar-17
jan-
17
apr-
17m
ay-17
jun-
17ju
l-17
aug-
17se
p-17
oct-
17no
v-17
dec-
17ja
n-18
feb-
18m
ar-18
apr-
18m
ay-18
jun-
18
aug-
18se
p-18
jul-1
8
oct-
18no
v-18
dec-
18
Source: Prepared by FGV.

CHAPTER 2 WHAT HAPPENED TO THE PRODUCTION OF BRAZILIAN AGRO-INDUSTRIES IN 2018?44
Graph 2.11
INTER-ANNUAL GROWTH (T-12) OF BEVERAGE PRODUCTION (%)
11.5
-14.7
-1.8
-15.0
-20.0
-10.0
-5.0
0.0
5.0
10.0
15.0
dec-
16
feb-
17m
ar-17
jan-
17
apr-
17m
ay-17
jun-
17ju
l-17
aug-
17se
p-17
oct-
17no
v-17
dec-
17ja
n-18
feb-
18m
ar-18
apr-
18m
ay-18
jun-
18
aug-
18se
p-18
jul-1
8
oct-
18no
v-18
dec-
18
Source: Prepared by FGV.
When analyzing in more detail the Food sector, it is observed that the sub-sector most
impacted by the truckers' strike was the Food of Vegetal Origin. In April/2018, in inter-an-
nual comparison, the production of Food of Plant Origin showed an expansion of 15.6%.
However, in May/2018, the sub-sector reduced 14.0% and remained in the negative for
the rest of 2018 (Graph 2.12).

45BRAZILIAN AGRO-INDUSTRY: THE SITUATION OF THE SECTOR AND PROJECTIONS FOR 2019
Graph 2.12
INTER-ANNUAL GROWTH (T-12) IN THE PRODUCTION OF FOOD OF PLANT ORIGIN (%)
15.6
-14.0
-11.5
-25.0
-30.0
-20.0
-10.0
-5.0
5.0
10.0
25.0
15.0
0.0
-15.0
dec-
16
feb-
17m
ar-17
jan-
17
apr-
17m
ay-17
jun-
17ju
l-17
aug-
17se
p-17
oct-
17no
v-17
dec-
17ja
n-18
feb-
18m
ar-18
apr-
18m
ay-18
jun-
18
aug-
18se
p-18
jul-1
8
oct-
18no
v-18
dec-
18
Source: Prepared by FGV.
Regarding to the sub-sector of Food of Animal Origin, there is an impact of lesser inten-
sity of the truck drivers' strike in their production, since after the retraction occurred in
May/2018, the production of this sub-sector still tried some growth, albeit modest, in the
remaining months of 2018 (Graph 2.13).

CHAPTER 2 WHAT HAPPENED TO THE PRODUCTION OF BRAZILIAN AGRO-INDUSTRIES IN 2018?46
Graph 2.13
INTER-ANNUAL GROWTH (T-12) IN THE PRODUCTION OF FOOD OF ANIMAL ORIGIN (%)
10.1
-14.6
-5.2
-15.0
-20.0
-10.0
-5.0
0.0
5.0
10.0
15.0
dec-
16
feb-
17m
ar-17
jan-
17
apr-
17m
ay-17
jun-
17ju
l-17
aug-
17se
p-17
oct-
17no
v-17
dec-
17ja
n-18
feb-
18m
ar-18
apr-
18m
ay-18
jun-
18
aug-
18se
p-18
jul-1
8
oct-
18no
v-18
dec-
18
Source: Prepared by FGV.
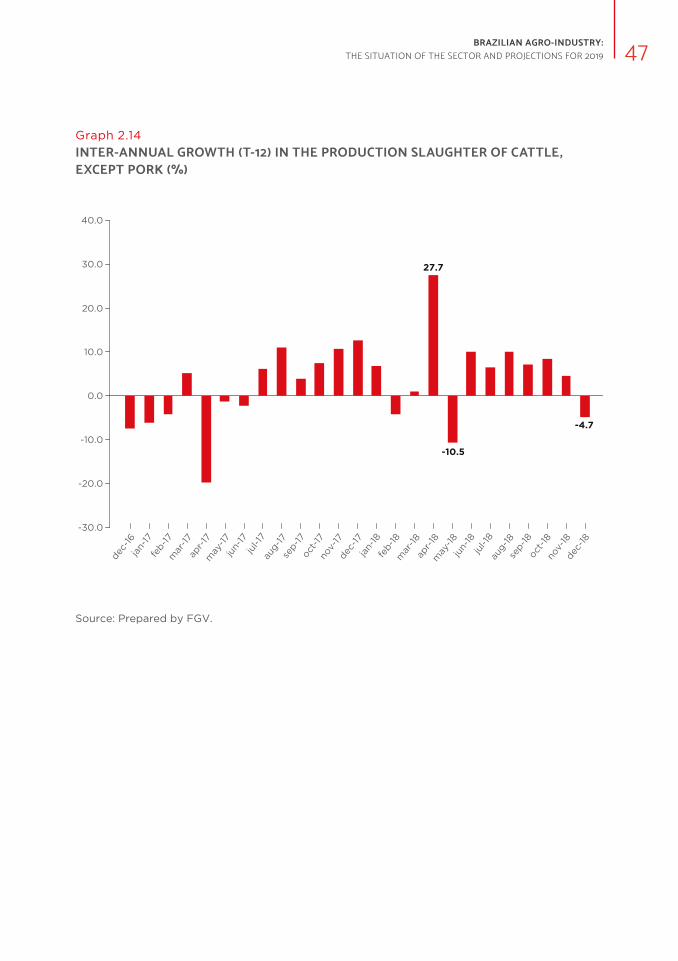
It is important to emphasize that the industrial production of Animal Food was not only
more intensely affected by the strike due to the performance of the segments associated
with bovine protein, since the segments of slaughter of cattle, except pork (CNAE 10.11)
and Manufacture of Meat Products (CNAE 10.13) were able to recover after the shock
caused by the truckers' strike. In contrast, the segment associated with the slaughter of
pigs and poultry (CNAE 10.12) was strongly impacted by the strike, with successive and
significant reductions in the rest of 2018 (Graphs 2.14, 2.15 and 2.16).
47BRAZILIAN AGRO-INDUSTRY: THE SITUATION OF THE SECTOR AND PROJECTIONS FOR 2019
Graph 2.14
INTER-ANNUAL GROWTH (T-12) IN THE PRODUCTION SLAUGHTER OF CATTLE, EXCEPT PORK (%)
-20.0
-30.0
0.0
20.0
40.0
30.0
10.0
-10.0
27.7
-10.5
-4.7
dec-
16
feb-
17m
ar-17
jan-
17
apr-
17m
ay-17
jun-
17ju
l-17
aug-
17se
p-17
oct-
17no
v-17
dec-
17ja
n-18
feb-
18m
ar-18
apr-
18m
ay-18
jun-
18
aug-
18se
p-18
jul-1
8
oct-
18no
v-18
dec-
18
Source: Prepared by FGV.

CHAPTER 2 WHAT HAPPENED TO THE PRODUCTION OF BRAZILIAN AGRO-INDUSTRIES IN 2018?48
Graph 2.15
INTER-ANNUAL GROWTH (T-12) IN THE PRODUCTION OF MEAT PRODUCTS (%)
17.7
-13.1
-1.4
-10.0
-20.0
0.0
10.0
20.0
30.0
40.0
50.0
dec-
16
feb-
17m
ar-17
jan-
17
apr-
17m
ay-17
jun-
17ju
l-17
aug-
17se
p-17
oct-
17no
v-17
dec-
17ja
n-18
feb-
18m
ar-18
apr-
18m
ay-18
jun-
18
aug-
18se
p-18
jul-1
8
oct-
18no
v-18
dec-
18
Source: Prepared by FGV.

49BRAZILIAN AGRO-INDUSTRY: THE SITUATION OF THE SECTOR AND PROJECTIONS FOR 2019
Graph 2.16
INTER-ANNUAL GROWTH (T-12) IN THE PRODUCTION OF PORK, POULTRY AND OTHER SMALL ANIMALS (%)
1.7
-25.8
-11.0
-25.0
-30.0
-20.0
-15.0
10.0
0.0
10.0
5.0
-5.0
dec-
16
feb-
17m
ar-17
jan-
17
apr-
17m
ay-17
jun-
17ju
l-17
aug-
17se
p-17
oct-
17no
v-17
dec-
17ja
n-18
feb-
18m
ar-18
apr-
18m
ay-18
jun-
18
aug-
18se
p-18
jul-1
8
oct-
18no
v-18
dec-
18
Source: Prepared by FGV.
Unlike the Food and Beverage group, the group of Non-Food Products was impacted by
the truck drivers' strike in a less stronger way, since after a strong impact in the month
of the strike (-7.8% in May/2018), the industrial production of this group increased again,
in general (Graph 2.17).

CHAPTER 2 WHAT HAPPENED TO THE PRODUCTION OF BRAZILIAN AGRO-INDUSTRIES IN 2018?50
Graph 2.17
INTER-ANNUAL GROWTH (T-12) IN NON-FOOD PRODUCTION PRODUCTS (%)
9.1
-7.8
-1.2
8.0
10.0
14.0
0.0
2.0
6.0
18.0
10.0
4.0
2.0
16.0
dec-
16
feb-
17m
ar-17
jan-
17
apr-
17m
ay-17
jun-
17ju
l-17
aug-
17se
p-17
oct-
17no
v-17
dec-
17ja
n-18
feb-
18m
ar-18
apr-
18m
ay-18
jun-
18
aug-
18se
p-18
jul-1
8
oct-
18no
v-18
dec-
18
Source: Prepared by FGV.
Thus, in relation to the truck drivers' strike, it is clear that it had a significant impact on
agro-industrial production in 2018. However, since the agro-industry is not a homogeneous
unit, its sectors and sub-sectors were impacted in different ways by the strike.
Therefore, it is observed that the Food and Beverage group was impacted more intensely
than the Non-Food Products group. Finally, within the Food and Beverage group, it can be
seen that the segments that contributed the most to the result were not even worse were
Foods of Animal Origin, especially those segments associated with the bovine protein.

51BRAZILIAN AGRO-INDUSTRY: THE SITUATION OF THE SECTOR AND PROJECTIONS FOR 2019

CHAPTER 3 THE INFLUENCE OF THE EXTERNAL SECTOR IN THE PERFORMANCE OF AGRO-INDUSTRY52

53BRAZILIAN AGRO-INDUSTRY: THE SITUATION OF THE SECTOR AND PROJECTIONS FOR 2019
3. THE INFLUENCE OF THE EXTERNAL SECTOR IN THE PERFORMANCE OF AGRO-INDUSTRY
3.1. HOW THE DATA WERE GENERATED?
In order to analyze the international trade of the agro-industry, data from the Ministry
of Industry, Foreign Trade and Services (MDIC) available on the Comex Stat 1 portal was
used. In order to select the products that are part of the export and import tariff of
the Brazilian agro-industry, was made compatible 2 the CNAEs codes of the products
used for the construction of the Agro-industrial Production Index with the Mercosur
Common Nomenclature codes (NCM), which are used to generate foreign trade data
through the Comex Stat.
3.2. THE BRAZILIAN TRADE COMMERCIAL OF AGRO-INDUSTRIAL HAVE SURPLUS OR DEFICIT?
It is common sense that Brazil is a major exporter of products belonging to the Brazilian
agribusiness, being a surplus in relation to its trade balance. However, in general, the
complete numbers of the agro-industry are not considered in these analyzes. Therefore,
it is important to know if the agro-industry has a deficit or surplus trade balance to carry
out a more complete analysis of agribusiness numbers.
According to Comex Stat numbers in the period analyzed, the Brazilian agro-industry
trade balance is, at least since 2010, systematically surplus. In 2018, agro-industry exports
surpassed their imports by US$ 28.4 billion, despite the decrease observed in relation to
2017 (of 11.4%) (Graph 3.1).
1 Available at: http://comexstat.mdic.gov.br/pt/home
2 For the make compatible the data, was used the table of correspondence between CNAE 2.0 and NCM made
available by IBGE in the page of the National Commission of Classification, in the following address:
https://concla.ibge.gov.br/classificacoes/correspondencias/atividades-economicas.html

CHAPTER 3 THE INFLUENCE OF THE EXTERNAL SECTOR IN THE PERFORMANCE OF AGRO-INDUSTRY54
Graph 3.1
BRAZILIAN AGRO-INDUSTRY TRADE BALANCE (IN US$ BILLION)
23.421.8
32.9
30.9
27.2 27.5
31.132.0
28.4
2010 2011 2012 2013 2014 2015 2016 2017 2018
Source: Prepared by FGV based on data from Comex Stat 3.
3.3. WHO MOST CONTRIBUTED TO THIS BALANCE?
The agro-industry trade balance is a surplus, positively impacted only by the Food and
Beverage industry, since the Non-Food industry is systematically in deficit. In 2018, while
the balance of trade in Food and Beverages had a surplus of US$ 28.7 billion, Non-Food
products had a deficit of US$ 269.6 million (Graph 3.2).
3 Available at: http://comexstat.mdic.gov.br/pt/geral

55BRAZILIAN AGRO-INDUSTRY: THE SITUATION OF THE SECTOR AND PROJECTIONS FOR 2019
In other words, Brazil is a surplus not only in the production of raw material for food
(agricultural and livestock), but also in minimally processed foods. In addition, it has such
a substantial surplus that it can compensate for the deficit of the Non-Food Products
industry, causing the agro-industry a whole to have a significant trade balance.
Graph 3.2
TRADE BALANCE OF THE FOOD AND BEVERAGE AND THE INDUSTRY OF NON-FOOD PRODUCTS (US$ BILLION)
28.7
-0.3
-10.0
-5.0
0.0
5.0
10.0
15.0
20.0
25.0
30.0
35.0
40.0
2010
2011
2012
2013
2014
2015
2016
2017
2018
2010
2011
2012
2013
2014
2015
2016
2017
2018
FOOD AND BEVERAGE NON-FOOD PRODUCTS
Source: Prepared by FGV based on data from the Comex Stat 4.
Within the Food and Beverage group, the sector that leaves the positive trade balance
is Food (US$ 29.4 billion), since the Beverage sector is in deficit (-US$ 676.4 million).
4 Available at: http://comexstat.mdic.gov.br/pt/geral

CHAPTER 3 THE INFLUENCE OF THE EXTERNAL SECTOR IN THE PERFORMANCE OF AGRO-INDUSTRY56
With focus on the Food sector, both the sub-sector of Vegetal Food (US$ 16.1 billion)
and that of Foods of Animal Origin (US$ 13.3 billion) have a surplus trade balance, with
the two sub-sectors being well representative in the commercial balance of Food, re-
presenting, respectively, 54.8% and 45.2% of the sector balance (Graph 3.3).
In agro-industry Food of Plant Origin, the only activity that has a deficit trade balance
(-US$ 105.2 million) is Wheat Milling and Derivative Manufacturing (CNAE 10.62). In con-
trast, the activities of Manufacture of Oils and Fats (CNAE 10.4) and Manufacture and
Refining of Sugar (CNAE 10.7) are the activities that most positively impacted the trade
balance of Foods of Vegetal Origin, with respectively US$ 6.86 billion and US$ 6.52 billion
in trade balance (Graph 3.3).
Regarding Food of Animal Origin, only two activities have a deficit trade balance: Dairy
products (CNAE 10.5) and Preservation of Fish, Manufacture of Fish Products and Other
Food Products (CNAEs 10.2 and 10.9). However, the activities that most positively impacted
the commercial balance of the Animal Foodstuffs agro-industry were Slaughter of Swine,
Poultry and Other Small Animals (CNAE 10.12) and Slaughter of cattle, except Pigs (CNAE
10.11), with commercial balances of respectively, US$ 7.33 billion and US$ 6.63 billion.

57BRAZILIAN AGRO-INDUSTRY: THE SITUATION OF THE SECTOR AND PROJECTIONS FOR 2019
Graph 3.3
TRADE BALANCE OF FOOD OF PLANT ORIGIN AND FOOD OF ANIMAL ORIGIN AND ITS ACTIVITIES (IN US$ BILLION)
16.09
Veg
etab
le O
rigin
6.86
Oil
and
Fat
6.52
Suga
r Ref
inin
g
2.20
Can
ned
0.53
Cof
fee
Grin
ding
0.08
Ric
e
-0.11
Whe
at G
rindi
ng
13.27
Ani
mal
Orig
in
7.33Sl
augh
ter of
Sw
ine
and
Poul
try
6.63
Slau
ghte
r of
Nea
t
0.19
Mea
t Pr
oduc
ts
-0.41
Fish
-0.47
Dai
ry P
rodu
cts
Source: Prepared by FGV based on data from Comex Stat 5.
3.4. HOW DOES THE EXTERNAL SECTOR INTERACTED WITH THE PERFORMANCE OF AGRO-INDUSTRIAL PRODUCTION IN 2018?
Although the agro-industry trade balance is persistently surplus as seen previously, it
showed a decrease in its balance in 2018, compared to 2017, of 11.4%. This retraction in
the balance goes in the same direction of the contraction of the agro-industry produc-
tion in the same year.
5 Available at: http://comexstat.mdic.gov.br/pt/geral

CHAPTER 3 THE INFLUENCE OF THE EXTERNAL SECTOR IN THE PERFORMANCE OF AGRO-INDUSTRY58
So that is probably part of the contraction of agro-industrial production (-1.0%) in 2018,
occurred due to the reduction in exports of agro-industrial products, since while imports
of these goods increased by 8.6%, the exports declined by -2.8% in the year (Graph 3.4).
Finally, the reduction in the production of the Food and Beverage industry (-4.1%) may
also be correlated with the reduction in exports (-10.0%) of the products of this group.
The expansion of agro-industrial production of Non-Food Products (2.5%) should have
been positively impacted by the increase in exports (13.2%) of the products of this group
in 2018 (Graph 3.4).
Graph 3.4
ANNUAL VARIATION OF EXPORTS AND IMPORTS OF AGRO-INDUSTRY ANDOF THEIR GROUPS IN 2018 (% YOY)
-2.8%
8.6%
-10.0%
-1.9%
13.2%12.2%
EXPORTS IMPORTS
AGRO-INDUSTRY NON-FOOD PRODUCTS FOOD AND BEVERAGE
Source: Prepared by FGV based on data from Comex Stat 6.
6 Available at: http://comexstat.mdic.gov.br/pt/geral

59BRAZILIAN AGRO-INDUSTRY: THE SITUATION OF THE SECTOR AND PROJECTIONS FOR 2019

CHAPTER 3 THE INFLUENCE OF THE EXTERNAL SECTOR IN THE PERFORMANCE OF AGRO-INDUSTRY60
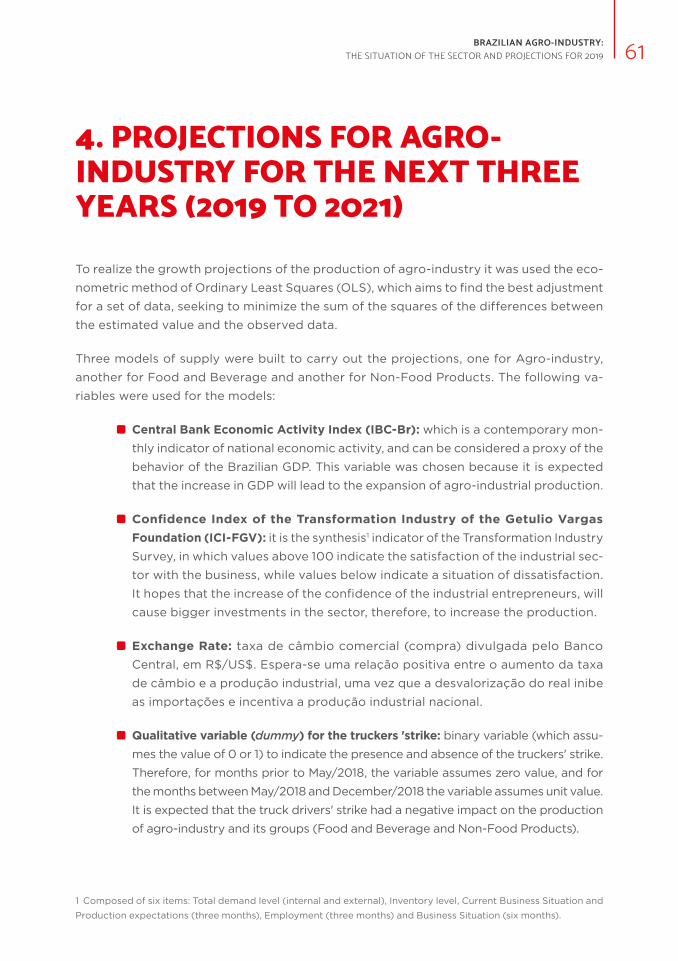
61BRAZILIAN AGRO-INDUSTRY: THE SITUATION OF THE SECTOR AND PROJECTIONS FOR 2019
4. PROJECTIONS FOR AGRO-INDUSTRY FOR THE NEXT THREE YEARS (2019 TO 2021)
To realize the growth projections of the production of agro-industry it was used the eco-
nometric method of Ordinary Least Squares (OLS), which aims to find the best adjustment
for a set of data, seeking to minimize the sum of the squares of the differences between
the estimated value and the observed data.
Three models of supply were built to carry out the projections, one for Agro-industry,
another for Food and Beverage and another for Non-Food Products. The following va-
riables were used for the models:
Central Bank Economic Activity Index (IBC-Br): which is a contemporary mon-
thly indicator of national economic activity, and can be considered a proxy of the
behavior of the Brazilian GDP. This variable was chosen because it is expected
that the increase in GDP will lead to the expansion of agro-industrial production.
Confidence Index of the Transformation Industry of the Getulio Vargas
Foundation (ICI-FGV): it is the synthesis 1 indicator of the Transformation Industry
Survey, in which values above 100 indicate the satisfaction of the industrial sec-
tor with the business, while values below indicate a situation of dissatisfaction.
It hopes that the increase of the confidence of the industrial entrepreneurs, will
cause bigger investments in the sector, therefore, to increase the production.
Exchange Rate: taxa de câmbio comercial (compra) divulgada pelo Banco
Central, em R$/US$. Espera-se uma relação positiva entre o aumento da taxa
de câmbio e a produção industrial, uma vez que a desvalorização do real inibe
as importações e incentiva a produção industrial nacional.
Qualitative variable (dummy) for the truckers 'strike: binary variable (which assu-
mes the value of 0 or 1) to indicate the presence and absence of the truckers' strike.
Therefore, for months prior to May/2018, the variable assumes zero value, and for
the months between May/2018 and December/2018 the variable assumes unit value.
It is expected that the truck drivers' strike had a negative impact on the production
of agro-industry and its groups (Food and Beverage and Non-Food Products).
1 Composed of six items: Total demand level (internal and external), Inventory level, Current Business Situation and
Production expectations (three months), Employment (three months) and Business Situation (six months).
CHAPTER 4 PROJECTIONS FOR AGRO-INDUSTRY FOR THE NEXT THREE YEARS (2019 TO 2021)62
Finally, it is worth to mention that the variables were transformed into natural logarithm
(ln) so that the result of the model brings the elasticity between the explanatory variable
and the dependent variable.
4.1. ASSUMPTIONS FOR THE SCENARIOS
In order to carry out projections for the production of agro-industry and its groups (Food
and Beverage and Non-Food Products), three scenarios were constructed based on as-
sumptions: baseline, pessimistic and optimistic.
For the baseline scenario, it was assumed that in 2019 there are still turbulence
on the political side and therefore the government has difficulty approving the
necessary reforms and is able to enable more limited versions of these propo-
sals. For the two subsequent years (2020 and 2021), it was assumed that, on
the one hand, reforms, even if limited, would slightly boost the expansion of the
economy, but on the other, the government's political capital will be running out
in a reasonably accelerated manner ;
For the pessimistic scenario, it was assumed that, given the difficulties of for-
ming a majority with the Congress and the problems/denunciations involving
people close to the president, the reform agenda did not advance and, finally,
economic growth lost its breath. This situation would lead to stagnation in the
labor market, the credit market and the expectations of agents for the next three
years (2019, 2020 and 2021);
For the optimistic scenario, it was assumed that the government could approve
the reform agenda with relative ease. These results boost the economy more
substantially and give President Jair Bolsonaro's team more lasting political
capital. For the years 2020 and 2021, the optimistic scenario is associated with
the "harvesting" of the fruits of this reform agenda.

63BRAZILIAN AGRO-INDUSTRY: THE SITUATION OF THE SECTOR AND PROJECTIONS FOR 2019
The premises adopted in each scenario will be presented in more detail next. However,
before proceeding, it is important to note that the assumed IBC-Br and exchange rate
projections were based on the estimates made by the market published by the Focus
Bulletin 2 of the Central Bank. For the pessimistic scenario, the minimum value was consi-
dered, for the base scenario the median was considered and, for the optimistic scenario,
the maximum value of the Focus Bulletin projections was considered. The projections
for the ICI-FGV, in turn, were performed by the authors of this study, since no market
estimates for this variable were found.
BASELINE SCENARIO: Based on the premises that make up the base scenario,
the variations of the agro-industrial production as a whole were projected, from
the food and beverage agro-industry and from the non-food products industry.
Behind these projections is the perspective that:
The IBC-Br (proxy for GDP) is growing more rapidly in 2019 (2.28%) and 2020
(2.80%), but lost its breath in 2021 (2.50%). This dynamic is explained by the
continuity of the slow recovery of the economy started in 2017;
Due to the economic recovery and the approval, even if limited, of the structu-
ral reforms, the industrial entrepreneur's confidence (ICI-FGV) is expected to
grow by 10.0% in 2019 and 7.5% in 2020 and 2021, the growth of 2017 (12.52%)
and 2018 (6.64%);
With the economy and the industrial entrepreneur's confidence expanding, the
tendency is for the exchange rate to exhibit moderate growth rates, much lower
than that observed in 2018 (14.5%). Given this, the exchange rate is expected to
grow by 1.37% in 2019, from 1.92% in 2020 and 2.74% in 2021.
PESSIMISTIC SCENARIO: Based on the premises that make up the pessimistic
scenario (paralysis of the agenda of reforms and attrition of the political capital
of the team of President Jair Bolsonaro), there is the perspective that:
Due to the political capital wear, the necessary reforms must not evolve in
Congress, the recovery of the labor market is compromised, and the credit market
is stagnant, reflecting negatively on the country's economic growth. Thus, in
this scenario, the IBC-Br (GDP proxy) is expected to grow only 1.20% in 2019,
and to maintain a constant growth of 2.0% in 2020 and 2021;
2 Focus report from 08/03/2019.

CHAPTER 4 PROJECTIONS FOR AGRO-INDUSTRY FOR THE NEXT THREE YEARS (2019 TO 2021)64
Given the dynamics of a slow recovery of the economy and the wear of the
government, the industrial entrepreneur's confidence (ICI-FGV) is expected
to remain on a downward trajectory, showing a steady decline of 10.0% be-
tween 2019 and 2021;
With the economy growing little and the industrial entrepreneur's confidence
declining, the tendency is for the exchange rate to show increasing growth ra-
tes. Given this, the exchange rate is expected to grow by 8.22% in 2019, from
19.73% in 2020 and 25.75% in 2021.
OPTIMISTIC SCENARIO: Behind these projections in the optimistic scenario,
there is the perspective that:
The IBC-Br (proxy for GDP) will grow in the three years (2019 to 2021) in a simi-
lar speed to that observed in 2013, the last year in which the economy showed
a more significant growth rate (3.0%). As a result, IBC-Br is expected to grow
by 3.13% in 2019, 3.70% in 2020 and 3.50% in 2021;
due to the presumption of a somewhat more favorable pace of expansion of
the economy and the maintenance of the strength of the government's political
capital, the confidence of the industrial entrepreneur (ICI-FGV) again increases
at a stronger rate: 15.0% in 2019 and 10.0% over the next two years;
with the economy growing more robustly and the industrial entrepreneur's
confidence showing significant expansion, the tendency is that the exchange
rate will retreat in the coming years. Given this, the exchange rate is expected
to reduce from 5.21% in 2019, from 10.41% in 2020 and 9.59% in 2021.

65BRAZILIAN AGRO-INDUSTRY: THE SITUATION OF THE SECTOR AND PROJECTIONS FOR 2019
Graph 4.1
SCENARIOS FOR THE IBC-BR (% YOY) FOR THE TRIENNIUM 2019-2021
2019 2020 2021
1.20
2.28
3.13
2.00
2.80
3.70
2.00
2.50
3.50
PESSIMISTIC BASELINE OPTIMISTIC
Source: Focus Bulletin of March 08, 2019.

CHAPTER 4 PROJECTIONS FOR AGRO-INDUSTRY FOR THE NEXT THREE YEARS (2019 TO 2021)66
Graph 4.2
SCENARIOS FOR THE ANNUAL ICI-FGV (%) FOR THE TRIENNIUM 2019-2021
2019 2020 2021
-10.0
10.0
15.0
-10.0
7.5
10.0
-10.0
7.5
10.0
PESSIMISTIC BASELINE OPTIMISTIC
Source: Prepared by FGV..

67BRAZILIAN AGRO-INDUSTRY: THE SITUATION OF THE SECTOR AND PROJECTIONS FOR 2019
Graph 4.3
SCENARIO FOR THE EXCHANGE RATE (% YOY) FOR THE TRIENNIUM 2019-2021
2019 2020 2021
8.22
1.37
-5.21
19.73
1.92
-10.41
25.75
2.74
-9.59
PESSIMISTIC BASELINE OPTIMISTIC
Source: Prepared by FGV.
4.1. THE MODEL FOR THE AGRO-INDUSTRY
The estimated model for agro-industry 3 is presented in the equation 1:
ln _agroindt=0,97 x ln _ibcbr
t + 0,17x ln _ici
t + 0,07 x ln_cambio
t - 0,04 x d_caminh (Eq.1)
Where:
t: time unit of March/2012 and December/2018;
ln_agroindt: natural logarithm of the Agro-industrial Production Index at time t;
ln_ibcbrt: natural logarithm of IBC-Br at time t;
ln_icit: natural logarithm ICI-FGV at time t;
ln_cambiot: natural logarithm of the exchange rate; and
3 The specifications of the models and the tests performed are presented in the attachments of this study.

CHAPTER 4 PROJECTIONS FOR AGRO-INDUSTRY FOR THE NEXT THREE YEARS (2019 TO 2021)68
d_caminh: dummy for the truckers' strike, where:
d_caminh = 0, for the months before May/2018; and
d_caminh = 1 for the months of May/2018 to December/2018.
The estimated model presented a good adjustment of the data, this can be observed when
projecting the values of previous years (2016 to 2018), as can be seen in Graph 4.4.
Graph 4.4
OBSERVED VALUES AND PROJECTED VALUES FOR THE AGRO-INDUSTRY PRODUCTION GROWTH BETWEEN 2016 AND 2018 (% YOY)
2016 2017 2018
-1.83-1.66
2.21 2.24
-0.77
-1.03
PROJECTED OBSERVED
Source: Prepared by FGV.

69BRAZILIAN AGRO-INDUSTRY: THE SITUATION OF THE SECTOR AND PROJECTIONS FOR 2019
Based on the assumed model and the premises adopted, it is estimated that, in the baseline
scenario, the agro-industry production should show a variation in the baseline scenario
of 3.29% in the year 2019, when compared to the previous year. However, in a pessimistic
scenario, the agro-industry may not show growth in 2019, and in an optimistic scenario
the annual projection is 4.41% of growth.
In 2020 and 2021, it is estimated that the agro-industry is expected to grow at the same
rate as in 2019, and in the baseline scenario, an expansion of 3.42% per year is expected
for 2020 and 3.20% YoY for 2021 (Graph 4.5).
Graph 4.5
PROJECTED VALUES FOR AGRO-INDUSTRY PRODUCTION GROWTH BETWEEN 2019 AND 2021 (% YOY)
0.00
3.29
4.41
1.13
3.42
4.02
1.36
3.20
3.88
2019 2020 2021
PESSIMISTIC BASELINE OPTIMISTIC
Source: Prepared by FGV.
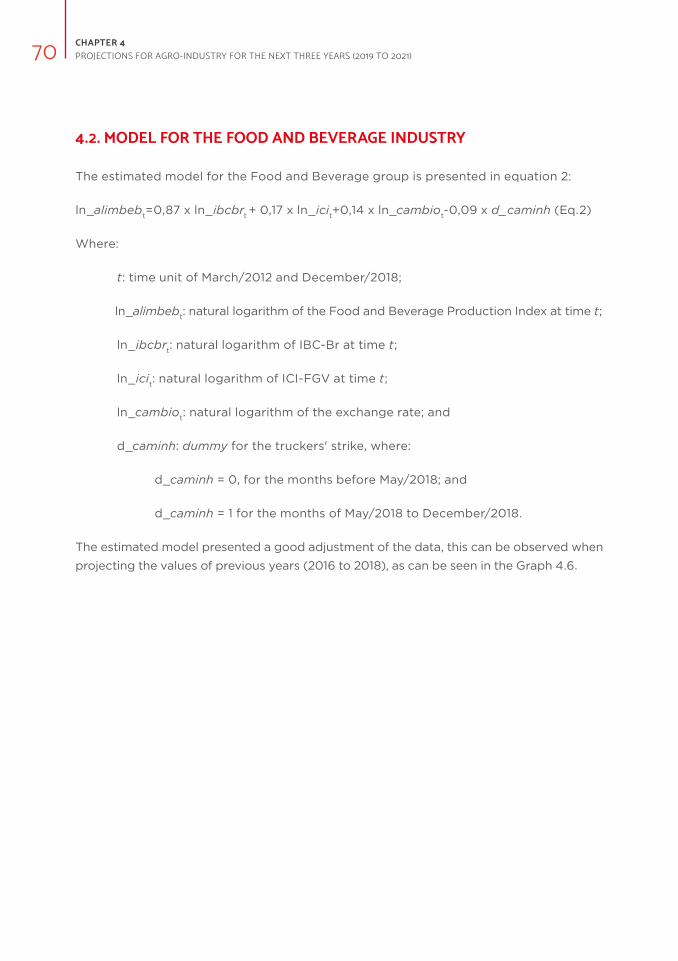
CHAPTER 4 PROJECTIONS FOR AGRO-INDUSTRY FOR THE NEXT THREE YEARS (2019 TO 2021)70
4.2. MODEL FOR THE FOOD AND BEVERAGE INDUSTRY
The estimated model for the Food and Beverage group is presented in equation 2:
ln_alimbebt=0,87 x ln_ibcbr
t + 0,17 x ln_ici
t+0,14 x ln_cambio
t-0,09 x d_caminh (Eq.2)
Where:
t: time unit of March/2012 and December/2018;
ln_alimbebt: natural logarithm of the Food and Beverage Production Index at time t;
ln_ibcbrt: natural logarithm of IBC-Br at time t;
ln_icit: natural logarithm of ICI-FGV at time t;
ln_cambiot: natural logarithm of the exchange rate; and
d_caminh: dummy for the truckers' strike, where:
d_caminh = 0, for the months before May/2018; and
d_caminh = 1 for the months of May/2018 to December/2018.
The estimated model presented a good adjustment of the data, this can be observed when
projecting the values of previous years (2016 to 2018), as can be seen in the Graph 4.6.

71BRAZILIAN AGRO-INDUSTRY: THE SITUATION OF THE SECTOR AND PROJECTIONS FOR 2019
Graph 4.6
OBSERVED VALUES AND PROJECTED VALUES FOR THE GROWTH OF FOOD AND BEVERAGE BETWEEN 2016 AND 2018 (% YOY)
2016 2017 2018
PROJECTED OBSERVED
-1.15
-0.17
1.321.14
-4.62
-4.14
Source: Prepared by FGV.
Based the assumed model and the premises adopted, it is estimated that, in the baseline
scenario, Food and Beverage production should show a variation in the baseline nee
scenario of 2.83% in 2019, comparing with the previous year. However, in a pessimistic
scenario, the Food and Beverage industry may show very low growth in 2019 (0.49%),
and in an optimistic scenario the projection is 3.34% YoY growth. Therefore, what is
expected for 2019 is that the Food and Beverage industry continues to evolve below
the Agro-industry as a whole, regardless of the scenario considered. That is, the Food
and Beverage group should continue pulling down the Brazilian agro-industry, in terms
of physical production.
In 2020 and 2021, it is estimated that the Food and Beverage industry will grow in the
same proportion as in 2019, and in the baseline scenario, an expansion of 2.95% YoY is
expected. by 2020 and 2.83% YoY for 2021 (Graph 4.7).

CHAPTER 4 PROJECTIONS FOR AGRO-INDUSTRY FOR THE NEXT THREE YEARS (2019 TO 2021)72
Graph 4.7
PROJECTED VALUES FOR THE GROWTH OF THE INDUSTRIAL PRODUCTION OF FOOD AND BEVERAGES BETWEEN 2019 AND 2021 (% YOY)
0.49
2.83
3.34
2.15
2.95
2.65 2.74 2.832.60
2019 2020 2021
PESSIMISTIC BASELINE OPTIMISTIC
Source: Prepared by FGV.
4.3. MODEL FOR THE NON-FOOD INDUSTRY PRODUCTS
The estimated model for the Non-Food Products group is presented in the equation 3:
ln_nao.alimentt=1,09 x ln_ibcbr
t + 0,19 x ln_ici
t (Eq.3)
Where:
t: time unit of March/2012 and December/2018;
ln_nao.alimentt: natural logarithm of the Index of Production of Non-Food Products
at time t;
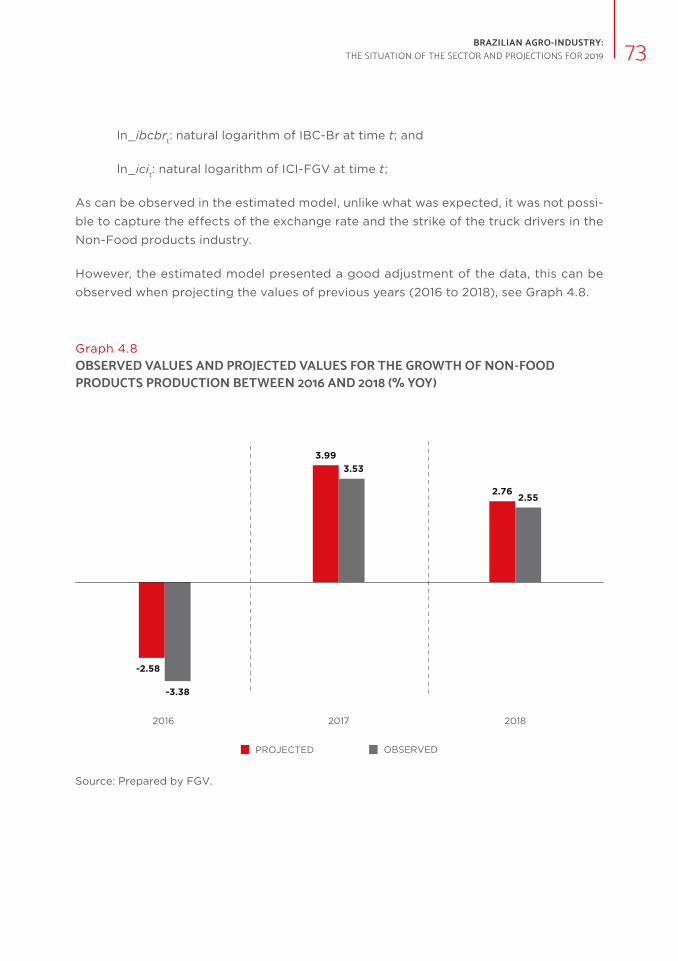
73BRAZILIAN AGRO-INDUSTRY: THE SITUATION OF THE SECTOR AND PROJECTIONS FOR 2019
ln_ibcbrt: natural logarithm of IBC-Br at time t; and
ln_icit: natural logarithm of ICI-FGV at time t;
As can be observed in the estimated model, unlike what was expected, it was not possi-
ble to capture the effects of the exchange rate and the strike of the truck drivers in the
Non-Food products industry.
However, the estimated model presented a good adjustment of the data, this can be
observed when projecting the values of previous years (2016 to 2018), see Graph 4.8.
Graph 4.8
OBSERVED VALUES AND PROJECTED VALUES FOR THE GROWTH OF NON-FOOD PRODUCTS PRODUCTION BETWEEN 2016 AND 2018 (% YOY)
2016 2017 2018
-2.58
-3.38
3.99
3.53
2.762.55
PROJECTED OBSERVED
Source: Prepared by FGV.

CHAPTER 4 PROJECTIONS FOR AGRO-INDUSTRY FOR THE NEXT THREE YEARS (2019 TO 2021)74
Considering the assumed model and the premises adopted, it is estimated that, in the
baseline scenario, Non-Food products production should show a base-year variation of
4.85% in 2019, compared to the previous year. However, in a pessimistic scenario, the
Non-Food products industry may decline in 2019 (-0.81%), and in an optimistic scenario
the projection is 6.94% YoY of growth.
In 2020 and 2021, it is estimated that the Non-Food Products industry will grow at the
same rate as in 2019, and in the baseline scenario, an expansion of 4.90% YoY is expected
for 2020 and 4.56% YoY for 2021 (Graph 4.9).
Graph 4.9
PROJECTED VALUES FOR THE GROWTH OF INDUSTRIAL PRODUCTION OF NON-FOOD PRODUCTS BETWEEN 2019 AND 2021 (% YOY)
2019 2020 2021
-0.81
4.85
6.94
0.12
4.90
6.50
0.12
4.56
6.27
PESSIMISTIC BASELINE OPTIMISTIC
Source: Prepared by FGV.

75BRAZILIAN AGRO-INDUSTRY: THE SITUATION OF THE SECTOR AND PROJECTIONS FOR 2019
4.4. ABOUT THE RESULT FROM THE MODELS
4.4.1 LOWER INCOME ELASTICITY OF DEMAND IN THE FOOD AND BEVERAGE INDUSTRY
The projections for 2019 show that the Food and Beverage group, in the baseline and op-
timistic scenarios, will continue to evolve less than the Non-Food Products industry and,
consequently, Agro-industry as a whole. In the pessimistic scenario, however, the result
is worse for the Non-Food Products industry, reflecting the higher income elasticity of
demand for these products compared to the Food and Beverage industry. That is, in a
pessimistic scenario, it is the Food and Beverage group that should sustain agro-indus-
trial production (Graph 4.10).
Graph 4.10
PROJECTED SCENARIOS FOR THE GROWTH OF AGRO-INDUSTRY, FOOD AND BEVERAGE AND NON-FOOD PRODUCTS PRODUCTION FOR 2019 (% YOY)
AGRO-INDUSTRY FOOD AND BEVERAGE NON-FOOD PRODUCTS
PESSIMISTIC BASELINE OTIMISTIC
0.000.49
-0.81
3.292.83
4.854.41
3.34
6.94
Source: Prepared by FGV.

CHAPTER 4 PROJECTIONS FOR AGRO-INDUSTRY FOR THE NEXT THREE YEARS (2019 TO 2021)76
4.4.2 WHO MOST SUFFERED WITH THE TRUCKERS' STRIKE?
Corroborating the ideas presented previously about the truckers' strike, the Food and
Beverage industry suffered the most from the strike comparing with the Non-Food
Products industry and the agro-industry as a whole, according to the econometric analy-
sis carried out (Graph 4.11).
According to the econometric model for agro-industry, controlling for IBC-BR, ICI-FGV
and exchange rate, the impact of the truck drivers’ strike on agro-industry production
is between -6.8 percentage points and -1.9 percentage points. Considering the average
of the estimates, the strike of the truck drivers caused the result of the Brazilian agro-in-
dustry to be 4.4 percentage points lower if the strike had not occurred. In other words,
agro-industrial production ended the year 2018 with a reduction of 1.0% YoY, but if the
strike had not occurred, possibly agro-industrial production would have grown 3.4% YoY.
Regarding the Food and Beverage industry, the impact of the truck drivers' strike was
even greater (between -12.8 percentage points and -5.8 percentage points). Thus, con-
sidering the average of the estimates, according to the model estimated for this group,
controlling for IBC-BR, ICI-FGV and exchange rate, should the stoppage had not ha-
ppened, the Food and Beverage industry would have presented a growth of 5.2% pa,
instead of having declined by 4.1% per year. In other words, the strike caused the Food
and Beverage industry to grow, on average, by 9.3 percentage points lower.
In the case of the Non-Food Products industry, it was not possible to capture the effect
of the truckers strike, since the dummy for this episode did not appear statistically signi-
ficant. However, this corroborates the previous data analysis, where it was seen that the
impact of the truck drivers' strike in this agro-industry group was somewhat punctual, with
more force in May/2018, with the dissipation of its effects soon after the end of the strike.

77BRAZILIAN AGRO-INDUSTRY: THE SITUATION OF THE SECTOR AND PROJECTIONS FOR 2019
Graph 4.11
ESTIMATED EFFECTS OF THE TRUCK DRIVERS STRIKE IN THE PRODUCTION OF AGRO-INDUSTRY, FOOD AND BEVERAGE AND NON-FOOD PRODUCTS (PERCENTAGE POINTS)
AGRO-INDUSTRY FOOD AND BEVERAGE NON-FOOD PRODUCTS
MAXIMUM AVERAGE MINIMUM
-6.8
-4.4
-1.9
-12.8
-9.3
-5.8
Source: Prepared by FGV.
4.4.3 WHO CLOSELY FOLLOWS THE PERFORMANCE OF THE ECONOMY?
In all the econometric models estimated, the economy (represented by the IBC-Br)
presented high statistical significance, indicating that its performance significantly im-
pacts the production of both the agro-industry as a whole and its groups (Food and
Beverage and Non- Food).
The Non-Food Products industry presented the highest elasticity between the IBC-Br
and its production, between 0.94 and 1.24. Considering the average, the elasticity was
1.09, which means that when the IBC-br shows a growth of 1.0%, the Non-Food Products
industry should grow 1.09%, ceteris paribus.

CHAPTER 4 PROJECTIONS FOR AGRO-INDUSTRY FOR THE NEXT THREE YEARS (2019 TO 2021)78
In the case of agro-industry, the elasticity between IBC-Br and production is between
0.70 and 1.25, ceteris paribus. Considering the average, the elasticity is 0.97, that is, the
elasticity is neutral. Therefore, it is clear that agro-industry closely follows the perfor-
mance of the economy.
Finally, in the case of the Food and Beverage industry, it was found that the elasticity
between the IBC-BR and the production of this industry is between 0.50 and 1.24, ceteris
paribus. In turn, the mean elasticity is 0.87. That is, as expected, the Food and Beverage
group has the lowest elasticity among the three segments analyzed.
Graph 4.12
ELASTICITY BETWEEN IBC-BR AND AGRO-INDUSTRY PRODUCTION, FOOD AND BEVERAGE AND NON-FOOD PRODUCTS
0.70
0.97
1.25
0.50
0.87
1.24
0.94
1.09
1.24
AGRO-INDUSTRY FOOD AND BEVERAGE NON-FOOD PRODUCTS
MAXIMUM AVERAGE MINIMUM
Source: Prepared by FGV.

79BRAZILIAN AGRO-INDUSTRY: THE SITUATION OF THE SECTOR AND PROJECTIONS FOR 2019
4.4.4 WHAT IS THE INFLUENCE OF THE EXCHANGE RATE?
According to the estimated econometric models, the exchange rate has a greater impact
of the Food and Beverage industry than in the agro-industry as a whole, as well as in the
Food Products industry (Graph 4.13).
In the Food and Beverage industry, the average elasticity of the exchange rate and output
is 0.14. That is, the 1.0% increase in the exchange rate should lead to an increase of 0.14%
in Food and Beverage production (this elasticity can vary between 0.05 and 0.23). The
Agro-industry, meanwhile, the average elasticity between the exchange rate is one-half,
of 0.07 (ranging from 0.01 to 0.13). Finally, it was not possible to capture the effect of the
exchange rate of the production of the Non-Food Products industry.
Graph 4.13
ELASTICITY BETWEEN THE EXCHANGE RATE AND AGRO-INDUSTRY PRODUCTION,AND NON-FOOD PRODUCTS
0.01
0.07
0.13
0.05
0.14
0.23
AGRO-INDUSTRY FOOD AND BEVERAGE NON-FOOD PRODUCTS
MAXIMUM AVERAGE MINIMUM
Source: Prepared by FGV.

CHAPTER 4 PROJECTIONS FOR AGRO-INDUSTRY FOR THE NEXT THREE YEARS (2019 TO 2021)80
4.4.5 A THE IMPORTANCE OF INDUSTRIAL ENTREPRENEUR CONFIDENCE
Through the estimated econometric models, it is observed that the impact of a variation in
ICI-FGV on the industrial production in any of the analyzed segments is similar.
That is, the average elasticity between the ICI-FGV and agro-industrial production is
0.17. In the case of the Food and Beverage industry it is 0.17 and in the case of Non-Food
Products it is 0.19. That is, the 1.0% increase in ICI-FGV should cause an increase between
0.17% and 0.19% in the physical production of these segments.
Graph 4.14
ELASTICITY BETWEEN ICI-FGV AND AGRO-INDUSTRY PRODUCTION, FOOD AND BEVERAGE AND NON-FOOD PRODUCTS
0.10
0.17
0.25
0.06
0.17
0.28
0.13
0.19
0.25
AGRO-INDUSTRY FOOD AND BEVERAGE NON-FOOD PRODUCTS
MAXIMUM AVERAGE MINIMUM
Source: Prepared by FGV.

81BRAZILIAN AGRO-INDUSTRY: THE SITUATION OF THE SECTOR AND PROJECTIONS FOR 2019

ATTACHMENT82
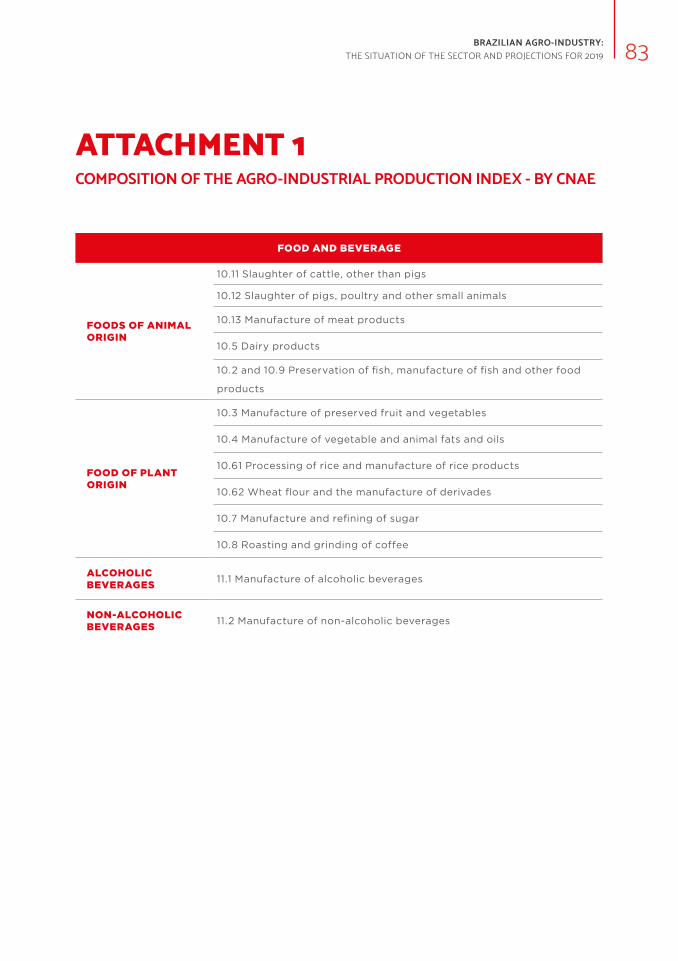
83BRAZILIAN AGRO-INDUSTRY: THE SITUATION OF THE SECTOR AND PROJECTIONS FOR 2019
ATTACHMENT 1COMPOSITION OF THE AGRO-INDUSTRIAL PRODUCTION INDEX - BY CNAE
FOOD AND BEVERAGE
FOODS OF ANIMAL ORIGIN
10.11 Slaughter of cattle, other than pigs
10.12 Slaughter of pigs, poultry and other small animals
10.13 Manufacture of meat products
10.5 Dairy products
10.2 and 10.9 Preservation of fish, manufacture of fish and other food
products
FOOD OF PLANT ORIGIN
10.3 Manufacture of preserved fruit and vegetables
10.4 Manufacture of vegetable and animal fats and oils
10.61 Processing of rice and manufacture of rice products
10.62 Wheat flour and the manufacture of derivades
10.7 Manufacture and refining of sugar
10.8 Roasting and grinding of coffee
ALCOHOLIC BEVERAGES
11.1 Manufacture of alcoholic beverages
NON-ALCOHOLIC BEVERAGES
11.2 Manufacture of non-alcoholic beverages

ATTACHMENT84
NON-FOOD PRODUCTS
BIOFUELS 19.3 Manufacture of biofuels
RUBBER 22.1 Manufacture of rubber products
TOBACCO 12.0 Manufacture of tobacco products
AGRICULTURAL SUPPLIES
20.12 Manufacture of fertilizers intermediates
20.13 Manufacture of fertilizers
20.5 Manufacture of pesticides and household disinfectants
28.3 Manufacture of tractors and machinery and equipment for
agriculture and livestock
FORESTRY PRODUCTS
16.1 Wood splitting
16.2 Manufacture of products of wood, cork and plaited materials, other
than furniture
17.1 Manufacture of pulp and paper pulp
17.2 Manufacture of paper, paperboard and card stock
17.3 Manufacture of paper, paperboard, corrugated board and card
stock
17.4 Manufacture of paper, paperboard, corrugated cardboard and other
goods
TEXTILE
13.1 Preparation and spinning of textile fibers
13.2 Weaving except knitting
13.3 Manufacture of knitted and crocheted fabrics
13.5 Manufacture of other textile products
14.1 Manufacture of wearing apparel and accessories
14.2 Manufacture of knitted and crocheted articles
15.1 Tanning and other leather preparations
15.3 and 15.4 Manufacture of footwear and parts of footwear of any
material
Source: FGV.

85BRAZILIAN AGRO-INDUSTRY: THE SITUATION OF THE SECTOR AND PROJECTIONS FOR 2019

ATTACHMENT86

87BRAZILIAN AGRO-INDUSTRY: THE SITUATION OF THE SECTOR AND PROJECTIONS FOR 2019
ATTACHMENT 2STRUCTURE OF WEIGHTS FOR THE COMPOSITION OF THE AGRO-INDUSTRIAL PRODUCTION INDEX
SECTORS AND SUBSECTORS
CNAEWEIGHTS IN THE TRANSFORMATION INDUSTRY
PESOS NA AGROINDÚSTRIA
FOOD - ANIMAL ORIGIN
10.11 Slaughter of cattle,
other than pigs1.5% 4.1%
10.12 Slaughter of pigs,
poultry and other small
animals
2.0% 5.6%
10.13 Manufacture of
meat products0.2% 0.5%
10.5 Dairy products 1.9% 5.4%
10.2 and 10.9
Preservation of fish,
manufacture of fish and
other food products
2.1% 5.9%
FOOD - VEGETABLE ORIGIN
10.3 Manufacture of
preserved fruit and
vegetables
0.4% 1.2%
10.4 Manufacture of
vegetable and animal fats
and oils
1.9% 5.2%
10.61 Processing of rice
and manufacture of rice
products
0.3% 0.9%
10.62 Wheat flour and the
manufacture of derivades0.5% 1.4%
10.7 Manufacture and
refining of sugar3.6% 10.2%
10.8 Roasting and
grinding of coffee0.3% 0.8%
BEVERAGE - ALCOHOLIC
11.1 Manufacture of
alcoholic beverages1.9% 5.2%

ATTACHMENT88
SECTORS AND SUBSECTORS
CNAEWEIGHTS IN THE TRANSFORMATION INDUSTRY
PESOS NA AGROINDÚSTRIA
BEVERAGE – NON ALCOHOLIC
11.2 Manufacture of non-
alcoholic beverages1.8% 5.1%
BIOFUELS19.3 Manufacture of
biofuels1.1% 3.1%
RUBBER22.1 Manufacture of
rubber products1.2% 3.4%
TOBACCO12.0 Manufacture of
tobacco products1.4% 3.8%
AGRICULTURAL SUPPLIES
20.12 Manufacture of
fertilizers intermediates0.4% 1.0%
20.13 Manufacture of
fertilizers0.8% 2.1%
20.5 Manufacture of
pesticides and household
disinfectants
0.7% 1.9%
28.3 Manufacture of
tractors and machinery
and equipment for
agriculture and livestock
1.0% 2.8%
FORESTRY PRODUCTS
16.1 Wood splitting 0.4% 1.2%
16.2 Manufacture of
products of wood, cork
and plaited materials,
other than furniture
0.8% 2.1%
17.1 Manufacture of pulp
and paper pulp1.0% 2.9%
17.2 Manufacture of
paper, paperboard and
card stock
0.7% 1.9%
17.3 Manufacture of
paper, paperboard,
corrugated board and
card stock
1,2% 3,2%
17.4 Manufacture of
paper, paperboard,
corrugated cardboard
and other goods
1.2% 3.2%

89BRAZILIAN AGRO-INDUSTRY: THE SITUATION OF THE SECTOR AND PROJECTIONS FOR 2019
SECTORS AND SUBSECTORS
CNAEWEIGHTS IN THE TRANSFORMATION INDUSTRY
PESOS NA AGROINDÚSTRIA
TEXTILE
13.1 Preparation and
spinning of textile fibers0.4% 1.0%
13.2 Weaving except
knitting0.8% 2.1%
13.3 Manufacture of
knitted and crocheted
fabrics
0.2% 0.5%
13.5 Manufacture of other
textile products0.5% 1.5%
14.1 Manufacture of
wearing apparel and
accessories
2.5% 6.9%
14.2 Manufacture of
knitted and crocheted
articles
0.1% 0.3%
15.1 Tanning and other
leather preparations0.2% 0.7%
15.3 and 15.4 Manufacture
of footwear and parts of
footwear of any material
1.6% 4.5%
AGRO-INDUSTRY 35.6% 100.0%
Source: FGV.

ATTACHMENT90
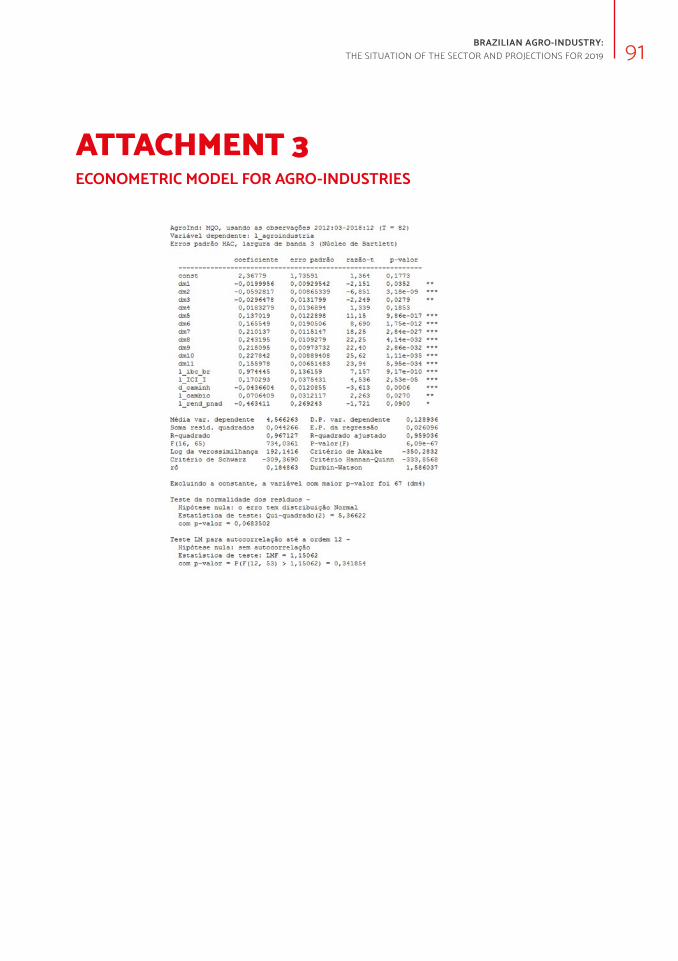
91BRAZILIAN AGRO-INDUSTRY: THE SITUATION OF THE SECTOR AND PROJECTIONS FOR 2019
ATTACHMENT 3ECONOMETRIC MODEL FOR AGRO-INDUSTRIES
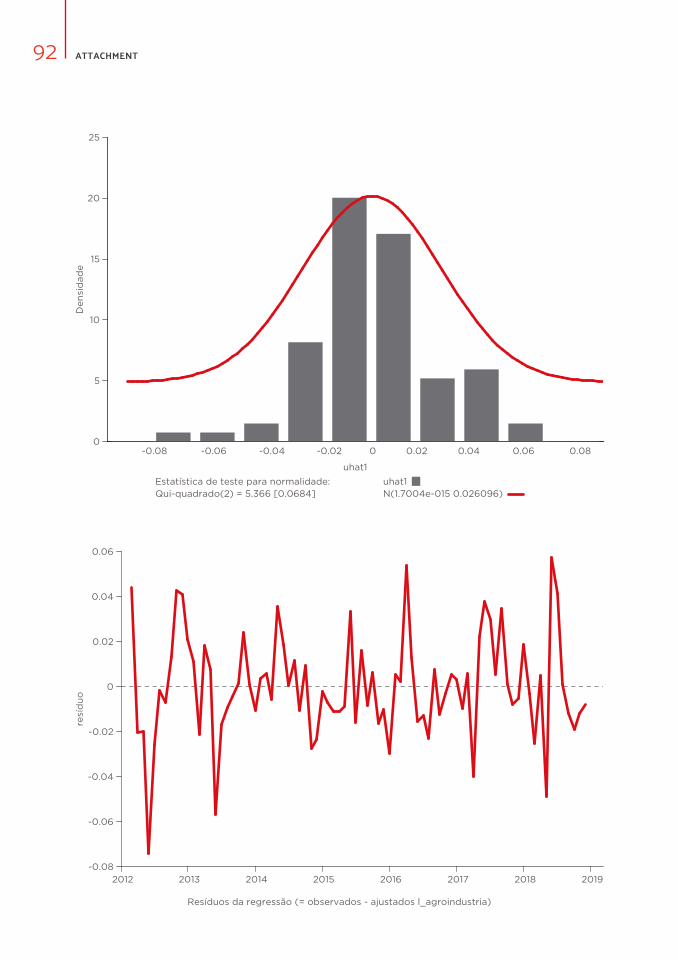
ATTACHMENT92
0
5
10
15
20
25
-0.08 -0.06 -0.04 -0.02 0 0.02 0.04 0.06 0.08
Den
sid
ad
e
uhat1
Estatística de teste para normalidade:Qui-quadrado(2) = 5.366 [0.0684] N(1.7004e-015 0.026096)
uhat1
-0.08
-0.06
-0.04
-0.02
0
0.02
0.04
0.06
2012 2013 2014 2015 2016 2017 2018 2019
resí
du
o
Resíduos da regressão (= observados - ajustados l_agroindustria)

93BRAZILIAN AGRO-INDUSTRY: THE SITUATION OF THE SECTOR AND PROJECTIONS FOR 2019

ATTACHMENT94
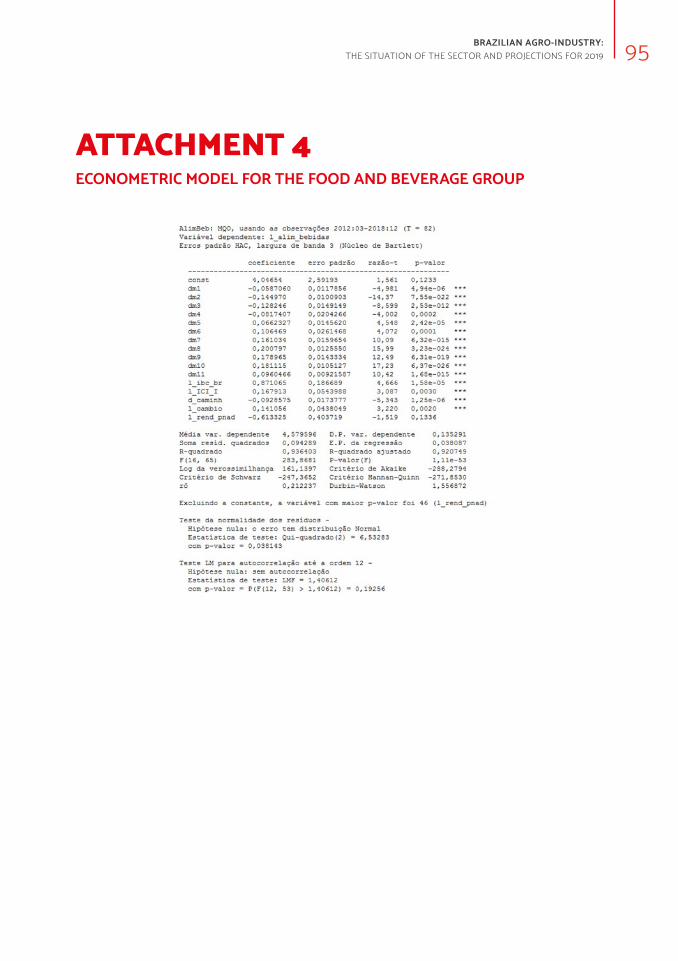
95BRAZILIAN AGRO-INDUSTRY: THE SITUATION OF THE SECTOR AND PROJECTIONS FOR 2019
ATTACHMENT 4ECONOMETRIC MODEL FOR THE FOOD AND BEVERAGE GROUP
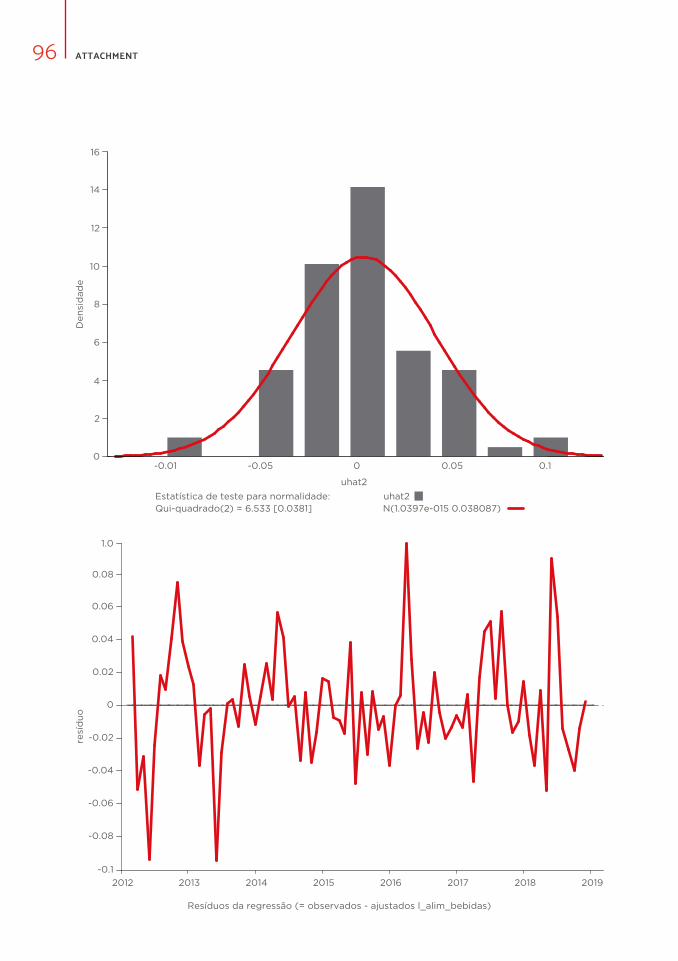
ATTACHMENT96
0
2
6
4
10
8
12
16
14
-0.01 -0.05 0 0.05 0.1
Den
sid
ad
e
uhat2
Estatística de teste para normalidade:Qui-quadrado(2) = 6.533 [0.0381] N(1.0397e-015 0.038087)
uhat2
-0.08
-0.06
-0.04
-0.02
0
0.02
0.04
0.06
2012 2013 2014 2015 2016 2017 2018 2019
resí
du
o
Resíduos da regressão (= observados - ajustados l_alim_bebidas)
-0.1
0.08
1.0

97BRAZILIAN AGRO-INDUSTRY: THE SITUATION OF THE SECTOR AND PROJECTIONS FOR 2019

ATTACHMENT98

99BRAZILIAN AGRO-INDUSTRY: THE SITUATION OF THE SECTOR AND PROJECTIONS FOR 2019
ATTACHMENT 5ECONOMETRIC MODEL FOR THE NON-FOOD GROUP

ATTACHMENT100
0
2
8
4
12
10
16
20
18
-0.06 -0.04 -0.02 0 0.02 0.04 0.06
Den
sid
ad
e
uhat13
6
14
Estatística de teste para normalidade:Qui-quadrado(2) = 0.811 [0.6668] N(6.6097e-016 0.022364)
uhat13
-0.08
-0.06
-0.04
-0.02
0
0.02
0.04
0.06
2012 2013 2014 2015 2016 2017 2018 2019
resí
du
o
Resíduos da regressão (= observados - ajustados l_prod_nao_aliment)

101BRAZILIAN AGRO-INDUSTRY: THE SITUATION OF THE SECTOR AND PROJECTIONS FOR 2019

ATTACHMENT102

103BRAZILIAN AGRO-INDUSTRY: THE SITUATION OF THE SECTOR AND PROJECTIONS FOR 2019


RIO DE JANEIROPraia de Botafogo 190/6º andar
Tel.: +55 21 3799.5498 Fax.: +55 21 2553.8810
SÃO PAULO Av. Paulista 1294/15º andar
Tel.: +55 11 3799.4170 Fax.: +55 11 3262.3569
www.fgv.br/fgvprojetos
Recommended