1
New York City“Budget 360” Overview
FY 2014 through FY 2017
November 2013
Prepared for
2
Budget Questions
1. As this period of transition begins for the new Mayor, what do you wish for New York City? How can the Mayor help achieve that?
2. If you could have the Mayor add anything to your community to make it better, what would it be? And knowing that resources are scarce, what would you be willing to trade to make it happen?
3. How would you suggest the Mayor raise more funds in order to meet the needs of the City? Do you support raising taxes?
4. If you had $100 million of the City budget to spend as you saw fit for the public, what would you prioritize?
5. How much do you think a fire engine costs? What do you think costs more: a fire engine, or an after school program? Do you think that's a meaningful comparison or fair question?

3
Where Does The Money Come From?Estimated Revenues NYC Budget 2013 Total $69 billion
Federal Categorical Grants10%
State Categorial Grants17%
Other Non-Tax Revenues10%
Other Taxes5%
Real Estate-related Taxes2%Business Income Taxes
8%
General Sales Tax9%
Personal Income Tax12%
Property Tax27%
SOURCES: IBO

4
Where Does The Money Come From?Estimated Revenues NYC Budget 2013 Total $69 billion
State and Federal Aid27%
Other Non-Tax Revenues
10%
Taxes63%
SOURCES: IBO

5
Where Does The Money Go?Estimated Spending NYC Budget 2013 Total $69 billion
General Government8%
Debt Service9%
Pension & Fringe Benefits17%
Recreation & Cultural 1%
Health, Sanitation & Environmen-tal Protection
6%
Transportation & Housing2%
Police, Fire & Corrections10%
Social Services19%
Education29%
SOURCES: IBO

6
The Capital Budget: Where Does the Money Go?Capital Commitment Plan 2013 – 2016 (All Funds) Total $34.4 billion
Transportation 15%
Sanitation4%
Public Safety6%
Parks, Libraries & Culturals8%
Housing & Economic Devel-opment
9%
Health and Social Services4%General Services
8%
Environmental Protection 20%
Education 26%
SOURCES: IBO; Fiscal Year 2013 Capital Commitment Plan (October 2012)NOTE: Plan categories defined by IBO. General Services includes public buildings and real estate, and citywide equipment purchases.

7
New York City Charter prescribes a process and due dates for
producing the upcoming fiscal year’s budget
January February March April May June July - September October November
By January 16th
•The Mayor must submit a Preliminary Budget to the City Council
• It is customary for newly elected Mayors to be afforded additional time to produce their first financial plan, often 2 additional weeks.
First Hearings
•The City Council holds public hearings on the Preliminary Budget and representatives from the Borough Boards as well as any member of the public who wishes have the opportunity to submit testimony
By March 25th
•The Council issues a report on its findings and recommendations
By April 26th
•The Mayor must submit a proposed Executive Budget to the Council and also provides a Budget Message to share high level comments
Second Hearings
•The City Council again conducts public hearings
Negotiations
•The Mayor’s Office of Management and Budget and the City Council's Finance Division negotiate to come up with an agreed upon balanced budget
By June 15th
•The Council votes on the budget and any proposed recommendations by the Borough Presidents
Next Five Days
•The Mayor has the opportunity to veto any increases, additions, terms or conditions the Council has made to the budget but cannot alter any decreases the Council has made to the budget. The Council can override a mayoral veto by a two-thirds vote of all Members
After the five days
•The budget becomes the Adopted Budget
In November
• In addition to the charter-mandated process, the Mayor, in most years, produces a public budget modification in November to move money between agencies and make other shifts in revenues and expenses as needed

8
Goals of the “Budget 360”
Review the Mayor’s budget and financial plan for FY2014-2017 & analyses by key institutions to get a 360-degree view of the City’s financial condition, including:
Projected gaps/surpluses for each yearDrivers of projected gaps/surpluses for each yearIdentification of additional budget risks

9
Roles of Institutions Surveyed
• Mayor’s Office & Office of Management and Budget (OMB) produces and updates Preliminary, Executive, and Adopted budgets
• City Comptroller serves as the City’s chief fiscal and auditing officer • Independent Budget
Office (IBO) provides nonpartisan information about the city budget and tax revenues as an independent city-funded agency
• State Comptroller serves as the State’s chief fiscal and auditing officer • Financial Control
Board reviews New York City financial plans since created in 1975 by an act of state legislature
• Citizens Budget Commission provides the public with nonpartisan analysis of New York City and State financial management
NOTE: City Council is not included due to its charter-mandated institutional role in the budget process (see budget calendar)

10
The Mayor cites the following budget drivers with general agreement from institutions
surveyed…• Tax Revenue Estimates
– Highly dependent on economic forecasting
• Increased Spending on Education– A combination of higher government priority & city supporting higher
percentage of total cost
• Debt Service– Debt service growth is projected to outpace growth in local tax
revenues; estimated increase from 12.8% of local tax revenues in FY 2013 to 15% by FY 2017
– Increased by $2.2 billion, or 59%, since 2002
• Non-controllable Expenses– Primarily made up of pensions, fringe benefits, and Medicaid – Grown by $13.3 billion, or 133%, since 2002, compared to controllable
expenses (excluding Education) which have grown by $4.3 billion or 37%, at the rate of inflation
– Estimated increase from 44% of city revenues in FY 2013 to 48% by FY 2017
– Health Insurance and Pensions greatly increasing
11
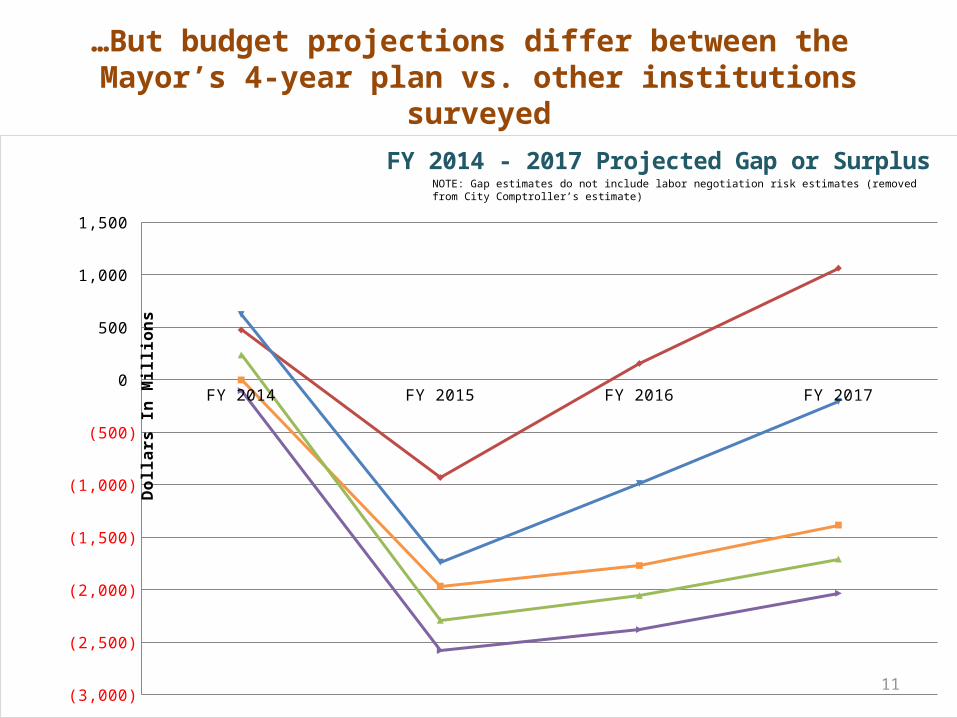
…But budget projections differ between the Mayor’s 4-year plan vs. other institutions
surveyed
FY 2014 FY 2015 FY 2016 FY 2017
Mayor 0 -1965 -1769 -1382
Independent Budget Office 476 -930 157 1065
City Comptroller 624 -1736 -986 -205
State Comptroller 238 -2290 -2054 -1707
Financial Control Board -102 -2579 -2379 -2032
(2,750)
(2,250)
(1,750)
(1,250)
(750)
(250)
250
750
1,250
FY 2014 - 2017 Projected Gap or SurplusD
olla
rs In
Mill
ions
NOTE: Gap estimates do not include labor negotiation risk estimates (removed from City Comptroller’s estimate)
12
City Cmpt '14 IBO '14 City Cmpt '15 IBO '15 City Cmpt '16 IBO '16 City Cmpt '17 IBO '17 -$500
$0
$500
$1,000
$1,500
$2,000
$2,500
$3,000
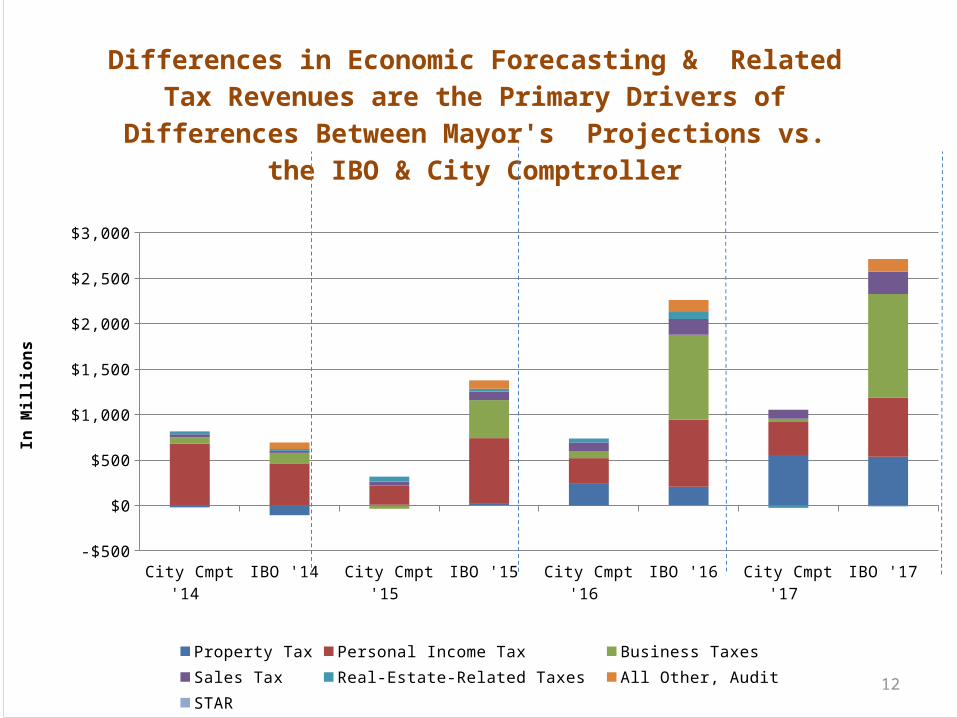
Differences in Economic Forecasting & Related Tax Revenues are the Primary Drivers of Differ-
ences Between Mayor's Projections vs. the IBO & City Comptroller
Property Tax Personal Income Tax Business Taxes Sales Tax Real-Estate-Related Taxes All Other, Audit STAR
In M
illio
ns
13
City Cmpt '14
State Cmpt '14
FCB '14 City Cmpt '15
State Cmpt '15
FCB '15 City Cmpt '16
State Cmpt '16
FCB '16 City Cmpt '17
State Cmpt '17
FCB '17-800
-600
-400
-200
0
200
400
600
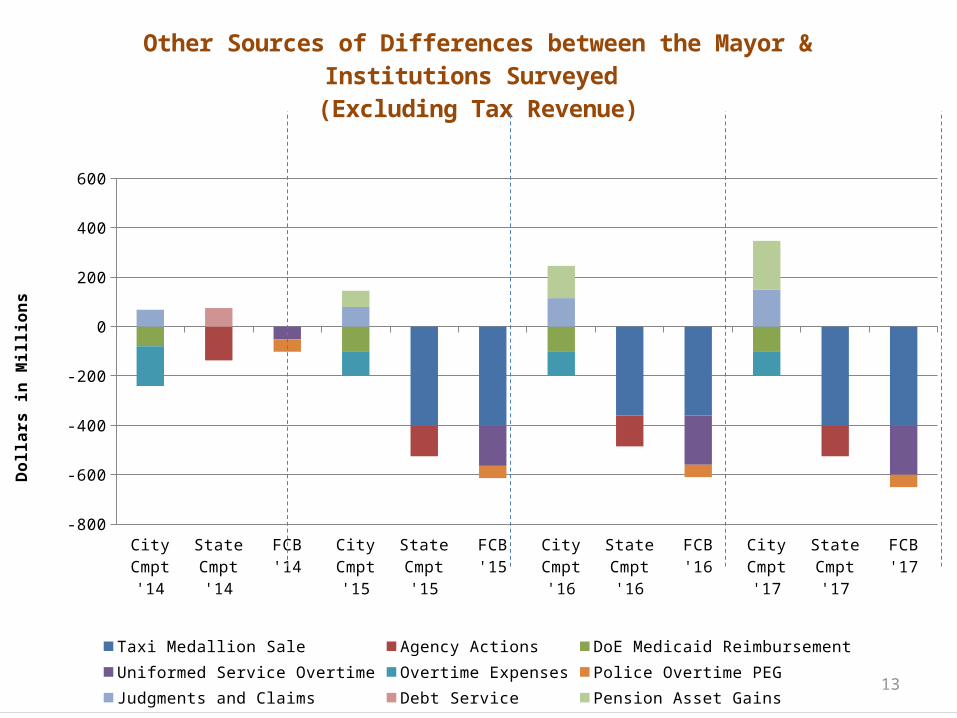
Other Sources of Differences between the Mayor & Institutions Surveyed
(Excluding Tax Revenue)
Taxi Medallion Sale Agency Actions DoE Medicaid ReimbursementUniformed Service Overtime Overtime Expenses Police Overtime PEGJudgments and Claims Debt Service Pension Asset Gains
Dol
lars
in M
illio
ns

14
Settlement of labor contracts could increase projected costs substantially

15
Other risks include federal budget cuts and infrastructure needs
16
Appendices
17
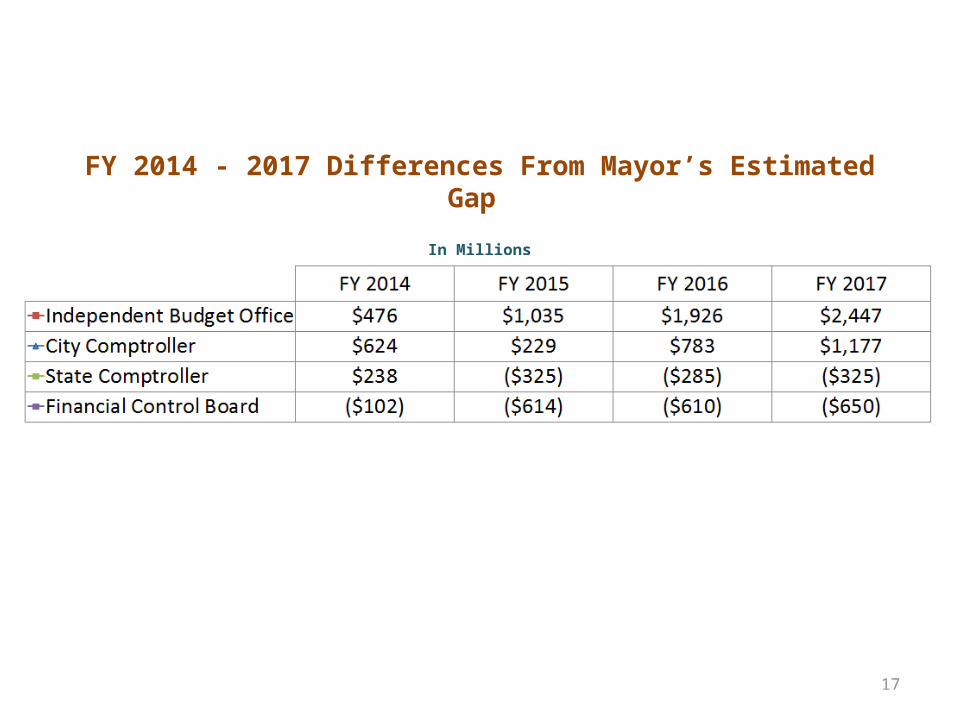
FY 2014 - 2017 Differences From Mayor’s Estimated Gap
In Millions

18
Differences From the Mayor in Tax Revenue EstimatesIn Millions

19
Sources of Differences between the Mayor & Institutions Surveyed (Excluding Tax Revenue)
In Millions
20
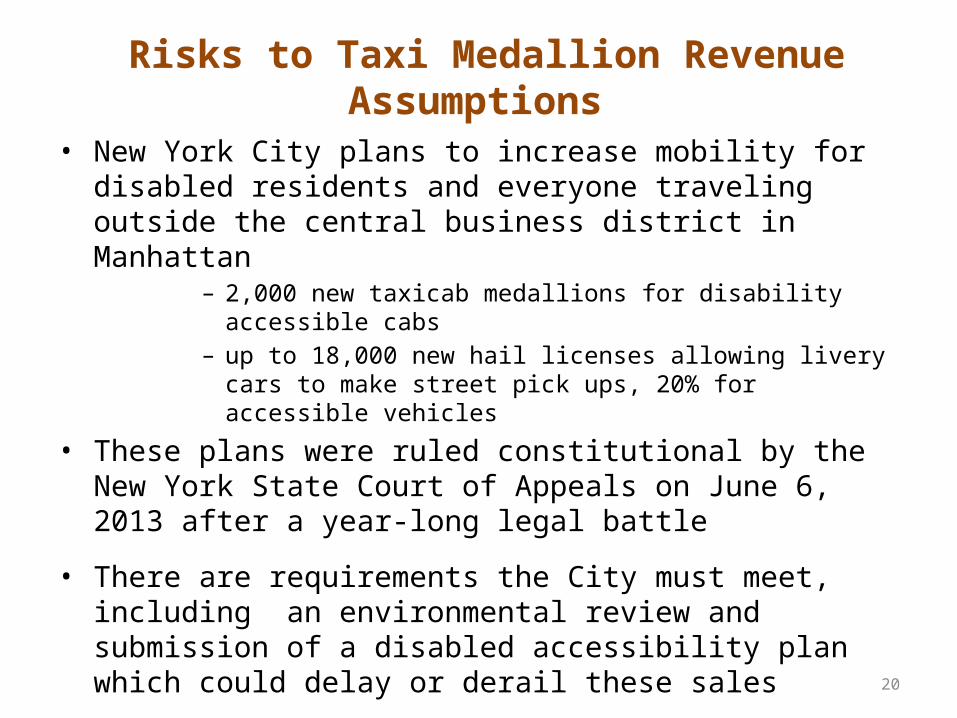
Risks to Taxi Medallion Revenue Assumptions
• New York City plans to increase mobility for disabled residents and everyone traveling outside the central business district in Manhattan
– 2,000 new taxicab medallions for disability accessible cabs
– up to 18,000 new hail licenses allowing livery cars to make street pick ups, 20% for accessible vehicles
• These plans were ruled constitutional by the New York State Court of Appeals on June 6, 2013 after a year-long legal battle
• There are requirements the City must meet, including an environmental review and submission of a disabled accessibility plan which could delay or derail these sales
• The nearly $1.5 billion the Adopted Budget assumes in revenues over the next four years may be at risk ($300 million in FY 14, $400 million in FY 15, $360 million in FY 16, $400 million in FY 17)
Recommended