Building Erie by Buying Erie:
An Import Substitution Strategy for Erie County
for the
Economic Development Corporation of Erie County
by
James A. Kurre, Ph.D. Director
Economic Research Institute of Erie Sam and Irene Black School of Business Penn State Erie, The Behrend College
November 30, 2011

1
Building Erie by Buying Erie: An Import Substitution Strategy for Erie County
“There are essentially only two ways that an economy can grow. Either it can increase its production for the outside world or it can produce for itself what it otherwise would buy from the outside…. The first of these is an expansion of exports. The second is import substitution.”
-Persky et al (1993, p. 18)
I. INTRODUCTION How can a region like Erie grow and develop? More jobs and more income would be welcome in a region which has a per capita income level that is 15%-20% below the national average and an unemployment rate that is usually about a four-tenths of a percentage point above the nation’s.
1
A standard approach to economic development has been to try to sell more locally-produced goods and services outside the area, to expand our markets by finding new external customers. That brings money into the area and increases the size of the local economy. This approach views local firms that bring money into the area as the “export base” of the local economy, and naturally focuses on trying to increase local exports as the means to grow the local economy. But another approach is possible, one that is often overlooked. It starts with the realization that local residents buy many things from sellers outside the area and that if these local customers could be redirected to buy from local firms, they would provide new markets for those local firms just as effectively as new customers elsewhere. We could substitute local production for what was formerly imported—an import substitution strategy. Purchases by local residents from firms located outside the area can be considered leakages out of the local economy, money that flows out rather than staying here to generate more jobs and income from respending. An import substitution strategy seeks to plug some of those leaks. This is a report on a possible import substitution strategy for the Erie area. An import substitution strategy can take many forms. Some groups around the country simply run advertising campaigns that seek to make area residents aware of the wide variety of goods and services that local firms produce, and encourage them to “buy local” instead of from suppliers outside the area. Local First Chicago or the Think Local Program in Bellingham Washington are examples.
2 Sometimes it
1In 2010, Erie’s income per capita was $33,465 and the U.S.’s was $39,945; Erie’s income was 16% below the national level. (U.S.
Bureau of Economic Analysis, Regional Economic Accounts). Between January 1990 and September 2011, Erie’s average unemployment rate was 6.34% compared with the U.S. average of 5.95%. (U.S. Bureau of Labor Statistics.) 2More information can be found at: http://www.localfirstchicago.org/pages/about_us/10.php for Chicago and
http://sustainableconnections.org/thinklocal for Bellingham. The Business Alliance for Living Local Economies (BALLE) also has a

2
takes the form of a local currency such as Ithaca Hours in New York or BerkShares in Massachusetts, or time exchanges in which local residents barter their services with each other.
3 And sometimes it is
Community Supported Agriculture in which local residents provide support for local farmers4, or programs
which encourage local supermarkets to develop supply sources from local farmers. Import substitution does not apply only to physical products. Several researchers have pointed out that it can occur in the area of services, too. Gillis (1987), Cobb and Weinberg (1993), Blackwell, Cobb and Weinberg (2002), and Cobb and Olberding (2007) show that import substitution can apply to such things as a steamboat festival, a boat and travel show, a marathon, and a university. All of these can keep local money local, if they attract resident spending that would otherwise have left the area. Some import substitution programs focus on the business side rather than the consumer side. A program in Oregon focused on the business supply chain approach by trying to connect local businesses with each other—to help local firms find local suppliers to replace input purchases from outside their local area. It started as the Oregon Marketplace and has grown to become the Northwest Connectory, which is: “an on-line database that contains detailed profiles of Pacific Northwest companies
across all industries at every level of the supply chain. The purpose of the tool is to link Oregon businesses to opportunities around the region via a robust, searchable, online “buyer-supplier” database.” (Business Oregon, 2011)
5
Omaha does something similar in its “Say Yes, Buy O!” campaign and its “Buy the Big O!” annual convention, which attracted approximately 5,000 attendees and over 300 businesses in 2011.
6 And the
Greater Des Moines Partnership has a “Buy Into the Circle” campaign which encourages local firms to shift 5% of their purchases to other Des Moines firms.
7 They provide on-line tools for finding local
suppliers, and claim that nearly $90 million of purchases have been brought back to the local area since the inception of the campaign. These business-to-business programs typically try to help local firms find local suppliers. But it is possible to go further still, recognizing that no local area produces everything, and that there are bound to be local input demands for which there are currently no suppliers. This means that there are opportunities for existing firms to consider expanding their range of operations into new product lines, to meet those local demands for imports which are currently pulling money out of the local economy. If local leaders can identify gaps in the local economy, they can also point out profit opportunities for existing firms. Perhaps this approach can even be married to an incubation strategy which encourages new startups in the local area, such as the Economic Gardening program of Littleton, Colorado.
8
This report will identify import substitution opportunities for existing or new businesses in the Erie area, to produce for local demand both from consumers and from businesses. We take a different approach from that typically seen in practice thus far, attempting to identify likely import substitution possibilities both from consumer demands and from current Erie businesses, and do this using existing data.
significant focus on “buying local” although it weds that idea to a broader social agenda. More information on BALLE is at: http://www.livingeconomies.org/aboutus. 3More information on local currencies can be found at the New Economics Institute, http://neweconomicsinstitute.org/content/local-
currencies. More on Ithaca Hours is at http://www.ithacahours.org/ and Berkshares is at: http://www.berkshares.org/. It should be mentioned that local currencies and barter approaches have serious weaknesses, along with their strengths. 4More information on CSA is available from the U.S. Department of Agriculture at: http://www.nal.usda.gov/afsic/pubs/csa/csa.shtml.
5More information on Oregon’s program is at: http://www.oregon4biz.com/Grow-Your-Business/Business-services/Find-Oregon-
Suppliers/. 6More information on Omaha’s campaign is at http://omahachamber.org/chamber/yes.aspx, and on their annual business-to-
business convention is at http://omahachamber.org/news/NewsDetail.aspx?StoryID=17485. 7More information is available at http://www.buyintothecircle.com/.
8A description and history of Littleton’s Economic Gardening program by Chris Gibbons, one of its founders, is available at:
http://www.littletongov.org/bia/economicgardening/.
3
II. WHY IS THIS STUDY NECESSARY? Why should organizations like the Economic Development Corporation consider policies to target selected industries for Erie County? After all, it is logical to expect firms in a market economy to choose their locations based on principles of profit maximization and not need outside intervention in pursuing their own best interests. In a free market economy, if customers are not being served in one area we would expect demand there to be high relative to supply, leading to higher prices and thus higher profits there. The invisible hand of the market will thus signal entrepreneurs that here is a good place to start or expand a business, and resources will be willingly reallocated from other areas and other uses. Similarly, if firms in one area, like Erie, are not being served by local suppliers and instead have to buy inputs from outside the area, incurring higher transportation costs in the process, we might expect entrepreneurs to notice this opportunity for profit. We might expect some entrepreneur to step into this gap and open a company to supply the Erie firms at a lower cost (since there could be transportation savings) and at the same time offer quicker delivery. But in order for this to happen, entrepreneurs have to be aware of the opportunity. Given that there are a very large number of firms (over 20,000 in Erie County in 2009
9) buying a very large variety of inputs, it is
possible that some profit-making opportunities may go unnoticed. It takes knowledge of the kinds of data that are available, and more than a bit of effort (and cost), to ferret out these opportunities. In a smaller economy, it is entirely possible for some of these opportunities to not come to the attention of those who might do something about it. This is a problem of information--more precisely, a lack of information--and this can cause what economists call “market failure,” a situation where the free market gives a wrong answer or misses an opportunity. The market process usually does a pretty good job, but it works best when information is freely available. Small investors, and investors in places where there is not a lot of venture capital freely available, may especially benefit from information of this type. This report seeks to supply information that may have gone unnoticed, in the hopes of pointing out new opportunities for entrepreneurs. If entrepreneurs DO act on this information and open successful new businesses in the local area, there will be a range of benefits to the local area. The entrepreneurs themselves will benefit from the profits that will result, certainly. The local firms that buy from the new businesses should benefit from having suppliers located nearer their operations, which can provide more flexibility and quicker service, and can also result in lower transportation costs. But the local area will also benefit more broadly through the creation of new jobs for local workers, helping increase employment. As workers at these new jobs spend their earnings they will create demand for the goods and services of other local businesses, helping provide new profits for them and generating new business for their suppliers. We may expect a multiplied effect on the local economy. But for any firm to be profitable, it must have enough business to pass some minimum threshold. Different industries have different minimum sizes, different scales of operation. In each industry there is a minimum efficient scale (MES) at which the firm realizes the benefits of large scale operations in the form of lower average costs of production. In some industries the MES is very small, and firms can be profitable at a relatively small size; examples would include pizza shops, beauty salons, and car repair garages. In these cases the industry will be made up of a large number of small firms. But in other industries, the MES requires a larger scale of operation before the firm reaches the lowest cost per unit, industries such as automobile assembly, cigarette production, or refrigerator manufacturing. In these cases there are a rather small number of large firms in the industry. As an industry grows in a region, new opportunities may open up for firms that supply inputs to the growing industry. As industry X grows locally, it may reach the scale at which it buys enough inputs to finally make it profitable for a supplier to open up in the area, catering to the needs of those local firms. The local firms in industry X will already have established supply links with firms outside the area, and a
9According to the Census Bureau, in 2009 there were 6,552 establishments with employees in Erie County, and 13,850
nonemployer establishments which are typically small family-run businesses.
4
new supplier will have to sell existing firms on the idea of switching to a new and unfamiliar supplier. But if industry X has grown large enough for a local supplier to reach its efficient scale and sell at low average cost, it should be able to compete effectively with suppliers outside the area since it can offer quicker delivery and lower transportation costs. Local firms can buy from the new local suppliers, substituting their products for inputs they were previously importing from more distant suppliers outside the area. This would be one form of import substitution New local supply firms can save on transportation costs over firms located at some distance, and this is a true economy for the firms involved and for the economy overall. This means greater efficiency generally, with society getting more output from the same quantity of inputs. But the profitability of these firms depends on the amount of transportation costs. It is clear that inputs that cost the most to transport are the ones that would be likely candidates for this import substitution strategy. So HAS enough growth occurred in the area to warrant the opening of new suppliers, perhaps unnoticed by entrepreneurs? Might there be opportunities for profitable new firms to open locally, to supply inputs to other local firms which had previously been brought in from outside the area? If such opportunities exist unnoticed, it would be possible to help grow the local economy through this import substitution strategy. Answering these questions is the goal of this study.
III. IDENTIFYING IMPORT SUBSTITION POSSIBILITIES Import substitution is not a new idea. It has been a standard strategy on the international economic development stage for many years,
10 although it has been less widely used at the local or regional level.
In his seminal work on urban economics, Thompson (1968, 16) mentions that a region will replace imports with local production as it grows. Jane Jacobs called it “adding new work to old” (1969, 59). But more than two decades later, Persky et al noted that “The theoretical case for emphasizing import substitution is strong. Unfortunately, there has been little discussion of how best to move from theory to actual programs of import substitution at the local level.” (1993, p. 18) So how DO we identify good candidates for import substitution in the local economy? One approach would be to find industries that are under-represented in the local area. If it is typical for industry X to represent 8% of most local economies, but it only represents 5% of this specific local economy, then it is logical to think that the local area may be importing some of that good. This approach makes the basic assumption that local consumption patterns for the good are also typical; low production locally could simply result from local consumers wanting less of the good, after all. In other words, we might expect less than average representation of snow-clearing firms in Orlando, and less than average pool cleaning services in Minneapolis.
11
This approach typically relies on comparison of each industry’s share of local activity (based on measures such as production, employment, sales, or income) with that industry’s share nationally. The ratio of these two is called a location quotient (LQ). Location Quotient in industry i = local percent of total activity in industry i .. national percent of total activity in industry i
10
Bruton (1998) and Kwon (2010) provide an overview of the history of import substitution at the international level and its battle with
an export-based approach. 11
The use of location quotients to identify exports actually involves four assumptions: 1) consumption patterns are identical between
the local area and the nation; 2) labor productivity is also constant across regions, otherwise increased purchases locally might simply signify that local firms are less productive and take more inputs than other areas to make the same amount of output; 3) local demands are met first by local production, so there is no cross-hauling from other areas; and 4) the good involved is homogeneous/ identical across regions so there is no need to import what can be produced locally. (Persky et al (1993) 22.)

5
A location quotient greater than 1.0 implies that the local area is producing more of this good or service than is required for local consumption, and is probably exporting the good outside the region. And an LQ less than one implies that the area isn’t producing enough for local consumption and is importing some of the good to satisfy local demands. (The terms “import” and “export” will be used in this report to refer to purchases or sales outside the region, not necessarily international transactions—although those are included, too.) Persky et al (1993) took this approach to import substitution in the Chicago area. They reasoned that industries that are good candidates for an import substitution strategy should have LQs less than 0.9, and have had growth both in employment and LQ in the preceding period. They thought that this should help rule out industries that are fundamentally unsuited to the area. For example, if the area is importing oil, it makes no sense to target the petroleum industry for import substitution if the area has no naturally-occurring petroleum resources. And they interpreted an increasing LQ as an indicator that there is already some import substitution occurring. They also required the industries to be large enough to make a difference. In their case, the industry had to have at least 1,000 employees in 1986. The location quotient approach is a good first step at identifying import substitution possibilities, and we will apply that to the Erie data in this report. But first, we need to discuss the data involved.
IV. DATA A study of import substitution requires a data base with consistent industry detail for the local area, in our case, Erie County. This seems like a simple issue until you realize that there are over 3,000 counties in the U.S. and over 1,000 industry categories (at the six-digit NAICS level). Not many data bases have that kind of detail. One widely used source is the U.S. Census Bureau’s County Business Patterns database, (hereafter known as CBP) which has been described as providing “…the most industrially detailed employment data publicly available for all states and counties of the United States.” (Isserman and Westervelt, 2006, p. 313) In fact, the Census Bureau says that its CBP “provides the only source of annual, complete, and consistent county-level data for U.S. employer business establishments, with industry detail.” (U.S. Census Bureau, 2011A.) The CBP program includes data on employment and payroll for the first quarter of the year,
12 annual
payroll, and number of establishments by size category of employment. It includes all full- and part-time employees, but excludes proprietors and partners of unincorporated businesses. (U.S. Census Bureau, 2011A.) The CBP data are gathered primarily from administrative records rather than surveys. The CBP program “draws on administrative records of the Internal Revenue Service, the Social Security Administration, and the Bureau of Labor Statistics, giving them a higher degree of reliability than voluntary, unchecked responses to census questions.” (Isserman and Westervelt, 2006, p. 313) It is also available on an annual basis with a lag of “only” about 18 months, which is relatively quick given the amount of data involved—over 2 million records (industries) in over 3,000 counties annually. (Isserman and Westervelt, 2006, p. 313) While CBP has good coverage of economic activity down to the 6-digit NAICS
13 level, it does not include
all industrial sectors. “County Business Patterns covers all NAICS industries except crop and animal production (NAICS 111,112), rail transportation (NAICS 482), Postal Service (NAICS 491), pension, health, welfare, and vacation funds (NAICS 525110, 525120, 525190), trusts, estates, and agency
12
Technically, for the week including March 12. (U.S. Census Bureau, 2011A.) 13
NAICS (pronounced “nakes”) stands for North American Industry Classification System, the government’s accepted way of
classifying industries. The larger the number of digits in the industry code, the greater the level of industrial detail or disaggregation. More info can be found at U.S. Census Bureau (2011D): http://www.census.gov/eos/www/naics/ and in Appendix A.

6
accounts (NAICS 525920), private households (NAICS 814), and public administration (NAICS 92).” (U.S. Census Bureau, 2011A.) While we would prefer to have data on all sectors, we recognize that the world of data is imperfect and that we have limited choices. As choices go, this one is not too bad since most of the omitted sectors are not likely to be of great interest for the purposes of this study anyway. One exception here might be agriculture. We know that Erie County farmers produce for export, but the CBP data omit them. A key drawback of the CBP is that it does not provide detailed data for all industries. By law, the Census Bureau must guarantee confidentiality to business firms. To do so, in some cases the Census Bureau introduces “noise” into the estimates. Cells that include noise may have up to 5% perturbation, but many have less than 2%. So the detailed numbers may be a little off, by design. In cases where the confidentiality problem is more severe, the Census Bureau simply suppresses the data values. This is especially a problem for smaller counties where there are fewer establishments, and it becomes an increasingly common problem the greater the level of industrial detail. Isserman and Westervelt estimate that in 2002 about 2/3 of all data records in CBP were NOT disclosed. That’s quite a hole in the data! But the good news is that most of those problems are at the finer levels of industry detail and for the smaller counties. At the higher levels of industrial aggregation (NAICS 2-digit “supersectors” and 3-digit industry subsectors) most of the data are available for Erie County. Table 1 shows the extent of the non-disclosure problem for employment data for Erie County for 2009, the most recent year for which data are available. Each “cell” is one industry at the level of NAICS detail specified in the column at the left. It is clear that the suppression problem, both in absolute number of cells and in percentage terms, becomes more severe with a greater level of industrial detail.
Table 1 Suppressed Data for Erie County Employment, 2009
NAICS level
Number of Suppressed Cells
Total Number of Cells
% of Cells Suppressed
% of Cells Reported
2 digit 2 20 10.0 90.0 3 digit 23 81 28.4 71.6 4 digit 93 239 38.9 61.1 5 digit 250 473 52.9 47.1 6 digit 375 616 60.9 39.1
Total 663 1,429 46.4 53.6
The good news is that it is often possible to estimate data for the missing cells, given information that the Census Bureau does not suppress. Since they report the number of establishments in each employment size category, it is possible to determine a range within which the missing data value must fall for a particular industry. They also report a Data Suppression Flag for each suppressed cell which gives a separate range for the missing number, providing another clue. And the suppressed data are included in totals at the next higher level of industrial disaggregation; an employment value that is suppressed for a 3-digit industry is included in the total for that industry’s 2-digit parent. These clues make it possible to estimate missing values with a reasonable degree of accuracy. But it is well to remember that these numbers are only estimates. Still, estimates will allow us to identify the industries that are unusually large or small locally, and that is one goal of this project. It was possible to make estimates of the values for the suppressed data cells at the 2- and 3-digit levels. Table 2 reports the amounts of employment and payroll that were involved in those estimated cells. We note that the percentage of the total value of each variable (employment, first quarter payroll, and annual payroll) that was involved in the estimations was smaller than the percentage of cells involved, implying that the suppressed cells tended to be smaller than average.

7
Table 2 Relative Importance of Estimated Data for Erie County, 2009
NAICS level
# of Suppressed
Cells Estimated
% of Cells
Suppressed Estimated
Employment
Involved
% of Total Employment
Involved
1st Quarter Payroll
Involved
% of 1st Qtr Payroll Involved
Annual Payroll
Involved
% of Annual Payroll
Involved
2 digit 2 10.0 6,847 6.0% $70.1 mil 7.8% $262.5 mil 7.1%
3 digit 23 28.4 14,646 12.8 217.0 mil 24.0 800.4 mil 21.6
County Business Patterns provides data on four measures of business activity in the county: number of establishments, first quarter employment, first quarter payroll, and annual payroll. Which of these is most relevant for the purposes of this study? For this study we need a good measure of the amount of activity in each industry. Ideally this would be a measure of output, such as sales or amount of product sold. CBP’s employment and payroll variables are actually measures of inputs, rather than output, but it makes sense to expect these input measures to be correlated with output across industries. If an industry produces more output, it will need more inputs. But this need not always be proportional, as economies or diseconomies of scale may occur. How closely related are input and output measures? CBP does not provide output measures, but the Census Bureau’s Economic Census does. It gives data on sales, a measure of output, as well as first-quarter employment and annual payroll, which are input measures. The Economic Census doesn’t cover as many industries as CBP, and it is conducted only every five years, so its most recent data are for 2007. For those reasons we prefer to use CBP data for the purposes of this study. But the Economic Census data can give us some insight into the relationship between input and output measures. For 2007, data from the Economic Census tells us that the correlation between sales and annual payroll was 0.62 for the 18 two-digit industries for which there were data at the national level, and 0.89 for the 12 two-digit industries for which there were data for Erie. At the three-digit level, the correlation was 0.55 for 82 three-digit industries nationally, and 0.72 for the 47 industries for which there were data for Erie. Recall that the correlation coefficient varies from -1.0 (perfect inverse correlation) to +1.0 (perfect positive or direct correlation.) The correlation between annual sales and first-quarter employment was 0.49 for 18 two-digit industries for the U.S., and 0.82 for 12 two-digit Erie industries. The correlation was 0.41 for 82 three-digit industries nationally, and 0.60 for 47 three-digit Erie industries. These data tell us that the input and output measures are positively correlated, as we had expected. When output rises, so does input—although not in lockstep. The annual payroll measures are more strongly correlated than the first-quarter employment measures, and the relationships are stronger in Erie than for the nation as a whole. Our conclusion is that CBP’s input measures can act as a reasonable proxy for output in the local area, although they will not be perfect. We have our database for analysis.
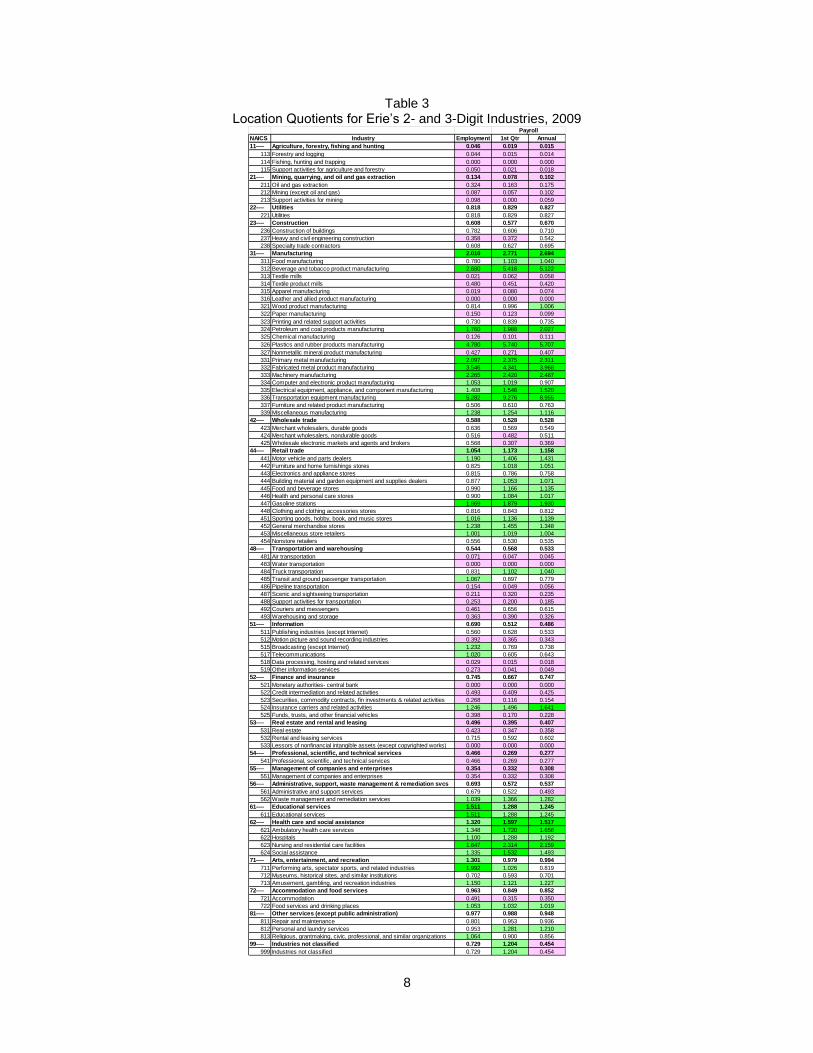
V. ERIE’S EXPORTING AND IMPORTING INDUSTRIES Table 3 shows location quotients (LQs) for Erie’s 2- and 3-digit NAICS industries for 2009, based on first quarter employment, first quarter payroll, and annual payroll. Cells in green denote location quotients greater than one, indicating that Erie has more than the national share of activity in those industries. This implies that Erie exports the output of those industries. Brighter green indicates LQs greater than 1.5, where Erie’s activities are at least 50% higher than what would be expected from national averages. These are Erie’s specialties, our signature industries. In Table 3, we notice clusters of green, especially in the manufacturing sector (NAICS 31-33), the Health Care and Social Assistance sector (62), Educational Services (61), and the Retail sector (44-45).
8
Table 3 Location Quotients for Erie’s 2- and 3-Digit Industries, 2009
NAICS Industry Employment 1st Qtr Annual
11---- Agriculture, forestry, fishing and hunting 0.046 0.019 0.015
113 Forestry and logging 0.044 0.015 0.014
114 Fishing, hunting and trapping 0.000 0.000 0.000
115 Support activities for agriculture and forestry 0.050 0.021 0.018
21---- Mining, quarrying, and oil and gas extraction 0.134 0.078 0.102
211 Oil and gas extraction 0.324 0.163 0.175
212 Mining (except oil and gas) 0.087 0.057 0.102
213 Support activities for mining 0.098 0.000 0.059
22---- Utilities 0.818 0.829 0.827
221 Utilities 0.818 0.829 0.827
23---- Construction 0.608 0.577 0.670
236 Construction of buildings 0.782 0.606 0.710
237 Heavy and civil engineering construction 0.358 0.372 0.542
238 Specialty trade contractors 0.608 0.627 0.695
31---- Manufacturing 2.010 2.771 2.694
311 Food manufacturing 0.780 1.103 1.040
312 Beverage and tobacco product manufacturing 2.680 5.416 5.122
313 Textile mills 0.021 0.062 0.058
314 Textile product mills 0.480 0.451 0.420
315 Apparel manufacturing 0.019 0.080 0.074
316 Leather and allied product manufacturing 0.000 0.000 0.000
321 Wood product manufacturing 0.814 0.996 1.006
322 Paper manufacturing 0.150 0.123 0.099
323 Printing and related support activities 0.730 0.839 0.735
324 Petroleum and coal products manufacturing 1.760 1.988 2.027
325 Chemical manufacturing 0.126 0.101 0.111
326 Plastics and rubber products manufacturing 4.780 5.740 5.707
327 Nonmetallic mineral product manufacturing 0.427 0.271 0.407
331 Primary metal manufacturing 2.097 2.375 2.311
332 Fabricated metal product manufacturing 3.546 4.341 3.968
333 Machinery manufacturing 2.265 2.420 2.487
334 Computer and electronic product manufacturing 1.053 1.019 0.907
335 Electrical equipment, appliance, and component manufacturing 1.408 1.546 1.520
336 Transportation equipment manufacturing 5.282 9.276 8.955
337 Furniture and related product manufacturing 0.506 0.610 0.763
339 Miscellaneous manufacturing 1.238 1.254 1.116
42---- Wholesale trade 0.588 0.528 0.528
423 Merchant wholesalers, durable goods 0.636 0.569 0.549
424 Merchant wholesalers, nondurable goods 0.516 0.482 0.511
425 Wholesale electronic markets and agents and brokers 0.568 0.307 0.369
44---- Retail trade 1.054 1.173 1.158
441 Motor vehicle and parts dealers 1.190 1.406 1.431
442 Furniture and home furnishings stores 0.825 1.018 1.051
443 Electronics and appliance stores 0.815 0.786 0.758
444 Building material and garden equipment and supplies dealers 0.877 1.053 1.071
445 Food and beverage stores 0.990 1.166 1.135
446 Health and personal care stores 0.900 1.084 1.017
447 Gasoline stations 1.869 1.879 1.930
448 Clothing and clothing accessories stores 0.816 0.843 0.812
451 Sporting goods, hobby, book, and music stores 1.016 1.136 1.139
452 General merchandise stores 1.238 1.455 1.348
453 Miscellaneous store retailers 1.001 1.019 1.004
454 Nonstore retailers 0.556 0.530 0.535
48---- Transportation and warehousing 0.544 0.568 0.533
481 Air transportation 0.071 0.047 0.045
483 Water transportation 0.000 0.000 0.000
484 Truck transportation 0.831 1.102 1.040
485 Transit and ground passenger transportation 1.067 0.897 0.779
486 Pipeline transportation 0.154 0.049 0.056
487 Scenic and sightseeing transportation 0.211 0.320 0.235
488 Support activities for transportation 0.253 0.200 0.185
492 Couriers and messengers 0.461 0.656 0.615
493 Warehousing and storage 0.363 0.390 0.326
51---- Information 0.690 0.512 0.486
511 Publishing industries (except Internet) 0.560 0.628 0.533
512 Motion picture and sound recording industries 0.392 0.365 0.343
515 Broadcasting (except Internet) 1.232 0.769 0.738
517 Telecommunications 1.020 0.605 0.643
518 Data processing, hosting and related services 0.029 0.015 0.018
519 Other information services 0.273 0.041 0.049
52---- Finance and insurance 0.745 0.667 0.747
521 Monetary authorities- central bank 0.000 0.000 0.000
522 Credit intermediation and related activities 0.493 0.409 0.425
523 Securities, commodity contracts, fin investments & related activities 0.268 0.116 0.154
524 Insurance carriers and related activities 1.246 1.496 1.641
525 Funds, trusts, and other financial vehicles 0.398 0.170 0.228
53---- Real estate and rental and leasing 0.496 0.395 0.407
531 Real estate 0.423 0.347 0.358
532 Rental and leasing services 0.715 0.592 0.602
533 Lessors of nonfinancial intangible assets (except copyrighted works) 0.000 0.000 0.000
54---- Professional, scientific, and technical services 0.466 0.269 0.277
541 Professional, scientific, and technical services 0.466 0.269 0.277
55---- Management of companies and enterprises 0.354 0.332 0.308
551 Management of companies and enterprises 0.354 0.332 0.308
56---- Administrative, support, waste management & remediation svcs 0.693 0.572 0.537
561 Administrative and support services 0.679 0.522 0.493
562 Waste management and remediation services 1.039 1.366 1.282
61---- Educational services 1.511 1.288 1.245
611 Educational services 1.511 1.288 1.245
62---- Health care and social assistance 1.320 1.597 1.517
621 Ambulatory health care services 1.348 1.720 1.656
622 Hospitals 1.100 1.288 1.192
623 Nursing and residential care facilities 1.647 2.314 2.159
624 Social assistance 1.335 1.532 1.493
71---- Arts, entertainment, and recreation 1.301 0.979 0.994
711 Performing arts, spectator sports, and related industries 1.992 1.026 0.819
712 Museums, historical sites, and similar institutions 0.702 0.593 0.701
713 Amusement, gambling, and recreation industries 1.150 1.121 1.227
72---- Accommodation and food services 0.963 0.849 0.852
721 Accommodation 0.491 0.315 0.350
722 Food services and drinking places 1.053 1.032 1.019
81---- Other services (except public administration) 0.977 0.988 0.948
811 Repair and maintenance 0.801 0.953 0.936
812 Personal and laundry services 0.953 1.281 1.210
813 Religious, grantmaking, civic, professional, and similar organizations 1.064 0.900 0.856
99---- Industries not classified 0.729 1.204 0.454
999 Industries not classified 0.729 1.204 0.454
Payroll

9
At the other end of the spectrum are the cells in white and those highlighted in pink. The white cells have LQs less than 1.0, and the pink cells have LQs less than 0.5. In all of these industries, Erie has less than the level of activity we might expect from national averages. In the pink cells, Erie has less than half the amount we would expect. That implies either that we are consuming less than the usual share of these activities, or that we are importing them from outside the region. It is among these activities that we might expect to find potential candidates for import substitution. As with the exporting industries, there are clusters of pink cells in Table 3, and we’ll point out several of these below. To help with the analysis, Table 4 shows the 3-digit industries ranked from highest to lowest LQ (using annual payroll data). At the top of this table we see the industries we would expect from Erie’s blue-collar heritage: transportation equipment manufacturing (which would include GE’s locomotive operations), plastics, primary and fabricated metals, and machinery manufacturing. We also see some service industries in the export category: insurance carriers, nursing homes, and the offices of medical practitioners (“ambulatory health care services”). Erie has more than its share of these activities and pulls in cash from customers outside the county. There are also some surprises: Erie has significantly more than its share of gasoline service stations, apparently. From Table 3 we notice that there are many pink cells in the Information sector (NAICS 51.) We are apparently letting others do information-related work for us. Yet the table also shows that we have high LQs in the education sector (NAICS 61), and our colleges clearly train people to handle information. Similarly, we have a high LQ in the insurance carriers industry (NAICS 524), which also needs information processing. Sector 54, Professional, Scientific and Technical Services also would seem to fit in with our focus on higher education, as well as the high LQs in manufacturing and health care industries. Table 3 also shows low LQs in sector 48, Transportation and Warehousing. Yet the entries at the top of Table 4 include many industries that make “stuff”, stuff that needs to be transported and stored. In Table 3 we sometimes see a pink row nestled between two green rows. While an industry does not necessarily interact heavily with those adjacent to it in the NAICS listings, sometimes they do. And that is often the case with the chemical industry (NAICS 325) and its neighbors petroleum and coal products manufacturing (NAICS 324) and plastics and rubber products manufacturing (NAICS 326). While Erie has a very low LQ for chemicals, it has LQs significantly greater than 1.0 for the other two industries—and greater than 5 in the case of plastics. Might those exporting industries purchase inputs from the chemical industry, but from outside the area? Might this represent an opportunity for an Erie entrepreneur? The answer to that question clearly depends on which parts of each exporting industry Erie actually has, and the inputs they need. And we’ll turn to the question of inputs in the next section. But before turning to that issue we should point out that not all industries in the pink section at the bottom of Table 4 represent opportunities for Erie import substitution. For example, we’re unlikely to attract firms in sector 212 (mining except oil and gas) unless we suddenly discover previously-unknown natural resources buried locally. Another of the industries near the bottom of the list is NAICS 521—monetary authorities-central bank. Clearly, Erie is unlikely to attract a branch of the Federal Reserve Bank in the near future. And sector 512, motion picture and sound recording, has some presence locally, but it is improbable that we would be able to attract a major presence in this industry since it is heavily concentrated in a few cluster locations, like Los Angeles and New York. We know that for some industries it is important to locate in a cluster of similar firms, requiring the presence of a broad range of related activities to make the location profitable. The movie industry seems to require just these kinds of agglomeration economies. These examples make the case that some of the industries at the bottom of Table 4 have low location quotients because Erie does not possess the factors that are necessary for profitable location of the activity here. We see from Table 3 that not all parts of a broader industry category follow the same pattern with respect to exporting or importing. The manufacturing supersector (NAICS 31-33) shows up as an exporting sector for Erie, but there are several three-digit industries in which Erie imports products. The more industrially detailed the data, the clearer the picture we see. However, there is a tradeoff here—the more industrially detailed the data, the more problem with have with suppression of data, too.

10
Table 4 Erie’s 3-digit Industries, Ranked by Annual Payroll LQ, 2009
NAICS Industry Employment 1st Qtr Annual
336 Transportation equipment manufacturing 5.282 9.276 8.955
326 Plastics and rubber products manufacturing 4.780 5.740 5.707
312 Beverage and tobacco product manufacturing 2.680 5.416 5.122
332 Fabricated metal product manufacturing 3.546 4.341 3.968
333 Machinery manufacturing 2.265 2.420 2.487
331 Primary metal manufacturing 2.097 2.375 2.311
623 Nursing and residential care facilities 1.647 2.314 2.159
324 Petroleum and coal products manufacturing 1.760 1.988 2.027
447 Gasoline stations 1.869 1.879 1.930
621 Ambulatory health care services 1.348 1.720 1.656
524 Insurance carriers and related activities 1.246 1.496 1.641
335 Electrical equipment, appliance, and component manufacturing 1.408 1.546 1.520
624 Social assistance 1.335 1.532 1.493
441 Motor vehicle and parts dealers 1.190 1.406 1.431
452 General merchandise stores 1.238 1.455 1.348
562 Waste management and remediation services 1.039 1.366 1.282
611 Educational services 1.511 1.288 1.245
713 Amusement, gambling, and recreation industries 1.150 1.121 1.227
812 Personal and laundry services 0.953 1.281 1.210
622 Hospitals 1.100 1.288 1.192
451 Sporting goods, hobby, book, and music stores 1.016 1.136 1.139
445 Food and beverage stores 0.990 1.166 1.135
339 Miscellaneous manufacturing 1.238 1.254 1.116
444 Building material and garden equipment and supplies dealers 0.877 1.053 1.071
442 Furniture and home furnishings stores 0.825 1.018 1.051
311 Food manufacturing 0.780 1.103 1.040
484 Truck transportation 0.831 1.102 1.040
722 Food services and drinking places 1.053 1.032 1.019
446 Health and personal care stores 0.900 1.084 1.017
321 Wood product manufacturing 0.814 0.996 1.006
453 Miscellaneous store retailers 1.001 1.019 1.004
811 Repair and maintenance 0.801 0.953 0.936
334 Computer and electronic product manufacturing 1.053 1.019 0.907
813 Religious, grantmaking, civic, professional, and similar organizations 1.064 0.900 0.856
221 Utilities 0.818 0.829 0.827
711 Performing arts, spectator sports, and related industries 1.992 1.026 0.819
448 Clothing and clothing accessories stores 0.816 0.843 0.812
485 Transit and ground passenger transportation 1.067 0.897 0.779
337 Furniture and related product manufacturing 0.506 0.610 0.763
443 Electronics and appliance stores 0.815 0.786 0.758
515 Broadcasting (except Internet) 1.232 0.769 0.738
323 Printing and related support activities 0.730 0.839 0.735
236 Construction of buildings 0.782 0.606 0.710
712 Museums, historical sites, and similar institutions 0.702 0.593 0.701
238 Specialty trade contractors 0.608 0.627 0.695
517 Telecommunications 1.020 0.605 0.643
492 Couriers and messengers 0.461 0.656 0.615
532 Rental and leasing services 0.715 0.592 0.602
423 Merchant wholesalers, durable goods 0.636 0.569 0.549
237 Heavy and civil engineering construction 0.358 0.372 0.542
454 Nonstore retailers 0.556 0.530 0.535
511 Publishing industries (except Internet) 0.560 0.628 0.533
424 Merchant wholesalers, nondurable goods 0.516 0.482 0.511
561 Administrative and support services 0.679 0.522 0.493
999 Industries not classified 0.729 1.204 0.454
522 Credit intermediation and related activities 0.493 0.409 0.425
314 Textile product mills 0.480 0.451 0.420
327 Nonmetallic mineral product manufacturing 0.427 0.271 0.407
425 Wholesale electronic markets and agents and brokers 0.568 0.307 0.369
531 Real estate 0.423 0.347 0.358
721 Accommodation 0.491 0.315 0.350
512 Motion picture and sound recording industries 0.392 0.365 0.343
493 Warehousing and storage 0.363 0.390 0.326
551 Management of companies and enterprises 0.354 0.332 0.308
541 Professional, scientific, and technical services 0.466 0.269 0.277
487 Scenic and sightseeing transportation 0.211 0.320 0.235
525 Funds, trusts, and other financial vehicles 0.398 0.170 0.228
488 Support activities for transportation 0.253 0.200 0.185
211 Oil and gas extraction 0.324 0.163 0.175
523 Securities, commodity contracts, fin investments & related activities 0.268 0.116 0.154
325 Chemical manufacturing 0.126 0.101 0.111
212 Mining (except oil and gas) 0.087 0.057 0.102
322 Paper manufacturing 0.150 0.123 0.099
315 Apparel manufacturing 0.019 0.080 0.074
213 Support activities for mining 0.098 0.000 0.059
313 Textile mills 0.021 0.062 0.058
486 Pipeline transportation 0.154 0.049 0.056
519 Other information services 0.273 0.041 0.049
481 Air transportation 0.071 0.047 0.045
115 Support activities for agriculture and forestry 0.050 0.021 0.018
518 Data processing, hosting and related services 0.029 0.015 0.018
113 Forestry and logging 0.044 0.015 0.014
114 Fishing, hunting and trapping 0.000 0.000 0.000
316 Leather and allied product manufacturing 0.000 0.000 0.000
483 Water transportation 0.000 0.000 0.000
521 Monetary authorities- central bank 0.000 0.000 0.000
533 Lessors of nonfinancial intangible assets (except copyrighted works) 0.000 0.000 0.000
Payroll

11
Tables 5 and 6 provide similar information on location quotients for four-digit industry groups for Erie. Although there are 290 of these industries at the national level, there are data only for 166 of them for Erie. Unfortunately, the data are suppressed for some of Erie’s larger industries in cases where there are few firms in the industry—such as NAICS 3365: railroad rolling stock manufacturing, and 6113: colleges and universities. But with data on 166 industry categories, the glass is still more than half full; although the picture is not complete, it gives us quite a bit of detail.
14
As might be expected, this added industry detail helps identify specific industries that are strong exporters and others that are most probably import industries. The pink cells at the bottom of Table 6 are logical candidates to explore for possible import substitution targets. Of course, they would also need to be compatible with Erie location factors. But that is another study.
VI: AN ALTERNATIVE APPROACH: INPUT-OUTPUT ANALYSIS There is another, more direct way to identify demands in the Erie economy. We know that Erie specializes in some industries, those identified above by location quotients as export industries. Those industries need to buy inputs in order to produce their goods and services, so they have demands for a range of products which they could conceivably buy from local firms. But are there local providers of these inputs, and do they have the capacity to provide the amounts needed by other local producers? If we knew what inputs local firms—in fact, all firms, not just the exporters--need, and how much, we could conceivably calculate the demand for various inputs from local firms. We could then compare those demands with the capacity of local firms to produce (i.e., supply), and identify products for which there is excess demand currently. These cases of excess demand would be prime opportunities for import substitution. One way to determine what inputs local firms need would be to survey them, and ask them to share information on what inputs they buy and in what quantities. This would be a rather expensive and time-consuming project, and would probably get significantly less than 100% participation given that managers are usually pretty busy just running their businesses. Moreover, some firms may consider the requested information to be confidential. An alternate approach is to estimate the amounts of demand for each input using national industry averages. The U.S. Bureau of Economic Analysis publishes national input-output tables which tell us about the interactions of industries.
15 The BEA gathers data on how much firms in each industry buy from
firms in other industries. From this they are able to calculate the amount of each input that a firm in any given industry needs to purchase in order to produce its output—in other words, the recipe for making each industry’s output. These values are called “direct requirement coefficients”, and they are in percentage terms so they sum to 1.00 for each industry. We can think of them as telling us how many cents of each input are necessary for one dollar’s worth of that industry’s output. For example, in order for a firm in the plastics and rubber products industry to produce one dollar of output, it needs to buy 30.1 cents of inputs from the chemical products industry (its biggest single supplier), 6.7 cents of inputs from other plastics and rubber products firms, 2.7 cents from utility companies, 2.3 cents from fabricated metal products firms, 3.5 cents of wholesale trade services, 0.9 cents of truck transportation, 20.8 cents of labor, etc. There is also 10.5 cents of gross operating surplus left for the owners of the firm who risked their capital.
14
There were Erie industries for which the CBP reported data for one or two of the variables (first quarter employment, first quarter
payroll, or annual payroll) but not all three. In the tables below, where one of the variables shows an LQ and another shows a zero value, that indicates that the data for that variable were suppressed for that industry. Annual payroll was the variable with the most complete data. 15
Information about BEA’s Input-Output programs can be found at http://www.bea.gov/industry/index.htm.

12
Table 5 Location Quotients for Erie’s 4-Digit Industries, 2009
Employment 1st Qtr Annual
21---- Mining, quarrying, and oil and gas extraction 0.13 0.08 0.10
2111 Oil and gas extraction 0.00 0.16 0.18
2123 Nonmetallic mineral mining and quarrying 0.00 0.18 0.29
2131 Support activities for mining 0.00 0.00 0.06
2361 Residential building construction 0.78 0.64 0.76
2362 Nonresidential building construction 0.78 0.58 0.67
2371 Utility system construction 0.00 0.00 0.45
2372 Land subdivision 0.00 0.38 0.55
2373 Highway, street, and bridge construction 0.00 0.42 0.78
2381 Foundation, structure, and building exterior contractors 0.63 0.54 0.78
2382 Building equipment contractors 0.67 0.76 0.77
2383 Building finishing contractors 0.63 0.56 0.63
2389 Other specialty trade contractors 0.29 0.26 0.35
31---- Manufacturing 2.01 2.77 2.69
3113 Sugar and confectionery product manufacturing 0.93 0.45 0.39
3118 Bakeries and tortilla manufacturing 0.78 0.99 1.07
3149 Other textile product mills 0.00 0.92 0.83
3211 Sawmills and wood preservation 0.75 0.98 0.82
3219 Other wood product manufacturing 0.99 1.23 1.31
3222 Converted paper product manufacturing 0.22 0.20 0.16
3231 Printing and related support activities 0.73 0.84 0.74
3261 Plastics product manufacturing 5.05 5.71 5.78
3262 Rubber product manufacturing 3.57 5.87 5.39
3273 Cement and concrete product manufacturing 0.89 0.59 0.87
3315 Foundries 4.34 5.17 5.61
3321 Forging and stamping 4.70 5.81 4.78
3323 Architectural and structural metals manufacturing 3.14 3.86 3.65
3327 Machine shops; turned product; and screw, nut, and bolt manufacturing 3.99 4.78 4.10
3328 Coating, engraving, heat treating, and allied activities 4.77 4.51 4.69
3329 Other fabricated metal product manufacturing 3.63 4.79 4.61
3332 Industrial machinery manufacturing 0.00 0.26 0.24
3335 Metalworking machinery manufacturing 7.82 8.58 8.70
3339 Other general purpose machinery manufacturing 2.70 2.91 2.95
3344 Semiconductor and other electronic component manufacturing 2.45 2.14 2.08
3353 Electrical equipment manufacturing 2.41 2.62 2.67
3359 Other electrical equipment and component manufacturing 1.01 1.05 0.97
3362 Motor vehicle body and trailer manufacturing 0.67 0.78 0.78
3371 Household and institutional furniture and kitchen cabinet manufacturing 0.17 0.20 0.16
3372 Office furniture (including fixtures) manufacturing 1.35 1.43 1.93
3391 Medical equipment and supplies manufacturing 1.04 1.14 0.95
3399 Other miscellaneous manufacturing 1.44 1.43 1.35
42---- Wholesale trade 0.59 0.53 0.53
4231 Motor vehicle and motor vehicle parts and supplies merchant wholesalers 0.69 0.43 0.45
4233 Lumber and other construction materials merchant wholesalers 0.62 0.85 0.93
4234 Professional and commercial equipment and supplies merchant wholesalers 0.27 0.21 0.20
4236 Electrical and electronic goods merchant wholesalers 0.24 0.17 0.16
4237 Hardware, plumbing and heating equipment and supplies merchant wholesalers 0.00 0.74 0.72
4238 Machinery, equipment, and supplies merchant wholesalers 1.21 1.42 1.36
4239 Miscellaneous durable goods merchant wholesalers 0.61 0.74 0.64
4241 Paper and paper product merchant wholesalers 1.33 1.07 1.16
4243 Apparel, piece goods, and notions merchant wholesalers 0.04 0.00 0.04
4244 Grocery and related product merchant wholesalers 0.65 0.74 0.77
4246 Chemical and allied products merchant wholesalers 0.76 0.60 0.57
4248 Beer, wine, and distilled alcoholic beverage merchant wholesalers 0.88 0.89 1.17
4249 Miscellaneous nondurable goods merchant wholesalers 0.28 0.23 0.23
4251 Wholesale electronic markets and agents and brokers 0.00 0.31 0.37
44---- Retail trade 1.05 1.17 1.16
4411 Automobile dealers 1.18 1.45 1.47
4412 Other motor vehicle dealers 0.97 1.00 1.14
4413 Automotive parts, accessories, and tire stores 1.29 1.38 1.40
4421 Furniture stores 0.89 1.10 1.11
4422 Home furnishings stores 0.76 0.92 0.98
4431 Electronics and appliance stores 0.82 0.79 0.76
4441 Building material and supplies dealers 0.86 1.04 1.06
4442 Lawn and garden equipment and supplies stores 1.01 1.20 1.19
4451 Grocery stores 0.97 1.10 1.07
4452 Specialty food stores 0.92 1.37 1.30
4453 Beer, wine, and liquor stores 1.48 2.20 2.12
4461 Health and personal care stores 0.90 1.08 1.02
4471 Gasoline stations 1.87 1.88 1.93
4481 Clothing stores 0.86 0.87 0.83
4482 Shoe stores 0.50 0.53 0.52
4483 Jewelry, luggage, and leather goods stores 0.87 0.98 0.96
4511 Sporting goods, hobby, and musical instrument stores 1.08 1.13 1.13
4512 Book, periodical, and music stores 0.87 1.16 1.15
4521 Department stores 1.33 1.59 1.54
4531 Florists 1.52 1.98 1.84
4532 Office supplies, stationery, and gift stores 0.85 0.84 0.77
4533 Used merchandise stores 0.53 0.58 0.59
4539 Other miscellaneous store retailers 1.28 1.15 1.20
4541 Electronic shopping and mail-order houses 0.18 0.10 0.10
4542 Vending machine operators 1.65 2.24 2.01
4543 Direct selling establishments 0.95 1.14 1.16
Payroll

13
Employment 1st Qtr Annual
48---- Transportation and warehousing 0.00 0.00 0.00
4841 General freight trucking 0.88 1.18 1.02
4842 Specialized freight trucking 0.73 0.93 1.08
4853 Taxi and limousine service 0.71 0.51 0.52
4854 School and employee bus transportation 1.94 1.94 1.72
4884 Support activities for road transportation 1.16 0.83 0.75
4885 Freight transportation arrangement 0.18 0.25 0.23
4921 Couriers and express delivery services 0.48 0.67 0.62
4922 Local messengers and local delivery 0.13 0.20 0.38
4931 Warehousing and storage 0.36 0.39 0.33
51---- Information 0.00 0.00 0.00
5111 Newspaper, periodical, book, and directory publishers 0.91 1.45 1.30
5151 Radio and television broadcasting 1.44 1.03 0.95
5182 Data processing, hosting, and related services 0.00 0.02 0.02
5191 Other information services 0.27 0.04 0.05
52---- Finance and insurance 0.00 0.00 0.00
5221 Depository credit intermediation 0.00 0.53 0.56
5222 Nondepository credit intermediation 0.18 0.11 0.12
5231 Securities and commodity contracts intermediation and brokerage 0.27 0.13 0.18
5239 Other financial investment activities 0.26 0.10 0.13
5242 Agencies, brokerages, and other insurance related activities 0.69 0.74 0.70
5259 Other investment pools and funds 0.40 0.00 0.23
53---- Real estate and rental and leasing 0.00 0.00 0.00
5311 Lessors of real estate 0.42 0.37 0.41
5312 Offices of real estate agents and brokers 0.00 0.20 0.19
5313 Activities related to real estate 0.49 0.40 0.40
5321 Automotive equipment rental and leasing 0.00 0.23 0.25
5322 Consumer goods rental 1.19 1.22 1.18
5324 Commercial and industrial machinery and equipment rental and leasing 0.33 0.38 0.39
54---- Professional, scientific, and technical services 0.00 0.00 0.00
5411 Legal services 0.53 0.42 0.46
5412 Accounting, tax preparation, bookkeeping, and payroll services 0.51 0.45 0.40
5413 Architectural, engineering, and related services 0.33 0.31 0.31
5414 Specialized design services 0.00 0.00 0.05
5415 Computer systems design and related services 0.11 0.07 0.07
5416 Management, scientific, and technical consulting services 0.42 0.33 0.31
5417 Scientific research and development services 0.04 0.00 0.02
5418 Advertising, public relations, and related services 2.25 0.39 0.42
5419 Other professional, scientific, and technical services 0.65 0.60 0.57
55---- Management of companies and enterprises 0.00 0.00 0.00
5511 Management of companies and enterprises 0.35 0.33 0.31
56---- Administrative and support and waste management and remediation services 0.00 0.00 0.00
5611 Office administrative services 0.59 0.43 0.42
5612 Facilities support services 0.00 0.08 0.07
5613 Employment services 0.45 0.32 0.28
5614 Business support services 2.41 1.69 1.48
5615 Travel arrangement and reservation services 0.43 0.25 0.22
5616 Investigation and security services 0.37 0.42 0.41
5617 Services to buildings and dwellings 0.71 0.54 0.68
5619 Other support services 0.70 1.48 1.38
5629 Remediation and other waste management services 0.25 0.25 0.23
61---- Educational services 0.00 0.00 0.00
6111 Elementary and secondary schools 1.37 1.38 1.36
6112 Junior colleges 1.60 1.75 1.72
6116 Other schools and instruction 0.50 0.36 0.34
6117 Educational support services 0.28 0.28 0.21
62---- Health care and social assistance 0.00 0.00 0.00
6211 Offices of physicians 1.26 1.81 1.73
6212 Offices of dentists 0.93 1.03 1.01
6213 Offices of other health practitioners 1.41 1.66 1.62
6214 Outpatient care centers 2.15 1.89 1.82
6215 Medical and diagnostic laboratories 0.00 2.61 2.53
6216 Home health care services 0.89 1.21 1.19
6219 Other ambulatory health care services 1.98 2.51 2.41
6221 General medical and surgical hospitals 1.10 1.29 1.19
6223 Specialty (except psychiatric and substance abuse) hospitals 2.10 2.21 2.16
6231 Nursing care facilities 1.19 1.73 1.60
6232 Residential mental retardation, mental health and substance abuse facilities 2.62 3.81 3.51
6233 Community care facilities for the elderly 1.85 2.70 2.58
6241 Individual and family services 1.92 2.05 2.02
6242 Community food and housing, and emergency and other relief services 1.86 1.82 1.71
6243 Vocational rehabilitation services 0.55 0.55 0.50
6244 Child day care services 0.66 0.83 0.81
71---- Arts, entertainment, and recreation 0.00 0.00 0.00
7111 Performing arts companies 1.51 0.59 0.50
7121 Museums, historical sites, and similar institutions 0.00 0.59 0.70
7131 Amusement parks and arcades 0.00 2.36 2.57
7139 Other amusement and recreation industries 1.16 1.27 1.35
72---- Accommodation and food services 0.00 0.00 0.00
7211 Traveler accommodation 0.49 0.30 0.32
7212 RV (recreational vehicle) parks and recreational camps 0.00 0.00 1.41
7221 Full-service restaurants 1.08 1.03 0.99
7222 Limited-service eating places 0.90 0.92 0.96
7223 Special food services 1.27 1.13 1.03
7224 Drinking places (alcoholic beverages) 2.09 2.05 2.09
81---- Other services (except public administration) 0.00 0.00 0.00
8111 Automotive repair and maintenance 0.82 1.02 0.98
8112 Electronic and precision equipment repair and maintenance 0.10 0.06 0.05
8113 Commercial, industrial mach & eqpt (exc auto and electronic) repair & maintenance 1.20 1.44 1.45
8114 Personal and household goods repair and maintenance 0.62 0.47 0.57
8121 Personal care services 1.20 1.28 1.34
8122 Death care services 1.57 2.67 1.96
8123 Drycleaning and laundry services 0.75 1.20 1.22
8129 Other personal services 0.26 0.18 0.20
8131 Religious organizations 0.88 1.05 0.96
8132 Grantmaking and giving services 0.39 0.43 0.44
8133 Social advocacy organizations 1.09 0.68 0.61
8134 Civic and social organizations 3.76 3.73 3.56
8139 Business, professional, labor, political, and similar organizations 0.57 0.37 0.38
Payroll

14
Table 6 Erie’s 4-digit Industries, Ranked by Annual Payroll LQ, 2009
Employment 1st Qtr Annual
3335 Metalworking machinery manufacturing 7.82 8.58 8.70
3261 Plastics product manufacturing 5.05 5.71 5.78
3315 Foundries 4.34 5.17 5.61
3262 Rubber product manufacturing 3.57 5.87 5.39
3321 Forging and stamping 4.70 5.81 4.78
3328 Coating, engraving, heat treating, and allied activities 4.77 4.51 4.69
3329 Other fabricated metal product manufacturing 3.63 4.79 4.61
3327 Machine shops; turned product; and screw, nut, and bolt manufacturing 3.99 4.78 4.10
3323 Architectural and structural metals manufacturing 3.14 3.86 3.65
8134 Civic and social organizations 3.76 3.73 3.56
6232 Residential mental retardation, mental health and substance abuse facilities 2.62 3.81 3.51
3339 Other general purpose machinery manufacturing 2.70 2.91 2.95
3353 Electrical equipment manufacturing 2.41 2.62 2.67
6233 Community care facilities for the elderly 1.85 2.70 2.58
7131 Amusement parks and arcades 2.36 2.57
6215 Medical and diagnostic laboratories 2.61 2.53
6219 Other ambulatory health care services 1.98 2.51 2.41
6223 Specialty (except psychiatric and substance abuse) hospitals 2.10 2.21 2.16
4453 Beer, wine, and liquor stores 1.48 2.20 2.12
7224 Drinking places (alcoholic beverages) 2.09 2.05 2.09
3344 Semiconductor and other electronic component manufacturing 2.45 2.14 2.08
6241 Individual and family services 1.92 2.05 2.02
4542 Vending machine operators 1.65 2.24 2.01
8122 Death care services 1.57 2.67 1.96
3372 Office furniture (including fixtures) manufacturing 1.35 1.43 1.93
4471 Gasoline stations 1.87 1.88 1.93
4531 Florists 1.52 1.98 1.84
6214 Outpatient care centers 2.15 1.89 1.82
6211 Offices of physicians 1.26 1.81 1.73
4854 School and employee bus transportation 1.94 1.94 1.72
6112 Junior colleges 1.60 1.75 1.72
6242 Community food and housing, and emergency and other relief services 1.86 1.82 1.71
6213 Offices of other health practitioners 1.41 1.66 1.62
6231 Nursing care facilities 1.19 1.73 1.60
4521 Department stores 1.33 1.59 1.54
5614 Business support services 2.41 1.69 1.48
4411 Automobile dealers 1.18 1.45 1.47
8113 Commercial, industrial mach & eqpt (exc auto and electronic) repair & maintenance 1.20 1.44 1.45
7212 RV (recreational vehicle) parks and recreational camps 1.41
4413 Automotive parts, accessories, and tire stores 1.29 1.38 1.40
5619 Other support services 0.70 1.48 1.38
6111 Elementary and secondary schools 1.37 1.38 1.36
4238 Machinery, equipment, and supplies merchant wholesalers 1.21 1.42 1.36
3399 Other miscellaneous manufacturing 1.44 1.43 1.35
7139 Other amusement and recreation industries 1.16 1.27 1.35
8121 Personal care services 1.20 1.28 1.34
3219 Other wood product manufacturing 0.99 1.23 1.31
5111 Newspaper, periodical, book, and directory publishers 0.91 1.45 1.30
4452 Specialty food stores 0.92 1.37 1.30
8123 Drycleaning and laundry services 0.75 1.20 1.22
4539 Other miscellaneous store retailers 1.28 1.15 1.20
6216 Home health care services 0.89 1.21 1.19
4442 Lawn and garden equipment and supplies stores 1.01 1.20 1.19
6221 General medical and surgical hospitals 1.10 1.29 1.19
5322 Consumer goods rental 1.19 1.22 1.18
4248 Beer, wine, and distilled alcoholic beverage merchant wholesalers 0.88 0.89 1.17
4543 Direct selling establishments 0.95 1.14 1.16
4241 Paper and paper product merchant wholesalers 1.33 1.07 1.16
4512 Book, periodical, and music stores 0.87 1.16 1.15
4412 Other motor vehicle dealers 0.97 1.00 1.14
4511 Sporting goods, hobby, and musical instrument stores 1.08 1.13 1.13
4421 Furniture stores 0.89 1.10 1.11
4842 Specialized freight trucking 0.73 0.93 1.08
4451 Grocery stores 0.97 1.10 1.07
3118 Bakeries and tortilla manufacturing 0.78 0.99 1.07
4441 Building material and supplies dealers 0.86 1.04 1.06
7223 Special food services 1.27 1.13 1.03
4841 General freight trucking 0.88 1.18 1.02
4461 Health and personal care stores 0.90 1.08 1.02
6212 Offices of dentists 0.93 1.03 1.01
7221 Full-service restaurants 1.08 1.03 0.99
8111 Automotive repair and maintenance 0.82 1.02 0.98
4422 Home furnishings stores 0.76 0.92 0.98
3359 Other electrical equipment and component manufacturing 1.01 1.05 0.97
4483 Jewelry, luggage, and leather goods stores 0.87 0.98 0.96
8131 Religious organizations 0.88 1.05 0.96
7222 Limited-service eating places 0.90 0.92 0.96
5151 Radio and television broadcasting 1.44 1.03 0.95
3391 Medical equipment and supplies manufacturing 1.04 1.14 0.95
4233 Lumber and other construction materials merchant wholesalers 0.62 0.85 0.93
3273 Cement and concrete product manufacturing 0.89 0.59 0.87
Payroll

15
Employment 1st Qtr Annual
4481 Clothing stores 0.86 0.87 0.83
3149 Other textile product mills 0.92 0.83
3211 Sawmills and wood preservation 0.75 0.98 0.82
6244 Child day care services 0.66 0.83 0.81
2373 Highway, street, and bridge construction 0.42 0.78
2381 Foundation, structure, and building exterior contractors 0.63 0.54 0.78
3362 Motor vehicle body and trailer manufacturing 0.67 0.78 0.78
4532 Office supplies, stationery, and gift stores 0.85 0.84 0.77
4244 Grocery and related product merchant wholesalers 0.65 0.74 0.77
2382 Building equipment contractors 0.67 0.76 0.77
2361 Residential building construction 0.78 0.64 0.76
4431 Electronics and appliance stores 0.82 0.79 0.76
4884 Support activities for road transportation 1.16 0.83 0.75
3231 Printing and related support activities 0.73 0.84 0.74
4237 Hardware, plumbing and heating equipment and supplies merchant wholesalers 0.74 0.72
5242 Agencies, brokerages, and other insurance related activities 0.69 0.74 0.70
7121 Museums, historical sites, and similar institutions 0.59 0.70
5617 Services to buildings and dwellings 0.71 0.54 0.68
2362 Nonresidential building construction 0.78 0.58 0.67
4239 Miscellaneous durable goods merchant wholesalers 0.61 0.74 0.64
2383 Building finishing contractors 0.63 0.56 0.63
4921 Couriers and express delivery services 0.48 0.67 0.62
8133 Social advocacy organizations 1.09 0.68 0.61
4533 Used merchandise stores 0.53 0.58 0.59
5419 Other professional, scientific, and technical services 0.65 0.60 0.57
8114 Personal and household goods repair and maintenance 0.62 0.47 0.57
4246 Chemical and allied products merchant wholesalers 0.76 0.60 0.57
5221 Depository credit intermediation 0.53 0.56
2372 Land subdivision 0.38 0.55
4853 Taxi and limousine service 0.71 0.51 0.52
4482 Shoe stores 0.50 0.53 0.52
6243 Vocational rehabilitation services 0.55 0.55 0.50
7111 Performing arts companies 1.51 0.59 0.50
5411 Legal services 0.53 0.42 0.46
2371 Utility system construction 0.45
4231 Motor vehicle and motor vehicle parts and supplies merchant wholesalers 0.69 0.43 0.45
8132 Grantmaking and giving services 0.39 0.43 0.44
5611 Office administrative services 0.59 0.43 0.42
5418 Advertising, public relations, and related services 2.25 0.39 0.42
5616 Investigation and security services 0.37 0.42 0.41
5311 Lessors of real estate 0.42 0.37 0.41
5412 Accounting, tax preparation, bookkeeping, and payroll services 0.51 0.45 0.40
5313 Activities related to real estate 0.49 0.40 0.40
3113 Sugar and confectionery product manufacturing 0.93 0.45 0.39
5324 Commercial and industrial machinery and equipment rental and leasing 0.33 0.38 0.39
8139 Business, professional, labor, political, and similar organizations 0.57 0.37 0.38
4922 Local messengers and local delivery 0.13 0.20 0.38
4251 Wholesale electronic markets and agents and brokers 0.31 0.37
2389 Other specialty trade contractors 0.29 0.26 0.35
6116 Other schools and instruction 0.50 0.36 0.34
4931 Warehousing and storage 0.36 0.39 0.33
7211 Traveler accommodation 0.49 0.30 0.32
5413 Architectural, engineering, and related services 0.33 0.31 0.31
5416 Management, scientific, and technical consulting services 0.42 0.33 0.31
5511 Management of companies and enterprises 0.35 0.33 0.31
2123 Nonmetallic mineral mining and quarrying 0.18 0.29
5613 Employment services 0.45 0.32 0.28
5321 Automotive equipment rental and leasing 0.23 0.25
3332 Industrial machinery manufacturing 0.26 0.24
5629 Remediation and other waste management services 0.25 0.25 0.23
5259 Other investment pools and funds 0.40 0.23
4885 Freight transportation arrangement 0.18 0.25 0.23
4249 Miscellaneous nondurable goods merchant wholesalers 0.28 0.23 0.23
5615 Travel arrangement and reservation services 0.43 0.25 0.22
6117 Educational support services 0.28 0.28 0.21
4234 Professional and commercial equipment and supplies merchant wholesalers 0.27 0.21 0.20
8129 Other personal services 0.26 0.18 0.20
5312 Offices of real estate agents and brokers 0.20 0.19
5231 Securities and commodity contracts intermediation and brokerage 0.27 0.13 0.18
2111 Oil and gas extraction 0.16 0.18
3222 Converted paper product manufacturing 0.22 0.20 0.16
3371 Household and institutional furniture and kitchen cabinet manufacturing 0.17 0.20 0.16
4236 Electrical and electronic goods merchant wholesalers 0.24 0.17 0.16
5239 Other financial investment activities 0.26 0.10 0.13
5222 Nondepository credit intermediation 0.18 0.11 0.12
4541 Electronic shopping and mail-order houses 0.18 0.10 0.10
5612 Facilities support services 0.08 0.07
5415 Computer systems design and related services 0.11 0.07 0.07
2131 Support activities for mining 0.06
8112 Electronic and precision equipment repair and maintenance 0.10 0.06 0.05
5414 Specialized design services 0.05
5191 Other information services 0.27 0.04 0.05
4243 Apparel, piece goods, and notions merchant wholesalers 0.04 0.04
5417 Scientific research and development services 0.04 0.02
5182 Data processing, hosting, and related services 0.02 0.02
Payroll
16
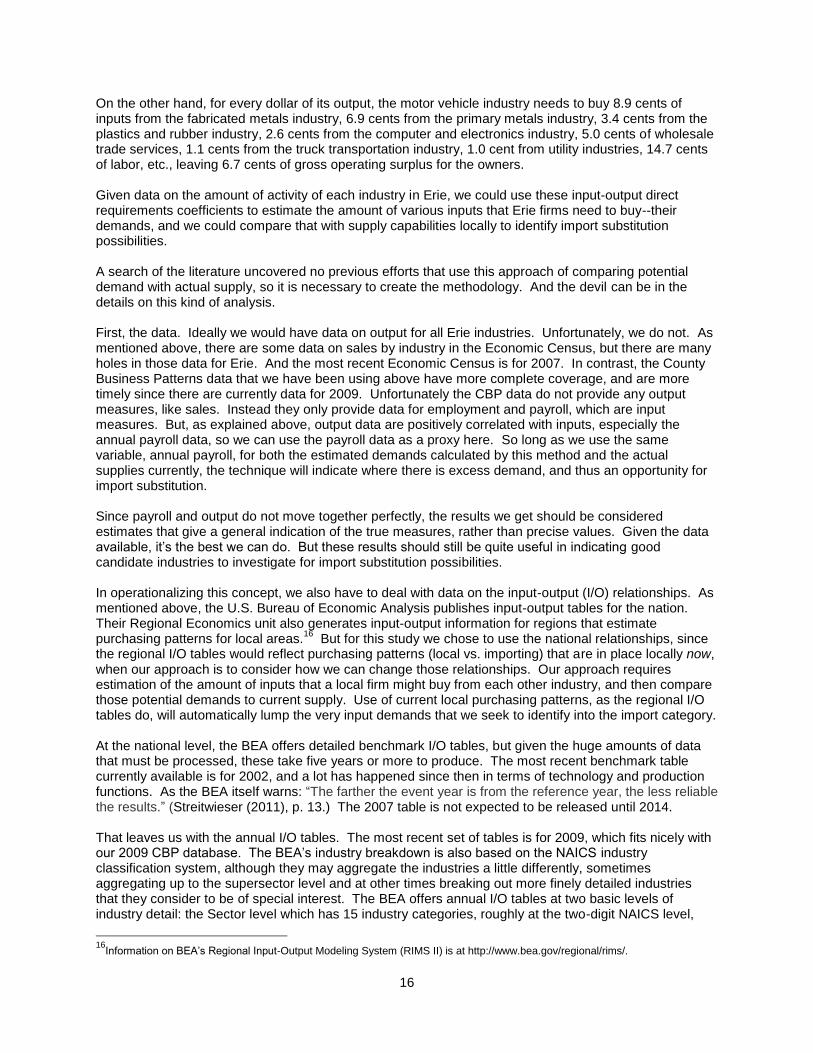
On the other hand, for every dollar of its output, the motor vehicle industry needs to buy 8.9 cents of inputs from the fabricated metals industry, 6.9 cents from the primary metals industry, 3.4 cents from the plastics and rubber industry, 2.6 cents from the computer and electronics industry, 5.0 cents of wholesale trade services, 1.1 cents from the truck transportation industry, 1.0 cent from utility industries, 14.7 cents of labor, etc., leaving 6.7 cents of gross operating surplus for the owners. Given data on the amount of activity of each industry in Erie, we could use these input-output direct requirements coefficients to estimate the amount of various inputs that Erie firms need to buy--their demands, and we could compare that with supply capabilities locally to identify import substitution possibilities. A search of the literature uncovered no previous efforts that use this approach of comparing potential demand with actual supply, so it is necessary to create the methodology. And the devil can be in the details on this kind of analysis. First, the data. Ideally we would have data on output for all Erie industries. Unfortunately, we do not. As mentioned above, there are some data on sales by industry in the Economic Census, but there are many holes in those data for Erie. And the most recent Economic Census is for 2007. In contrast, the County Business Patterns data that we have been using above have more complete coverage, and are more timely since there are currently data for 2009. Unfortunately the CBP data do not provide any output measures, like sales. Instead they only provide data for employment and payroll, which are input measures. But, as explained above, output data are positively correlated with inputs, especially the annual payroll data, so we can use the payroll data as a proxy here. So long as we use the same variable, annual payroll, for both the estimated demands calculated by this method and the actual supplies currently, the technique will indicate where there is excess demand, and thus an opportunity for import substitution. Since payroll and output do not move together perfectly, the results we get should be considered estimates that give a general indication of the true measures, rather than precise values. Given the data available, it’s the best we can do. But these results should still be quite useful in indicating good candidate industries to investigate for import substitution possibilities. In operationalizing this concept, we also have to deal with data on the input-output (I/O) relationships. As mentioned above, the U.S. Bureau of Economic Analysis publishes input-output tables for the nation. Their Regional Economics unit also generates input-output information for regions that estimate purchasing patterns for local areas.
16 But for this study we chose to use the national relationships, since
the regional I/O tables would reflect purchasing patterns (local vs. importing) that are in place locally now, when our approach is to consider how we can change those relationships. Our approach requires estimation of the amount of inputs that a local firm might buy from each other industry, and then compare those potential demands to current supply. Use of current local purchasing patterns, as the regional I/O tables do, will automatically lump the very input demands that we seek to identify into the import category. At the national level, the BEA offers detailed benchmark I/O tables, but given the huge amounts of data that must be processed, these take five years or more to produce. The most recent benchmark table currently available is for 2002, and a lot has happened since then in terms of technology and production functions. As the BEA itself warns: “The farther the event year is from the reference year, the less reliable the results.” (Streitwieser (2011), p. 13.) The 2007 table is not expected to be released until 2014. That leaves us with the annual I/O tables. The most recent set of tables is for 2009, which fits nicely with our 2009 CBP database. The BEA’s industry breakdown is also based on the NAICS industry classification system, although they may aggregate the industries a little differently, sometimes aggregating up to the supersector level and at other times breaking out more finely detailed industries that they consider to be of special interest. The BEA offers annual I/O tables at two basic levels of industry detail: the Sector level which has 15 industry categories, roughly at the two-digit NAICS level,
16
Information on BEA’s Regional Input-Output Modeling System (RIMS II) is at http://www.bea.gov/regional/rims/.

17
and the Summary level, which has 60+ industries, mostly at the 3- and 4-digit NAICS level. We have already seen in the location quotient analysis that the two-digit level is too aggregated to give the kind of information we need, so it makes sense to use the Sector level for this analysis. Appendix B gives the direct requirements coefficients table for these industries for 2009. The process for identifying import substitution candidates for Erie first involves aligning the industries from the CBP data and the I/O data. For our purposes, there were 61 industry categories in the I/O table, although Erie had no data for three of them. It was also necessary to disaggregate NAICS 541 (Professional, scientific and technical services) into three 4-digit industry groups in the CBP data for Erie to get complete coverage. Most of the I/O industries were at the 3-digit level, although some were at the 2-digit and some at the 4-digit level. The full list is given in Appendix Table A-2. These covered all Erie industries from the CBP data except “Industries not classified”, the residual category that included only $126,000 of annual payroll out of an Erie total of $3.7 billion or about three one-thousandths of one percent. The annual payroll value for 2009 for each Erie industry was multiplied by the direct requirements coefficients for each of the 61 I/O industries, yielding the amount that this Erie industry would be expected to buy from each of those 61 industries to produce its output. This was done for all Erie industries, then summed across those Erie industries to get estimated total demand that these Erie firms would have for the inputs produced by the 61 I/O industry categories, in order to produce the amounts the Erie firms actually produced in 2009. These estimated demand amounts can then be compared with the actual amounts the Erie firms produced in 2009 to identify excess demand—our import substitution candidates. For example, in 2009 the Plastics and rubber products manufacturing industry (NAICS 326) had an annual payroll of nearly $121 million. Plastics firms need 30.1 cents of inputs from the Chemical products industry (NAICS 325) to produce a dollar of Plastics products, so we multiply the Erie Plastics’s industry’s $121 million by .301 to get an estimate of the amount that they would buy from the Chemicals industry, about $36.3 million. These amounts are in terms of payroll, so that $36.3 million tells us that local Chemicals firms would need to have hired that much labor in order to generate the products that the Plastics industry would buy from them. We do this for all other Erie industries and that gives a total potential demand for the local Chemicals industry from all local Erie firms. We can then compare that amount to the actual payroll amount of the Chemicals industry in 2009 to get an idea of whether our Chemicals firms were producing enough output just for local Erie firms. In this specific case, there was a total potential demand of approximately $78.1 million (in terms of payroll) for the local Chemicals industry from Erie firms in 2009. The local Chemicals industry actually had payroll of only $4.2 million in 2009, implying that local firms were buying about $74 million of inputs from firms outside Erie county. (Technically, it is the amount of Chemicals products that $74 million of annual payroll could have produced.) This implies that there is a potential for a significant increase in chemicals production in Erie—for import substitution. Table 7 reports the estimated demand, actual supply (annual payroll), and excess demand for all industries for which we have data. Remember that these calculations were all done with annual payroll amounts, rather than output data. Since the annual payroll data are correlated to a reasonable degree with the output values, they can serve as useful proxies—estimates--of the actual values. But this means that the actual excess demand values are in terms of payroll in the respective industries. Still, if there is a positive excess demand, it means that there is potential room for a firm to supply that demand locally. A negative value for excess demand means that Erie is exporting goods and services in that industry. Table 8 reports the same data, but sorted by amount of excess demand. The industries at the bottom of this list with negative excess demand (excess supply, actually) represent Erie’s exporting industries: other transportation equipment (which includes locomotives), hospital and other medical services, retailing, insurance, and educational services, to name a few. But we’re more interested in those at the top of the list—those that are potential targets for an import substitution strategy. The top candidates in the manufacturing category include chemicals, primary

18
Table 7 Estimated Demand, Actual Supply, and Excess Demand
(All values are in terms of thousands of dollars of annual payroll.)
Total
Estimated Actual Excess
Industry Category Demand Supply Demand
111CA Farms 16,020 20 16,000
113FF Forestry, fishing, and related activities 3,723 40 3,683
211 Oil and gas extraction 13,357 1,495 11,862
212 Mining, except oil and gas 6,424 947 5,477
213 Support activities for mining 62 827 -765
22 Utilities 37,317 34,209 3,108
23 Construction 12,206 143,610 -131,404
311FT Food and beverage and tobacco products 35,043 70,408 -35,365
313TT Textile mills and textile product mills 4,584 1,316 3,268
315AL Apparel and leather and allied products 1,475 183 1,292
321 Wood products 9,453 9,505 -52
322 Paper products 15,368 1,463 13,905
323 Printing and related support activities 7,803 11,928 -4,125
324 Petroleum and coal products 23,475 12,811 10,663
325 Chemical products 78,078 4,213 73,865
326 Plastics and rubber products 33,362 120,544 -87,182
327 Nonmetallic mineral products 12,023 5,054 6,969
331 Primary metals 75,794 32,636 43,158
332 Fabricated metal products 82,582 180,556 -97,974
333 Machinery 22,581 95,804 -73,223
334 Computer and electronic products 67,665 45,021 22,644
335 Electrical equipment, appliances, and components 15,577 19,354 -3,777
3361MV Motor vehicles, bodies and trailers, and parts 14,486 0 14,486
3364OT Other transportation equipment 83,578 487,452 -403,874
337 Furniture and related products 2,595 7,549 -4,954
339 Miscellaneous manufacturing 18,441 23,789 -5,348
42 Wholesale trade 69,189 134,475 -65,286
44RT Retail trade 10,152 313,973 -303,821
481 Air transportation 6,365 794 5,571
482 Rail transportation 5,245 0 5,245
483 Water transportation 408 0 408
484 Truck transportation 22,405 40,245 -17,840
485 Transit and ground passenger transportation 1,587 6,010 -4,423
486 Pipeline transportation 1,032 163 868
487OS Other transportation and support activities 12,819 13,516 -697
493 Warehousing and storage 11,771 6,189 5,582
511 Publishing industries (includes software) 6,950 30,430 -23,480
512 Motion picture and sound recording industries 5,971 4,184 1,786
513 Broadcasting and telecommunications 27,078 47,957 -20,879
514 Information and data processing services 10,922 813 10,109
521CI Fed Reserve banks, credit intermediation, & related 44,740 51,908 -7,168
523 Securities, commodity contracts, and investments 32,442 16,789 15,653
524 Insurance carriers and related activities 85,152 193,592 -108,440
525 Funds, trusts, and other financial vehicles 2,070 192 1,878
531 Real estate 124,198 16,016 108,182
532RL Rental and leasing svcs & lessors of intangible assets 39,907 9,178 30,729
5411 Legal services 26,477 31,552 -5,075
5412OP Misc professional, scientific, and technical services 152,439 73,873 78,566
5415 Computer systems design and related services 18,157 5,855 12,302
55 Management of companies and enterprises 72,423 62,155 10,268
561 Administrative and support services 87,686 103,051 -15,365
562 Waste management and remediation services 7,388 15,648 -8,260
61 Educational services 2,768 99,910 -97,142
621 Ambulatory health care services 17,422 395,212 -377,790
622HO Hospitals and nursing and residential care facilities 151 394,813 -394,662
624 Social assistance 0 61,060 -61,060
711AS Performing arts, spectator sports, museums, & related 7,725 20,818 -13,093
713 Amusements, gambling, and recreation industries 1,074 25,581 -24,507
721 Accommodation 6,125 11,972 -5,847
722 Food services and drinking places 15,865 104,723 -88,858
81 Other services, except government 27,289 100,770 -73,481

19
Table 8 Estimated Demand, Actual Supply, and Excess Demand, Sorted by Excess Demand
(All values are in terms of thousands of dollars of annual payroll.)
Total
Estimated Actual Excess
Industry Category Demand Supply Demand
531 Real estate 124,198 16,016 108,182
5412OP Misc professional, scientific, and technical services 152,439 73,873 78,566
325 Chemical products 78,078 4,213 73,865
331 Primary metals 75,794 32,636 43,158
532RL Rental and leasing svcs & lessors of intangible assets 39,907 9,178 30,729
334 Computer and electronic products 67,665 45,021 22,644
111CA Farms 16,020 20 16,000
523 Securities, commodity contracts, and investments 32,442 16,789 15,653
3361MV Motor vehicles, bodies and trailers, and parts 14,486 0 14,486
322 Paper products 15,368 1,463 13,905
5415 Computer systems design and related services 18,157 5,855 12,302
211 Oil and gas extraction 13,357 1,495 11,862
324 Petroleum and coal products 23,475 12,811 10,663
55 Management of companies and enterprises 72,423 62,155 10,268
514 Information and data processing services 10,922 813 10,109
327 Nonmetallic mineral products 12,023 5,054 6,969
493 Warehousing and storage 11,771 6,189 5,582
481 Air transportation 6,365 794 5,571
212 Mining, except oil and gas 6,424 947 5,477
482 Rail transportation 5,245 0 5,245
113FF Forestry, fishing, and related activities 3,723 40 3,683
313TT Textile mills and textile product mills 4,584 1,316 3,268
22 Utilities 37,317 34,209 3,108
525 Funds, trusts, and other financial vehicles 2,070 192 1,878
512 Motion picture and sound recording industries 5,971 4,184 1,786
315AL Apparel and leather and allied products 1,475 183 1,292
486 Pipeline transportation 1,032 163 868
483 Water transportation 408 0 408
321 Wood products 9,453 9,505 -52
487OS Other transportation and support activities 12,819 13,516 -697
213 Support activities for mining 62 827 -765
335 Electrical equipment, appliances, and components 15,577 19,354 -3,777
323 Printing and related support activities 7,803 11,928 -4,125
485 Transit and ground passenger transportation 1,587 6,010 -4,423
337 Furniture and related products 2,595 7,549 -4,954
5411 Legal services 26,477 31,552 -5,075
339 Miscellaneous manufacturing 18,441 23,789 -5,348
721 Accommodation 6,125 11,972 -5,847
521CI Fed Reserve banks, credit intermediation, & related 44,740 51,908 -7,168
562 Waste management and remediation services 7,388 15,648 -8,260
711AS Performing arts, spectator sports, museums, & related 7,725 20,818 -13,093
561 Administrative and support services 87,686 103,051 -15,365
484 Truck transportation 22,405 40,245 -17,840
513 Broadcasting and telecommunications 27,078 47,957 -20,879
511 Publishing industries (includes software) 6,950 30,430 -23,480
713 Amusements, gambling, and recreation industries 1,074 25,581 -24,507
311FT Food and beverage and tobacco products 35,043 70,408 -35,365
624 Social assistance 0 61,060 -61,060
42 Wholesale trade 69,189 134,475 -65,286
333 Machinery 22,581 95,804 -73,223
81 Other services, except government 27,289 100,770 -73,481
326 Plastics and rubber products 33,362 120,544 -87,182
722 Food services and drinking places 15,865 104,723 -88,858
61 Educational services 2,768 99,910 -97,142
332 Fabricated metal products 82,582 180,556 -97,974
524 Insurance carriers and related activities 85,152 193,592 -108,440
23 Construction 12,206 143,610 -131,404
44RT Retail trade 10,152 313,973 -303,821
621 Ambulatory health care services 17,422 395,212 -377,790
622HO Hospitals and nursing and residential care facilities 151 394,813 -394,662
3364OT Other transportation equipment 83,578 487,452 -403,874

20
metals, computer and electronic products, motor vehicles and, ironically to those of us that know Erie’s history, paper products. The non-manufacturing category includes real estate, selected professional, scientific and technical services, rental and leasing services, securities and investments, and computer systems design to name a few. It is useful to remember when using input-output analysis that this technique assumes simple proportional relationships between the inputs and the outputs. In other words, it assumes that a doubling of output will mean a doubling of all inputs in the production process. This assumption of constant returns to scale is clearly not accurate for some industries, especially if there are large changes in the amount of output. If there are economies of scale—benefits to larger scale production—then the amount of inputs needed will be less than proportional to the change in inputs. In other words, a doubling of the output will require less than a doubling of the inputs because there are benefits to large scale production. This will happen if the industry is at less than its minimum efficient scale, as discussed earlier. This may mean that the actual benefits from import substitution in terms of jobs and payroll may be smaller than estimated from the simple proportional calculations. But that would also mean that costs of production are falling and local firms that purchase these inputs will be reaping benefits in the form of lower input costs, and that will inject greater profits into the local economy to help offset the other effect.
VII. PUTTING THE PIECES TOGETHER: IDENTIFYING IMPORT SUBSTITUTION CANDIDATES FOR ERIE We have identified import substitution candidates using two different methods: location quotients and input-output analysis. The first compares Erie’s proportion of each industry with the national averages to identify industries where Erie has less than “its share”. The second uses a more sophisticated analysis, comparing Erie’s current supply by each industry with the demands we might expect from existing Erie firms, to identify excess demand industries. The top candidates from each technique are listed in Tables 9 and 10. But just because an industry makes one of these two lists does not necessarily mean it is a good target for import substitution for Erie. As has been noted above, an industry may be under-represented in Erie because the area is simply not suited to that activity. This may be due, perhaps, to a lack of crucial natural resources as is the case with coal mining. Or it may be an industry in which firms need to locate in a cluster of related suppliers and customers, and Erie simply may not have that particular cluster. Examples would be movie-making, automobile manufacturing, and investment banking. But it makes sense to examine the list of likely candidates in Tables 9 and 10 looking for industries that could flourish in Erie’s economic environment. In this regard it is logical to focus especially on industries that are similar to those that are currently doing well here, candidates that are similar to industries with high location quotients. This suggests that we pay special attention to low LQ and high excess demand industries in the manufacturing sector, and to industries connected with health care and education, sectors where Erie has high location quotients. In the manufacturing category, Chemical products (NAICS 325) makes both the low LQ and high excess demand lists. As mentioned above, this industry would appear to tie into other local manufacturing industries, especially Plastics (NAICS 326). Paper manufacturing (NAICS 322) also makes both lists, and the region presumably has some reserves of expertise in this field. Of special interest on the excess demand list are also Primary Metals (NAICS 331) and Computer and electronics manufacturing (NAICS 334). Tied to these industries are the Transportation and Warehousing industries. Air Transportation (NAICS 481) makes both lists, as does Warehousing and Storage (NAICS 493). Rail Transportation (NAICS 482) shows excess demand, and is not in the LQ table because that industry is excluded from the CBP database. And Water Transportation (NAICS 483) is also on the low LQ list. These sectors would

21
Table 9
Candidate Industries with Annual Payroll Location Quotients Less than 0.50
Table 10 Candidate Industries with More than $5 million of (Annual Payroll) Excess Demand
NAICS Industry Employment 1st Qtr Annual
533 Lessors of nonfin intangible assets (exc copyrighted works) 0.000 0.000 0.000
521 Monetary authorities- central bank 0.000 0.000 0.000
483 Water transportation 0.000 0.000 0.000
316 Leather and allied product manufacturing 0.000 0.000 0.000
114 Fishing, hunting and trapping 0.000 0.000 0.000
113 Forestry and logging 0.044 0.015 0.014
518 Data processing, hosting and related services 0.029 0.015 0.018
115 Support activities for agriculture and forestry 0.050 0.021 0.018
481 Air transportation 0.071 0.047 0.045
519 Other information services 0.273 0.041 0.049
486 Pipeline transportation 0.154 0.049 0.056
313 Textile mills 0.021 0.062 0.058
213 Support activities for mining 0.098 0.000 0.059
315 Apparel manufacturing 0.019 0.080 0.074
322 Paper manufacturing 0.150 0.123 0.099
212 Mining (except oil and gas) 0.087 0.057 0.102
325 Chemical manufacturing 0.126 0.101 0.111
523 Securities, commodity contracts, fin investments & related 0.268 0.116 0.154
211 Oil and gas extraction 0.324 0.163 0.175
488 Support activities for transportation 0.253 0.200 0.185
525 Funds, trusts, and other financial vehicles 0.398 0.170 0.228
487 Scenic and sightseeing transportation 0.211 0.320 0.235
541 Professional, scientific, and technical services 0.466 0.269 0.277
551 Management of companies and enterprises 0.354 0.332 0.308
493 Warehousing and storage 0.363 0.390 0.326
512 Motion picture and sound recording industries 0.392 0.365 0.343
721 Accommodation 0.491 0.315 0.350
531 Real estate 0.423 0.347 0.358
425 Wholesale electronic markets and agents and brokers 0.568 0.307 0.369
327 Nonmetallic mineral product manufacturing 0.427 0.271 0.407
314 Textile product mills 0.480 0.451 0.420
522 Credit intermediation and related activities 0.493 0.409 0.425
999 Industries not classified 0.729 1.204 0.454
561 Administrative and support services 0.679 0.522 0.493
Payroll
Total
Estimated Actual Excess
Industry Category Demand Supply Demand
531 Real estate 124,198 16,016 108,182
5412OP Misc professional, scientific, and technical services 152,439 73,873 78,566
325 Chemical products 78,078 4,213 73,865
331 Primary metals 75,794 32,636 43,158
532RL Rental and leasing svcs & lessors of intangible assets 39,907 9,178 30,729
334 Computer and electronic products 67,665 45,021 22,644
111CA Farms 16,020 20 16,000
523 Securities, commodity contracts, and investments 32,442 16,789 15,653
3361MV Motor vehicles, bodies and trailers, and parts 14,486 0 14,486
322 Paper products 15,368 1,463 13,905
5415 Computer systems design and related services 18,157 5,855 12,302
211 Oil and gas extraction 13,357 1,495 11,862
324 Petroleum and coal products 23,475 12,811 10,663
55 Management of companies and enterprises 72,423 62,155 10,268
514 Information and data processing services 10,922 813 10,109
327 Nonmetallic mineral products 12,023 5,054 6,969
493 Warehousing and storage 11,771 6,189 5,582
481 Air transportation 6,365 794 5,571
212 Mining, except oil and gas 6,424 947 5,477
482 Rail transportation 5,245 0 5,245

22
appear to complement Truck Transportation (NAICS 484) where Erie has an LQ slightly higher than one and a serious excess supply—indicating that Erie exports trucking services to other areas. Table 11 shows the 20 industries with the highest direct requirements coefficients for each of selected transportation and warehousing industries. In other words, these are the industries to whom trucking and warehousing is most important. It would make sense to consult these lists as import substitution targets are chosen, since cleverly chosen targets may also lead to import substitution in the Transportation and Warehousing sector. In the services areas, Professional, scientific and technical services (NAICS 541) has an annual payroll LQ of only 0.28. For the I/O analysis this industry was disaggregated and two of its components, Miscellaneous professional, scientific and technical services (NAICS 5412OP—all professional services except legal and computer) and Computer systems design (NAICS 5415) show significant excess demand, as does Information and data processing (NAICS 514). Given the region’s specialization in higher education--which trains people for these fields--these sectors might be logical targets for incubation of new businesses. This would also have the beneficial effect of retaining local college graduates and reducing brain drain. Real estate (NAICS 531) heads the list of excess demand industries in Erie, and it is also on the low LQ list. This industry includes those who lease, rent, or manage real property, real estate agents, and appraisers. Erie’s virtually non-existent population growth since the Bicentennial and lower than average income levels may have something to do with low demands in this sector. We note that the apparel industries (313 Textile mills, 314 Textile mill products, 315 Apparel manufacturing, and 316 Leather product manufacturing) are all on the low LQ list, and show some excess demand although they do not rise to the $5 million level. The history of these industries, moving out of the northeast U.S. first to the South and then offshore, suggests that this would not be a likely cluster for the Erie area. We also note that “Farms” are also high on the excess demand list. But this is an artifact of the data available. The I/O industries include crop and animal farming, but the CBP database does not have data for those industries. As a result, the measure of current supply is inaccurately low, causing a high excess demand number. With the data we have from the CBP, we simply cannot tell if agriculture is a likely candidate for import substitution or not.

23
Table 11 Direct Requirements Coefficients for Selected Transportation and Warehousing Industries
481: Air transportation 482: Rail transportation
GFE Federal government enterprises 0.0107 212 Mining, except oil and gas 0.0368
514 Information and data processing services 0.0070 331 Primary metals 0.0272
562 Waste management and remediation services 0.0060 22 Utilities 0.0245
521CI Federal Reserve banks, credit intermed, and relateds 0.0057 327 Nonmetallic mineral products 0.0140
323 Printing and related support activities 0.0054 484 Truck transportation 0.0123
GFG Federal general government 0.0053 322 Paper products 0.0110
511 Publishing industries (includes softw are) 0.0050 325 Chemical products 0.0067
5415 Computer systems design and related services 0.0046 311FT Food and beverage and tobacco products 0.0058
484 Truck transportation 0.0044 GFE Federal government enterprises 0.0054
561 Administrative and support services 0.0043 482 Rail transportation 0.0048
5412OP Misc professional, scientif ic, and technical services 0.0035 213 Support activities for mining 0.0046
512 Motion picture and sound recording industries 0.0031 321 Wood products 0.0045
337 Furniture and related products 0.0027 326 Plastics and rubber products 0.0044
523 Securities, commodity contracts, and investments 0.0025 111CA Farms 0.0040
321 Wood products 0.0024 332 Fabricated metal products 0.0026
532RL Rental and leasing services and lessors of intangible assets 0.0023 337 Furniture and related products 0.0019
487OS Other transportation and support activities 0.0023 335 Electrical equipment, appliances, and components 0.0018
332 Fabricated metal products 0.0023 3361MV Motor vehicles, bodies and trailers, and parts 0.0017
713 Amusements, gambling, and recreation industries 0.0021 323 Printing and related support activities 0.0014
326 Plastics and rubber products 0.0021 333 Machinery 0.0012
483: Water transportation 484: Truck transportation5412OP Misc professional, scientif ic, and technical services 0.0018 484 Truck transportation 0.0609
111CA Farms 0.0013 327 Nonmetallic mineral products 0.0422
GFG Federal general government 0.0012 321 Wood products 0.0258
GFE Federal government enterprises 0.0012 311FT Food and beverage and tobacco products 0.0212
311FT Food and beverage and tobacco products 0.0011 322 Paper products 0.0173
331 Primary metals 0.0006 337 Furniture and related products 0.0168
483 Water transportation 0.0006 331 Primary metals 0.0166
481 Air transportation 0.0005 212 Mining, except oil and gas 0.0162
212 Mining, except oil and gas 0.0004 111CA Farms 0.0153
327 Nonmetallic mineral products 0.0004 313TT Textile mills and textile product mills 0.0153
484 Truck transportation 0.0003 213 Support activities for mining 0.0114
486 Pipeline transportation 0.0003 23 Construction 0.0112
482 Rail transportation 0.0003 3361MV Motor vehicles, bodies and trailers, and parts 0.0110
487OS Other transportation and support activities 0.0003 339 Miscellaneous manufacturing 0.0104
325 Chemical products 0.0002 323 Printing and related support activities 0.0099
213 Support activities for mining 0.0002 315AL Apparel and leather and allied products 0.0096
22 Utilities 0.0002 332 Fabricated metal products 0.0095
55 Management of companies and enterprises 0.0002 325 Chemical products 0.0094
23 Construction 0.0002 333 Machinery 0.0091
GSLG State and local general government 0.0002 326 Plastics and rubber products 0.0089
493: Warehousing and storage493 Warehousing and storage 0.0459
44RT Retail trade 0.0137
484 Truck transportation 0.0109
42 Wholesale trade 0.0083
323 Printing and related support activities 0.0064
487OS Other transportation and support activities 0.0058
511 Publishing industries (includes softw are) 0.0046
483 Water transportation 0.0045
514 Information and data processing services 0.0044
321 Wood products 0.0040
3364OT Other transportation equipment 0.0038
337 Furniture and related products 0.0037
111CA Farms 0.0037
332 Fabricated metal products 0.0036
339 Miscellaneous manufacturing 0.0035
327 Nonmetallic mineral products 0.0034
333 Machinery 0.0029
326 Plastics and rubber products 0.0027
GSLG State and local general government 0.0026
331 Primary metals 0.0025

24
Given all this information, the industries in Table 12 are industries that deserve further consideration for import substitution initiatives.
Table 12 Import Substitution Candidates
VIII. CHOOSING AMONG THE CANDIDATES In choosing potential industry targets, the crucial criterion is whether or not this is an appropriate area for each candidate industry from the perspective of an investor that is motivated by the bottom line. Can the firm make a profit if it locates here, and how does that profit compare with locations elsewhere? Does the area have the other location factors—besides the excess demand—that are necessary for a profitable operation? That is not a simple question since each industry has its own set of location factors. But the analysis in this report provides information on the crucial demand side of the profit equation, which it is often hard for a firm from outside the region to evaluate. Local leaders with limited resources who are concerned with economic development will also logically consider the impact each candidate industry is likely to have on the local area. One question to ask is about the relative income level of the candidate industries. Table 13 shows the average annual payroll per job for each industry for 2009.
17 This varies significantly for the candidate industries, from a low of
$24,774 in Real estate to a high of $49,860 in Computer and electronics manufacturing. Another issue to consider is the future prospects of each industry. Is the candidate industry projected to grow rapidly in the future, or to decline? The U.S. Bureau of Labor Statistics prepares 10-year projections of growth rates by industry for the country.
18 These forecasts are reported in Appendix C for all
industries. Table 13 also reports the projected national growth rates for 2008-18 for the import substitution candidates reported above. It is interesting to note that for the eight industries for which there are data on both payroll per job and projected growth rates that there is a negative correlation (-0.41) between the two variables, meaning that selecting an industry with a higher pay rate also tends to mean selecting an industry with slower expected growth in the future. The notable exception is NAICS 5415, computer systems design.
17
Average annual payroll per job was calculated from the County Business Patterns data by dividing the first quarter payroll amount
by the first quarter employment, and multiplying by four to annualize it. Note that the CBP employment numbers include both part-time and full-time workers and the payroll per job values are not adjusted to “full time equivalents”. This can make a significant difference if some industries have larger numbers of part-time workers than others. 18
Details of the projections are available at: http://www.bls.gov/emp/#data.
NAICS Industry
322 Paper manufacturing
325 Chemical manufacturing
331 Primary metal manufacturing
334 Computer and electronic product manufacturing
481 Air transportation
482 Rail transportation
493 Warehousing and storage
514 Information and data processing services
531 Real estate
541 Professional, scientific, and technical services
5412OP All prof, sci & tech services except legal and computer
5415 Computer systems design and related services

25
Table 13 Summary Information for Import Substitution Candidates
Another consideration is the likely impact of the industry on other industries and the economy overall—the so-called multiplier. The logic goes like this: in order for Industry X to produce one dollar of its output, it will need to buy inputs from other industries. Those industries in turn will need to buy their own inputs, some of which may include products produced by Industry X. It is possible to estimate the total amount of inputs/production that must take place for one dollar of Industry X’s output to be produced. In input-output parlance, this amount is called the Total Requirement. It is different from the Direct Requirements Coefficients discussed earlier since it takes into account feedbacks from the purchases of other industries. Using an example discussed above, in order to produce $1 of its output the Plastics industry (NAICS 326) must buy 30.1 cents of inputs from the Chemicals industry (NAICS 325), along with many other inputs. But in order to produce that 30.1 cents of chemicals, the Chemicals industry must buy inputs of its own, and those inputs include about 1.5 cents of plastics products. The same is true for all the others of the Plastics’ industry’s inputs, although they all will need different amounts of plastics products. So to produce that initial $1 of plastics products, the BEA estimates that the Plastics industry will need to produce a total of $1.07996 of output. Other industries will also need to produce their own products: the Chemicals industry will need to produce a total of 44.3 cents of chemicals, there will need to be an additional 4.2 cents of utilities production, 7.5 cents of professional services, etc. The total of all new production from this initial $1 of demand for the Plastics industry is nearly $2.43. This means that the Total Requirements value can also be considered a multiplier, since that one dollar of initial demand will generate a total of $2.43 of production across the economy—the original $1.00 of plastics output plus another $1.43 of products in a broad range of industries. The BEA estimates the Total Requirements for all the industries in its input-output tables. These are reported in Table 14 below, and for the candidate industries in Table 13 above. For the candidate industries, the multipliers tend to be positively correlated with average pay (r = 0.36, n=7) and negatively correlated with expected growth rate (r = -0.71, n = 10).
Estimated
2009 Excess 2009 Erie 2009 Erie 2008-18
Location Demand Annual Payroll Annual Payroll Expected Annual National
NAICS Industry Quotient (thou of $) (thou of $) Per Job U.S. Growth Rate Multiplier
322 Paper manufacturing 0.099 13,905 $1,463 $30,737 -2.7% 2.3147
325 Chemical manufacturing 0.111 73,865 4,213 40,926 -0.7 2.3456
331 Primary metal manufacturing 2.311 43,158 32,636 43,464 -1.0 2.6352
334 Computer and electronic product manufacturing 0.907 22,644 45,021 49,860 -2.1 1.7696
481 Air transportation 0.045 5,571 794 na 0.7 1.9873
482 Rail transportation 0.000 5,245 na na 0.5 1.9562
493 Warehousing and storage 0.326 5,582 6,189 29,115 1.2 1.5567
514 Information and data processing services na 10,109 813 na na 1.8268
531 Real estate 0.358 108,182 16,016 24,774 1.3 1.4691
541 Professional, scientific, and technical services 0.277 111,280 28,021 3.0 na
5412OP All prof, sci & tech services except legal and computer 0.197 78,566 73,873 na 2.9 1.5464
5415 Computer systems design and related services 0.071 12,302 5,855 39,347 3.8 1.4712

26
Table 14 2009 National Total Requirements Multipliers
I/O industry codes are explained in Appendix A, Table A-2.
IX. CONCLUSIONS
The goal of this study is to explore the possibility of identifying likely candidate industries for import substitution in the Erie area. We considered two different approaches to this issue, first using location quotients to identify industries that are likely importers and exporters in the Erie area. Then we applied a new approach and identified industries where there is excess demand that is not being served in the local area. Each approach provides a list of potential import substitution candidates. Combining the two approaches left us with the dozen or so likely import substitution candidates listed in Table 12. While this analysis can suggest some likely candidates for import substitution, it cannot make the ultimate decision. That can only be done by exploring the appropriateness of each candidate for profitable location in the local area, as well as its likely impact on the local economy. Table 13 helps with regard to the latter issue. What this analysis CAN do is help fill in one piece of the puzzle; it can indicate to potential Erie suppliers where there is local demand for products that is currently not being supplied. That amounts to a profit opportunity for entrepreneurs to explore. It they act on this information, it may ultimately result in benefits to those who choose to take up that challenge as well as benefits to the broader local community.
I/O Code Industry Multiplier I/O Code Industry Multiplier
111CA Farms 2.3330 486 Pipeline transportation 1.6730
113FF Forestry, fishing, and related activities 1.5573 487OS Other transportation and support activities 1.5518
211 Oil and gas extraction 1.4057 493 Warehousing and storage 1.5567
212 Mining, except oil and gas 1.6504 511 Publishing industries (includes software) 1.9512
213 Support activities for mining 1.8341 512 Motion picture and sound recording industries 1.7211
22 Utilities 1.5176 513 Broadcasting and telecommunications 1.7627
23 Construction 1.9738 514 Information and data processing services 1.8268
321 Wood products 2.4188 521CI Federal Reserve banks, credit intermediation, and related 1.8992
327 Nonmetallic mineral products 2.1162 523 Securities, commodity contracts, and investments 2.0670
331 Primary metals 2.6352 524 Insurance carriers and related activities 1.6139
332 Fabricated metal products 2.2940 525 Funds, trusts, and other financial vehicles 2.0293
333 Machinery 2.2110 531 Real estate 1.4691
334 Computer and electronic products 1.7696 532RL Rental & leasing services & lessors of intangible assets 1.6433
335 Electrical equipment, appliances, and components 2.0669 5411 Legal services 1.3675
3361MV Motor vehicles, bodies and trailers, and parts 2.8175 5415 Computer systems design and related services 1.4712
3364OT Other transportation equipment 2.2942 5412OP Misc professional, scientific, and technical services 1.5464
337 Furniture and related products 2.2533 55 Management of companies and enterprises 1.5968
339 Miscellaneous manufacturing 1.9432 561 Administrative and support services 1.6426
311FT Food and beverage and tobacco products 2.5920 562 Waste management and remediation services 1.8940
313TT Textile mills and textile product mills 2.3024 61 Educational services 1.5964
315AL Apparel and leather and allied products 1.7659 621 Ambulatory health care services 1.6197
322 Paper products 2.3147 622HO Hospitals and nursing and residential care facilities 1.7142
323 Printing and related support activities 2.2182 624 Social assistance 1.6405
324 Petroleum and coal products 2.1161 711AS Performing arts, spectator sports, museums, and related 1.7441
325 Chemical products 2.3456 713 Amusements, gambling, and recreation industries 1.6848
326 Plastics and rubber products 2.4263 721 Accommodation 1.7804
42 Wholesale trade 1.3594 722 Food services and drinking places 1.8703
44RT Retail trade 1.4796 81 Other services, except government 1.7436
481 Air transportation 1.9873 GFG Federal general government 1.8023
482 Rail transportation 1.9562 GFE Federal government enterprises 1.6384
483 Water transportation 2.1152 GSLG State and local general government 1.6183
484 Truck transportation 1.9650 GSLE State and local government enterprises 2.0685
485 Transit and ground passenger transportation 1.5566

27
Appendix A Industry Definitions
As mentioned above, this study makes use of the North American Industry Classification System (NAICS). Details of the system can be found at: http://www.census.gov/eos/www/naics/, including detailed descriptions of the individual industry categories at http://www.census.gov/cgi-bin/sssd/naics/naicsrch?chart=2007 and http://www.census.gov/eos/www/naics/2007NAICS/2007_Definition_File.pdf Many of the NAICS category names are descriptive, but sometimes it is not completely clear just what an industry includes. In those cases, it is useful to see the subindustries that make up a broader category. That’s the purpose of this Appendix. While both the County Business Patterns and the BEA’s Input-Output System use NAICS industry classifications, the I/O system sometimes aggregates individual categories to make new ones. Because of that, this Appendix includes two lists. Table A-1 gives the broader NAICS classifications, and Table A-2 is the list of the I/O industry categories with their components. The full list of NAICS codes down to the 6-digit level is too long to include in its entirety here, but Table A-1 includes the 2- and 3-digit categories, with selected 4-digit industries to help clarify things. Caution: there are industries listed here that are not covered in the County Business Patterns database, as explained in the text.
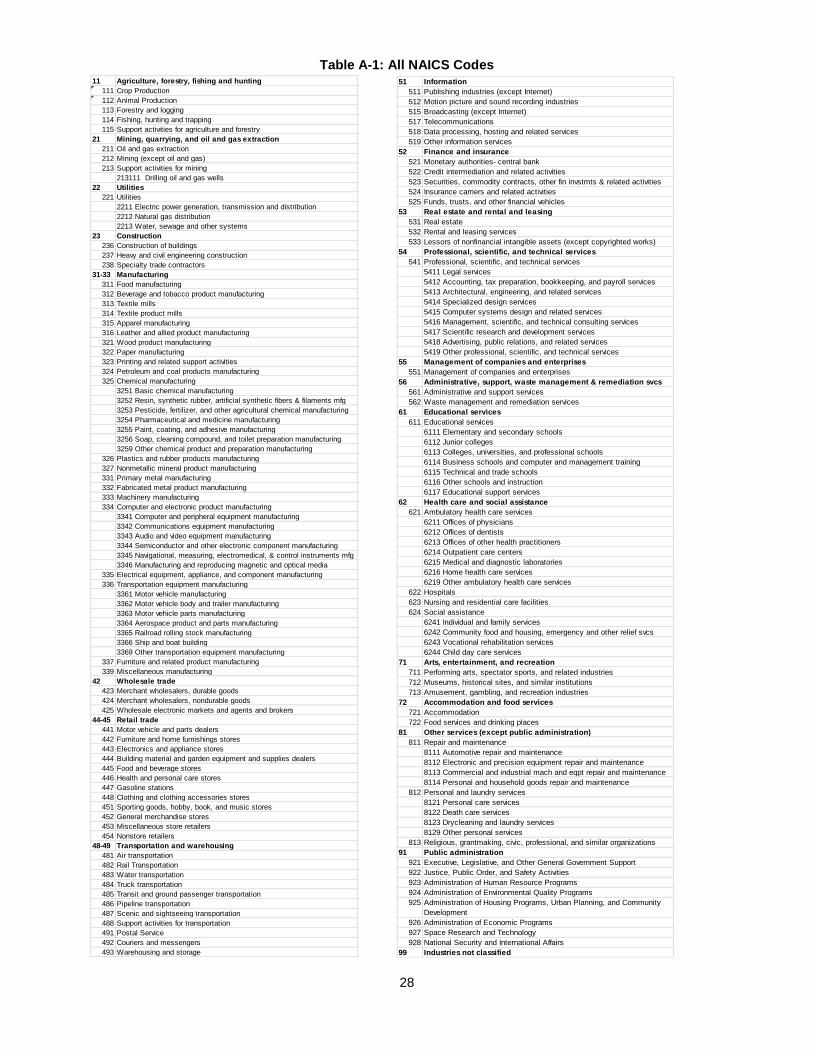
28
Table A-1: All NAICS Codes
11 Agriculture, forestry, fishing and hunting
111 Crop Production
112 Animal Production
113 Forestry and logging
114 Fishing, hunting and trapping
115 Support activities for agriculture and forestry
21 Mining, quarrying, and oil and gas extraction
211 Oil and gas extraction
212 Mining (except oil and gas)
213 Support activities for mining
213111 Drilling oil and gas wells
22 Utilities
221 Utilities
2211 Electric power generation, transmission and distribution
2212 Natural gas distribution
2213 Water, sewage and other systems
23 Construction
236 Construction of buildings
237 Heavy and civil engineering construction
238 Specialty trade contractors
31-33 Manufacturing
311 Food manufacturing
312 Beverage and tobacco product manufacturing
313 Textile mills
314 Textile product mills
315 Apparel manufacturing
316 Leather and allied product manufacturing
321 Wood product manufacturing
322 Paper manufacturing
323 Printing and related support activities
324 Petroleum and coal products manufacturing
325 Chemical manufacturing
3251 Basic chemical manufacturing
3252 Resin, synthetic rubber, artificial synthetic fibers & filaments mfg
3253 Pesticide, fertilizer, and other agricultural chemical manufacturing
3254 Pharmaceutical and medicine manufacturing
3255 Paint, coating, and adhesive manufacturing
3256 Soap, cleaning compound, and toilet preparation manufacturing
3259 Other chemical product and preparation manufacturing
326 Plastics and rubber products manufacturing
327 Nonmetallic mineral product manufacturing
331 Primary metal manufacturing
332 Fabricated metal product manufacturing
333 Machinery manufacturing
334 Computer and electronic product manufacturing
3341 Computer and peripheral equipment manufacturing
3342 Communications equipment manufacturing
3343 Audio and video equipment manufacturing
3344 Semiconductor and other electronic component manufacturing
3345 Navigational, measuring, electromedical, & control instruments mfg
3346 Manufacturing and reproducing magnetic and optical media
335 Electrical equipment, appliance, and component manufacturing
336 Transportation equipment manufacturing
3361 Motor vehicle manufacturing
3362 Motor vehicle body and trailer manufacturing
3363 Motor vehicle parts manufacturing
3364 Aerospace product and parts manufacturing
3365 Railroad rolling stock manufacturing
3366 Ship and boat building
3369 Other transportation equipment manufacturing
337 Furniture and related product manufacturing
339 Miscellaneous manufacturing
42 Wholesale trade
423 Merchant wholesalers, durable goods
424 Merchant wholesalers, nondurable goods
425 Wholesale electronic markets and agents and brokers
44-45 Retail trade
441 Motor vehicle and parts dealers
442 Furniture and home furnishings stores
443 Electronics and appliance stores
444 Building material and garden equipment and supplies dealers
445 Food and beverage stores
446 Health and personal care stores
447 Gasoline stations
448 Clothing and clothing accessories stores
451 Sporting goods, hobby, book, and music stores
452 General merchandise stores
453 Miscellaneous store retailers
454 Nonstore retailers
48-49 Transportation and warehousing
481 Air transportation
482 Rail Transportation
483 Water transportation
484 Truck transportation
485 Transit and ground passenger transportation
486 Pipeline transportation
487 Scenic and sightseeing transportation
488 Support activities for transportation
491 Postal Service
492 Couriers and messengers
493 Warehousing and storage
51 Information
511 Publishing industries (except Internet)
512 Motion picture and sound recording industries
515 Broadcasting (except Internet)
517 Telecommunications
518 Data processing, hosting and related services
519 Other information services
52 Finance and insurance
521 Monetary authorities- central bank
522 Credit intermediation and related activities
523 Securities, commodity contracts, other fin invstmts & related activities
524 Insurance carriers and related activities
525 Funds, trusts, and other financial vehicles
53 Real estate and rental and leasing
531 Real estate
532 Rental and leasing services
533 Lessors of nonfinancial intangible assets (except copyrighted works)
54 Professional, scientific, and technical services
541 Professional, scientific, and technical services
5411 Legal services
5412 Accounting, tax preparation, bookkeeping, and payroll services
5413 Architectural, engineering, and related services
5414 Specialized design services
5415 Computer systems design and related services
5416 Management, scientific, and technical consulting services
5417 Scientific research and development services
5418 Advertising, public relations, and related services
5419 Other professional, scientific, and technical services
55 Management of companies and enterprises
551 Management of companies and enterprises
56 Administrative, support, waste management & remediation svcs
561 Administrative and support services
562 Waste management and remediation services
61 Educational services
611 Educational services
6111 Elementary and secondary schools
6112 Junior colleges
6113 Colleges, universities, and professional schools
6114 Business schools and computer and management training
6115 Technical and trade schools
6116 Other schools and instruction
6117 Educational support services
62 Health care and social assistance
621 Ambulatory health care services
6211 Offices of physicians
6212 Offices of dentists
6213 Offices of other health practitioners
6214 Outpatient care centers
6215 Medical and diagnostic laboratories
6216 Home health care services
6219 Other ambulatory health care services
622 Hospitals
623 Nursing and residential care facilities
624 Social assistance
6241 Individual and family services
6242 Community food and housing, emergency and other relief svcs
6243 Vocational rehabilitation services
6244 Child day care services
71 Arts, entertainment, and recreation
711 Performing arts, spectator sports, and related industries
712 Museums, historical sites, and similar institutions
713 Amusement, gambling, and recreation industries
72 Accommodation and food services
721 Accommodation
722 Food services and drinking places
81 Other services (except public administration)
811 Repair and maintenance
8111 Automotive repair and maintenance
8112 Electronic and precision equipment repair and maintenance
8113 Commercial and industrial mach and eqpt repair and maintenance
8114 Personal and household goods repair and maintenance
812 Personal and laundry services
8121 Personal care services
8122 Death care services
8123 Drycleaning and laundry services
8129 Other personal services
813 Religious, grantmaking, civic, professional, and similar organizations
91 Public administration
921 Executive, Legislative, and Other General Government Support
922 Justice, Public Order, and Safety Activities
923 Administration of Human Resource Programs
924 Administration of Environmental Quality Programs
925 Administration of Housing Programs, Urban Planning, and Community
Development
926 Administration of Economic Programs
927 Space Research and Technology
928 National Security and International Affairs
99 Industries not classified

29
Table A-2: Input-Output Industries
Sector
CodeSector Description
Summary
CodeSummary Description Detail Code Detail Description
11 Agriculture, forestry, fishing, and 111CA Farms 1111A0 Oilseed farming
1111B0 Grain farming
111200 Vegetable and melon farming
111335 Tree nut farming
1113A0 Fruit farming
111400 Greenhouse, nursery, and floriculture production
111910 Tobacco farming
111920 Cotton farming
1119A0 Sugarcane and sugar beet farming
1119B0 All other crop farming
112120 Dairy cattle and milk production
1121A0 Cattle ranching and farming
112300 Poultry and egg production
112B00 Animal production, except cattle & poultry & eggs
113FF Forestry, fishing, and related activities 113300 Logging
113A00 Forest nurseries, forest products, and timber tracts
114100 Fishing
114200 Hunting and trapping
115000 Support activities for agriculture and forestry
21 Mining 211 Oil and gas extraction 211000 Oil and gas extraction
212 Mining, except oil and gas 212100 Coal mining
212210 Iron ore mining
212230 Copper, nickel, lead, and zinc mining
2122A0 Gold, silver, and other metal ore mining
212310 Stone mining and quarrying
212320
Sand, gravel, clay, and ceramic and refractory minerals mining
and quarrying
212390 Other nonmetallic mineral mining and quarrying
213 Support activities for mining 213111 Drill ing oil and gas wells
21311A Support activities for other mining
21311B Support activities for oil and gas operations
22 Utilities 22 Util ities 221100 Electric power generation, transmission, & distribtn
221200 Natural gas distribution
221300 Water, sewage and other systems
23 Construction 23 Construction 230101 Nonresidential commercial & health care structures
230102 Nonresidential manufacturing structures
230103 Other nonresidential structures
230201 Residntl permanent site single- & multi-family strctrs
230202 Other residential structures
230301 Nonresidential maintenance and repair
230302 Residential maintenance and repair
31G Manufacturing 311FT Food and beverage and tobacco products 311111 Dog and cat food manufacturing
311119 Other animal food manufacturing
311210 Flour mill ing and malt manufacturing
311221 Wet corn mill ing
311225 Fats and oils refining and blending
31122A Soybean and other oilseed processing
311230 Breakfast cereal manufacturing
311313 Beet sugar manufacturing
31131A Sugar cane mills and refining
311320 Chocolate and confectionery mfg from cacao beans
311330 Confectionery mfg from purchased chocolate
311340 Nonchocolate confectionery manufacturing
311410 Frozen food manufacturing
311420 Fruit and vegetable canning, pickling, and drying
311513 Cheese manufacturing
311514 Dry, condensed, and evaporated dairy product mfg
31151A Fluid milk and butter manufacturing
311520 Ice cream and frozen dessert manufacturing
311615 Poultry processing
31161A Animal (exc poultry) slaughtering, rendering, & processing
311700 Seafood product preparation and packaging
311810 Bread and bakery product manufacturing
311820 Cookie, cracker, and pasta manufacturing
311830 Tortil la manufacturing
311910 Snack food manufacturing
311920 Coffee and tea manufacturing
311930 Flavoring syrup and concentrate manufacturing
311940 Seasoning and dressing manufacturing
311990 All other food manufacturing
312110 Soft drink and ice manufacturing
312120 Breweries
312130 Wineries
312140 Distil leries
3122A0 Tobacco product manufacturing
313TT Textile mills and textile product mills 313100 Fiber, yarn, and thread mills
313210 Broadwoven fabric mills
313220 Narrow fabric mills and schiffl i machine embroidery
313230 Nonwoven fabric mills
313240 Knit fabric mills
313310 Textile and fabric finishing mills
313320 Fabric coating mills
314110 Carpet and rug mills
314120 Curtain and linen mills
314910 Textile bag and canvas mills
314990 All other textile product mills
315AL Apparel and leather and all ied products 315100 Apparel knitting mills
315210 Cut and sew apparel contractors
315220 Men's and boys' cut and sew apparel manufacturing
315230 Women's and girls' cut and sew apparel mfg
315290 Other cut and sew apparel manufacturing
315900 Apparel accessories and other apparel mfg
316100 Leather and hide tanning and finishing
316200 Footwear manufacturing
316900 Other leather and all ied product manufacturing

30
31G Manufacturing 321 Wood products 321100 Sawmills and wood preservation
cont. cont. 321219 Reconstituted wood product manufacturing
32121A Veneer and plywood manufacturing
32121B Engineered wood member and truss manufacturing
321910 Wood windows and doors and millwork
321920 Wood container and pallet manufacturing
321991 Manufactured home (mobile home) manufacturing
321992 Prefabricated wood building manufacturing
321999 All other miscellaneous wood product manufacturing
322 Paper products 322110 Pulp mills
322120 Paper mills
322130 Paperboard Mills
322210 Paperboard container manufacturing
32222A
Coated and laminated paper, packaging paper and plastics fi lm
manufacturing
32222B All other paper bag and coated & treated paper mfg
322230 Stationery product manufacturing
322291 Sanitary paper product manufacturing
322299 All other converted paper product manufacturing
323 Printing and related support activities 32311A Printing
323120 Support activities for printing
324 Petroleum and coal products 324110 Petroleum refineries
324121 Asphalt paving mixture and block manufacturing
324122 Asphalt shingle and coating materials manufacturing
324191 Petroleum lubricating oil and grease manufacturing
324199 All other petroleum and coal products manufacturing
325 Chemical products 325110 Petrochemical manufacturing
325120 Industrial gas manufacturing
325130 Synthetic dye and pigment manufacturing
325181 Alkalies and chlorine manufacturing
325182 Carbon black manufacturing
325188 All other basic inorganic chemical manufacturing
325190 Other basic organic chemical manufacturing
325211 Plastics material and resin manufacturing
325212 Synthetic rubber manufacturing
325220 Artificial and synthetic fibers and fi laments mfg
325310 Fertil izer manufacturing
325320 Pesticide and other agricultural chemical mfg
325411 Medicinal and botanical manufacturing
325412 Pharmaceutical preparation manufacturing
325413 In-vitro diagnostic substance manufacturing
325414 Biological product (except diagnostic) manufacturing
325510 Paint and coating manufacturing
325520 Adhesive manufacturing
325610 Soap and cleaning compound manufacturing
325620 Toilet preparation manufacturing
325910 Printing ink manufacturing
3259A0 All other chemical product and preparation mfg
326 Plastics and rubber products
326110
Plastics packaging materials and unlaminated fi lm and sheet
manufacturing
326121 Unlaminated plastics profile shape manufacturing
326122 Plastics pipe and pipe fitting manufacturing
326130
Laminated plastics plate, sheet (except packaging), and shape
manufacturing
326140 Polystyrene foam product manufacturing
326150
Urethane and other foam product (except polystyrene)
manufacturing
326160 Plastics bottle manufacturing
32619A Other plastics product manufacturing
326210 Tire manufacturing
326220 Rubber and plastics hoses and belting manufacturing
326290 Other rubber product manufacturing
327 Nonmetallic mineral products 32711A Pottery, ceramics, and plumbing fixture manufacturing
32712A Brick, ti le, and other structural clay product mfg
32712B Clay and nonclay refractory manufacturing
327211 Flat glass manufacturing
327212 Other pressed and blown glass and glassware mfg
327213 Glass container manufacturing
327215 Glass product mfg made of purchased glass
327310 Cement manufacturing
327320 Ready-mix concrete manufacturing
327330 Concrete pipe, brick, and block manufacturing
327390 Other concrete product manufacturing
3274A0 Lime and gypsum product manufacturing
327910 Abrasive product manufacturing
327991 Cut stone and stone product manufacturing
327992 Ground or treated mineral and earth manufacturing
327993 Mineral wool manufacturing
327999 Miscellaneous nonmetallic mineral products
331 Primary metals 331110 Iron and steel mills and ferroalloy manufacturing
331200 Steel product manufacturing from purchased steel
331314 Secondary smelting and alloying of aluminum
33131A Alumina refining and primary aluminum production
33131B Aluminum product mfg from purchased aluminum
331411 Primary smelting and refining of copper
331419
Primary smelting and refining of nonferrous metal (except copper
and aluminum)
331420 Copper roll ing, drawing, extruding and alloying
331490
Nonferrous metal (except copper and aluminum) roll ing, drawing,
extruding and alloying
331510 Ferrous metal foundries
331520 Nonferrous metal foundries
332 Fabricated metal products 332114 Custom roll forming
33211A All other forging, stamping, and sintering
33211B Crown and closure mfg and metal stamping
33221A Cutlery, utensil, pot, and pan manufacturing
33221B Handtool manufacturing
332310 Plate work and fabricated structural product mfg
332320 Ornamental and architectural metal products mfg
332410 Power boiler and heat exchanger manufacturing
332420 Metal tank (heavy gauge) manufacturing
332430 Metal can, box, & other metal container (l ight gauge) mfg
332500 Hardware manufacturing
332600 Spring and wire product manufacturing
332710 Machine shops
332720 Turned product and screw, nut, and bolt mfg
332800 Coating, engraving, heat treating and all ied activities
332913 Plumbing fixture fitting and trim manufacturing
33291A Valve and fittings other than plumbing
332991 Ball and roller bearing manufacturing
332996 Fabricated pipe and pipe fitting manufacturing
33299A Ammunition manufacturing
33299B Arms, ordnance, and accessories manufacturing
33299C Other fabricated metal manufacturing

31
31G Manufacturing 333 Machinery 333111 Farm machinery and eqpt manufacturing
cont. cont. 333112 Lawn and garden eqpt manufacturing
333120 Construction machinery manufacturing
333130 Mining and oil and gas field machinery manufacturing
333220 Plastics and rubber industry machinery manufacturing
333295 Semiconductor machinery manufacturing
33329A Other industrial machinery manufacturing
333314 Optical instrument and lens manufacturing
333315 Photographic and photocopying eqpt manufacturing
333319 Other commercial and service industry machinery mfg
33331A Vending, commercial, industrial, and office machinery mfg
333414 Heating eqpt (except warm air furnaces) mfg
333415 Air conditioning, refrigeration, & warm air heating eqpt mfg
33341A Air purification and ventilation eqpt mfg
333511 Industrial mold manufacturing
333514 Special tool, die, jig, and fixture manufacturing
333515 Cutting tool and machine tool accessory mfg
33351A Metal cutting and forming machine tool mfg
33351B Rolling mill and other metalworking machinery mfg
333611 Turbine and turbine generator set units mfg
333612 Speed changer, industrial high-speed drive, and gear mfg
333613 Mechanical power transmission eqpt mfg
333618 Other engine eqpt mfg
333912 Air and gas compressor mfg
33391A Pump and pumping eqpt mfg
333920 Material handling eqpt mfg
333991 Power-driven handtool mfg
333993 Packaging machinery mfg
333994 Industrial process furnace and oven mfg
33399A Other general purpose machinery mfg
33399B Fluid power process machinery
334 Computer and electronic products 334111 Electronic computer mfg
334112 Computer storage device mfg
33411A Computer terminals & other computer peripheral eqpt mfg
334210 Telephone apparatus mfg
334220 Broadcast and wireless communications eqpt
334290 Other communications eqpt mfg
334300 Audio and video eqpt mfg
334411 Electron tube mfg
334412 Bare printed circuit board mfg
334413 Semiconductor and related device mfg
334417 Electronic connector mfg
334418 Printed circuit assembly (electronic assembly) mfg
334419 Other electronic component mfg
33441A
Electronic capacitor, resistor, coil, transformer, and other
inductor mfg
334510 Electromedical and electrotherapeutic apparatus mfg
334511 Search, detection, and navigation instruments mfg
334512 Automatic environmental control mfg
334513 Industrial process variable instruments mfg
334514 Totalizing fluid meters and counting devices mfg
334515 Electricity and signal testing instruments mfg
334516 Analytical laboratory instrument mfg
334517 Irradiation apparatus mfg
33451A Watch, clock, & other measuring & controlling device mfg
334613 Magnetic and optical recording media mfg
33461A Software, audio, and video media reproducing
335 Electrical equipment, appliances, and 335110 Electric lamp bulb and part mfg
335120 Lighting fixture mfg
335210 Small electrical appliance mfg
335221 Household cooking appliance mfg
335222 Household refrigerator and home freezer mfg
335224 Household laundry eqpt mfg
335228 Other major household appliance mfg
335311 Power, distribution, and specialty transformer mfg
335312 Motor and generator mfg
335313 Switchgear and switchboard apparatus mfg
335314 Relay and industrial control mfg
335911 Storage battery mfg
335912 Primary battery mfg
335920 Communication and energy wire and cable mfg
335930 Wiring device mfg
335991 Carbon and graphite product mfg
335999 All other miscellaneous electrical eqpt and component mfg
3361MV Motor vehicles, bodies and trailers, and 336111 Automobile mfg
336112 Light truck and util ity vehicle mfg
336120 Heavy duty truck mfg
336211 Motor vehicle body mfg
336212 Truck trailer mfg
336213 Motor home mfg
336214 Travel trailer and camper mfg
336300 Motor vehicle parts mfg
3364OT Other transportation equipment 336411 Aircraft mfg
336412 Aircraft engine and engine parts mfg
336413 Other aircraft parts and auxiliary eqpt mfg
336414 Guided missile and space vehicle mfg
33641A Propulsion units & parts for space vehcls & guided missiles
336500 Railroad roll ing stock mfg
336611 Ship building and repairing
336612 Boat building
336991 Motorcycle, bicycle, and parts mfg
336992 Military armored vehicle, tank, and tank component mfg
336999 All other transportation eqpt mfg
337 Furniture and related products 337110 Wood kitchen cabinet and countertop mfg
337121 Upholstered household furniture mfg
337122 Nonupholstered wood household furniture mfg
337127 Institutional furniture mfg
33712A Metal and other household furniture (except wood) mfg
337215 Showcase, partition, shelving, and locker mfg
33721A Wood television, radio, and sewing machine cabinet mfg
33721B
Office furniture and custom architectural woodwork and
millwork mfg
337910 Mattress mfg
337920 Blind and shade mfg
339 Miscellaneous manufacturing 339111 Laboratory apparatus and furniture mfg
339112 Surgical and medical instrument mfg
339113 Surgical appliance and supplies mfg
339114 Dental eqpt and supplies mfg
339115 Ophthalmic goods mfg
339116 Dental laboratories
339910 Jewelry and silverware mfg
339920 Sporting and athletic goods mfg
339930 Doll, toy, and game mfg
339940 Office supplies (except paper) mfg
339950 Sign mfg
339991 Gasket, packing, and sealing device mfg
339992 Musical instrument mfg
339994 Broom, brush, and mop mfg
33999A All other miscellaneous mfg

32
42 Wholesale trade 42 Wholesale trade 42000A Wholesale trade
44RT Retail trade 44RT Retail trade 4A0000 Retail trade
48TW Transportation and warehousing 481 Air transportation 481000 Air transportation
482 Rail transportation 482000 Rail transportation
483 Water transportation 483000 Water transportation
484 Truck transportation 484A00 Truck transportation
485 Transit & ground passenger transptn 485000 Transit and ground passenger transportation
486 Pipeline transportation 486000 Pipeline transportation
487OS Other transportation and support activities 48A000 Scenic and sightseeing transportation and support activities
492000 Couriers and messengers
493 Warehousing and storage 493A00 Warehousing and storage
51 Information 511 Publishing industries (includes software) 511110 Newspaper publishers
511120 Periodical publishers
511130 Book publishers
5111A0 Directory, mailing l ist, and other publishers
511200 Software publishers
516110 Internet Publishing and Broadcasting
512 Motion picture and sound recording 512100 Motion picture and video industries
512200 Sound recording industries
513 Broadcasting and telecommunications 515100 Radio and television broadcasting
515200 Cable and other subscription programming
517000 Telecommunications
514 Information and data processing services 518100 Internet service providers and web search portals
518200 Data processing, hosting, and related services
519100 Other information services
6 Educational services, health care, and 61 Educational services 611100 Elementary and secondary schools
611A00 Jr colleges, colleges, universities, & professional schools
611B00 Other educational services
621 Ambulatory health care services 621600 Home health care services
621A00 Offices of physicians, dentists, & other health practitioners
621B00
Medical and diagnostic labs and outpatient and other
ambulatory care services
622HO Hospitals and nursing and residential care 622000 Hospitals
623000 Nursing and residential care facil ities
624 Social assistance
624200
Community food, housing, and other relief services, including
rehabilitation services
624400 Child day care services
624A00 Individual and family services
7 Arts, entertainment, recreation, 711AS Performing arts, spectator sports, museums, 711100 Performing arts companies
711200 Spectator sports
711500 Independent artists, writers, and performers
711A00
Promoters of performing arts and sports and agents for public
figures
712000 Museums, historical sites, zoos, and parks
713 Amusements, gambling, and recreation 713940 Fitness and recreational sports centers
713950 Bowling centers
713A00 Amusement parks, arcades, and gambling industries
713B00 Other amusement and recreation industries
721 Accommodation 7211A0 Hotels and motels, including casino hotels
721A00 Other accommodations
722 Food services and drinking places 722000 Food services and drinking places
81 Other services, except government 81 Other services, except government 811192 Car washes
8111A0 Automotive repair and maintenance, except car washes
811200 Electronic and precision equipment repair and maintenance
811300
Commercial and industrial machinery and equipment repair and
maintenance
811400 Personal and household goods repair and maintenance
812100 Personal care services
812200 Death care services
812300 Dry-cleaning and laundry services
812900 Other personal services
813100 Religious organizations
813A00 Grantmaking, giving, and social advocacy organizations
813B00 Civic, social, professional, and similar organizations
814000 Private households
FIRE Finance, insurance, real estate, rental, 521CI Federal Reserve banks, credit intermediation, 522A00 Nondepository credit intermediation and related activities
52A000 Monetary authorities and depository credit intermediation
523 Securities, commodity contracts, and
investments 523000
Securities, commodity contracts, investments, and related
activities
524 Insurance carriers and related activities 5241A0 Insurance carriers
524200 Insurance agencies, brokerages, and related activities
525 Funds, trusts, and other financial vehicles 525A00 Funds, trusts, and other financial vehicles
531 Real estate 531000 Real estate
S00800 Owner-occupied dwellings
532RL Rental and leasing services and lessors of 532100 Automotive equipment rental and leasing
532230 Video tape and disc rental
532400 Commercial and industrial mach & eqpt rental and leasing
532A00 General and consumer gds rental exc video tapes & discs
533000 Lessors of nonfinancial intangible assets
G Government GFE Federal government enterprises 491000 Postal service
S00101 Federal electric util ities
S00102 Other Federal Government enterprises
GFG Federal general government S00500 General Federal defense government services
S00600 General Federal nondefense government services
GSLE State and local government enterprises S00201 State and local government passenger transit
S00202 State and local government electric util ities
S00203 Other state and local government enterprises
GSLG State and local general government S00700 General state and local government services
PROF Professional and business services 5411 Legal services 541100 Legal services
5412OP Miscellaneous professional, scientific, and 541200 Accounting, tax preparation, bookkeeping, & payroll svcs
541300 Architectural, engineering, and related services
541400 Specialized design services
541610 Management, scientific, and technical consulting services
5416A0 Environmental and other technical consulting services
541700 Scientific research and development services
5418A0 Advertising and related services
541920 Photographic services
541940 Veterinary services
5419A0 All other misc professional, scientific, and technical svcs
5415 Computer systems design and related 541511 Custom computer programming services
541512 Computer systems design services
54151A Other computer related services, including facil ities mgmt
55 Management of companies & enterprises 550000 Management of companies and enterprises
561 Administrative and support services 561100 Office administrative services
561200 Facilities support services
561300 Employment services
561400 Business support services
561500 Travel arrangement and reservation services
561600 Investigation and security services
561700 Services to buildings and dwellings
561900 Other support services
562 Waste management & remediation svcs 562000 Waste management and remediation services
F010 Personal consumption expenditures F010 Personal consumption expenditures F01000 Personal consumption expenditures
F020 Private fixed investment F020 Private fixed investment F02000 Private fixed investment
F030 Change in private inventories F030 Change in private inventories F03000 Change in private inventories
F040 Exports of goods and services F040 Exports of goods and services F04000 Exports of goods and services
F050 Imports of goods and services F050 Imports of goods and services F05000 Imports of goods and services
F100 Government consumption expenditures F06C National defense: Consumption exp F06C00 Federal Government defense: Consumption expenditures
F06I National defense: Gross investment F06I00 Federal Government defense: Gross investment
F07C Nondefense: Consumption exp F07C00 Federal Government nondefense: Consumption exp
F07I Nondefense: Gross investment F07I00 Federal Government nondefense: Gross investment
F08C State and local government consumption
expenditures, education F08C00 State and local government education: Consumption expenditures
F08I State and local government gross investment,
education F08I00 State and local government education: Gross investment
F09C State and local government consumption
expenditures, other F09C00 State and local government other: Consumption expenditures
F09I State and local government gross investment,
other F09I00 State and local government other: Gross investment
Other Other S00300
S00900
Used Used S00401
S00402

33
Appendix B Direct Requirements Coefficients, National, 2009
111CA 113FF 211 212 213 22 23 311FT 313TT 315AL 321 322 323 324 325 326 327 331 332 333 334
IOCode Industry Farms Forestry, f ishing, and related activitiesOil and gas extractionMining, except oil and gasSupport activities for miningUtilities Construction Food and beverage and tobacco productsTextile mills and textile product millsApparel and leather and allied productsWood productsPaper productsPrinting and related support activitiesPetroleum and coal productsChemical productsPlastics and rubber productsNonmetallic mineral productsPrimary metalsFabricated metal productsMachinery Computer and electronic products
111CA Farms 0.1229 0.0042 0.0000 0.0000 0.0000 0.0000 0.0008 0.2170 0.0190 0.0000 0.0000 0.0000 0.0000 0.0000 0.0024 0.0000 0.0000 0.0000 0.0000 0.0000 0.0000
113FF Forestry, fishing, and related activities 0.0660 0.1226 0.0000 0.0000 0.0000 0.0000 0.0000 0.0056 0.0000 0.0006 0.1442 0.0172 0.0003 0.0000 0.0006 0.0076 0.0000 0.0000 0.0000 0.0000 0.0000
211 Oil and gas extraction 0.0000 0.0000 0.0568 0.0000 0.0000 0.1402 0.0000 0.0000 0.0001 0.0000 0.0003 0.0001 0.0000 0.6196 0.0089 0.0001 0.0001 0.0001 0.0000 0.0000 0.0000
212 Mining, except oil and gas 0.0040 0.0000 0.0005 0.0739 0.0037 0.0310 0.0086 0.0012 0.0006 0.0000 0.0001 0.0064 0.0000 0.0005 0.0088 0.0003 0.0641 0.0570 0.0006 0.0003 0.0004
213 Support activities for mining 0.0000 0.0000 0.0179 0.0240 0.0063 0.0000 0.0000 0.0000 0.0000 0.0000 0.0000 0.0000 0.0000 0.0000 0.0000 0.0000 0.0000 0.0000 0.0000 0.0000 0.0000
22 Utilities 0.0235 0.0014 0.0046 0.0332 0.0117 0.0007 0.0042 0.0249 0.0289 0.0082 0.0320 0.0553 0.0253 0.0077 0.0325 0.0267 0.0548 0.0504 0.0180 0.0089 0.0059
23 Construction 0.0060 0.0015 0.0377 0.0000 0.0004 0.0205 0.0010 0.0032 0.0027 0.0010 0.0082 0.0069 0.0075 0.0026 0.0040 0.0049 0.0080 0.0097 0.0044 0.0029 0.0014
311FT Food and beverage and tobacco products 0.0912 0.0050 0.0000 0.0000 0.0000 0.0000 0.0000 0.1857 0.0000 0.0324 0.0003 0.0032 0.0038 0.0001 0.0040 0.0003 0.0005 0.0000 0.0000 0.0000 0.0000
313TT Textile mills and textile product mills 0.0005 0.0012 0.0000 0.0001 0.0000 0.0000 0.0011 0.0003 0.1524 0.1048 0.0054 0.0139 0.0037 0.0001 0.0000 0.0118 0.0025 0.0000 0.0000 0.0021 0.0000
315AL Apparel and leather and all ied products 0.0002 0.0000 0.0000 0.0000 0.0000 0.0000 0.0000 0.0000 0.0262 0.0732 0.0000 0.0000 0.0154 0.0000 0.0000 0.0000 0.0000 0.0000 0.0000 0.0000 0.0000
321 Wood products 0.0020 0.0053 0.0000 0.0000 0.0015 0.0003 0.0276 0.0004 0.0022 0.0000 0.1873 0.0196 0.0001 0.0000 0.0006 0.0043 0.0048 0.0019 0.0006 0.0018 0.0005
322 Paper products 0.0012 0.0001 0.0005 0.0012 0.0059 0.0002 0.0027 0.0328 0.0058 0.0018 0.0053 0.2067 0.1500 0.0007 0.0060 0.0192 0.0178 0.0066 0.0055 0.0046 0.0027
323 Printing and related support activities 0.0002 0.0000 0.0000 0.0000 0.0000 0.0000 0.0000 0.0004 0.0000 0.0015 0.0002 0.0000 0.0206 0.0000 0.0006 0.0000 0.0000 0.0000 0.0000 0.0000 0.0000
324 Petroleum and coal products 0.0524 0.0128 0.0022 0.0102 0.0166 0.0073 0.0372 0.0026 0.0028 0.0006 0.0068 0.0114 0.0067 0.0538 0.0330 0.0063 0.0063 0.0046 0.0018 0.0031 0.0006
325 Chemical products 0.0633 0.0369 0.0077 0.0019 0.0364 0.0004 0.0085 0.0094 0.2162 0.0104 0.0242 0.0691 0.0341 0.0075 0.3070 0.3011 0.0310 0.0101 0.0238 0.0093 0.0119
326 Plastics and rubber products 0.0040 0.0026 0.0014 0.0089 0.0081 0.0007 0.0169 0.0221 0.0039 0.0067 0.0074 0.0155 0.0112 0.0004 0.0145 0.0666 0.0095 0.0030 0.0056 0.0224 0.0087
327 Nonmetallic mineral products 0.0001 0.0003 0.0007 0.0029 0.0149 0.0005 0.0413 0.0037 0.0012 0.0000 0.0113 0.0008 0.0000 0.0019 0.0016 0.0060 0.1043 0.0102 0.0038 0.0049 0.0020
331 Primary metals 0.0002 0.0000 0.0033 0.0072 0.0377 0.0001 0.0050 0.0063 0.0012 0.0000 0.0017 0.0016 0.0003 0.0002 0.0006 0.0038 0.0092 0.3206 0.1912 0.0826 0.0161
332 Fabricated metal products 0.0059 0.0050 0.0075 0.0077 0.0217 0.0018 0.0583 0.0150 0.0078 0.0043 0.0226 0.0179 0.0117 0.0011 0.0105 0.0233 0.0225 0.0225 0.1151 0.1035 0.0232
333 Machinery 0.0088 0.0061 0.0049 0.0148 0.0252 0.0015 0.0182 0.0028 0.0005 0.0001 0.0054 0.0050 0.0101 0.0003 0.0042 0.0066 0.0023 0.0101 0.0087 0.0775 0.0020
334 Computer and electronic products 0.0001 0.0000 0.0000 0.0004 0.0007 0.0007 0.0031 0.0024 0.0075 0.0014 0.0064 0.0106 0.0122 0.0005 0.0066 0.0121 0.0104 0.0154 0.0114 0.0172 0.1292
335 Electrical equipment, appliances, and components 0.0006 0.0040 0.0000 0.0003 0.0014 0.0010 0.0214 0.0013 0.0007 0.0002 0.0060 0.0014 0.0009 0.0003 0.0012 0.0054 0.0007 0.0093 0.0047 0.0316 0.0103
3361MV Motor vehicles, bodies and trailers, and parts 0.0023 0.0027 0.0011 0.0036 0.0054 0.0004 0.0047 0.0015 0.0007 0.0000 0.0032 0.0014 0.0009 0.0002 0.0006 0.0008 0.0021 0.0017 0.0020 0.0152 0.0010
3364OT Other transportation equipment 0.0000 0.0019 0.0000 0.0002 0.0000 0.0000 0.0000 0.0000 0.0000 0.0000 0.0000 0.0000 0.0000 0.0000 0.0000 0.0000 0.0000 0.0000 0.0001 0.0001 0.0000
337 Furniture and related products 0.0000 0.0000 0.0000 0.0000 0.0000 0.0001 0.0085 0.0000 0.0000 0.0000 0.0022 0.0000 0.0000 0.0000 0.0000 0.0011 0.0000 0.0000 0.0000 0.0006 0.0013
339 Miscellaneous manufacturing 0.0004 0.0001 0.0002 0.0002 0.0030 0.0000 0.0006 0.0001 0.0018 0.0047 0.0002 0.0000 0.0003 0.0000 0.0009 0.0010 0.0016 0.0004 0.0010 0.0071 0.0000
42 Wholesale trade 0.0514 0.0231 0.0038 0.0099 0.0197 0.0023 0.0265 0.0591 0.0489 0.0413 0.0671 0.0512 0.0431 0.0295 0.0420 0.0355 0.0301 0.0422 0.0340 0.0489 0.0477
44RT Retail trade 0.0017 0.0001 0.0007 0.0012 0.0013 0.0001 0.0364 0.0009 0.0003 0.0004 0.0006 0.0002 0.0003 0.0006 0.0035 0.0005 0.0006 0.0001 0.0003 0.0028 0.0005
481 Air transportation 0.0006 0.0002 0.0000 0.0002 0.0012 0.0006 0.0010 0.0014 0.0017 0.0009 0.0024 0.0014 0.0054 0.0001 0.0011 0.0021 0.0020 0.0013 0.0023 0.0016 0.0011
482 Rail transportation 0.0040 0.0006 0.0008 0.0368 0.0046 0.0245 0.0009 0.0058 0.0010 0.0003 0.0045 0.0110 0.0014 0.0009 0.0067 0.0044 0.0140 0.0272 0.0026 0.0012 0.0005
483 Water transportation 0.0013 0.0000 0.0001 0.0004 0.0002 0.0002 0.0002 0.0011 0.0001 0.0000 0.0000 0.0001 0.0000 0.0001 0.0002 0.0000 0.0004 0.0006 0.0001 0.0000 0.0000
484 Truck transportation 0.0153 0.0040 0.0008 0.0162 0.0114 0.0023 0.0112 0.0212 0.0153 0.0096 0.0258 0.0173 0.0099 0.0025 0.0094 0.0089 0.0422 0.0166 0.0095 0.0091 0.0037
485 Transit and ground passenger transportation 0.0000 0.0000 0.0000 0.0000 0.0002 0.0002 0.0002 0.0002 0.0002 0.0001 0.0006 0.0003 0.0013 0.0000 0.0001 0.0004 0.0005 0.0002 0.0005 0.0003 0.0002
486 Pipeline transportation 0.0000 0.0000 0.0032 0.0001 0.0002 0.0236 0.0001 0.0000 0.0004 0.0000 0.0000 0.0000 0.0000 0.0084 0.0003 0.0001 0.0000 0.0000 0.0000 0.0000 0.0000
487OS Other transportation and support activities 0.0000 0.0008 0.0000 0.0022 0.0000 0.0009 0.0000 0.0009 0.0016 0.0000 0.0119 0.0025 0.0072 0.0005 0.0002 0.0018 0.0059 0.0005 0.0002 0.0000 0.0000
493 Warehousing and storage 0.0037 0.0000 0.0000 0.0000 0.0000 0.0000 0.0000 0.0016 0.0020 0.0019 0.0040 0.0023 0.0064 0.0001 0.0012 0.0027 0.0034 0.0025 0.0036 0.0029 0.0024
511 Publishing industries (includes software) 0.0000 0.0000 0.0000 0.0000 0.0000 0.0000 0.0000 0.0000 0.0000 0.0000 0.0000 0.0000 0.0001 0.0000 0.0000 0.0000 0.0000 0.0000 0.0000 0.0000 0.0287
512 Motion picture and sound recording industries 0.0000 0.0000 0.0000 0.0000 0.0000 0.0000 0.0000 0.0000 0.0000 0.0000 0.0000 0.0000 0.0000 0.0000 0.0000 0.0000 0.0000 0.0000 0.0000 0.0000 0.0000
513 Broadcasting and telecommunications 0.0010 0.0003 0.0005 0.0012 0.0027 0.0005 0.0066 0.0011 0.0016 0.0016 0.0035 0.0015 0.0062 0.0001 0.0009 0.0025 0.0029 0.0014 0.0031 0.0024 0.0014
514 Information and data processing services 0.0001 0.0002 0.0001 0.0002 0.0003 0.0016 0.0013 0.0015 0.0019 0.0016 0.0048 0.0024 0.0047 0.0001 0.0009 0.0024 0.0038 0.0019 0.0036 0.0031 0.0022
521CI Fed Res banks, credit intermed, & related 0.0582 0.0059 0.0016 0.0065 0.0122 0.0115 0.0091 0.0049 0.0054 0.0042 0.0056 0.0027 0.0218 0.0004 0.0019 0.0094 0.0102 0.0056 0.0085 0.0048 0.0014
523 Securities, commodity contracts, and investments 0.0022 0.0016 0.0004 0.0079 0.0113 0.0009 0.0021 0.0007 0.0008 0.0007 0.0014 0.0007 0.0027 0.0001 0.0003 0.0013 0.0016 0.0106 0.0127 0.0090 0.0024
524 Insurance carriers and related activities 0.0083 0.0008 0.0002 0.0011 0.0015 0.0002 0.0000 0.0001 0.0001 0.0000 0.0000 0.0000 0.0019 0.0000 0.0000 0.0001 0.0001 0.0001 0.0001 0.0005 0.0000
525 Funds, trusts, and other financial vehicles 0.0000 0.0000 0.0000 0.0000 0.0000 0.0000 0.0000 0.0000 0.0000 0.0000 0.0000 0.0000 0.0000 0.0000 0.0000 0.0000 0.0000 0.0000 0.0000 0.0000 0.0000
531 Real estate 0.0204 0.0047 0.0017 0.0022 0.0114 0.0028 0.0074 0.0067 0.0050 0.0052 0.0148 0.0059 0.0223 0.0004 0.0027 0.0084 0.0074 0.0032 0.0113 0.0063 0.0035
532RL Rental/leasing svcs & lessors of intangible assets 0.0088 0.0021 0.0458 0.0208 0.0250 0.0009 0.0168 0.0095 0.0054 0.0087 0.0110 0.0097 0.0232 0.0009 0.0134 0.0085 0.0129 0.0081 0.0153 0.0105 0.0131
5411 Legal services 0.0032 0.0040 0.0018 0.0059 0.0174 0.0070 0.0110 0.0020 0.0023 0.0035 0.0048 0.0025 0.0090 0.0004 0.0024 0.0034 0.0043 0.0038 0.0061 0.0044 0.0041
5412OP Misc professional, scientific, & technical services 0.0052 0.0189 0.0072 0.0191 0.0590 0.0186 0.0689 0.0194 0.0172 0.0264 0.0334 0.0168 0.0520 0.0026 0.0555 0.0243 0.0304 0.0200 0.0356 0.0248 0.0380
5415 Computer systems design and related services 0.0018 0.0021 0.0033 0.0068 0.0025 0.0016 0.0036 0.0011 0.0014 0.0010 0.0027 0.0015 0.0075 0.0003 0.0011 0.0020 0.0019 0.0013 0.0077 0.0037 0.0056
55 Management of companies and enterprises 0.0000 0.0000 0.0109 0.0220 0.0296 0.0000 0.0023 0.0385 0.0137 0.0146 0.0276 0.0258 0.0297 0.0026 0.0459 0.0203 0.0323 0.0218 0.0172 0.0275 0.0346
561 Administrative and support services 0.0017 0.0020 0.0009 0.0039 0.0068 0.0035 0.0102 0.0063 0.0052 0.0132 0.0137 0.0093 0.0343 0.0012 0.0059 0.0087 0.0136 0.0141 0.0183 0.0084 0.0083
562 Waste management and remediation services 0.0001 0.0004 0.0001 0.0009 0.0025 0.0006 0.0017 0.0016 0.0012 0.0007 0.0022 0.0019 0.0019 0.0002 0.0011 0.0020 0.0019 0.0030 0.0016 0.0007 0.0003
61 Educational services 0.0027 0.0157 0.0000 0.0000 0.0000 0.0003 0.0001 0.0000 0.0000 0.0000 0.0000 0.0000 0.0019 0.0000 0.0000 0.0000 0.0000 0.0000 0.0000 0.0000 0.0000
621 Ambulatory health care services 0.0000 0.0000 0.0000 0.0000 0.0000 0.0000 0.0000 0.0000 0.0000 0.0000 0.0000 0.0000 0.0000 0.0000 0.0000 0.0000 0.0000 0.0000 0.0000 0.0000 0.0000
622HO Hospitals & nursing/residential care facil ities 0.0000 0.0000 0.0000 0.0000 0.0000 0.0000 0.0000 0.0000 0.0000 0.0000 0.0000 0.0000 0.0000 0.0000 0.0000 0.0000 0.0000 0.0000 0.0000 0.0000 0.0000
624 Social assistance 0.0000 0.0000 0.0000 0.0000 0.0000 0.0000 0.0000 0.0000 0.0000 0.0000 0.0000 0.0000 0.0000 0.0000 0.0000 0.0000 0.0000 0.0000 0.0000 0.0000 0.0000
711AS Performing arts, spect. sports, museums, & related 0.0003 0.0012 0.0000 0.0000 0.0001 0.0002 0.0003 0.0004 0.0004 0.0004 0.0011 0.0005 0.0014 0.0001 0.0002 0.0007 0.0007 0.0005 0.0006 0.0005 0.0001
713 Amusements, gambling, and recreation industries 0.0002 0.0000 0.0000 0.0000 0.0001 0.0001 0.0001 0.0001 0.0001 0.0001 0.0003 0.0001 0.0007 0.0000 0.0001 0.0002 0.0002 0.0001 0.0003 0.0002 0.0001
721 Accommodation 0.0001 0.0000 0.0000 0.0002 0.0012 0.0007 0.0010 0.0009 0.0009 0.0006 0.0027 0.0012 0.0061 0.0001 0.0005 0.0020 0.0021 0.0010 0.0023 0.0016 0.0007
722 Food services and drinking places 0.0005 0.0000 0.0000 0.0001 0.0012 0.0052 0.0013 0.0015 0.0016 0.0013 0.0042 0.0020 0.0090 0.0004 0.0007 0.0029 0.0030 0.0018 0.0031 0.0022 0.0008
81 Other services, except government 0.0034 0.0039 0.0003 0.0010 0.0035 0.0012 0.0147 0.0035 0.0034 0.0013 0.0089 0.0068 0.0088 0.0007 0.0036 0.0054 0.0088 0.0093 0.0055 0.0033 0.0016
GFG Federal general government 0.0000 0.0000 0.0000 0.0000 0.0000 0.0000 0.0000 0.0000 0.0000 0.0000 0.0000 0.0000 0.0000 0.0000 0.0000 0.0000 0.0000 0.0000 0.0000 0.0000 0.0000
GFE Federal government enterprises 0.0002 0.0001 0.0000 0.0001 0.0000 0.0004 0.0000 0.0000 0.0001 0.0000 0.0000 0.0000 0.0018 0.0002 0.0001 0.0000 0.0000 0.0001 0.0002 0.0012 0.0000
GSLG State and local general government 0.0000 0.0000 0.0000 0.0000 0.0000 0.0000 0.0000 0.0000 0.0000 0.0000 0.0000 0.0000 0.0000 0.0000 0.0000 0.0000 0.0000 0.0000 0.0000 0.0000 0.0000
GSLE State and local government enterprises 0.0000 0.0003 0.0000 0.0000 0.0000 0.0000 0.0000 0.0005 0.0003 0.0002 0.0005 0.0006 0.0005 0.0000 0.0004 0.0005 0.0005 0.0010 0.0003 0.0002 0.0001
Used Scrap, used and secondhand goods -0.0001 0.0000 0.0000 -0.0002 0.0004 0.0000 0.0001 0.0000 0.0004 0.0000 0.0000 0.0055 0.0000 0.0000 0.0000 0.0003 0.0003 0.0278 0.0002 0.0000 0.0000
Other Noncomparable imports, rest-of-the-world adjstmt 0.0002 0.0002 0.0021 0.0020 0.0037 0.0004 0.0001 0.0019 0.0017 0.0024 0.0003 0.0007 0.0003 0.0009 0.0131 0.0036 0.0025 0.0011 0.0007 0.0045 0.0056
V001 Compensation of employees 0.0925 0.3928 0.1384 0.2152 0.2556 0.1630 0.3530 0.1141 0.2468 0.5012 0.2186 0.1870 0.3185 0.0335 0.1323 0.2081 0.2564 0.1480 0.2538 0.2729 0.3334
V002 Taxes on production and imports, less subsidies -0.0155 0.0302 0.1427 0.0626 0.0199 0.1457 0.0066 0.0398 0.0167 0.0220 0.0104 0.0124 0.0110 0.0064 0.0107 0.0115 0.0147 0.0134 0.0098 0.0135 0.0166
V003 Gross operating surplus 0.2707 0.2699 0.4857 0.3625 0.2927 0.3713 0.1352 0.1128 0.1131 0.0828 0.0302 0.1520 0.0324 0.2077 0.1922 0.1054 0.1358 0.0761 0.1307 0.1311 0.2242
Total 1.0000 1.0000 1.0000 1.0000 1.0000 1.0000 1.0000 1.0000 1.0000 1.0000 1.0000 1.0000 1.0000 1.0000 1.0000 1.0000 1.0000 1.0000 1.0000 1.0000 1.0000

34
335 3361MV 3364OT 337 339 42 44RT 481 482 483 484 485 486 487OS 493 511 512 513 514 521CI
IOCode Industry Electrical equipment, appliances, and componentsMotor vehicles, bodies and trailers, and partsOther transportation equipmentFurniture and related productsMiscellaneous manufacturingWholesale tradeRetail trade Air transportationRail transportationWater transportationTruck transportationTransit and ground passenger transportationPipeline transportationOther transportation and support activitiesWarehousing and storagePublishing industries (includes softw are)Motion picture and sound recording industriesBroadcasting and telecommunicationsInformation and data processing servicesFederal Reserve banks, credit intermediation, and related activities
111CA Farms 0.0000 0.0000 0.0000 0.0000 0.0001 0.0000 0.0001 0.0000 0.0000 0.0000 0.0000 0.0000 0.0000 0.0001 0.0000 0.0000 0.0000 0.0000 0.0000 0.0000
113FF Forestry, fishing, and related activities 0.0001 0.0000 0.0000 0.0007 0.0007 0.0000 0.0002 0.0000 0.0000 0.0000 0.0000 0.0000 0.0000 0.0000 0.0000 0.0000 0.0000 0.0000 0.0000 0.0000
211 Oil and gas extraction 0.0000 0.0000 0.0000 0.0000 0.0000 0.0002 0.0002 0.0000 0.0000 0.0000 0.0000 0.0000 0.0702 0.0000 0.0003 0.0000 0.0001 0.0004 0.0001 0.0000
212 Mining, except oil and gas 0.0018 0.0050 0.0020 0.0003 0.0011 0.0000 0.0000 0.0000 0.0006 0.0003 0.0000 0.0000 0.0000 0.0000 0.0001 0.0011 0.0006 0.0001 0.0005 0.0000
213 Support activities for mining 0.0000 0.0000 0.0000 0.0000 0.0000 0.0000 0.0000 0.0000 0.0000 0.0000 0.0000 0.0000 0.0000 0.0001 0.0000 0.0000 0.0000 0.0000 0.0000 0.0000
22 Utilities 0.0107 0.0104 0.0077 0.0132 0.0079 0.0031 0.0090 0.0004 0.0010 0.0043 0.0030 0.0034 0.0071 0.0030 0.0181 0.0019 0.0047 0.0050 0.0020 0.0021
23 Construction 0.0022 0.0022 0.0021 0.0050 0.0024 0.0011 0.0033 0.0001 0.0551 0.0000 0.0011 0.0010 0.0728 0.0031 0.0057 0.0017 0.0023 0.0118 0.0043 0.0129
311FT Food and beverage and tobacco products 0.0000 0.0000 0.0000 0.0000 0.0000 0.0006 0.0001 0.0003 0.0000 0.0005 0.0000 0.0000 0.0000 0.0000 0.0000 0.0005 0.0001 0.0000 0.0000 0.0000
313TT Textile mills and textile product mills 0.0001 0.0062 0.0014 0.0338 0.0094 0.0003 0.0023 0.0000 0.0000 0.0021 0.0000 0.0000 0.0001 0.0000 0.0000 0.0000 0.0004 0.0000 0.0000 0.0000
315AL Apparel and leather and all ied products 0.0000 0.0042 0.0000 0.0000 0.0003 0.0004 0.0006 0.0000 0.0000 0.0000 0.0000 0.0000 0.0000 0.0000 0.0000 0.0000 0.0001 0.0001 0.0000 0.0000
321 Wood products 0.0018 0.0055 0.0006 0.0832 0.0079 0.0009 0.0009 0.0000 0.0132 0.0000 0.0008 0.0000 0.0001 0.0001 0.0009 0.0023 0.0038 0.0007 0.0060 0.0000
322 Paper products 0.0088 0.0041 0.0027 0.0129 0.0107 0.0022 0.0017 0.0005 0.0014 0.0002 0.0011 0.0005 0.0015 0.0009 0.0024 0.0079 0.0012 0.0011 0.0013 0.0013
323 Printing and related support activities 0.0001 0.0000 0.0000 0.0000 0.0000 0.0024 0.0037 0.0000 0.0004 0.0000 0.0004 0.0003 0.0003 0.0002 0.0001 0.0454 0.0034 0.0005 0.0025 0.0008
324 Petroleum and coal products 0.0051 0.0007 0.0010 0.0016 0.0011 0.0047 0.0020 0.1772 0.0803 0.1667 0.1094 0.0615 0.0133 0.0860 0.0113 0.0013 0.0006 0.0025 0.0018 0.0012
325 Chemical products 0.0295 0.0150 0.0073 0.0212 0.0390 0.0010 0.0008 0.0000 0.0036 0.0002 0.0018 0.0002 0.0005 0.0010 0.0017 0.0048 0.0008 0.0007 0.0020 0.0002
326 Plastics and rubber products 0.0256 0.0342 0.0105 0.0616 0.0297 0.0035 0.0043 0.0000 0.0004 0.0000 0.0081 0.0014 0.0022 0.0023 0.0026 0.0019 0.0012 0.0031 0.0018 0.0001
327 Nonmetallic mineral products 0.0094 0.0094 0.0013 0.0035 0.0032 0.0002 0.0006 0.0000 0.0002 0.0000 0.0001 0.0000 0.0001 0.0000 0.0005 0.0001 0.0001 0.0014 0.0032 0.0000
331 Primary metals 0.1256 0.0685 0.0327 0.0363 0.0448 0.0003 0.0000 0.0000 0.0185 0.0000 0.0000 0.0000 0.0000 0.0001 0.0000 0.0014 0.0007 0.0001 0.0011 0.0000
332 Fabricated metal products 0.0423 0.0888 0.0610 0.0404 0.0380 0.0011 0.0017 0.0039 0.0032 0.0454 0.0106 0.0288 0.0171 0.0012 0.0037 0.0089 0.0006 0.0077 0.0061 0.0001
333 Machinery 0.0066 0.0344 0.0126 0.0008 0.0130 0.0006 0.0004 0.0001 0.0029 0.0003 0.0007 0.0009 0.0309 0.0030 0.0048 0.0019 0.0012 0.0012 0.0014 0.0000
334 Computer and electronic products 0.0281 0.0258 0.0934 0.0098 0.0110 0.0032 0.0023 0.0001 0.0002 0.0000 0.0008 0.0002 0.0006 0.0002 0.0009 0.0134 0.0112 0.0202 0.0267 0.0041
335 Electrical equipment, appliances, and components 0.0547 0.0079 0.0077 0.0006 0.0042 0.0002 0.0005 0.0001 0.0029 0.0002 0.0023 0.0016 0.0006 0.0002 0.0035 0.0000 0.0000 0.0040 0.0023 0.0001
3361MV Motor vehicles, bodies and trailers, and parts 0.0016 0.2933 0.0091 0.0015 0.0008 0.0018 0.0030 0.0000 0.0020 0.0000 0.0196 0.0492 0.0000 0.0020 0.0069 0.0012 0.0001 0.0005 0.0003 0.0002
3364OT Other transportation equipment 0.0000 0.0004 0.1710 0.0000 0.0000 0.0000 0.0000 0.0148 0.0199 0.0533 0.0000 0.0059 0.0000 0.0054 0.0000 0.0000 0.0000 0.0000 0.0000 0.0000
337 Furniture and related products 0.0000 0.0006 0.0001 0.0390 0.0016 0.0002 0.0006 0.0000 0.0000 0.0000 0.0000 0.0000 0.0000 0.0000 0.0000 0.0000 0.0000 0.0002 0.0021 0.0000
339 Miscellaneous manufacturing 0.0021 0.0028 0.0006 0.0001 0.0508 0.0005 0.0006 0.0000 0.0001 0.0000 0.0000 0.0002 0.0000 0.0001 0.0011 0.0001 0.0001 0.0004 0.0006 0.0004
42 Wholesale trade 0.0503 0.0496 0.0285 0.0497 0.0350 0.0240 0.0121 0.0147 0.0183 0.0165 0.0194 0.0079 0.0099 0.0096 0.0064 0.0243 0.0013 0.0062 0.0079 0.0015
44RT Retail trade 0.0015 0.0041 0.0024 0.0082 0.0027 0.0004 0.0013 0.0000 0.0006 0.0033 0.0086 0.0050 0.0016 0.0019 0.0006 0.0002 0.0002 0.0000 0.0005 0.0007
481 Air transportation 0.0007 0.0011 0.0021 0.0027 0.0019 0.0014 0.0010 0.0000 0.0004 0.0021 0.0044 0.0003 0.0001 0.0023 0.0015 0.0050 0.0031 0.0015 0.0070 0.0057
482 Rail transportation 0.0018 0.0017 0.0009 0.0019 0.0009 0.0001 0.0001 0.0003 0.0048 0.0005 0.0123 0.0002 0.0007 0.0002 0.0001 0.0002 0.0000 0.0003 0.0001 0.0000
483 Water transportation 0.0001 0.0001 0.0001 0.0000 0.0000 0.0000 0.0000 0.0005 0.0003 0.0006 0.0003 0.0001 0.0003 0.0003 0.0000 0.0000 0.0000 0.0000 0.0000 0.0000
484 Truck transportation 0.0078 0.0110 0.0081 0.0168 0.0104 0.0024 0.0069 0.0025 0.0065 0.0073 0.0609 0.0033 0.0017 0.0048 0.0035 0.0031 0.0017 0.0013 0.0028 0.0002
485 Transit and ground passenger transportation 0.0001 0.0001 0.0002 0.0006 0.0005 0.0001 0.0001 0.0000 0.0014 0.0000 0.0000 0.0000 0.0000 0.0000 0.0000 0.0013 0.0007 0.0006 0.0023 0.0021
486 Pipeline transportation 0.0000 0.0000 0.0000 0.0000 0.0000 0.0000 0.0000 0.0011 0.0008 0.0017 0.0009 0.0001 0.0007 0.0003 0.0001 0.0000 0.0000 0.0000 0.0000 0.0000
487OS Other transportation and support activities 0.0000 0.0000 0.0000 0.0068 0.0010 0.0116 0.0102 0.1282 0.0093 0.0936 0.0556 0.0026 0.0047 0.0529 0.0181 0.0122 0.0063 0.0002 0.0115 0.0007
493 Warehousing and storage 0.0020 0.0017 0.0038 0.0037 0.0035 0.0083 0.0137 0.0001 0.0000 0.0045 0.0109 0.0011 0.0002 0.0058 0.0459 0.0046 0.0023 0.0005 0.0044 0.0000
511 Publishing industries (includes software) 0.0008 0.0012 0.0033 0.0000 0.0000 0.0000 0.0006 0.0000 0.0000 0.0000 0.0000 0.0000 0.0000 0.0000 0.0000 0.0249 0.0003 0.0009 0.0020 0.0005
512 Motion picture and sound recording industries 0.0000 0.0000 0.0000 0.0000 0.0000 0.0000 0.0002 0.0000 0.0000 0.0001 0.0000 0.0000 0.0000 0.0000 0.0000 0.0002 0.1133 0.0494 0.0055 0.0000
513 Broadcasting and telecommunications 0.0011 0.0008 0.0013 0.0047 0.0034 0.0037 0.0048 0.0035 0.0016 0.0021 0.0061 0.0028 0.0027 0.0036 0.0049 0.0108 0.0077 0.1314 0.0289 0.0081
514 Information and data processing services 0.0015 0.0010 0.0028 0.0059 0.0033 0.0011 0.0034 0.0005 0.0002 0.0003 0.0006 0.0011 0.0024 0.0003 0.0012 0.0113 0.0016 0.0049 0.0105 0.0063
521CI Fed Res banks, credit intermed, & related 0.0024 0.0018 0.0046 0.0095 0.0069 0.0100 0.0192 0.0022 0.0561 0.0008 0.0094 0.0045 0.0112 0.0021 0.0058 0.0216 0.0102 0.0113 0.0122 0.1205
523 Securities, commodity contracts, and investments 0.0049 0.0042 0.0088 0.0139 0.0107 0.0009 0.0013 0.0005 0.0271 0.0120 0.0011 0.0026 0.0032 0.0021 0.0008 0.0032 0.0040 0.0016 0.0012 0.0995
524 Insurance carriers and related activities 0.0004 0.0000 0.0000 0.0002 0.0001 0.0077 0.0110 0.0054 0.0000 0.0174 0.0386 0.0206 0.0156 0.0070 0.0109 0.0083 0.0075 0.0000 0.0060 0.0314
525 Funds, trusts, and other financial vehicles 0.0000 0.0000 0.0000 0.0000 0.0000 0.0000 0.0000 0.0000 0.0000 0.0000 0.0000 0.0000 0.0000 0.0013 0.0000 0.0000 0.0000 0.0000 0.0000 0.0000
531 Real estate 0.0036 0.0024 0.0041 0.0197 0.0099 0.0120 0.0478 0.0075 0.0027 0.0247 0.0144 0.0001 0.0102 0.0089 0.0577 0.0275 0.0352 0.0127 0.0203 0.0211
532RL Rental/leasing svcs & lessors of intangible assets 0.0087 0.0070 0.0145 0.0077 0.0166 0.0075 0.0111 0.0436 0.0589 0.0011 0.0051 0.0076 0.0001 0.0062 0.0064 0.0249 0.0095 0.0105 0.0600 0.0031
5411 Legal services 0.0023 0.0014 0.0068 0.0035 0.0068 0.0036 0.0032 0.0022 0.0239 0.0019 0.0028 0.0033 0.0051 0.0023 0.0038 0.0167 0.0122 0.0041 0.0105 0.0126
5412OP Misc professional, scientific, & technical services 0.0178 0.0157 0.0456 0.0457 0.0398 0.0338 0.0434 0.0046 0.0358 0.0107 0.0136 0.0169 0.0428 0.0096 0.0182 0.0969 0.0987 0.0608 0.0607 0.0622
5415 Computer systems design and related services 0.0006 0.0008 0.0064 0.0043 0.0026 0.0023 0.0034 0.0005 0.0150 0.0006 0.0036 0.0014 0.0016 0.0008 0.0041 0.0143 0.0036 0.0060 0.0353 0.0056
55 Management of companies and enterprises 0.0239 0.0338 0.0520 0.0144 0.0182 0.0152 0.0067 0.0018 0.0000 0.0053 0.0101 0.0052 0.0000 0.0089 0.0131 0.0279 0.0070 0.0013 0.0079 0.0150
561 Administrative and support services 0.0045 0.0042 0.0189 0.0102 0.0067 0.0181 0.0206 0.0110 0.0227 0.0127 0.0497 0.0132 0.0301 0.0282 0.0365 0.0782 0.0266 0.0153 0.0465 0.0239
562 Waste management and remediation services 0.0005 0.0007 0.0008 0.0030 0.0010 0.0005 0.0011 0.0002 0.0011 0.0150 0.0008 0.0090 0.0026 0.0076 0.0024 0.0002 0.0003 0.0022 0.0005 0.0000
61 Educational services 0.0000 0.0000 0.0000 0.0000 0.0000 0.0007 0.0047 0.0001 0.0011 0.0000 0.0000 0.0000 0.0004 0.0000 0.0000 0.0000 0.0000 0.0010 0.0011 0.0002
621 Ambulatory health care services 0.0000 0.0000 0.0000 0.0000 0.0000 0.0000 0.0000 0.0000 0.0000 0.0000 0.0000 0.0000 0.0000 0.0000 0.0000 0.0000 0.0000 0.0000 0.0000 0.0000
622HO Hospitals & nursing/residential care facil ities 0.0000 0.0000 0.0000 0.0000 0.0000 0.0000 0.0000 0.0000 0.0000 0.0000 0.0000 0.0000 0.0000 0.0000 0.0000 0.0000 0.0000 0.0000 0.0000 0.0000
624 Social assistance 0.0000 0.0000 0.0000 0.0000 0.0000 0.0000 0.0000 0.0000 0.0000 0.0000 0.0000 0.0000 0.0000 0.0000 0.0000 0.0000 0.0000 0.0000 0.0000 0.0000
711AS Performing arts, spect. sports, museums, & related 0.0002 0.0002 0.0004 0.0007 0.0006 0.0007 0.0015 0.0001 0.0050 0.0000 0.0001 0.0005 0.0001 0.0012 0.0017 0.0018 0.0219 0.0217 0.0017 0.0035
713 Amusements, gambling, and recreation industries 0.0000 0.0001 0.0001 0.0003 0.0003 0.0002 0.0004 0.0000 0.0000 0.0000 0.0000 0.0000 0.0000 0.0000 0.0000 0.0007 0.0004 0.0002 0.0012 0.0012
721 Accommodation 0.0005 0.0006 0.0012 0.0029 0.0024 0.0004 0.0001 0.0000 0.0002 0.0000 0.0000 0.0002 0.0002 0.0009 0.0010 0.0060 0.0033 0.0022 0.0106 0.0101
722 Food services and drinking places 0.0008 0.0009 0.0016 0.0035 0.0031 0.0015 0.0028 0.0179 0.0002 0.0001 0.0006 0.0001 0.0002 0.0026 0.0011 0.0064 0.0036 0.0024 0.0114 0.0163
81 Other services, except government 0.0023 0.0023 0.0029 0.0058 0.0033 0.0049 0.0058 0.0005 0.0056 0.0020 0.0072 0.0043 0.0099 0.0035 0.0089 0.0057 0.0046 0.0075 0.0238 0.0176
GFG Federal general government 0.0000 0.0000 0.0000 0.0000 0.0000 0.0000 0.0000 0.0000 0.0000 0.0000 0.0000 0.0000 0.0000 0.0000 0.0000 0.0000 0.0000 0.0000 0.0000 0.0000
GFE Federal government enterprises 0.0013 0.0000 0.0000 0.0000 0.0002 0.0051 0.0063 0.0000 0.0000 0.0114 0.0260 0.0013 0.0040 0.0137 0.0091 0.0064 0.0035 0.0010 0.0069 0.0049
GSLG State and local general government 0.0000 0.0000 0.0000 0.0000 0.0000 0.0000 0.0000 0.0000 0.0000 0.0000 0.0000 0.0000 0.0000 0.0000 0.0000 0.0000 0.0000 0.0000 0.0000 0.0000
GSLE State and local government enterprises 0.0001 0.0002 0.0002 0.0006 0.0002 0.0001 0.0003 0.0000 0.0000 0.0000 0.0001 0.0000 0.0000 0.0001 0.0009 0.0002 0.0002 0.0009 0.0003 0.0002
Used Scrap, used and secondhand goods 0.0000 0.0000 0.0000 0.0000 0.0001 0.0000 0.0000 -0.0006 0.0000 0.0000 0.0014 0.0000 0.0001 0.0013 0.0000 0.0000 0.0001 0.0000 0.0000 0.0000
Other Noncomparable imports, rest-of-the-world adjstmt 0.0109 0.0105 0.0008 0.0004 0.0033 0.0075 0.0004 0.0914 0.0014 0.0664 0.0001 0.0004 0.0027 0.0049 0.0004 0.0065 0.0042 0.0150 0.0157 0.0018
V001 Compensation of employees 0.2670 0.1474 0.2546 0.2964 0.2961 0.4079 0.4168 0.2722 0.3038 0.1648 0.2976 0.4783 0.2569 0.4574 0.5346 0.2421 0.2528 0.1726 0.2097 0.1839
V002 Taxes on production and imports, less subsidies 0.0103 0.0070 0.0086 0.0073 0.0091 0.1619 0.1526 0.0960 -0.0193 0.0223 0.0127 0.0333 0.1243 0.0338 0.0106 0.0066 0.0296 0.0498 0.0096 0.0133
V003 Gross operating surplus 0.2130 0.0669 0.0884 0.0832 0.2215 0.2163 0.1458 0.0937 0.2087 0.2244 0.1652 0.2175 0.2364 0.2045 0.1248 0.2039 0.2892 0.3408 0.2974 0.3027
Total 1.0000 1.0000 1.0000 1.0000 1.0000 1.0000 1.0000 1.0000 1.0000 1.0000 1.0000 1.0000 1.0000 1.0000 1.0000 1.0000 1.0000 1.0000 1.0000 1.0000

35
523 524 525 531 532RL 5411 5412OP 5415 55 561 562 61 621 622HO 624 711AS 713 721 722 81
IOCode Industry Securities, commodity contracts, and investmentsInsurance carriers and related activitiesFunds, trusts, and other f inancial vehiclesReal estate Rental and leasing services and lessors of intangible assetsLegal servicesMiscellaneous professional, scientif ic, and technical servicesComputer systems design and related servicesManagement of companies and enterprisesAdministrative and support servicesWaste management and remediation servicesEducational servicesAmbulatory health care servicesHospitals and nursing and residential care facilitiesSocial assistancePerforming arts, spectator sports, museums, and related activitiesAmusements, gambling, and recreation industriesAccommodationFood services and drinking placesOther services, except government
111CA Farms 0.0000 0.0000 0.0000 0.0000 0.0000 0.0000 0.0003 0.0000 0.0000 0.0002 0.0000 0.0005 0.0000 0.0000 0.0000 0.0000 0.0006 0.0002 0.0040 0.0000
113FF Forestry, fishing, and related activities 0.0000 0.0000 0.0000 0.0000 0.0000 0.0000 0.0001 0.0000 0.0000 0.0000 0.0000 0.0002 0.0000 0.0001 0.0001 0.0000 0.0014 0.0013 0.0075 0.0001
211 Oil and gas extraction 0.0000 0.0000 0.0000 0.0000 0.0006 0.0001 0.0004 0.0000 0.0003 0.0002 0.0004 0.0001 0.0001 0.0002 0.0004 0.0002 0.0004 0.0012 0.0006 0.0002
212 Mining, except oil and gas 0.0000 0.0000 0.0000 0.0003 0.0009 0.0000 0.0005 0.0000 0.0000 0.0001 0.0003 0.0003 0.0004 0.0001 0.0010 0.0005 0.0021 0.0001 0.0001 0.0004
213 Support activities for mining 0.0000 0.0000 0.0000 0.0000 0.0000 0.0000 0.0001 0.0000 0.0000 0.0000 0.0000 0.0000 0.0000 0.0000 0.0000 0.0000 0.0000 0.0000 0.0000 0.0000
22 Utilities 0.0024 0.0005 0.0007 0.0057 0.0130 0.0015 0.0029 0.0067 0.0040 0.0035 0.0078 0.0503 0.0035 0.0108 0.0069 0.0072 0.0205 0.0371 0.0175 0.0069
23 Construction 0.0030 0.0003 0.0018 0.0138 0.0043 0.0010 0.0054 0.0005 0.0021 0.0011 0.0009 0.0024 0.0021 0.0031 0.0043 0.0027 0.0052 0.0123 0.0038 0.0063
311FT Food and beverage and tobacco products 0.0000 0.0000 0.0000 0.0000 0.0000 0.0000 0.0011 0.0000 0.0001 0.0000 0.0000 0.0178 0.0000 0.0201 0.0137 0.0059 0.0131 0.0106 0.0994 0.0007
313TT Textile mills and textile product mills 0.0000 0.0000 0.0000 0.0000 0.0003 0.0000 0.0003 0.0000 0.0000 0.0002 0.0013 0.0001 0.0000 0.0006 0.0003 0.0000 0.0018 0.0004 0.0002 0.0007
315AL Apparel and leather and all ied products 0.0000 0.0000 0.0000 0.0000 0.0002 0.0000 0.0001 0.0000 0.0000 0.0003 0.0020 0.0002 0.0000 0.0001 0.0114 0.0008 0.0000 0.0000 0.0000 0.0010
321 Wood products 0.0000 0.0000 0.0000 0.0017 0.0036 0.0000 0.0003 0.0000 0.0000 0.0006 0.0005 0.0002 0.0002 0.0001 0.0028 0.0000 0.0015 0.0011 0.0040 0.0006
322 Paper products 0.0004 0.0001 0.0000 0.0001 0.0030 0.0012 0.0014 0.0009 0.0009 0.0021 0.0021 0.0007 0.0015 0.0022 0.0019 0.0004 0.0029 0.0098 0.0065 0.0015
323 Printing and related support activities 0.0041 0.0062 0.0000 0.0000 0.0010 0.0019 0.0036 0.0005 0.0031 0.0028 0.0005 0.0040 0.0013 0.0014 0.0030 0.0048 0.0017 0.0045 0.0016 0.0041
324 Petroleum and coal products 0.0008 0.0001 0.0001 0.0004 0.0020 0.0006 0.0029 0.0007 0.0014 0.0392 0.0127 0.0008 0.0009 0.0017 0.0026 0.0012 0.0038 0.0072 0.0045 0.0024
325 Chemical products 0.0002 0.0000 0.0003 0.0010 0.0011 0.0003 0.0051 0.0002 0.0023 0.0048 0.0057 0.0032 0.0305 0.0265 0.0049 0.0016 0.0084 0.0050 0.0015 0.0052
326 Plastics and rubber products 0.0002 0.0002 0.0002 0.0006 0.0031 0.0005 0.0023 0.0006 0.0004 0.0020 0.0022 0.0019 0.0050 0.0084 0.0049 0.0002 0.0010 0.0016 0.0097 0.0073
327 Nonmetallic mineral products 0.0000 0.0000 0.0000 0.0005 0.0007 0.0000 0.0015 0.0001 0.0001 0.0005 0.0014 0.0003 0.0007 0.0005 0.0012 0.0001 0.0007 0.0002 0.0055 0.0019
331 Primary metals 0.0000 0.0000 0.0000 0.0001 0.0014 0.0000 0.0008 0.0000 0.0000 0.0003 0.0020 0.0004 0.0002 0.0001 0.0009 0.0001 0.0014 0.0000 0.0005 0.0014
332 Fabricated metal products 0.0001 0.0000 0.0000 0.0011 0.0030 0.0006 0.0029 0.0014 0.0016 0.0022 0.0151 0.0008 0.0007 0.0007 0.0041 0.0001 0.0015 0.0036 0.0098 0.0064
333 Machinery 0.0000 0.0000 0.0000 0.0005 0.0015 0.0001 0.0013 0.0008 0.0007 0.0035 0.0113 0.0044 0.0002 0.0003 0.0005 0.0001 0.0005 0.0002 0.0019 0.0063
334 Computer and electronic products 0.0019 0.0000 0.0006 0.0001 0.0007 0.0037 0.0047 0.0118 0.0133 0.0033 0.0024 0.0029 0.0038 0.0035 0.0008 0.0002 0.0019 0.0027 0.0013 0.0076
335 Electrical equipment, appliances, and components 0.0001 0.0000 0.0000 0.0002 0.0008 0.0020 0.0018 0.0010 0.0002 0.0014 0.0043 0.0020 0.0000 0.0002 0.0010 0.0001 0.0006 0.0006 0.0029 0.0042
3361MV Motor vehicles, bodies and trailers, and parts 0.0002 0.0000 0.0000 0.0000 0.0016 0.0000 0.0010 0.0000 0.0008 0.0029 0.0114 0.0007 0.0004 0.0002 0.0034 0.0001 0.0003 0.0004 0.0011 0.0341
3364OT Other transportation equipment 0.0000 0.0000 0.0000 0.0000 0.0000 0.0000 0.0003 0.0000 0.0000 0.0000 0.0002 0.0000 0.0000 0.0000 0.0000 0.0000 0.0000 0.0000 0.0000 0.0003
337 Furniture and related products 0.0000 0.0000 0.0000 0.0017 0.0004 0.0000 0.0001 0.0000 0.0000 0.0000 0.0000 0.0000 0.0002 0.0001 0.0006 0.0032 0.0013 0.0000 0.0014 0.0003
339 Miscellaneous manufacturing 0.0002 0.0000 0.0000 0.0000 0.0002 0.0001 0.0012 0.0000 0.0000 0.0014 0.0071 0.0014 0.0220 0.0139 0.0067 0.0003 0.0007 0.0013 0.0008 0.0025
42 Wholesale trade 0.0010 0.0005 0.0002 0.0009 0.0280 0.0014 0.0040 0.0027 0.0042 0.0051 0.0081 0.0117 0.0081 0.0100 0.0116 0.0020 0.0091 0.0084 0.0304 0.0095
44RT Retail trade 0.0001 0.0000 0.0000 0.0015 0.0007 0.0002 0.0003 0.0001 0.0000 0.0009 0.0004 0.0005 0.0009 0.0015 0.0002 0.0026 0.0014 0.0003 0.0042 0.0043
481 Air transportation 0.0025 0.0004 0.0008 0.0002 0.0023 0.0021 0.0035 0.0046 0.0005 0.0043 0.0060 0.0018 0.0018 0.0005 0.0018 0.0011 0.0021 0.0017 0.0020 0.0017
482 Rail transportation 0.0000 0.0000 0.0000 0.0001 0.0001 0.0001 0.0004 0.0001 0.0000 0.0004 0.0002 0.0001 0.0004 0.0004 0.0002 0.0000 0.0002 0.0001 0.0008 0.0002
483 Water transportation 0.0000 0.0000 0.0000 0.0000 0.0000 0.0000 0.0018 0.0000 0.0002 0.0001 0.0000 0.0000 0.0000 0.0000 0.0000 0.0000 0.0000 0.0000 0.0000 0.0000
484 Truck transportation 0.0008 0.0002 0.0000 0.0005 0.0015 0.0005 0.0021 0.0004 0.0055 0.0017 0.0050 0.0013 0.0028 0.0030 0.0030 0.0012 0.0054 0.0018 0.0050 0.0026
485 Transit and ground passenger transportation 0.0007 0.0003 0.0002 0.0001 0.0006 0.0008 0.0012 0.0015 0.0001 0.0015 0.0014 0.0005 0.0006 0.0002 0.0004 0.0025 0.0007 0.0004 0.0006 0.0007
486 Pipeline transportation 0.0000 0.0000 0.0000 0.0000 0.0000 0.0000 0.0000 0.0000 0.0000 0.0000 0.0001 0.0000 0.0000 0.0000 0.0000 0.0000 0.0000 0.0000 0.0000 0.0000
487OS Other transportation and support activities 0.0053 0.0007 0.0000 0.0000 0.0075 0.0022 0.0054 0.0011 0.0001 0.0034 0.0105 0.0022 0.0021 0.0011 0.0027 0.0048 0.0018 0.0015 0.0008 0.0052
493 Warehousing and storage 0.0010 0.0001 0.0000 0.0001 0.0018 0.0005 0.0010 0.0003 0.0000 0.0016 0.0017 0.0002 0.0007 0.0015 0.0009 0.0018 0.0014 0.0015 0.0010 0.0014
511 Publishing industries (includes software) 0.0013 0.0009 0.0005 0.0000 0.0025 0.0020 0.0025 0.0013 0.0025 0.0047 0.0020 0.0093 0.0006 0.0002 0.0025 0.0012 0.0013 0.0016 0.0016 0.0023
512 Motion picture and sound recording industries 0.0000 0.0000 0.0000 0.0000 0.0000 0.0001 0.0029 0.0001 0.0002 0.0002 0.0000 0.0129 0.0001 0.0008 0.0088 0.0026 0.0009 0.0080 0.0030 0.0011
513 Broadcasting and telecommunications 0.0305 0.0055 0.0032 0.0012 0.0090 0.0128 0.0081 0.0318 0.0118 0.0135 0.0051 0.0069 0.0089 0.0049 0.0088 0.0061 0.0109 0.0147 0.0115 0.0087
514 Information and data processing services 0.0271 0.0012 0.0024 0.0002 0.0021 0.0034 0.0045 0.0043 0.0065 0.0092 0.0076 0.0030 0.0011 0.0025 0.0010 0.0021 0.0020 0.0021 0.0034 0.0043
521CI Fed Res banks, credit intermed, & related 0.0457 0.0114 0.0105 0.1166 0.0341 0.0116 0.0157 0.0123 0.0294 0.0145 0.0081 0.0067 0.0110 0.0025 0.0055 0.0055 0.0123 0.0091 0.0072 0.0316
523 Securities, commodity contracts, and investments 0.1412 0.0217 0.4324 0.0003 0.0022 0.0032 0.0033 0.0022 0.0232 0.0040 0.0013 0.0018 0.0021 0.0059 0.0226 0.0064 0.0015 0.0021 0.0012 0.0352
524 Insurance carriers and related activities 0.0205 0.2379 0.0103 0.0187 0.0243 0.0151 0.0117 0.0041 0.0016 0.0155 0.0361 0.0035 0.0292 0.0241 0.0162 0.0237 0.0195 0.0191 0.0140 0.0107
525 Funds, trusts, and other financial vehicles 0.0072 0.0076 0.0000 0.0000 0.0000 0.0009 0.0007 0.0005 0.0000 0.0016 0.0000 0.0000 0.0000 0.0000 0.0000 0.0000 0.0000 0.0000 0.0000 0.0021
531 Real estate 0.0520 0.0091 0.0110 0.0578 0.0388 0.0451 0.0238 0.0546 0.0164 0.0219 0.0120 0.0904 0.0398 0.1104 0.0661 0.0460 0.0465 0.0274 0.0458 0.0475
532RL Rental/leasing svcs & lessors of intangible assets 0.0138 0.0022 0.0001 0.0004 0.0206 0.0082 0.0124 0.0111 0.0327 0.0133 0.0228 0.0082 0.0104 0.0055 0.0054 0.0169 0.0093 0.0203 0.0178 0.0043
5411 Legal services 0.0201 0.0113 0.0126 0.0055 0.0118 0.0086 0.0097 0.0068 0.0172 0.0098 0.0062 0.0028 0.0103 0.0064 0.0059 0.0126 0.0251 0.0093 0.0055 0.0065
5412OP Misc professional, scientific, & technical services 0.0880 0.0219 0.0188 0.0054 0.0513 0.0261 0.0722 0.0422 0.1061 0.0496 0.0328 0.0329 0.0471 0.0284 0.0372 0.0794 0.0617 0.0802 0.0381 0.0395
5415 Computer systems design and related services 0.0237 0.0019 0.0033 0.0011 0.0078 0.0086 0.0104 0.0114 0.0167 0.0102 0.0024 0.0111 0.0036 0.0038 0.0043 0.0014 0.0047 0.0041 0.0026 0.0032
55 Management of companies and enterprises 0.0116 0.0028 0.0008 0.0010 0.0294 0.0068 0.0082 0.0056 0.0000 0.0141 0.0192 0.0015 0.0117 0.0283 0.0076 0.0142 0.0416 0.0284 0.0253 0.0053
561 Administrative and support services 0.0316 0.0153 0.0033 0.0131 0.0294 0.0296 0.0351 0.0291 0.0138 0.0495 0.0340 0.0191 0.0405 0.0333 0.0342 0.0395 0.0225 0.0447 0.0126 0.0271
562 Waste management and remediation services 0.0003 0.0004 0.0000 0.0065 0.0009 0.0002 0.0010 0.0003 0.0004 0.0019 0.1386 0.0025 0.0020 0.0013 0.0038 0.0010 0.0026 0.0079 0.0026 0.0020
61 Educational services 0.0000 0.0000 0.0000 0.0000 0.0000 0.0000 0.0001 0.0002 0.0000 0.0005 0.0000 0.0046 0.0001 0.0002 0.0000 0.0051 0.0010 0.0000 0.0000 0.0031
621 Ambulatory health care services 0.0000 0.0000 0.0000 0.0000 0.0000 0.0000 0.0002 0.0000 0.0000 0.0003 0.0000 0.0000 0.0225 0.0208 0.0000 0.0060 0.0002 0.0000 0.0000 0.0011
622HO Hospitals & nursing/residential care facil ities 0.0000 0.0000 0.0000 0.0000 0.0000 0.0000 0.0000 0.0000 0.0000 0.0000 0.0000 0.0000 0.0000 0.0004 0.0000 0.0000 0.0000 0.0000 0.0000 0.0000
624 Social assistance 0.0000 0.0000 0.0000 0.0000 0.0000 0.0000 0.0000 0.0000 0.0000 0.0000 0.0000 0.0000 0.0000 0.0000 0.0000 0.0000 0.0000 0.0000 0.0000 0.0000
711AS Performing arts, spect. sports, museums, & related 0.0017 0.0002 0.0006 0.0003 0.0011 0.0020 0.0035 0.0015 0.0049 0.0028 0.0018 0.0010 0.0007 0.0005 0.0023 0.1187 0.0094 0.0022 0.0038 0.0031
713 Amusements, gambling, and recreation industries 0.0004 0.0001 0.0001 0.0000 0.0003 0.0005 0.0006 0.0009 0.0012 0.0010 0.0008 0.0004 0.0004 0.0000 0.0003 0.0004 0.0002 0.0008 0.0006 0.0003
721 Accommodation 0.0032 0.0006 0.0011 0.0004 0.0025 0.0032 0.0042 0.0066 0.0008 0.0058 0.0068 0.0021 0.0023 0.0003 0.0018 0.0011 0.0016 0.0023 0.0027 0.0020
722 Food services and drinking places 0.0029 0.0009 0.0035 0.0010 0.0042 0.0064 0.0108 0.0091 0.0048 0.0123 0.0084 0.0038 0.0085 0.0051 0.0073 0.0032 0.0058 0.0201 0.0064 0.0039
81 Other services, except government 0.0085 0.0018 0.0021 0.0063 0.0193 0.0039 0.0087 0.0031 0.0124 0.0127 0.0142 0.0086 0.0086 0.0097 0.0100 0.0117 0.0160 0.0138 0.0088 0.0201
GFG Federal general government 0.0000 0.0000 0.0000 0.0000 0.0000 0.0000 0.0000 0.0000 0.0000 0.0000 0.0000 0.0000 0.0000 0.0000 0.0000 0.0000 0.0000 0.0000 0.0000 0.0000
GFE Federal government enterprises 0.0055 0.0003 0.0000 0.0000 0.0041 0.0016 0.0035 0.0009 0.0006 0.0026 0.0039 0.0044 0.0037 0.0045 0.0019 0.0019 0.0075 0.0129 0.0095 0.0041
GSLG State and local general government 0.0000 0.0000 0.0000 0.0000 0.0000 0.0000 0.0000 0.0000 0.0000 0.0000 0.0000 0.0000 0.0000 0.0000 0.0000 0.0000 0.0000 0.0000 0.0000 0.0000
GSLE State and local government enterprises 0.0002 0.0000 0.0000 0.0002 0.0016 0.0008 0.0007 0.0003 0.0002 0.0010 0.0027 0.0003 0.0011 0.0003 0.0107 0.0004 0.0008 0.0029 0.0010 0.0008
Used Scrap, used and secondhand goods 0.0000 0.0000 0.0000 0.0000 -0.0035 0.0000 0.0000 0.0000 0.0028 0.0000 0.0000 0.0000 0.0001 0.0000 0.0000 -0.0093 0.0022 0.0000 0.0000 0.0014
Other Noncomparable imports, rest-of-the-world adjstmt 0.0436 0.0038 0.0002 0.0000 0.0047 0.0000 0.0016 0.0072 0.0013 0.0011 0.0003 0.0000 0.0000 0.0000 0.0000 0.0006 0.0001 0.0008 0.0002 0.0001
V001 Compensation of employees 0.3866 0.2825 0.1847 0.0322 0.1189 0.3913 0.4153 0.5933 0.5588 0.4885 0.2743 0.5627 0.4776 0.5171 0.5157 0.3239 0.3618 0.3671 0.3667 0.4183
V002 Taxes on production and imports, less subsidies 0.0121 0.0344 0.0260 0.0895 0.0496 0.0371 0.0086 0.0090 0.0310 0.0112 0.0389 0.0328 0.0110 0.0206 0.0079 0.0545 0.1001 0.0754 0.0667 0.0332
V003 Gross operating surplus -0.0044 0.3143 0.2675 0.6111 0.4469 0.3495 0.2578 0.1144 0.0603 0.1348 0.1946 0.0531 0.1535 0.0487 0.1138 0.1772 0.1355 0.1054 0.1106 0.1487
Total 1.0000 1.0000 1.0000 1.0000 1.0000 1.0000 1.0000 1.0000 1.0000 1.0000 1.0000 1.0000 1.0000 1.0000 1.0000 1.0000 1.0000 1.0000 1.0000 1.0000

36
Appendix C Actual and Projected National Employment Growth Rates by Industry
NAICS Industry
Actual
1998-2008
Projected
2008-18
Total employment 0.7 1.0
11 Agriculture, forestry, fishing, and hunting -1.8 -0.4
111 Crop production -1.3 -0.8
112 Animal production -2.6 -0.4
114 Fishing, hunting and trapping -2.0 0.0
115 Support activities for agriculture and forestry 1.2 0.6
Nonagriculture wage and salary 0.9 1.0
21 Mining 2.4 -1.6
211 Oil and gas extraction 1.4 -1.7
212 Mining, except oil and gas -0.7 -0.1
213 Support activities for mining 6.1 -2.6
22 Utilities -0.9 -1.1
23 Construction 1.6 1.7
31-33 Manufacturing -2.6 -0.9
311 Food manufacturing -0.5 0.0
312 Beverage and tobacco product -0.5 -0.9
313 Textile mills -9.8 -6.3
314 Textile product mills -4.5 -4.7
315 Apparel manufacturing -10.8 -7.8
316 Leather and allied product -8.6 -3.7
321 Wood product manufacturing -2.8 -0.8
322 Paper manufacturing -3.3 -2.7
323 Printing and related support activities -3.3 -1.7
324 Petroleum and coal products manufacturing -1.4 -2.5
325 Chemical manufacturing -1.5 -0.7
326 Plastics and rubber products manufacturing -2.5 -0.8
327 Nonmetallic mineral product manufacturing -1.3 0.3
331 Primary metal manufacturing -3.6 -1.0
332 Fabricated metal product manufacturing -1.3 -0.9
333 Machinery manufacturing -2.4 -0.8
334 Computer and electronic product manufacturing -3.8 -2.1
335 Electrical equipment, appliance, and component mfg -3.3 -1.4
336 Transportation equipment manufacturing -2.5 -1.1
337 Furniture and related product manufacturing -2.9 0.6
339 Miscellaneous manufacturing -1.4 1.9
42 Wholesale trade 0.3 0.4
44, 45 Retail trade 0.5 0.4
48, 492, 493 Transportation and warehousing 0.8 0.9
481 Air transportation -1.3 0.7
482 Rail transportation 0.2 0.5
483 Water transportation 2.6 0.3
484 Truck transportation 0.3 1.0
485 Transit and ground passenger transportation 1.4 1.2
486 Pipeline transportation -1.3 -0.9
491 Postal Service -1.6 -1.4
492 Couriers and messengers 0.1 0.2
493 Warehousing and storage 3.6 1.2
Average annual rate of
change

37
Source: U.S. Bureau of Labor Statistics, “Employment Projections.” http://www.bls.gov/emp/#data
NAICS Industry
Actual
1998-2008
Projected
2008-18
51 Information -0.7 0.4
511 Publishing industries -1.1 -0.5
512 Motion picture, video, and sound recording industries 0.3 1.1
515 Broadcasting (except internet) -0.2 0.7
517 Telecommunications -1.3 -0.9
518, 519Data processing, hosting, related services, and other
information services
0.4 3.8
52 Finance and insurance 0.8 0.5
523Securities, commodity contracts, and other financial
investments and related activities
2.2 1.1
524 Insurance carriers and related activities 0.4 0.3
525 Funds, trusts, and other financial vehicles 2.1 1.6
53 Real estate, rental, and leasing 1.0 1.1
531 Real estate 1.5 1.3
532,533 Rental and leasing svcs & lessors of intangible assets -0.1 0.6
533Lessors of nonfinancial intangible assets (except
copyrighted works)
1.1 3.0
54 Professional, scientific, and technical services 2.7 3.0
5411 Legal services 1.3 2.0
5412Accounting, tax preparation, bookkeeping, and payroll
services
1.7 1.9
5413 Architectural, engineering, and related services 2.6 2.0
5414 Specialized design services 1.8 3.8
5415 Computer systems design and related services 4.1 3.8
5416Management, scientific, and technical consulting
services
5.5 6.2
5417 Scientific research and development services 2.5 2.3
5418 Advertising and related services 0.2 0.8
5419 Other professional, scientific, and technical services 3.1 2.0
55 Management of companies and enterprises 0.8 0.5
56Administrative and support and waste management and
remediation services
0.9 1.6
561 Administrative and support services 0.8 1.6
562 Waste management and remediation services 1.9 2.3
61 Education services 3.1 2.4
6112, 6113 Junior colleges, colleges, universities, & prof schools 2.6 1.5
6114-7 Other educational services 5.2 4.5
62 Health care and social assistance 2.6 2.3
621 Ambulatory health care services 3.1 3.1
622 Hospitals, private 1.8 1.1
623 Nursing and residential care facilities 1.9 1.9
624 Social assistance 4.1 2.8
71 Arts, entertainment, and recreation 1.8 1.4
711 Performing arts, spectator sports, & related industries 1.5 1.4
712 Museums, historical sites, and similar institutions 3.1 2.0
713 Amusement, gambling, and recreation industries 1.8 1.4
72 Accomodation and food services 1.8 0.7
721 Accomodation 0.5 0.5
722 Food services and drinking places 2.1 0.7
81 Other services 1.0 1.2
811 Repair and mantenance 0.3 0.5
812 Personal and laundry services 1.0 1.8
814 Private households 0.4 1.2
Federal government 0.0 0.3
State and local government 1.4 0.8
Average annual rate of
change

38
References BerkShares, Inc. “Local Currency for the Berkshire Region.” http://www.berkshares.org/ Blackwell, Melanie; Steven Cobb, and David Weinberg. (2002) “The Economic Impact of Educational
Institutions: Issues and Methodology.” Economic Development Quarterly, v. 16, #1 (February 2002): pp. 88-95.
Bruton, Henry J. “A Reconsideration of Import Substitution.” Journal of Economic Literature, v. 36 (June
1998), pp. 903-936. Business Alliance for Living Local Economies. “About BALLE.” http://www.livingeconomies.org/aboutus. Business Oregon. (2011) “Find Oregon Suppliers”. Part of the Oregon Business Development
Commission. http://www.oregon4biz.com/Grow-Your-Business/Business-services/Find-Oregon-Suppliers/
Cobb, Steven, and David Weinberg. (1993) “The Importance of Import Substitution in Regional
Economic Impact Analysis: Empirical Estimates from Two Cincinnati Area Events”, Economic Development Quarterly, v. 7, #3 (August 1993): pp. 282-286.
Cobb, Steven, and Douglas Olberding. (2007). “The Importance of Import Substitution in Marathon
Economic Impact Analysis.” International Journal of Sport Finance, v. 2, #2, pp. 108-118. Gibbons, Christian. “Economic Gardening.” Business/Industry Affairs Department, City of Littleton, CO.
http://www.littletongov.org/bia/economicgardening/ Gillis, William R. (1987) “Can Service-Producing Industries Provide a Catalyst for Regional Economic
Growth?” Economic Development Quarterly, v. 1, #3 (August 1987): pp. 249-256. Greater Des Moines Partnership. “What is “Buy into the Circle”?”
http://www.buyintothecircle.com/buy_into_the_circle/home.html Greater Omaha Chamber. “Say Yes, Buy O!” http://omahachamber.org/chamber/yes.aspx Greater Omaha Chamber. “2011 Buy the Big O! Show -- Another Business Success.”
http://omahachamber.org/news/NewsDetail.aspx?StoryID=17485. Isserman, Andrew M. and James Westervelt. (2006) “1.5 Million Missing Numbers: Overcoming
Employment Suppression in County Business Patterns Data.” International Regional Science Review, v. 29, #3 (July 2006), 311-335.
Ithaca Hours. “Ithaca Hours Local Currency.” http://www.ithacahours.org/ Jacobs, Jane. (1969) The Economy of Cities. New York: Random House. Kwon, Jinwoo. (2010) Import Substitution at the Regional Level: Application in the United States.
Atlanta: Federal Reserve Bank of Atlanta. Available online at: http://www.frbatlanta.org/documents/news/conferences/10smallbusiness_kwon.pdf
Local First Chicago. “About Local First Chicago.“
http://www.localfirstchicago.org/pages/about_us/10.php. New Economics Institute. “Local Currencies.” http://neweconomicsinstitute.org/content/local-currencies
39
Persky, Joseph; David Ranney and Wim Wiewel. (1993) “Import Substitution and Local Economic
Development.” Economic Development Quarterly, v. 7, #1 (February 1993), pp. 18-29. Streitwieser, Mary L. (2011) Measuring the Nation’s Economy: An Industry Perspective. A Primer on
BEA’s Industry Accounts. Washington, DC: U.S Bureau of Economic Analysis. Revised, May 2011. Thompson, Wilbur R. (1968) A Preface to Urban Economics. Baltimore: Johns Hopkins Press, 1968. U.S. Bureau of Economic Analysis, “Industry Economic Accounts.”
http://www.bea.gov/industry/index.htm. U.S. Bureau of Economic Analysis, “Input-Output Accounts Data.”
http://www.bea.gov/industry/io_annual.htm. U.S. Bureau of Economic Analysis, Regional Economic Accounts. “AMSA04: Advance Metropolitan
Statistical Area Income Summary.” http://www.bea.gov/regional/index.htm.
U.S. Bureau of Economic Analysis, Regional Economic Accounts. “SA1-3: Personal Income Summary.”
http://www.bea.gov/regional/index.htm. U.S. Bureau of Economic Analysis, “Regional Input-Output Modeling System II.”
http://www.bea.gov/regional/rims/ U.S. Bureau of Labor Statistics. “Employment Projections.” http://www.bls.gov/emp/#data. U.S. Bureau of Labor Statistics. “Labor Force Statistics from the Current Population Survey.”
http://www.bls.gov/cps/ U.S. Bureau of Labor Statistics. “Local Area Unemployment Statistics.”
http://www.bls.gov/lau/home.htm. U.S. Census Bureau. (2011A) County Business Patterns: About the Data.
http://www.census.gov/econ/cbp/overview.htm. U.S. Census Bureau. (2011B) County Business Patterns: Introduction.
http://www.census.gov/econ/cbp/intro.htm. U.S. Census Bureau. (2011C) 2009 Nonemployer Statistics. http://censtats.census.gov/cgi-
bin/nonemployer/nonsect.pl. U.S. Census Bureau. (2011D) North American Industry Classification System.
http://www.census.gov/eos/www/naics/. U.S. Department of Agriculture “Community Supported Agriculture.”
http://www.nal.usda.gov/afsic/pubs/csa/csa.shtml.
Recommended