

Bulletin de l’Association aquacole du Canada
2017-2
Vous pouvez recevoir le Bulletin en vous y abonnant pour la somme de 60$ par année ou en devenant membre de l’Association aquacole du Canada (AAC), organisme à but non lucratif. Pour de plus amples renseignements, communiquez avec l’Association aquacole du Canada, 16 Lobster Lane, Saint Andrews (Nouveau-Brunswick), Canada E5B 3T6 [tél.: 506 529-4766; téléc.: 506 529-4609; courriel: [email protected]; site Internet: http://www. aquacultureassociation.ca]. La cotisation s’élève à 100$ par personne (50$ pour les étudiants et les retraités) et 300$ pour les sociétés. Le Bulletin est répertorié dans l’Aquatic Sciences and Fisheries Abstracts (ASFA), et le CAB Abstracts.
ISSN 2369-1603
Dirigeants
Stefanie Colombo, Présidente Joanne Liutkus, Présidente désignée
Matthew Liutkus, Vice-président Tara Daggett, Secrétaire Betty House, Trésorière
Membres du conseil d’administration
Tillmann Benfey, Helen Gurney-Smith, Kim Gill, Greg Gibson, Debbie Plouffe, Bruno Gianasi
Rédactrices du Bulletin Tara Daggett et Helen Gurney-Smith
Bulletin of the Aquaculture Association of Canada
2017-2
The Bulletin is available through subscription ($60 per year) or as a benefit of membership in the Aquaculture Association of Canada, a non-profit charitable organization. For membership information contact: Aquaculture Association of Canada, 16 Lobster Lane, Saint Andrews, N.B., Canada E5B 3T6 [telephone 506 529-4766; fax 506 529-4609; e-mail [email protected]; website http://www. aquacultureassociation.ca]. Annual membership dues are $100 for individuals ($50 for students and seniors) and $300 for companies and associations. The Bulletin is indexed in Aquatic Sciences and Fisheries Abstracts (ASFA), and CAB International.
ISSN 2369-1603
Officers
Stefanie Colombo, President Joanne Liutkus, President-elect
Matthew Liutkus, Vice-president Tara Daggett, Secretary Betty House, Treasurer
Directors
Tillmann Benfey, Helen Gurney-Smith, Kim Gill, Greg Gibson, Debbie Plouffe, Bruno Gianasi
Editors Tara Daggett and Helen Gurney-Smith

i

ii
2017 RESEARCH AWARD OF EXCELLENCE
Réjean Tremblay has been a professor of aquaculture
at the Institut des sciences de la mer (Université du
Québec à Rimouski) since 1999. He is involved in
several research projects with the training of 40 MSc
and PhD students working presently in the production
and the management of aquatic resources. He is co‐
author of 118 scientific papers and 41 technical
reports. By his participation in the administrative
council of several organizations, his experience also
includes development of fish and shellfish farming and
government services. He holds a BSc in biology from
UQAC, an MSc in oceanography from UQAR and a PhD
in biology from Université Laval. He’s a specialist in
ecophysiology applied to aquaculture in shellfish and
fish farming and also in lobster enhancement. His
laboratory participates each year in the AAC meeting by several presentations. He is an active advocate
of communication between researchers and industry to develop strong scientific quality research
programs oriented to technological transfers.
Réjean Tremblay est professeur en aquaculture à l’Institut des sciences de la mer (Université du Québec
à Rimouski), depuis 1999. Il a été impliqué dans plusieurs projets de recherche intégrant la formation
jusqu’à maintenant de 40 étudiants MSc et PhD, qui travaillent dans la production et la gestion des
ressources aquatiques. Il est coauteur de 118 articles scientifiques et 41 rapports techniques. En
participant à différents conseils d’administration, il est impliqué également directement dans le
développement des fermes aquacoles et le service gouvernemental. Il a un BSc en biologie de l’UQAC,
une MSc en océanographie de l’UQAR et un PhD en biologie de l’Université Laval avec une spécialité en
écophysiologie appliquée à l’aquaculture des bivalves et des poissons, mais également sur
l’ensemencement du homard. Il croit fortement à la communication entre chercheurs et aquaculteurs
afin de développer des programmes de recherche de grande qualité scientifique ayant un fort potentiel
de transfert technologique.

iii
2017 STUDENT AWARD RECIPIENTS
2017 Scholarship Recipients
Garth Covernton (University of Victoria)
Xi Xue (Memorial University)
2017 Student Poster Presentation Award
Holly Fisher (Dalhousie University)
2017 Student Oral Presentation Award
Jenny Weitzman (Dalhousie University)

iv
Aquaculture Canada & Sea Farmers Conference
May 29 ‐ 31, 2017
For our annual general meeting in 2017 we partnered with the
Aquaculture Association of Nova Scotia to put on the Aquaculture
Canada / Sea Farmers Tradeshow and Conference at the World
Trade and Convention Center in Halifax, from May 28 to 31. The
Province of Nova Scotia was a presenting sponsor and co‐host of
the event.
Under the theme of “Cultivating Our Future”, we had keynote
presentations from Henry Demone (Chair, High Liner Foods), George Chamberlain (President,
Global Aquaculture Alliance), Linda Sams (Head of Sustainability, Tassal) and Jon Grant (NSERC‐
Cooke Industrial Research Chair in Sustainable Aquaculture, Dalhousie University), as well as 15
technical sessions and a tradeshow with 36 exhibitors. We also tasted seafood products
donated and proudly displayed by Canadian farmers at multiple social venues: the President’s
Reception, the Dr. Joe Brown BBQ and Silent Auction, the AANS‐sponsored Nova Scotia Night,
and our Gala dinner. A total of 405 people registered for the conference, and through
sponsorships, auctions and the sale of raffle tickets, we raised $11,400 for our student
endowment fund to support student awards and scholarships.
Réjean Tremblay (Institut des sciences de la mer, Université du Québec à Rimouski) was
presented with the AAC’s 2017 Research Award of Excellence at our closing Gala dinner.
Congratulations to him, and also to Xi Xue (Memorial University of Newfoundland) and Garth
Covernton (University of Victoria) for receiving AAC student scholarships, and to Jenny
Weitzman and Holly Fisher (both Dalhousie University), for receiving the awards for Best
Student Presentation and Best Student Poster, respectively.
Putting on a conference like this requires a big team, and there was no shortage of people who
helped. I’d like to express my personal thanks in this regard to Joanne Burry (AAC conference
manager), Catriona McLanaghan (AAC office manager), Joanne Liutkus (Program Committee
Chair), and Tom Smith (AANS Executive Director), but in doing so also acknowledge the many
people who contributed their time on organizing committees and as session chairs. I also thank
the many sponsors who contributed seafood or made cash donations to offset our costs. And
finally thanks to Helen Gurney‐Smith (Publications Committee Chair) and Tara Daggett (Bulletin
Editor) for putting this bulletin together.
Tillmann Benfey (AAC President, 2016‐2017)

v
“Cultivating Our Future” Co‐hosted by
We Gratefully Acknowledge Our
Diamond Sponsors
We Gratefully Acknowledge Our
Gold Sponsors
Fisheries and Oceans Canada Skretting
University of Guelph Cooke Aquaculture Marine Harvest Genome Atlantic
Stantec Canadian Aquaculture Industry Alliance
Dalhousie Faculty of Agriculture Dalhousie Faculty of Science
Dalhousie Ocean Frontiers Institute Intrafish

vi
We Gratefully Acknowledge Our
Silver Sponsors
Huntsman Marine Science Centre Realtime Aquaculture
Elanco Aquaculture North America
Hoskin Scientific Pharmaq/Zoetis
Intervet Jefo
Highliner Foods
We Gratefully Acknowledge Our
Bronze Sponsors
Center for Aquaculture Technologies AquaBounty Technologies
Cargill Sweeney International Marine Corp.
Aqua Pharma Silk Stevens
Science Atlantic
We Gratefully Acknowledge Our Product Sponsors
Cooke Aquaculture
Icy Waters Marine Harvest
Innovative Fishery Products
Sober Island Oysters
Scotian Halibut
PEI Mussel King
North River Fish Farms
Mermaid Fare
Eel Lake Oyster Farm
AquaPrime Mussel Ranch
Ocean Trout Farms
vii
Contributed Papers
PRESCRIPTIVE POLICY: A SERVICE PROVIDER’S PERSPECTIVE OF SEDIMENT COLLECTION FOR
ENVIRONMENTAL MONITORING AT MARINE FINFISH FARMS ..................................................................... 1
Janelle Arsenault
SERIAL KNOTS IN MUSSEL CULTURE ROPES INCREASE SPAT COLLECTION AND REDUCE DUCK‐RELATED
MORTALITY ................................................................................................................................................. 10
M. Fréchette and É. Bujold
THE EFFECTS OF DIETARY BUTYRIC ACID ON EARLY JUVENILE STRIPED BASS (Morone saxatilis) FATTY
ACID PROFILES AND ESSENTIAL FATTY ACID CONTENT .............................................................................. 17
L.A. Gillard, J. Duston, W.M. Koven, and A. Bitan

Bull. Aquacul. Assoc. Canada 2017‐2 1
PRESCRIPTIVE POLICY: A SERVICE PROVIDER’S PERSPECTIVE
OF SEDIMENT COLLECTION FOR ENVIRONMENTAL
MONITORING AT MARINE FINFISH FARMS
Janelle Arsenault
Sweeney International Marine Corp., 46 Milltown Blvd., St. Stephen, NB, E3L
1G3, Canada
Abstract
In Atlantic Canada, regulatory agencies have relied on the use of sulphides to
monitor the environmental performance of marine finfish farms. Since the
implementation of the Aquaculture Activities Regulations (AARs) by the
Department of Fisheries and Oceans Canada (DFO) in 2015, harmonization
efforts have been made to align provincial Environmental Monitoring Programs
(EMPs) with the AARs to avoid duplication and standardize methodologies. The
alignment process has resulted in two significant alterations to the provincial
EMPs which include: 1) the incorporation of sample acceptability criteria to the
soft‐bottom protocol and 2) the implementation of a hard‐bottom protocol
which utilizes visual indicators (e.g., bacterial mats) to identify impact.
Additionally, in 2016, provincial EMPs proposed a decision tree to select
sediment sampling devices based on site‐specific conditions (e.g., depth,
current, and substrate type). Given the limited knowledge and practice of the
various samplers listed in the decision tree in Atlantic Canada, marine farms may
inadvertently be classified as hard bottom sites as research remains on‐going for
the establishment of equivalent thresholds of visual indicators with sediment
sulphide concentrations. There is therefore a requirement to re‐evaluate the
inclusion of a decision tree where science advice is limited for site‐specific
conditions in Atlantic Canada.
Introduction
The use of sediment sulphides to monitor environmental performance of marine
finfish farms is accepted and employed in Atlantic Canada. The overall objective

Bull. Aquacul. Assoc. Canada 2017‐2 2
is to retrieve the required volume of undisturbed sediment that is representative
of the benthic environment at each sampling location [New Brunswick
Department of Environment and Local Government (NBDELG), 2016a; Nova
Scotia Department of Fisheries and Aquaculture (NSDFA), 2016a]. There is a
preference to employ the soft‐bottom protocol as correlation between sediment
sulphide concentration and environmental impact is established (NBDELG,
2016b; NSDFA, 2016b). Marine finfish sites were traditionally situated in
sheltered and shallow coves or inlets, categorized as depositional areas, where
sediment samples could easily be collected via the use of divers and core tubes.
However, improvements in marine net pen engineering have enabled marine
finfish producers to establish sites in exposed coastal zones (e.g., erosional
areas) which are generally accompanied by greater depths, coarser substrate
and / or stronger currents. These marine rearing conditions have triggered many
jurisdictions to limit the use of divers and adopt the use of surface‐deployed
equipment as an appropriate method for sediment collection (DAFF, 2008; SEPA,
2008; DFO, 2015; NBDELG, 2016a; NSDFA, 2016a).
To ensure sediment samples collected by surface‐deployed equipment are
representative of benthic conditions, sediment quality guidelines [Environment
Canada, 1994; United States Environmental Protection Agency (U.S. EPA), 2001]
were implemented by NBDELG in 2014 followed by NSDFA and the Department
of Fisheries and Oceans Canada (DFO) in 2015. A decision tree was also included
in the provincial Environmental Monitoring Programs (NBDELG, 2016a; NSDFA,
2016a) in 2016 to assist service providers in choosing an appropriate sampler
that meets the sediment quality guidelines under site specific conditions (e.g.,
depth, current, and substrate type). Although the decision tree remains as
guidance, provincial and federal governing agencies continue to actively discuss
the implementation of the decision tree as a regulatory requirement. This is of
concern due to the limited knowledge on the use, function and performance of
the various samplers in Atlantic Canada. It is also important to note that many of
the sampler options in the decision tree are currently being investigated as part
of an Aquaculture Collaborative Research and Development Program (ACRDP)
project (Page et al., 2015). In the preliminary trials, many of the samplers tested
were found to not operate or collect samples successfully. The inclusion of a
decision tree as a regulatory requirement not only precedes scientific advice, it
also limits the tools available for service providers.
A brief literature review revealed that the same sampler may vary in size, shape,
operation and performance between sources (e.g., manufacturer specifications,
guidance documents). Consequently, an inappropriate sampler may
inadvertently be approved for use and the site falsely categorized as hard
bottom due to the limited success in retrieving acceptable sediment samples.

Bull. Aquacul. Assoc. Canada 2017‐2 3
This is of concern as research remains on‐going for the establishment of
equivalent thresholds of visual indicators (e.g., bacterial mats) to sediment
sulphide concentrations. The main objective of this review was to identify the
differences between the manufacturer specifications, guidance documents, and
the prescribed regulatory requirements of a select group of surface‐deployed
equipment. A secondary purpose of this review was to identify marine finfish
sites incorrectly categorized for bottom type (e.g., soft bottom, mixed bottom or
hard bottom) based on data from 2015 and 2016 environmental monitoring
surveys.
Materials and Methods
For the comparative review, the information collected was compiled based on
the three (3) main sources consulted, which included the following:
1) Supplier specifications (supplier websites, personal communications);
2) Guidance documents (Environment Canada, 1994; Mudroch &
MacKnight, 1994; U.S. EPA, 2001; Environment Canada, 2002);
3) Provincial and Federal regulatory requirements (NBDELG, 2016a; NSDFA,
2016a; DFO, 2017).
The suppliers (i.e., Hoskin, WildCo, Rickly Hydrological, KC Denmark, and OSIL)
were chosen based on local or regular dealers who were used or contacted in
the past (refer to Section 6.0 ‐ References for sourcing information). Although
core‐type devices are known to collect relatively undisturbed and intact
sediment samples, it has been documented that few can successfully operate in
substrates with sand, gravel, clay or till (Environment Canada, 1994) whereas
grab type devices are known to function better in the presence of larger grained
sediments (U.S. EPA, 2001). Core‐type devices were therefore not considered in
this review. Grab type devices, such as Peterson, Smith‐McIntyre, and Shipek
grabs, were also excluded from this review as these devices demonstrate
sampling limitations due to lack of access to the sediment sample for sub‐
sampling or a clamshell pivot which significantly disturbs the sediment‐water
interface. In the end, a total of five (5) sediment samplers were chosen and the
information was compiled in a similar manner as categorized in the provincial
and federal decision trees (i.e., based on depth, currents, and substrate type).
For the field review component, success rates for the collection of undisturbed
sediment samples from environmental monitoring surveys were compared

Bull. Aquacul. Assoc. Canada 2017‐2 4
between 2015 (no decision tree) and 2016 (inclusion of a decision tree) for the
same eight (8) marine finfish sites.
Results
For the comparative review, the manufacturer recommendations in relation to
depth, currents, and substrate type of the five (5) chosen sediment samplers
were assembled. The same type of information was then retrieved from the
guidance documents and compared to the manufacturer specifications as shown
in Table 1. The major difference between the manufacturer specifications and
the guidance documents occurs within the substrate type category. According to
the guidance documents, most of the sediment samplers in this review would
only be suitable in sandy substrates or finer, except for the box corer which
requires a minimum depth of one (1) metre of unconsolidated sediment for the
collection of an undisturbed sediment sample.
Table 1. Comparative review: supplier information vs. guidance documents
It is assumed that the guidance documents were assembled based on extensive
consultations with experts and regular users of surface‐deployed grab samplers,
and as such, the recommendations made by the guidance documents are likely
valid. The recommendations provided by the guidance documents were
accepted then further compared to the same type of information retrieved from
the regulatory requirements (e.g., provincial and federal decision trees) as

Bull. Aquacul. Assoc. Canada 2017‐2 5
shown in Table 2. Once more, the major difference occurred between the
accepted recommendations provided by the guidance documents in comparison
to the regulatory requirements within the substrate type category. In this case,
the same samplers would only be suitable in fine‐grained sediments which
essentially consist of mud.
Table 2. Comparative review: guidance documents vs. regulatory requirements
For the field review, the categorization of the same eight (8) sites were
compared between 2015 and 2016. In 2015, only the sediment quality guidelines
were part of the regulatory requirement and as such, four (4) sites were
analyzed as per the soft‐bottom protocol, one (1) as mixed, and three (3)
followed the hard‐bottom protocol. A total of 45 acceptable sediment samples
were collected. The same eight (8) sites were sampled in 2016 abiding by the
sediment quality guidelines in addition to a decision tree, which resulted in all
eight (8) sites being analyzed as per the hard‐bottom protocol as zero (0)
acceptable samples were retrieved (Table 3).
Table 3. Benthic monitoring protocols followed during environmental
monitoring surveys: 2015 vs. 2016

Bull. Aquacul. Assoc. Canada 2017‐2 6
Figure 1 General classification of substrate types.
Discussion
It is evident from the comparative review that all three (3) sources of
information differ in what is considered ideal conditions for these five (5)
sediment samplers to collect an undisturbed sediment sample. In most cases,
natural benthic conditions are composed of complex mixtures of substrate types
(Fig. 1) and generally exhibit an uneven plane thus potentially altering the
efficacy of the appropriate sampler. Shell debris, naturally occurring or discarded
waste (e.g., scallop and mussel shells) are also generally not included in these
reviews yet should be considered as a significant contributor to the success or
failure of the sampler in question. In addition, the field review has shown that, in
some cases, a sediment sampler chosen based on current regulatory
requirements does not necessarily achieve the overall goal of retrieving the
required volume of undisturbed sediment sample in comparison to previous
years.
Conclusion
Although the sediment quality guidelines are valued as an essential tool to
ensure sediment samples are collected in a consistent and representative
manner of benthic conditions, the decision tree as a regulatory requirement is
viewed as a limiting factor by service providers. It is generally understood that
climatic, oceanographic, and benthic conditions, to name a few, differ between
marine farms, yet it should also be acknowledged that these conditions
significantly differ within the marine farms themselves. As a result, each marine
farm should be evaluated on a case‐by‐case basis which increases the difficulty
Bull. Aquacul. Assoc. Canada 2017‐2 7
in identifying an appropriate sampler based on categorized site conditions as
shown in the current decision tree. Mudroch and MacKnight (1994) recognized
the difficulty in choosing an appropriate sampler without any knowledge of site
conditions and suggested collecting all available information, in addition to
consulting with experienced personnel, for the final choice of an appropriate
sampler. Service providers are, as such, experienced personnel with extensive
knowledge of localized and site‐specific conditions based on repeated visits.
Flexibility should therefore be given within the regulation as to what service
providers deem fit as an appropriate sampling device based on their knowledge
of the marine farm in question.
Rather than restrict the tools available to collect an undisturbed sediment
sample, a set of minimum requirements should be included as part of the
regulations. Environment Canada (2017) has acknowledged new users of
surface‐deployed equipment, including the aquaculture industry, and have thus
confirmed a review of their current guidance document is required. In the
meantime, Environment Canada (1994) published a list of factors for the ideal
sampler that remains applicable to this day. Replacing the prescriptive
requirement of the decision tree, which is restrictive and inefficient, with
Environment Canada’s (1994) minimum set of requirements will allow flexibility
in using various devices and in experimenting with other devices as long as the
sediment‐quality guidelines are achieved. Additionally, this would allow
scientific and regulatory agencies (e.g., Environment Canada, Department of
Fisheries and Oceans Canada) time to synthesize and evaluate applied field data
specific to the aquaculture industry in Atlantic Canada for regulatory analyses.
References
Department of Fisheries and Oceans Canada (DFO), 2017. Aquaculture Activities
Regulations Monitoring Standard Draft: 12 p.
Department of Fisheries and Oceans Canada (DFO), 2015. Aquaculture Activities
Regulations Monitoring Standard (http://www.dfo‐
mpo.gc.ca/aquaculture/management‐gestion/aar‐raa‐eng.htm): 12 p.
Department of Agriculture, Fisheries and Food (DAFF), 2008. Monitoring
Protocol No. 1 for Offshore Finfish Farms. Benthic Monitoring: 8 p.
Environment Canada, 2017. Personal communications. Contacted May 17 2017.

Bull. Aquacul. Assoc. Canada 2017‐2 8
Environment Canada, 2002. Environment Canada, Environmental Protection
Branch, Quebec Region, Technological Innovation and Industrial Sectors Section.
Sediment Sampling Guide for Dredging and Marine Engineering Projects in the
St. Lawrence River, Volume 2, Field Operations Manual: Cat no. En154‐1/2002‐
2E‐1N ISBN 0‐662‐33064‐1 104 p.
Environment Canada, 1994. Ottawa, Canada. Environmental Protection Series,
Guidance Document on Collection and Preparation of Sediments for
Physicochemical Characterization and Biological Testing: Cat no. En49‐24/1‐29E
Report EPS 1/RM/29 170p.
Hoskins Scientific Ltd., 2017. Available at: www.hoskin.ca (Accessed March 31,
2017).
KC Denmark Research Equipment, Available at: www.kc‐denmark.dk (Accessed
April 26, 2017).
New Brunswick Department of Environment and Local Government (NBDELG),
2016a. New Brunswick Department of Environment and Local Government.
Standard Operating Practices for the Environment Monitoring of the Marine
Finfish Cage Aquaculture Industry in New Brunswick: 36 p.
New Brunswick Department of Environment and Local Government (NBDELG),
2016b. New Brunswick Department of Environment and Local Government.
Guidance Document for Environmental Monitoring of the Marine Finfish Cage
Aquaculture Industry in New Brunswick for Mixed Bottom Sites: 1 p.
Nova Scotia Department of Fisheries and Aquaculture (NSDFA), 2016a. Nova
Scotia Department of Fisheries and Aquaculture. Standard Operating Procedures
for the Environmental Monitoring of Marine Aquaculture in Nova Scotia ‐ DRAFT:
40 p.
Nova Scotia Department of Fisheries and Aquaculture (NSDFA), 2016b. Nova
Scotia Department of Fisheries and Aquaculture. Guidance Document for
Environmental Monitoring of Marine Finfish Cage Aquaculture in Nova Scotia for
Mixed Bottom Sites: 1 p.
Mudroch, A. and MacKnight, S. D., 1994. Handbook of Techniques for Aquatic
Sediments Sampling, Second Edition. CRC Press Inc., Florida, United States of
America: 236 p.

Bull. Aquacul. Assoc. Canada 2017‐2 9
OSIL Environment Instruments and Systems, Available at: www.osil.co.uk
(Accessed April 26, 2017).
Page, F., Lyons, M., Scouten, S., MacKeigan, K. and Wong, D., 2015. Examination
of Surface‐Deployed Sediment Sampling Gear. Presentation at Atlantic Canada
Fish Farmers Association Aquaculture Research, Science and Technology Forum,
Huntsman Marine Science Center, St. Andrews, New Brunswick.
Rickly Hydrological Co., Inc., 2017. Available at: www.rickly.com (Accessed April
26, 2017).
SEPA, 2008. Scottish Environment Protection Agency. Monitoring Survey,
Benthic Standard: 13 p.
United States Environmental Protection Agency (US EPA), 2001. Methods for
Collection, Storage and Manipulation of Sediments for Chemical and
Toxicological Analyses Technical Manual. EPA 823‐B‐01‐002 Office of Water,
Washington, United States of America: 208 p.
Wildco, 2017. Available at: www.wildco.com (Accessed March 31, 2017).
Bull. Aquacul. Assoc. Canada 2017‐2 10
SERIAL KNOTS IN MUSSEL CULTURE ROPES INCREASE SPAT
COLLECTION AND REDUCE DUCK‐RELATED MORTALITY
M. Fréchette1* and É. Bujold2
1 R‐D Mytis, 1200 du Sanatorium, Mont‐Joli, QC, G5H 3V9, Canada 2 La Ferme Maricole du Grand Large, 583 boul. Perron, Carleton‐sur‐mer, QC,
G0C 1J0, Canada
* corresponding author: [email protected]
Abstract
Predation by sea ducks is a threat to mussel culture in many sites. Anti‐predator
refuges are required to achieve acceptable survivorship. Loosely knotted spat
collectors exhibit crevices and substrate features that may act as refuges against
ducks. Our experiments tested their efficiency at promoting spat survivorship.
The knots used were the chain sinnet and variants thereof. Two collector setups
were tried, the standard autocollector method used in Cascapédia Bay in 2015
and U‐shaped collectors hanging from long lines in 2016.
In the 2015 experiment, control ropes collected 1.5 times as much as unknotted
controls did. In June 2016, mussel abundance was roughly 10 ‐ 15% of initial
level on knotted ropes but was less than 5% on control ropes. Survivors and spat
smaller than 0.5 cm in spring provided a residual population which grew during
the summer and reached about 1500 individuals per 30.5 cm in October 2016
(versus roughly 400 on control ropes). In the 2016 experiment, the chain sinnet
and its variants collected 2900 and roughly 5900 individuals per 30.5 cm,
respectively, with slight differences between variants. This was a 2‐ to 4‐fold
increase as compared to controls.
Adding serial knots in spat collector ropes increases spat collection, which is
useful wherever spat is in short supply. Survivorship also increased, but to an
uncertain level, as this study is still under way.

Bull. Aquacul. Assoc. Canada 2017‐2 11
Introduction
Predation by sea ducks is a threat to mussel culture in many sites (Dionne et al.,
2006). Various techniques have been developed to reduce duck‐related
mortality. Frightening methods such as boat chasing, sound deterrents, laser
beams, etc., are of limited efficiency in the long term because of bird habituation
(Dionne et al., 2006; Varennes et al., 2013). On the other hand, methods based
on physical exclusion such as protective socking material (Dionne et al., 2006)
and exclusion nets around mussel rafts are highly efficient (Varennes et al.,
2013) but are costly.
High efficiency of deterrent methods is required because total costs of sleeving
is a function of initial sleeving density (among other factors) and spat population
density is adjusted to some desired (low) level to minimize mussel fall‐off as
growth proceeds. Any further reduction is of course detrimental to yield. In
Cascapédia Bay, however, mussel growers use the autocollector technique (also
described as the self‐regulated collector technique; Lachance‐Bernard et al.,
2010). Cascapédia Bay is an open body of water in Baie des Chaleurs, Quebec. It
has large fetch from all directions except from the North. Prevailing wind
direction restricts the amount of time available for work at sea. Therefore,
mussel growers in Cascapédia Bay have developed the autocollector method,
whereby mussel spat is left on the spat collectors – autocollectors – for the
entire production cycle. Because sleeving and population density adjustment are
bypassed, the amount of time devoted at operations at sea is minimal. For a
short summary of the structure and functioning of an autocollector longline, see
Lachance‐Bernard et al. (2010).
According to the autocollector method, initial spat numbers are typically well
above optimal stocking density. In the absence of significant predation by ducks,
population density decreases from high initial levels to lower numbers, about 15
‐ 20% of initial levels, because of mussel fall‐off as individual growth proceeds
(Lachance‐Bernard et al., 2010). Thus, in the absence of predation, competition
entails the loss of a large proportion of mussels anyway. It follows that with
autocollectors anti‐predator strategies need not be highly efficient to be
satisfactory. Assuming that size‐related effects are negligible, only about 20%
survivorship is required. The problem arises because ducks drive down
population density to levels well below the usual 15 ‐ 20% figure.
Our approach to the problem was to take advantage of a natural feature of
mussel population dynamics. In many natural situations, mussel survivorship is
enhanced by crevices and substrate features (Bergeron and Bourget, 1986;
Bertness et al., 2002). We mimicked the effect of crevices by using loosely

Bull. Aquacul. Assoc. Canada 2017‐2 12
Figure 2 Immersion of knotted collectors in 2015 – standard autocollector configuration.
knotted spat collector ropes. Knots provide troughs, hollows and ridges
analogous to roughness elements of a natural substrate. We tested the
hypothesis that hollows and troughs of knots would provide shelter to spat to a
point where survivorship would reach acceptable levels.
Methods
The study site is located in Cascapédia Bay. The knots
tested were the chain sinnet and variants thereof,
which were compared against unknotted controls (Fig.
1). These are serial knots which can be knotted easily
for spat collection and socking, and undone easily at
harvest. The chain sinnet had two loops per 30.5 cm of
knotted collector length. The variants were more
complex configurations, based on the general principle
of the chain sinnet (i.e., serial knots that can be locked
for culture operations and undone when required).
Two suspended culture variants were used, the
standard autocollector method used in Cascapédia Bay
in 2015 and U‐shaped collectors hanging from long
lines in 2016.
Autocollectors were immersed on two replicated
longlines in early July (2015) or late June (2016) and
were sampled after 3.5 months and 11 months to
assess initial conditions and survivorship after duck
migration, respectively. The 2015 longlines were
further sampled in October 2016 and in May 2017. We
sampled 35.5‐cm segments of knotted collectors at
high and low positions along the collectors (two
replicates of each). Mussels smaller than shell length L
= 0.5 cm were not included in samples. Estimates of
survivorship after 11 months were based on the
abundance of L ≥ 1.5 cm mussels.
Bull. Aquacul. Assoc. Canada 2017‐2 13
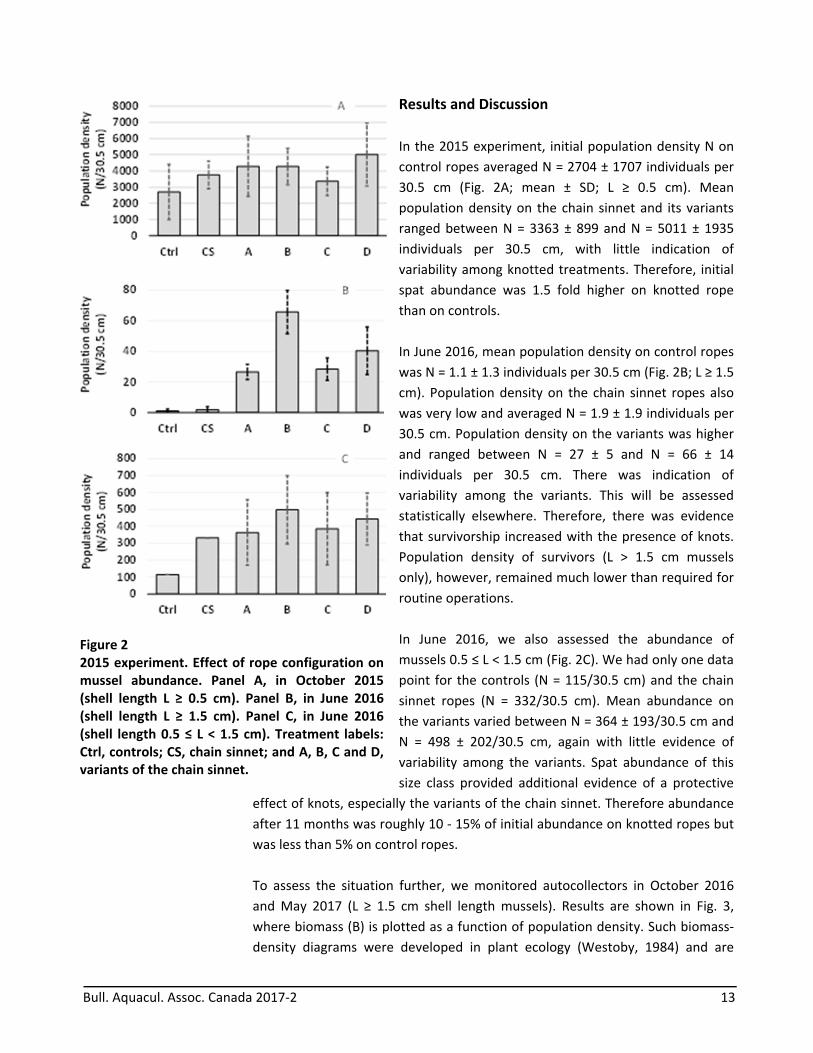
Figure 2 2015 experiment. Effect of rope configuration on mussel abundance. Panel A, in October 2015 (shell length L ≥ 0.5 cm). Panel B, in June 2016 (shell length L ≥ 1.5 cm). Panel C, in June 2016 (shell length 0.5 ≤ L < 1.5 cm). Treatment labels: Ctrl, controls; CS, chain sinnet; and A, B, C and D, variants of the chain sinnet.
Results and Discussion
In the 2015 experiment, initial population density N on
control ropes averaged N = 2704 ± 1707 individuals per
30.5 cm (Fig. 2A; mean ± SD; L ≥ 0.5 cm). Mean
population density on the chain sinnet and its variants
ranged between N = 3363 ± 899 and N = 5011 ± 1935
individuals per 30.5 cm, with little indication of
variability among knotted treatments. Therefore, initial
spat abundance was 1.5 fold higher on knotted rope
than on controls.
In June 2016, mean population density on control ropes
was N = 1.1 ± 1.3 individuals per 30.5 cm (Fig. 2B; L ≥ 1.5
cm). Population density on the chain sinnet ropes also
was very low and averaged N = 1.9 ± 1.9 individuals per
30.5 cm. Population density on the variants was higher
and ranged between N = 27 ± 5 and N = 66 ± 14
individuals per 30.5 cm. There was indication of
variability among the variants. This will be assessed
statistically elsewhere. Therefore, there was evidence
that survivorship increased with the presence of knots.
Population density of survivors (L > 1.5 cm mussels
only), however, remained much lower than required for
routine operations.
In June 2016, we also assessed the abundance of
mussels 0.5 ≤ L < 1.5 cm (Fig. 2C). We had only one data
point for the controls (N = 115/30.5 cm) and the chain
sinnet ropes (N = 332/30.5 cm). Mean abundance on
the variants varied between N = 364 ± 193/30.5 cm and
N = 498 ± 202/30.5 cm, again with little evidence of
variability among the variants. Spat abundance of this
size class provided additional evidence of a protective
effect of knots, especially the variants of the chain sinnet. Therefore abundance
after 11 months was roughly 10 ‐ 15% of initial abundance on knotted ropes but
was less than 5% on control ropes.
To assess the situation further, we monitored autocollectors in October 2016
and May 2017 (L ≥ 1.5 cm shell length mussels). Results are shown in Fig. 3,
where biomass (B) is plotted as a function of population density. Such biomass‐
density diagrams were developed in plant ecology (Westoby, 1984) and are
Bull. Aquacul. Assoc. Canada 2017‐2 14
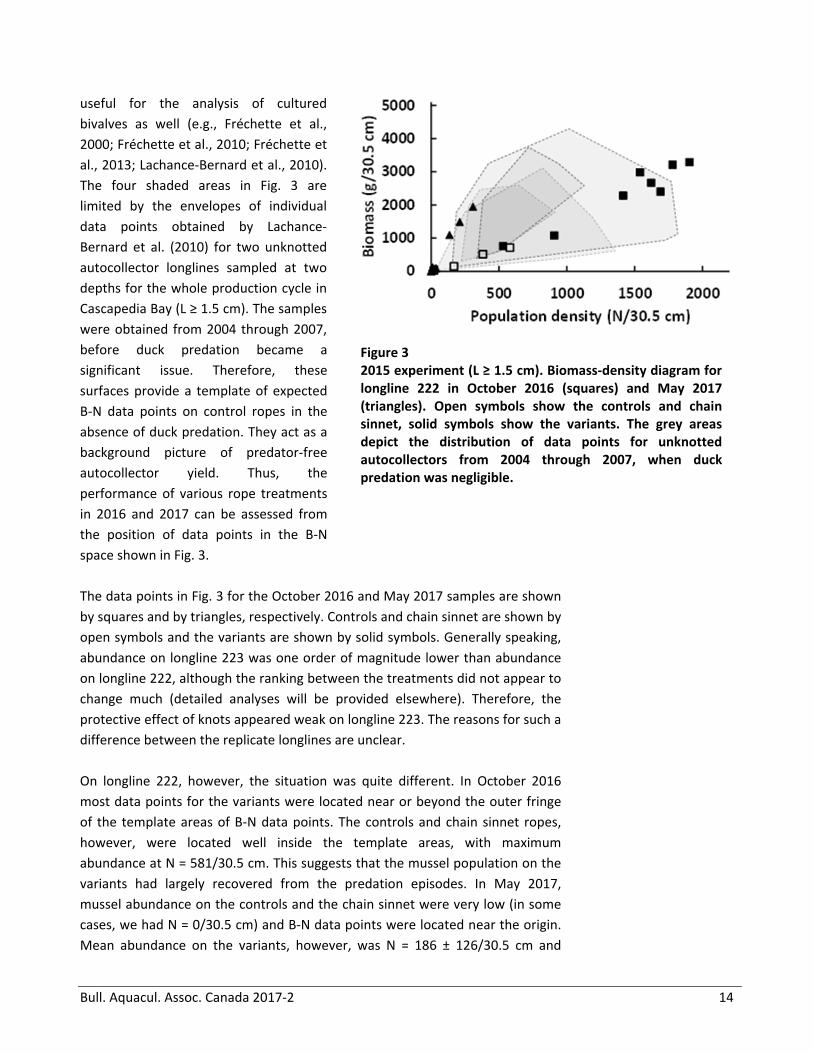
Figure 3 2015 experiment (L ≥ 1.5 cm). Biomass‐density diagram for longline 222 in October 2016 (squares) and May 2017 (triangles). Open symbols show the controls and chain sinnet, solid symbols show the variants. The grey areas depict the distribution of data points for unknotted autocollectors from 2004 through 2007, when duck predation was negligible.
useful for the analysis of cultured
bivalves as well (e.g., Fréchette et al.,
2000; Fréchette et al., 2010; Fréchette et
al., 2013; Lachance‐Bernard et al., 2010).
The four shaded areas in Fig. 3 are
limited by the envelopes of individual
data points obtained by Lachance‐
Bernard et al. (2010) for two unknotted
autocollector longlines sampled at two
depths for the whole production cycle in
Cascapedia Bay (L ≥ 1.5 cm). The samples
were obtained from 2004 through 2007,
before duck predation became a
significant issue. Therefore, these
surfaces provide a template of expected
B‐N data points on control ropes in the
absence of duck predation. They act as a
background picture of predator‐free
autocollector yield. Thus, the
performance of various rope treatments
in 2016 and 2017 can be assessed from
the position of data points in the B‐N
space shown in Fig. 3.
The data points in Fig. 3 for the October 2016 and May 2017 samples are shown
by squares and by triangles, respectively. Controls and chain sinnet are shown by
open symbols and the variants are shown by solid symbols. Generally speaking,
abundance on longline 223 was one order of magnitude lower than abundance
on longline 222, although the ranking between the treatments did not appear to
change much (detailed analyses will be provided elsewhere). Therefore, the
protective effect of knots appeared weak on longline 223. The reasons for such a
difference between the replicate longlines are unclear.
On longline 222, however, the situation was quite different. In October 2016
most data points for the variants were located near or beyond the outer fringe
of the template areas of B‐N data points. The controls and chain sinnet ropes,
however, were located well inside the template areas, with maximum
abundance at N = 581/30.5 cm. This suggests that the mussel population on the
variants had largely recovered from the predation episodes. In May 2017,
mussel abundance on the controls and the chain sinnet were very low (in some
cases, we had N = 0/30.5 cm) and B‐N data points were located near the origin.
Mean abundance on the variants, however, was N = 186 ± 126/30.5 cm and

Bull. Aquacul. Assoc. Canada 2017‐2 15
Figure 4 2016 experiment. Effect of rope configuration on initial mussel abundance. Treatment labels: Ctrl, controls; CS, chain sinnet; and A, B, C, D, E and F, variants of the chain sinnet.
most B‐N data points were located
near the upper limit of the template
areas. This suggests that mortality
was significant during the second
winter of the production cycle but
that knots provided a reasonable
level of protection and that mean
mussel size was not negatively
affected by predation.
In the 2016 experiment, control
ropes collected about 1300
individual spat per 30.5 cm. The
chain sinnet and its variants
collected 2900 and roughly 5900
individuals per 30.5 cm, respectively,
with slight differences between
variants (Fig. 4). This is a 2‐ to 4‐fold
increase as compared to controls.
Conclusion
Adding serial knots in spat collector ropes increases spat collection, which is
useful wherever spat is in short supply. Survivorship also increases, thus
providing a potential method for reducing duck predation. The evidence
presently available suggests, however, that the level of protection provided by
knots varies among longlines.
Acknowledgments
We wish to thank Benoit Bujold, Simon Bujold, William Bujold, Clément Durette
and S. Alexandre Leblanc for assistance with operations at sea.
References
Bergeron, P. and Bourget, E., 1986. Shore topography and spatial partitioning of
crevice refuges by sessile epibenthos in an ice disturbed environment. Mar. Ecol.
Prog. Ser. 28: 129‐145.
Bull. Aquacul. Assoc. Canada 2017‐2 16
Bertness, M.D., Trussell, G.C., Ewanchuk, P.J. and Silliman, B.R., 2002. Do
alternate stable community states exist in the Gulf of Maine rocky intertidal
zone? Ecology 83: 3434‐3448.
Dionne, M., Lauzon‐Guay, J.‐S., Hamilton, D.J. and Barbeau, M., 2006. Protective
socking material for cultivated mussels: a potential non‐disruptive deterrent to
reduce losses to diving ducks. Aquacult. Internat. 14: 595‐613.
Fréchette, M., Gaudet, M. and Vigneau, S., 2000. Estimating optimal population
density for intermediate culture of scallops in spat collector bags. Aquaculture
183: 105‐124.
Fréchette, M., Lachance‐Bernard, M. and Daigle, G., 2010. Body size, population
density and factors regulating suspension‐cultured blue mussel (Mytilus spp.)
populations. Aquat. Living Resour. 23: 247‐254.
Fréchette, M., Urquiza, J.M., Daigle, G., Maheux, D. and Dumais, J.‐F., 2013. Self‐
thinning dynamics in experimental scallop populations. Aquacult. Internat. 21:
539‐551.
Lachance‐Bernard, M., Himmelman, J.H., Daigle, G. and Fréchette, M., 2010.
Biomass‐density relationships and self‐thinning of blue mussels (Mytilus spp.)
reared on self‐regulated long lines. Aquaculture 308 : 34‐43.
Varennes, É., Hanssen, S.A., Bonardelli, J. and Guillemette, M., 2013. Sea duck
predation in mussel farms: the best nets for excluding common eiders safely and
efficiently. Aquacult. Environ. Interact. 4: 31‐39.
Westoby, M., 1984. The self‐thinning rule. Adv. Ecol. Res. 14: 167‐225.

Bull. Aquacul. Assoc. Canada 2017‐2 17
THE EFFECTS OF DIETARY BUTYRIC ACID ON EARLY JUVENILE
STRIPED BASS (Morone saxatilis) FATTY ACID PROFILES AND
ESSENTIAL FATTY ACID CONTENT
L.A. Gillard*1, J. Duston1, W.M. Koven2, and A. Bitan2 1 Haley Institute of Animal Science and Aquaculture, Dalhousie University,
Faculty of Agriculture, 58 Sipu Awti, Bible Hill, Nova Scotia, B2N 4H5, Canada 2 Israeli Oceanographic and Limnological Research, National Centre for
Mariculture, Eilat, POB 1212, Eilat 88112, Israel
*Corresponding Author: [email protected]
Abstract
Diversification of the Canadian aquaculture industry is important to sustain
production that will reflect the rising global population. First, larvae must
overcome a production bottleneck that currently plagues their most‐vulnerable
life stage, resulting in high mortality and low yields of market‐sized adults.
Essential fatty acids (EFAs) are paramount to the growth and development of
embryos and larvae. Deficiencies in EFAs result in developmental deformities in
organs such as the brain and eyes, leading to high mortality and poor survival.
BA is a short‐chain fatty acid linked to significant improvements in growth
factors of finfish, as well as increasing EFAs in human colon cells. In this
experiment, early juvenile striped bass were weaned at 39 days post hatch onto
an extruded pellet (0.6 mm) containing either 0.0, 0.5, or 1.0% butyric acid (BA),
and fed for 10 days. Total fats, docosahexaenoic acid (DHA), oleic acid (OA) and
linoleic acid (LA) (mg/g) in early juveniles consuming 1.0% BA were significantly
greater after 10 days compared to the control (0.0%) (p < 0.05).
Eicosapentaenoic acid (EPA) content was significantly greater in the 1.0% BA
treatment. Arachidonic acid (ArA) content remained constant throughout the
experiment and the treatment groups. Dietary butyric acid has positive
implications for the aquaculture industry, such as a complete fatty‐acid profile,
and an increase in certain EFAs during crucial developmental life stages of
economically viable fish.
Bull. Aquacul. Assoc. Canada 2017‐2 18
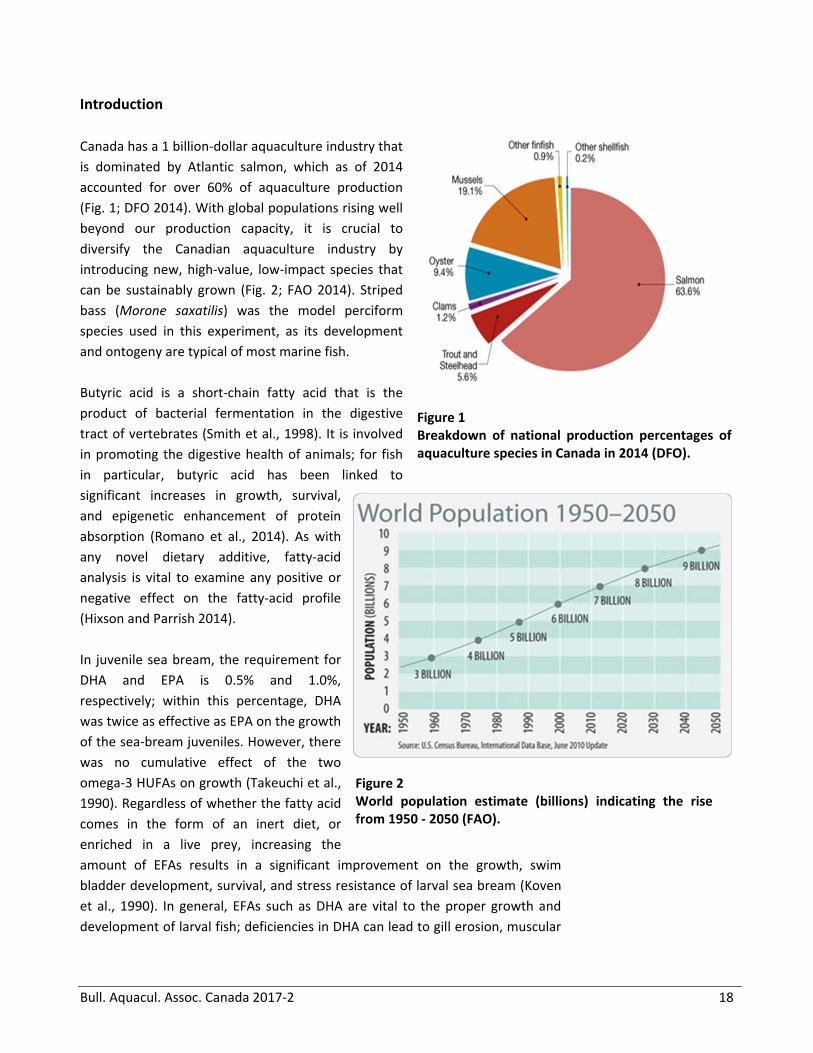
Figure 1 Breakdown of national production percentages of aquaculture species in Canada in 2014 (DFO).
Figure 2 World population estimate (billions) indicating the rise from 1950 ‐ 2050 (FAO).
Introduction
Canada has a 1 billion‐dollar aquaculture industry that
is dominated by Atlantic salmon, which as of 2014
accounted for over 60% of aquaculture production
(Fig. 1; DFO 2014). With global populations rising well
beyond our production capacity, it is crucial to
diversify the Canadian aquaculture industry by
introducing new, high‐value, low‐impact species that
can be sustainably grown (Fig. 2; FAO 2014). Striped
bass (Morone saxatilis) was the model perciform
species used in this experiment, as its development
and ontogeny are typical of most marine fish.
Butyric acid is a short‐chain fatty acid that is the
product of bacterial fermentation in the digestive
tract of vertebrates (Smith et al., 1998). It is involved
in promoting the digestive health of animals; for fish
in particular, butyric acid has been linked to
significant increases in growth, survival,
and epigenetic enhancement of protein
absorption (Romano et al., 2014). As with
any novel dietary additive, fatty‐acid
analysis is vital to examine any positive or
negative effect on the fatty‐acid profile
(Hixson and Parrish 2014).
In juvenile sea bream, the requirement for
DHA and EPA is 0.5% and 1.0%,
respectively; within this percentage, DHA
was twice as effective as EPA on the growth
of the sea‐bream juveniles. However, there
was no cumulative effect of the two
omega‐3 HUFAs on growth (Takeuchi et al.,
1990). Regardless of whether the fatty acid
comes in the form of an inert diet, or
enriched in a live prey, increasing the
amount of EFAs results in a significant improvement on the growth, swim
bladder development, survival, and stress resistance of larval sea bream (Koven
et al., 1990). In general, EFAs such as DHA are vital to the proper growth and
development of larval fish; deficiencies in DHA can lead to gill erosion, muscular

Bull. Aquacul. Assoc. Canada 2017‐2 19
dystrophy, poor brain and eye development, and impaired behaviours such as
predation and schooling (Mourente, 2003; Bénitez et al., 2007).
In the past, DHA and EPA were preferentially used in fish nutrition experiments
due to their prevalence in fish tissues, which led to a tendency to view them as
the more important EFAs. Although both DHA and EPA are EFAs, ArA is
ubiquitous and essential in its role as the primary eicosanoid precursor,
regardless of the amount of EPA present in fish tissue (Bell & Sargent, 2003). ArA
is an omega‐6 EFA, so its presence in the diet will have different implications
than DHA and EPA, the omega‐3 EFAs. Nevertheless, ArA is irreplaceable in the
diet of marine finfish, especially at younger, more vulnerable stages. Newly
hatched larvae are delicate in many ways: in their environment, in their unique
nutritional demands, and also in their small, fragile nature that leaves them
exposed to stress and mortality due to handling. Larval sea bream (5 ‐ 40 days
post hatch) were given rotifers enriched with either ArA or DHA and then an
Algamac diet, were transported to grow‐out tanks, and then measured to see
which treatment resulted in the highest mortality (Koven et al., 2001). The
ArA/Algamac treatment group experienced significantly greater survival than
DHA/Algamac group when fed prior to the transportation (Koven et al., 2001).
A similar study was conducted to determine if ArA has an effect on the survival
of gilthead sea bream larvae, as well as the stress response due to handling and
the associated salinity changes (Koven et al., 2003). The authors also included
different age ranges of the larvae to determine if the previous results were only
applicable to certain larval stages, or if they could also be applicable to juvenile
and adult sea bream (Koven et al., 2003). The age groups included larvae,
between 3 ‐ 19 days post hatch, 20 ‐ 30 day‐old premetamorphosing larvae, and
30 ‐ 42 day‐old metamorphosing larvae (Koven et al., 2003). In sea bream and
summer flounder (Paralichthys dentatus), ArA improved the growth, survival and
resiliency to stress, and when present between 0 ‐ 25% of total fatty acids of the
diet, ArA increased the cortisol levels under osmotic stress (Koven et al., 2003;
Willet et al., 2003; Van Anholt et al., 2004).
Different species have different requirements, and developmental stages will
dictate these requirements. Although fatty acids in hybrid striped bass have
been studied, it remains necessary to understand how the profile will change
with the addition of a short‐chain fatty acid such as BA at the early juvenile
stage. Since it is currently unknown how varied amounts of BA in the diet of
striped bass will affect the fatty‐acid profile of the juveniles, the present
experiment examines not only the effect of the BA treatment, but also the effect
of time. The results will indicate how EFAs and ratios will change over the ten‐
day trial, between the three treatment groups of 0.0%, 0.5%, and 1.0% BA.

Bull. Aquacul. Assoc. Canada 2017‐2 20
Materials and Methods
The trial ran for ten days, with striped bass that were 39 days post hatch. There
were a total of 9 tanks; 3 replicate tanks for each of the 3 diets (0.0% BA, 0.5%
BA, and 1.0% BA). The tanks were cleaned and siphoned twice per day, during
which time the number of mortalities were counted and recorded while being
removed from the tanks.
The volume of the black tanks was 155 L, and they were 27 cm in diameter. Each
tank was stocked with 200 early juveniles. The tanks were on a flow‐through
system and the temperature and salinity were monitored twice per day and
were held constant at 20°C and 22 parts per thousand (ppt), respectively. All
tanks received 24‐hour light at a constant intensity of 20 lux. Vibratory feeders
were programmed to dispense meals every two hours for 24 hours a day,
alternating with hand feeding took place every 2 hours between 06:00 and 20:00
for the entire trial.
Sampling for fatty acids was done on day 0 of the trial, and then on the final day
(day 10) of the trial. No less than 200 mg of wet weight in whole fish were
sampled on these days and kept frozen at ‐80°C until freeze drying
(lyophilization). Freeze‐dried samples were stored in 50% nitric‐acid‐rinsed vials
with Teflon caps, in freeze‐dried form for fatty‐acid analysis and profiling. These
samples were transported to the National Centre for Mariculture in Eilat, Israel,
for fatty‐acid extraction and analysis.
A series of steps and protocols were then followed (Table 1) in order to properly
extract the fatty acids and prepare the samples for analysis via gas
chromatography and mass spectrophotometry (GC/MS). Once the samples were
analyzed and the data was organized into a spreadsheet, a one‐way analysis of
variance was used to determine any statistical significance between the
variations of fatty‐acid content. A Tukey post hoc test was then conducted to
analyze the significance between the treatments to determine if 0.5% was
significantly different from 1.0%.

Bull. Aquacul. Assoc. Canada 2017‐2 21
Table 1. Protocol for fatty acid extraction and analysis on experimental striped
bass samples at the start of the trial (39 dph) and after ten days of treatment
(0.0%, 0.5%, or 1.0% butyric acid) (49 dph).
1. Freeze dry the sample overnight
2. Weigh 10 ‐ 20 mg of dry weight (DW) of the sample into a 10‐mL tube
3. Add 6 mL of extraction solution (chloroform + methanol 2:1, + 0.01%
butylated hydroxytoluene (BHT)) to the tube
4. Homogenize the sample with an ultrasonic electrode on crushed ice for
2 minutes
5. Filter the homogenized sample into a pre‐weighed 10‐mL tube (filter No.
2 Wattman)
6. Add 2 mL of 0.08% potassium chloride (KCl) to the tube
7. Centrifuge the tube at 4°C overnight
8. Remove the upper phase and wash 3 times with the upper phase
solution (chloroform + methanol + distilled water (3:48:47). Be careful
not to remove the lower phase, as it contains the lipids
9. Evaporate at 50°C under nitrogen
10. Weigh the preweighed tube and calculate the percentage of total lipid
content based on the difference in tube weight
11. Add 0.1 mg of standard (17:0) to the tube
12. Vortex for 10 seconds
13. Add 1.0 mL of boron trifluoride (BF3, 14%) for every 1 mg of lipid
14. Vortex for 10 seconds
15. Fill the tube with nitrogen and put the cover on
16. Place the tube in an ultrasonic bath at 50°C for 1 hour
17. Take the sample out of the bath and wait 5 ‐ 10 minutes until the sample
is at room temperature
18. Add 0.5 mL of distilled water
19. Add 1 mL of hexane for gas chromatography (GC) for every 1 mg of lipid
20. Vortex for 10 seconds
21. Centrifuge the tube for 2 minutes at 2300 revolutions per minute (rpm)
22. Remove the upper phase and place into GC bottle
23. Store at ‐20°C until injection of the sample into the GC
24. Inject the sample into the GC
25. Organize GC/MS output into an excel spreadsheet

Bull. Aquacul. Assoc. Canada 2017‐2 22
Figure 3 Mean concentration of total fats (mg/g dry weight of fish) of 39‐day‐old striped‐bass early juveniles, with standard error, after ten days of receiving 0.0% BA, 0.5% BA, or 1.0% BA. Different letter groupings indicate significant differences between treatments.
Results
The fatty‐acid profiling of the striped‐bass early juveniles
revealed that the mean percentage of total fatty acids
(mg/g of dry weight) after the ten‐day feeding trial was
significantly greater in the tanks consuming 1.0% dietary
BA, compared to the 0.5% treatment and the control
(0.0%) (p = 0.038) (Fig. 3). The control treatment and the
0.5% BA treatment were not significantly different from
one another after ten days (Fig. 3). The 1.0% BA treatment
resulted in greater mean percentage of fatty acids present
after the ten‐day trial than the other treatments (Fig. 3).
After 10 days of feeding altered butyric acid diets, there
were statistically significant differences in lipid
concentrations in fish tissue (p < 0.05), with post‐hoc
Tukey analysis revealing a significant increase in total fats
in fish fed 1.0% diets compared to 0.5% and control (0%)
diets (Fig. 3). A diet containing 0.5% butyric acid did not
increase total fats in fish tissue, with no difference
observed compared to controls.
The mean percentage of docosahexaenoic acid (DHA) present was significantly
greater in the 1.0% BA treatment than any other treatment (p = 0.028) (Fig. 4).
Similarly, the mean percentage of EPA was significantly greater in the 1.0% BA
treatment than in the 0.5% treatment (Fig. 4). Arachidonic acid (ArA) and linoleic
acid (LA) were the two omega‐6 fatty acids of interest that were analyzed and
profiled. The mean percentage of ArA was highest at the end of the ten‐day trial
for the 1.0% BA treatment, and remained consistent between the other
treatments, although these differences were not found to be significant (p >
0.05) (Fig. 4). The mean percentage of linoleic acid was also highest after ten
days for the 1.0% BA treatment; however, this difference was statistically
significant (p = 0.001) (Fig. 5). The results for oleic acid (OA) were similar to LA,
as the mean percentage of OA was significantly greatest when the striped bass
consumed 1.0% BA for ten days compared to the control (0.0%) and 0.5% BA
(Fig. 5).
Bull. Aquacul. Assoc. Canada 2017‐2 23
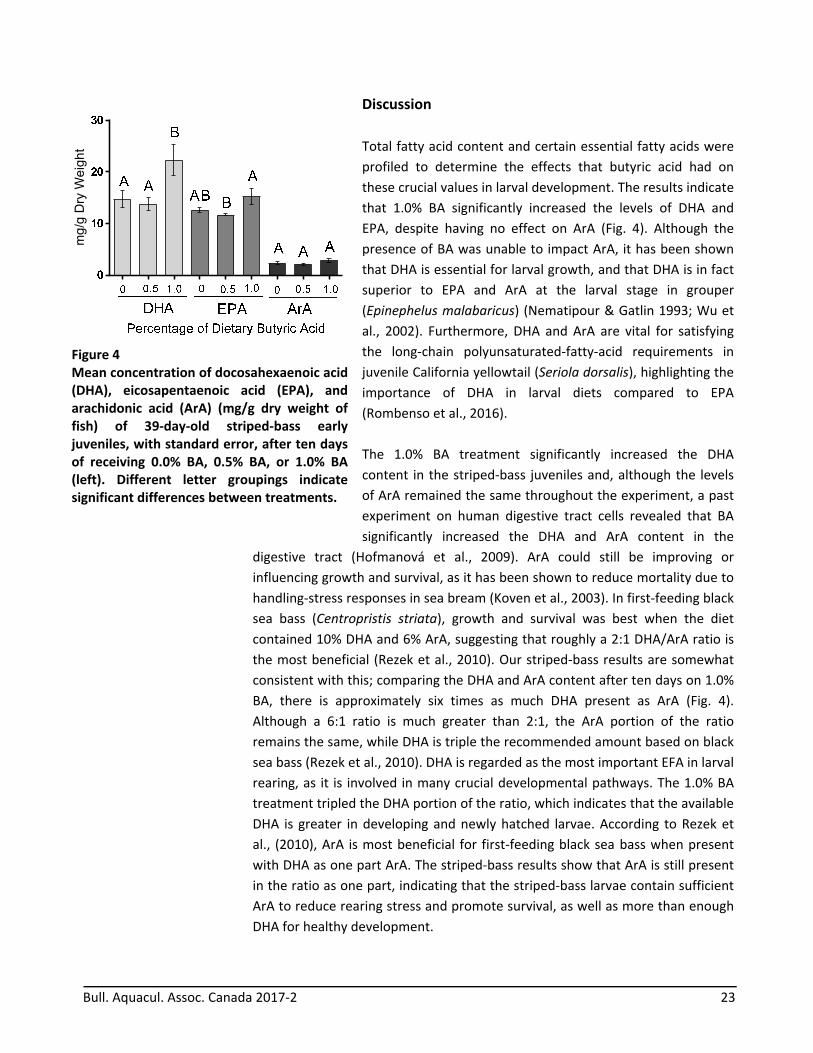
Figure 4 Mean concentration of docosahexaenoic acid (DHA), eicosapentaenoic acid (EPA), and arachidonic acid (ArA) (mg/g dry weight of fish) of 39‐day‐old striped‐bass early juveniles, with standard error, after ten days of receiving 0.0% BA, 0.5% BA, or 1.0% BA (left). Different letter groupings indicate significant differences between treatments.
Discussion
Total fatty acid content and certain essential fatty acids were
profiled to determine the effects that butyric acid had on
these crucial values in larval development. The results indicate
that 1.0% BA significantly increased the levels of DHA and
EPA, despite having no effect on ArA (Fig. 4). Although the
presence of BA was unable to impact ArA, it has been shown
that DHA is essential for larval growth, and that DHA is in fact
superior to EPA and ArA at the larval stage in grouper
(Epinephelus malabaricus) (Nematipour & Gatlin 1993; Wu et
al., 2002). Furthermore, DHA and ArA are vital for satisfying
the long‐chain polyunsaturated‐fatty‐acid requirements in
juvenile California yellowtail (Seriola dorsalis), highlighting the
importance of DHA in larval diets compared to EPA
(Rombenso et al., 2016).
The 1.0% BA treatment significantly increased the DHA
content in the striped‐bass juveniles and, although the levels
of ArA remained the same throughout the experiment, a past
experiment on human digestive tract cells revealed that BA
significantly increased the DHA and ArA content in the
digestive tract (Hofmanová et al., 2009). ArA could still be improving or
influencing growth and survival, as it has been shown to reduce mortality due to
handling‐stress responses in sea bream (Koven et al., 2003). In first‐feeding black
sea bass (Centropristis striata), growth and survival was best when the diet
contained 10% DHA and 6% ArA, suggesting that roughly a 2:1 DHA/ArA ratio is
the most beneficial (Rezek et al., 2010). Our striped‐bass results are somewhat
consistent with this; comparing the DHA and ArA content after ten days on 1.0%
BA, there is approximately six times as much DHA present as ArA (Fig. 4).
Although a 6:1 ratio is much greater than 2:1, the ArA portion of the ratio
remains the same, while DHA is triple the recommended amount based on black
sea bass (Rezek et al., 2010). DHA is regarded as the most important EFA in larval
rearing, as it is involved in many crucial developmental pathways. The 1.0% BA
treatment tripled the DHA portion of the ratio, which indicates that the available
DHA is greater in developing and newly hatched larvae. According to Rezek et
al., (2010), ArA is most beneficial for first‐feeding black sea bass when present
with DHA as one part ArA. The striped‐bass results show that ArA is still present
in the ratio as one part, indicating that the striped‐bass larvae contain sufficient
ArA to reduce rearing stress and promote survival, as well as more than enough
DHA for healthy development.
mg
/g D
ry W
eig
ht

Bull. Aquacul. Assoc. Canada 2017‐2 24
Figure 5 Mean concentration of oleic acid and linoleic acid (mg/g dry weight of fish) of 39‐day‐old striped‐bass early juveniles, with standard error, after ten days of receiving 0.0% BA, 0.5% BA, or 1.0% BA. Different letter groupings indicate significant differences between treatments.
To emphasize the necessity for DHA in larvae,
Senegalese sole (Solea senegalensis) larvae were
weaned onto a first‐feeding DHA‐deficient diet, as it
has been thought that they can biosynthesize DHA from
its precursors (Pinto et al., 2016). The results indicate
that with low, total, fatty‐acid and DHA content in the
early larval diets, the growth performance of sole
significantly decreased compared to individuals with
normal levels (Pinto et al., 2016). DHA can also be used
preferentially over EPA during periods of compensatory
growth and nutrient deficiency in the larval stage (Wu
et al., 2002), so an increase in DHA is a particularly
important result from this experiment. This preferential
metabolism is also noted for both OA and LA in
Greenland halibut (Reinhardtius hippoglossoides) eggs
during embryogenesis (Mejri et al., 2017); therefore, a
significant increase in OA and LA as seen in this striped‐
bass experiment has a meaningful impact on larval
fatty‐acid requirements in aquaculture.
Overall, dietary butyric acid has not elicited negative effects on the fatty‐acid
profile of early juvenile striped bass, and for DHA, OA, and LA, it has significantly
increased the whole body content. Since these EFAs are linked to larval and
juvenile growth and survival via proper neural development, 1.0% dietary butyric
acid is beneficial as a potential novel metabolite in the husbandry of aquaculture
species. Increasing the growth, survival, total fat content, and levels of EFAs will
have positive implications for the aquaculture industry and promote the
diversification of species that the industry needs to expand and satisfy the
growing global population.
Acknowledgements
I would like to acknowledge the Aquaculture Centre staff, Paul MacIsaac, Audrie‐
Jo McConkey, and Scott Jeffrey, as well as Oriya Nixon of the National Centre for
Mariculture, who were invaluable to this project.
References
Bell, J.G., and Sargent, J.R., 2003. Arachidonic acid in aquaculture feeds: current
status and future opportunities. Aquaculture 218: 491‐499.

Bull. Aquacul. Assoc. Canada 2017‐2 25
Benítez‐Santana, T., Masuda, R., Juárez Carrillo, E., Ganuza, E., Valencia, A.,
Hernández‐Cruz, C.M. and Izquierdo, M.S., 2007. Dietary n‐3 HUFA deficiency
induces a reduced visual response in gilthead seabream Sparus aurata larvae.
Aquaculture. 264: 408‐417.
DFO – Department of Fisheries and Oceans Canada, 2014. Aquaculture
development strategy 2016 ‐ 2019. Canadian Council of Fisheries and
Aquaculture Ministers.
FAO ‐ Food and Agriculture Organization of the United Nations, 2014. The state
of world fisheries and aquaculture 2014. Rome. 223 pp.
Hixson, S.M. and Parrish, C.C., 2014. Substitution of fish oil with camelina oil and
inclusion of camelina meal in diets fed to Atlantic cod (Gadus morhua) and their
effects on growth, tissue lipid classes, and fatty acids. Journal of Animal Science
92: 1055‐1067.
Koven, W.M., Tandler, A., Kissil, G.W.M., Sklan, D., Friezlander, O. and Harel, M.,
1990. The effect of dietary (n−3) polyunsaturated fa y acids on growth, survival
and swim bladder development in Sparus aurata larvae. Aquaculture 91: 131‐
141.
Koven, W., Barr, Y., Lutzky, S., Ben‐Atia, I., Weiss, R., Harel, M., Behrens, P. and
Tandler, A., 2001. The effect of dietary arachidonic acid (20:4n−6) on growth,
survival and resistance to handling stress in gilthead seabream (Sparus aurata)
larvae. Aquaculture 193: 107‐122.
Koven, W., Van Anholt, R., Lutzky, S., Ben Atia., I., Nixon, O., Ron, B. and Tandler,
A., 2003. The effect of dietary arachidonic acid on growth, survival, and cortisol
levels in different age gilthead seabream larvae (Sparus aurata) exposed to
handling or daily salinity change. Aquaculture 228: 307‐320.
Mejri, S., Tremblay, R., Lambert, Y. and Audet, C., 2017. Assessing fatty acid
remodelling during embryogenesis in Greenland halibut (Reinhardtius
hippoglossoides) exposed to hypoxia. Marine Biology 164: 1‐9.
Mourente, G., 2003. Accumulation of DHA (docosahexaenoic acid; 22:6n‐3) in
larval and juvenile fish brain. The Big Fish Bang: Proceedings of the 26th Annual
Larval Fish Conference. Institute of Marine Research: 239‐248

Bull. Aquacul. Assoc. Canada 2017‐2 26
Nematipour, G. R. and Gatlin, D. M., 1993. Requirement of hybrid striped bass
for dietary (n‐3) highly unsaturated fatty acids. The Journal of Nutrition 123:
744‐753.
Pinto, W., Engrola, S., Santos, A., Bandarra, N.M., Diaz, J. and Conceição, L.E.C.,
2016. Can Senegalese sole post‐larvae effectively grow on low dietary DHA and
lipid levels during weaning? Aquaculture 463: 234‐240.
Rezek, T.C., Wantanabe, W.O., Harel, M. and Seaton, P.J., 2010. Effects of dietary
docosahexaenoic acid (22:6n‐3) and arachidonic acid (20:4n‐6) on the growth,
survival, stress resistance and fatty acid composition in black sea bass
Centropristis striata (Linnaeus 1758) larvae. Aquaculture Research 41: 1302‐
1314.
Romano, A., Barca, A., Storelli, C. and Verri, T., 2014. Teleost fish models in
membrane transport research: the Pept1 (SLC15A1) H+ ‐ oligopeptide
transporter as a case study. Journal of Physiology. 592(5): 881‐897.
Rombenso, A., Trushenski, J.T., and Jirsa, J. and Drawbridge, M., 2016.
Docosahexaenoic acid (DHA) and arachidonic acid (ARA) are essential to meet
LC‐PUFA requirements of juvenile California Yellowtail (Seriola dorsalis).
Aquaculture 463: 123‐134.
Smith, J.G., Yokoyama, W.H. and German, J.B., 1998. Butyric acid from the diet:
actions at the level of gene expression. Critical Reviews of Food Science 38: 259‐
297.
Takeuchi, T., Toyota, M., Satoh, S. and Watanabe, T., 1990. Requirement of
juvenile red seabream Pagrus major for eicosapentaenoic and docosahexaenoic
acids. Nippon Suisan Gakkaishi 56: 1263‐1269.
Van Anholt, R.D., Koven, W.M., Lutzky, S. and Wendelaar Bonga, S.E., 2004.
Dietary supplementation with arachidonic acid alters the stress response of
gilthead sea bream (Sparus aurata) larvae. Aquaculture 238: 369‐383.
Wu, F‐C., Ting, Y‐Y. and Chen, H‐Y., 2002. Docosahexaenoic acid is superior to
eicosapentaenoic acid as the essential fatty acid for growth of Grouper,
Epinephelus malabaricus. The Journal of Nutrition 132: 72‐79.

APPENDIX 1
Past AAC Award Winners
List of Lifetime Achievement Award Recipients
Date Bestowed Name Residence
May 30, 2000 Neil Bourne Nanaimo, British Columbia
May 9, 2001 David Aiken Saint Andrews, New Brunswick
September 20, 2002 Rene Lavoie Dartmouth, Nova Scotia
October 31, 2003 Bill Pennell Nanaimo, British Columbia
October 19, 2004 Ovila Daigle Richibucto, New Brunswick
July 5, 2005 Louis Deveau Dartmouth, Nova Scotia
November 21, 2006 Lucien Poirier Rimouski, Quebec
May 13, 2008 Yves Bastien Chelsea, Quebec
May 19, 2010 Al Castledine Victoria, British Columbia
May 2012 Chris Frantsi Saint Andrews, New Brunswick
June 3, 2014 Cyr Couturier St. John’s, Newfoundland & Labrador
June 3, 2014 Santosh Lall Halifax, Nova Scotia
September 21, 2016 Rod Carney Saint Andrews, New Brunswick

List of Research Award of Excellence Recipients
Date Bestowed Name Residence
May 30, 2000 Santosh Lall Halifax, Nova Scotia
May 9, 2001 Joseph Brown St. John’s, Newfoundland
September 20, 2002 Joel de la Noue Laval, Québec
November 1, 2003 Tillmann Benfey Fredericton, New Brunswick
October 20, 2004 Ed Donaldson West Vancouver, British
Columbia
July 6, 2005 John Castell Saint Andrews, New Brunswick
November 22, 2006 David A. Higgs West Vancouver, British
Columbia
September 25, 2007 Richard Moccia Guelph, Ontario
May 12, 2009 (joint)
Thierry Chopin Saint John, New Brunswick
Shawn Robinson Saint Andrews, New Brunswick
May 11, 2011 Debbie Martin‐Robichaud Saint Andrews, New Brunswick
June 4, 2013 Marcel Fréchette Mont Joli, Québec
June 3, 2014 Fred Page Saint Andrews, New Brunswick
June 2, 2015 Céline Audet Rimouski, Québec
May 31, 2017 Réjean Tremblay Rimouski, Québec

Recommended