Business Diagram
LOOK BOOK25 examples of software-produced business
diagrams - explained and illustrated
by Chuck Frey author of the Mind Mapping Software Blog
SPONSORED BY
Welcom e t o t he Diagram m ing Sof t ware Look Book
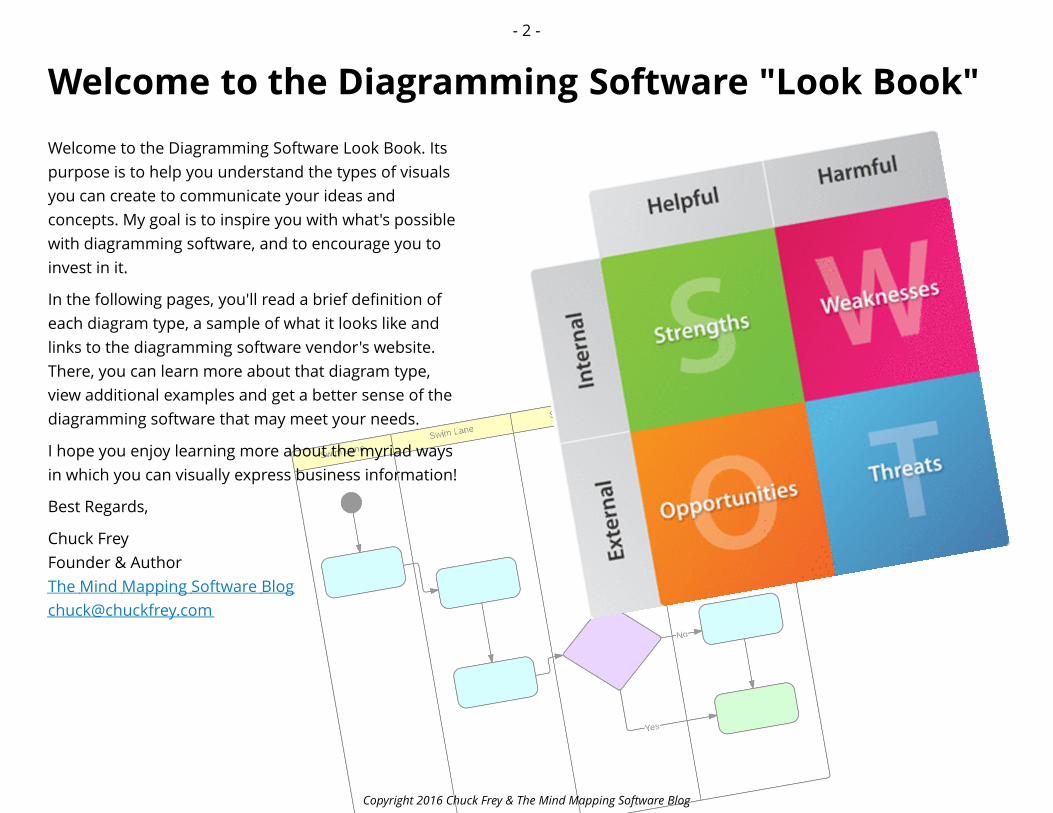
Welcome to the Diagramming Software Look Book Its
purpose is to help you understand the types of visuals
you can create to communicate your ideas and
concepts My goal is to inspire you with what s possible
with diagramming software and to encourage you to
invest in it
In the following pages youll read a brief definition of
each diagram type a sample of what it looks like and
links to the diagramming software vendor s website
There you can learn more about that diagram type
view additional examples and get a better sense of the
diagramming software that may meet your needs
I hope you enjoy learning more about the myriad ways
in which you can visually express business information
Best Regards
Chuck Frey
Founder amp Author
The Mind Mapping Software Blog
chuckchuckfreycom
Copyright 2016 Chuck Frey amp The Mind Mapping Software Blog
- 2 -
Table of cont ent s
Copyright 2016 Chuck Frey amp The Mind Mapping Software Blog
About t he aut hor
ActivityUML diagram 4
Affinity diagram 5
Prioritization matrix 6
SWOT analysis 7
Wireframes and UI mockups 8
Swim lane process diagram 9
Value stream mapping 10
Network (IT) diagram 11
Timeline 12
Venn diagram 13
Concept map 14
Cause and effect (fishbone) diagram 15
Workflowbusiness process 16
Infographic 17
Cycle diagram 18
Gantt chart 19
Pyramid chart 20
Organizational chart 21
PEST analysis 22
Force field analysis 23
Competitive analysis 24
Strategy map 25
Business Process Modeling Notation (BPMN) 26
Entity-relationship diagram (ER) 27
Interactive site map 28
Software developer profiles 29
Chuck Frey is the publisher and author of The Mind Mapping Software Blog the webs leading source for news trends reviews tips and resources about all types of visual thinking - including business diagramming You can contact him at chuckchuckfreycom or follow him on Twitter at chuckfrey
- 3 -
Act ivit yUML diagramPURPOSE
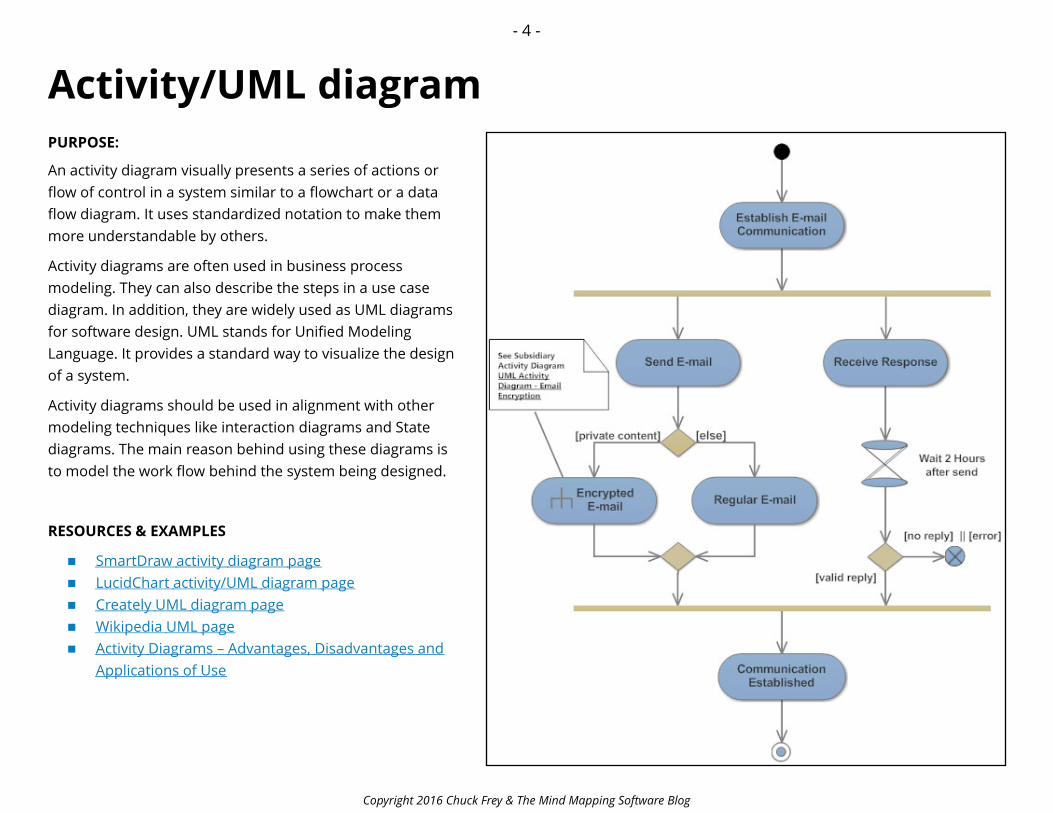
An activity diagram visually presents a series of actions or
flow of control in a system similar to a flowchart or a data
flow diagram It uses standardized notation to make them
more understandable by others
Activity diagrams are often used in business process
modeling They can also describe the steps in a use case
diagram In addition they are widely used as UML diagrams
for software design UML stands for Unified Modeling
Language It provides a standard way to visualize the design
of a system
Activity diagrams should be used in alignment with other
modeling techniques like interaction diagrams and State
diagrams The main reason behind using these diagrams is
to model the work flow behind the system being designed
RESOURCES amp EXAMPLES
- SmartDraw activity diagram page
- LucidChart activityUML diagram page
- Creately UML diagram page
- Wikipedia UML page
- Activity Diagrams Advantages Disadvantages and
Applications of Use
Copyright 2016 Chuck Frey amp The Mind Mapping Software Blog
- 4 -
Aff in it y diagramPURPOSE
An affinity diagram shows the relationships between
information opinions problems solutions and issues
by placing them in related groups It allows a broad
range of ideas to be organized so they can be more
effectively analyzed It s also known as a KJ diagram
Affinity diagrams come in handy after a big
brainstorming session Project managers use them to
organize a large number of ideas so team members
are better able to see the patterns in what s been
discussed and help identify potential solutions to
problems
Affinity diagrams often lead to the creation of more
detailed cause and effect diagrams
RESOURCES amp EXAMPLES
- SmartDraw affinity diagram page
- LucidChart affinity diagram page
- ConceptDraw affinity diagram how-tos
- EDrawSoft affinity diagram page
Copyright 2016 Chuck Frey amp The Mind Mapping Software Blog
- 5 -
Pr ior it izat ion m at r ixPURPOSE
This tool is used to prioritize items and describe them
in terms of weighted criteria It uses a combination of
tree and matrix diagramming techniques to do a
pair-wise evaluation of items and to narrow down
options to the most desired or most effective
Popular applications for the prioritization matrix
include return on investment (ROI) or costbenefit
analysis (investment vs return) and time management
matrix (urgency vs importance)
RESOURCES amp EXAMPLES
- SmartDraw prioritization matrix page
- ConceptDraw prioritization matrix tutorial
- EDrawSoft prioritization matrix tutorial
Copyright 2016 Chuck Frey amp The Mind Mapping Software Blog
- 6 -
SWOT analysisPURPOSE
A SWOT analysis is a structured planning method that
evaluates 4 key elements of a project or business
venture Strengths Weaknesses Opportunities and
Threats
SWOT analysis aims to identify the key internal and
external factors seen as important to achieving an
objective SWOT analysis groups key pieces of
information into two main categories
Internal factors the strengths and weaknesses
internal to the organization
External factors the opportunities and threats
presented by the environment external to the
organization
RESOURCES amp EXAMPLES
- SmartDraw SWOT analysis page
- ConceptDraw SWOT add-in page
- LucidChart SWOT analysis page
- Creately SWOT analysis page
Copyright 2016 Chuck Frey amp The Mind Mapping Software Blog
- 7 -
Wiref ram es and UI m ockupsPURPOSE
A website wireframe is a visual prototype of a web
page that focuses on content layout and behavior
It usually doesnt include any styling color or graphics
It s like a blueprint to a house that shows the plan for
plumbing and electricity without the interior design
A website wireframe can also show the relationship
between pages allowing you to navigate between a
series of mockups with clickable components
RESOURCES amp EXAMPLES
- SmartDraw wireframe design page
- LucidChart - wireframes for web pages and apps
- ConceptDraw web page wireframe - Solution
Park
- Creately Wireframes and UI mockups web page
Copyright 2016 Chuck Frey amp The Mind Mapping Software Blog
- 8 -
Swim lane process diagramPURPOSE
A swim lane (or swimlane diagram) is a visual element
used in process flow diagrams or flowcharts that
visually distinguishes job sharing and responsibilit ies
for sub-processes of a business process Swim lanes
may be arranged either horizontally or vertically
The swim lane flowchart differs from other flowcharts
in that processes and decisions are grouped visually by
placing them in lanes Parallel lines divide the chart
into lanes with one lane for each person group or
subprocess Lanes are labelled to show how the chart
is organized
Swim lane flowcharts are especially useful in helping
teams and project managers visualize hand-offs from
one person team or department to another - a
common place where projects break down due to poor
communication or misunderstandings
RESOURCES amp EXAMPLES
- SmartDraw swim lane diagram web page
- LucidChart swim lane diagram web page
- Creately swim lane diagram article
Copyright 2016 Chuck Frey amp The Mind Mapping Software Blog
- 9 -
Value st ream m appingPURPOSE
Value stream mapping (VSM) is a lean manufacturing
or lean enterprise technique used to document
analyze and improve the flow of information or
materials required to produce a product or service for
a customer VSM helps identify waste and streamline
the production process
A value stream map (AKA end-to-end system map)
takes into account not only the activity of the product
but the management and information systems that
support the basic process This is especially helpful
when working to reduce cycle time because you gain
insight into the decision making flow in addition to the
process flow
RESOURCES amp EXAMPLES
- SmartDraw value stream mapping web page
- LucidChart value stream mapping web page
- ConceptDraw VSM template
- Creately VSM web page
- Creating a value stream map - Lean Mfg Tools
blog
- Profitable applications of VSM - ASQcom
Copyright 2016 Chuck Frey amp The Mind Mapping Software Blog
- 10 -
Net work (IT) diagramPURPOSE
A computer network diagram is a schematic depicting
the nodes and connections amongst nodes in a
computer network
Readily identifiable icons are used to depict common
network appliances eg Router and the style of lines
between them indicate the type of connection Clouds
are used to represent networks external to the one
pictured for the purposes of depicting connections
between internal and external devices without
indicating the specifics of the outside network
RESOURCES amp EXAMPLES
- SmartDraw - how to draw a network diagram
- LucidChart - how to draw a network diagram
- ConceptDraw network diagram - Solution Park
- Creately network diagram web page
Copyright 2016 Chuck Frey amp The Mind Mapping Software Blog
- 11 -
Tim elinePURPOSE
Timeline diagrams present events during specific
intervals shown chronologically along a line These
events may be historic related to a specific criminal
case or business development or they may be
important milestones in a project
Timelines are designed to provide a broad overview of
a sequence of events in time They dont go into detail
but links to events information and images may be
added as needed
RESOURCES amp EXAMPLES
- SmartDraw timeline web page
- LucidChart timeline maker web page
- ConceptDraw timeline Solution Park template
Copyright 2016 Chuck Frey amp The Mind Mapping Software Blog
- 12 -
Venn diagramPURPOSE
A Venn diagram is an illustration of the relationships
between and among sets groups of objects that share
something in common Usually Venn diagrams are
used to depict set intersections (denoted by an
upside-down letter U) This type of diagram is used in
scientific and engineering presentations in theoretical
mathematics in computer applications and in
statistics
RESOURCES amp EXAMPLES
- SmartDraw - how to make a Venn diagram
- LucidChart - Venn diagram examples
- ConceptDraw Venn diagram - Solution Park
- Creately Venn diagram maker
- Creately Venn diagram web page
Copyright 2016 Chuck Frey amp The Mind Mapping Software Blog
- 13 -
Concept m apPURPOSE
A concept map is a diagram or graphical tool that
visually represents relationships between concepts
and ideas Most concept maps depict ideas as boxes or
circles (also called nodes) which are structured
hierarchically and connected with lines or arrows (also
called arcs) These lines are labeled with linking words
and phrases to help explain the connections between
concepts
Linking words or phrases are located on the lines
connecting objects in a concept map and these words
describe the relationship between two concepts They
are as concise as possible and typically contain a verb
Examples include causes includes and requires
RESOURCES amp EXAMPLES
- LucidChart concept maps web page
- How to create concept maps in MindManager
- SmartDraw - concept mapping
Copyright 2016 Chuck Frey amp The Mind Mapping Software Blog
- 14 -
Cause and ef fect (f ishbone) diagramPURPOSE
A fishbone diagram is also known as a Ishikawa
diagram after its creator Kaoru Ishikawa It is a
versatile diagram for mapping out possible
contributors to a problem in your business It is
commonly used to identify the root cause of a problem
in manufacturing and quality control
The horizontal spine contains the name of the
problem The lines radiating from it are categories of
potential causes Within each category you can create
branching lines to describe sub-causes
RESOURCES amp EXAMPLES
- SmartDraw fishbone diagram web page
- LucidChart - How to create an Ishakawa diagram
- Creately fishbone diagrams - multiple examples
Copyright 2016 Chuck Frey amp The Mind Mapping Software Blog
- 15 -
Work f low business processPURPOSE
Business Process Model and Notation (BPMN) is a
standard for business process modeling that provides
a graphical notation for specifying business processes
in a Business Process Diagram (BPD) based on a
flowcharting technique very similar to activity diagrams
from Unified Modeling Language (UML)
The objective of BPMN is to support business process
management for both technical users and business
users by providing a notation that is intuitive to
business users yet able to represent complex process
semantics
The business objective is often to increase process
speed or reduce cycle time to increase quality or to
reduce costs such as labor materials scrap or capital
costs
RESOURCES amp EXAMPLES
- Creately business process mapping web page
- SmartDraw Business Process Mapping page
- LucidChart Business Process Modeling page
Copyright 2016 Chuck Frey amp The Mind Mapping Software Blog
- 16 -
InfographicPURPOSE
Information graphics or infographics are graphic visual
representations of information data or knowledge
intended to present information quickly and clearly
They can improve cognition by utilizing graphics to
enhance the human visual systems ability to see
patterns and trends
Many businesses use infographics as a tool for
communicating with and attracting potential
customersmInformation graphics are a form of
content marketing and have become a tool for internet
marketers and companies to create content that
others will link to thus possibly boosting a companys
reputation and online presence
RESOURCES amp EXAMPLES
- SmartDraw infographics web page
- Creately infographics page
- LucidChart make an infographic blog post
Copyright 2016 Chuck Frey amp The Mind Mapping Software Blog
- 17 -
Cycle diagramPURPOSE
A cycle diagram is used to represent a continuing
sequence of stages tasks or events in a circular flow It
emphasizes the stages or steps rather than the
connecting arrows or flow
RESOURCES amp EXAMPLES
- SmartDraw cycle diagram examples
- Creately cycle diagram examples
Copyright 2016 Chuck Frey amp The Mind Mapping Software Blog
- 18 -
Gant t char tPURPOSE
A Gantt chart is a type of bar chart that illustrates a
project schedule Gantt charts illustrate the start and
finish dates of the terminal elements and summary
elements of a project Terminal elements and
summary elements comprise the work breakdown
structure of the project
Modern Gantt charts also show the dependency (ie
precedence network) relationships between activities
Gantt charts can be used to show current schedule
status using percent complete shadings and a vertical
TODAY line
RESOURCES amp EXAMPLES
- How to Create a Gantt Chart with SmartDraw
- Creately Gantt chart web page
- MindManager project management page
Copyright 2016 Chuck Frey amp The Mind Mapping Software Blog
- 19 -
Pyram id char tPURPOSE
A pyramid chart has the form of a triangle with lines
dividing it into sections A related topic or idea is
placed in each section Because of the triangular
shape each section is a different width from the
others this width indicates a level of hierarchy among
the topics
For example the widest section may contain a general
topic and the narrowest section may contain a much
more specific topic from within that general topic
However the width is not visually representative of the
quantity beyond larger or smaller
RESOURCES amp EXAMPLES
- SmartDraw pyramid chart web page
Copyright 2016 Chuck Frey amp The Mind Mapping Software Blog
- 20 -
Organizat ional char tPURPOSE
An organization (org) chart is a graphic representation
of the structure of an organization showing the
relationships of the positions or jobs within it
An org chart consists of boxes that represent
individuals and their roles and connectors that
represent the relationships between them In most
organizations this is represented by the president or
CEO at the top branching down through layers of
direct reports
A good org chart may also include other helpful
information like contact details links to departmental
pages or sites and more
RESOURCES amp EXAMPLES
- SmartDraw How to Create an Organizational
Chart tutorial
- LucidChart How to Make an Org Chart
- Creately Tools Templates and Resource to Draw
Org Charts
Copyright 2016 Chuck Frey amp The Mind Mapping Software Blog
- 21 -
PEST analysisPURPOSE
PEST analysis is a framework that categorizes
macro-environmental influences in strategic planning
These influences may include political economic
social and technological forces often used in the
environmental scope of this process
The goal of PEST analysis is to examine the overall
impact of each of these categories (and the potential
or real correlation with each other) on the business
The results are often used either to take advantage of
potential opportunities andor to make contingency
plans for opposing threats when preparing business
and strategic plans
RESOURCES amp EXAMPLES
- SmartDraw PEST analysis web page
Copyright 2016 Chuck Frey amp The Mind Mapping Software Blog
- 22 -
Force f ield analysisPURPOSE
Force Field Analysis is a method for listing discussing
and evaluating the various forces for and against a
proposed change When a change is planned Force
Field Analysis helps you look at the big picture by
analyzing all of the forces impacting the change and
weighing the pros and cons By knowing the pros and
cons you can develop strategies to reduce the impact
of the opposing forces and strengthen the supporting
forces
Forces that help you achieve the change are called
driving forces Forces that work against the change
are called restraining forces Force Field Analysis can
be used to develop an action plan to implement a
change Specifically it can help you determine if a
proposed change can get the needed support identify
obstacles to successful solutions and suggest actions
to reduce the strength of the obstacles
RESOURCES amp EXAMPLES
- SmartDraw force field analysis examples
- MindTools force field analysis tutorial
Copyright 2016 Chuck Frey amp The Mind Mapping Software Blog
- 23 -
Com pet it ive analysisPURPOSE
This tool is used to prioritize items and describe them
in terms of weighted criteria It uses a combination of
tree and matrix diagramming techniques to do a
pair-wise evaluation of items and to narrow down
options to the most desired or most effective
Popular applications for the prioritization matrix
include return on investment (ROI) or costbenefit
analysis (investment vs return) and time management
matrix (urgency vs importance)
RESOURCES amp EXAMPLES
- EDrawSoft - 5 charts used for competitive
analysis
- SmartDraw competitive analysis diagram
examples
- ConceptDraw competitor analysis how-to guide
Copyright 2016 Chuck Frey amp The Mind Mapping Software Blog
- 24 -
St rat egy m apPURPOSE
A strategy map is a visual summary of what a company
plans to do in order to improve its business gain more
customers and improve its financial outlook
Additionally many companies find strategy maps
valuable because they include intangible factors like
culture in the strategic analysis A strategy map
provides multiple perspectives when evaluating a
company and helps in the strategys effective
execution
RESOURCES amp EXAMPLES
- SmartDraw strategy map page
- ConceptDraw Balanced Scorecard strategy map
- EDrawSoft simple strategy map creator page
Copyright 2016 Chuck Frey amp The Mind Mapping Software Blog
- 25 -
Business Process Modeling Not at ion (BPMN)PURPOSE
Business Process Model and Notation (BPMN) is a
standard for business process modeling that provides
a graphical notation for specifying business processes
in a Business Process Diagram based on a flowcharting
technique very similar to activity diagrams from
Unified Modeling Language (UML)
The objective of BPMN is to support business process
management for both technical users and business
users by providing a notation that is intuitive to
business users yet able to represent complex process
semantics
RESOURCES amp EXAMPLES
- Creately BPMN web page
- LucidChart BPMN web page
- SmartDraw BPMN examples
- How to create a BPMN diagram using
ConceptDraw PRO
Copyright 2016 Chuck Frey amp The Mind Mapping Software Blog
- 26 -
Ent it y-relat ionship diagram (ER)PURPOSE
An entityrelationship model (ER model) describes
inter-related things of interest in a specific domain of
knowledge An ER model is composed of entity types
(which classify the things of interest) and specifies
relationships that can exist between instances of those
entity types
An entityrelationship diagram for an MMORPG using
Chens notation
In software engineering an ER model is commonly
formed to represent things that a business needs to
remember in order to perform business processes
Consequently the ER model becomes an abstract data
model that defines a data or information structure that
can be implemented in a database typically a
relational database
RESOURCES amp EXAMPLES
- Creately ER web page
- LucidChart BPMN web page
- SmartDraw ER examples
Copyright 2016 Chuck Frey amp The Mind Mapping Software Blog
- 27 -
Int eract ive sit e m apPURPOSE
A site map is a list of pages of a web site accessible to
crawlers or users It can be either a document in any
form used as a planning tool for web design or a web
page that lists the pages on a website typically
organized in hierarchical fashion
Site maps make the relationships between pages and
other content components easier to understand They
can demonstrate organization navigation and labeling
systems
RESOURCES amp EXAMPLES
- Creately interactive site map page
- LucidChart site map web page
- SmartDraw ER examples
Copyright 2016 Chuck Frey amp The Mind Mapping Software Blog
- 28 -
- 29 -
- 30 -
- 31 -
- 32 -
Dont m iss t hese resources
Copyright 2016 Chuck Frey amp The Mind Mapping Software Blog
The def in it ive guide t o get t ing t he m ost out of m ind m apping sof t ware
For years mind mappers have told me in surveys and feedback messages that they want help They love their mind mapping software but dont know how to release its vast potential Im sure youve had similar feelings You could accomplish amazing things with it - if only you knew how
That s why I wrote Power Tips amp St rat egies for Mind Mapping Sof t ware - to help you to be more productive creative and successful with this powerful type of business software
9 m ust -have m ind m aps for leaders and m anagers
As a manager or leader you need to be able to digest information reach clarity on key business issues and make informed decisions quickly You must also be able to envision and capitalize on new opportunities and mobilize your direct reports with clear compelling directions The success of your department business unit and organization depends on it
This valuable repor t which I have recently updated and expanded explains how you can leverage your mind mapping software to generate superior results in areas such as business planning brainstorming and selling ideas to others and managing meetings with calm efficiency It also provides tips on how to get the best results with each type of map
- 33 -
Welcom e t o t he Diagram m ing Sof t ware Look Book
Welcome to the Diagramming Software Look Book Its
purpose is to help you understand the types of visuals
you can create to communicate your ideas and
concepts My goal is to inspire you with what s possible
with diagramming software and to encourage you to
invest in it
In the following pages youll read a brief definition of
each diagram type a sample of what it looks like and
links to the diagramming software vendor s website
There you can learn more about that diagram type
view additional examples and get a better sense of the
diagramming software that may meet your needs
I hope you enjoy learning more about the myriad ways
in which you can visually express business information
Best Regards
Chuck Frey
Founder amp Author
The Mind Mapping Software Blog
chuckchuckfreycom
Copyright 2016 Chuck Frey amp The Mind Mapping Software Blog
- 2 -
Table of cont ent s
Copyright 2016 Chuck Frey amp The Mind Mapping Software Blog
About t he aut hor
ActivityUML diagram 4
Affinity diagram 5
Prioritization matrix 6
SWOT analysis 7
Wireframes and UI mockups 8
Swim lane process diagram 9
Value stream mapping 10
Network (IT) diagram 11
Timeline 12
Venn diagram 13
Concept map 14
Cause and effect (fishbone) diagram 15
Workflowbusiness process 16
Infographic 17
Cycle diagram 18
Gantt chart 19
Pyramid chart 20
Organizational chart 21
PEST analysis 22
Force field analysis 23
Competitive analysis 24
Strategy map 25
Business Process Modeling Notation (BPMN) 26
Entity-relationship diagram (ER) 27
Interactive site map 28
Software developer profiles 29
Chuck Frey is the publisher and author of The Mind Mapping Software Blog the webs leading source for news trends reviews tips and resources about all types of visual thinking - including business diagramming You can contact him at chuckchuckfreycom or follow him on Twitter at chuckfrey
- 3 -
Act ivit yUML diagramPURPOSE
An activity diagram visually presents a series of actions or
flow of control in a system similar to a flowchart or a data
flow diagram It uses standardized notation to make them
more understandable by others
Activity diagrams are often used in business process
modeling They can also describe the steps in a use case
diagram In addition they are widely used as UML diagrams
for software design UML stands for Unified Modeling
Language It provides a standard way to visualize the design
of a system
Activity diagrams should be used in alignment with other
modeling techniques like interaction diagrams and State
diagrams The main reason behind using these diagrams is
to model the work flow behind the system being designed
RESOURCES amp EXAMPLES
- SmartDraw activity diagram page
- LucidChart activityUML diagram page
- Creately UML diagram page
- Wikipedia UML page
- Activity Diagrams Advantages Disadvantages and
Applications of Use
Copyright 2016 Chuck Frey amp The Mind Mapping Software Blog
- 4 -
Aff in it y diagramPURPOSE
An affinity diagram shows the relationships between
information opinions problems solutions and issues
by placing them in related groups It allows a broad
range of ideas to be organized so they can be more
effectively analyzed It s also known as a KJ diagram
Affinity diagrams come in handy after a big
brainstorming session Project managers use them to
organize a large number of ideas so team members
are better able to see the patterns in what s been
discussed and help identify potential solutions to
problems
Affinity diagrams often lead to the creation of more
detailed cause and effect diagrams
RESOURCES amp EXAMPLES
- SmartDraw affinity diagram page
- LucidChart affinity diagram page
- ConceptDraw affinity diagram how-tos
- EDrawSoft affinity diagram page
Copyright 2016 Chuck Frey amp The Mind Mapping Software Blog
- 5 -
Pr ior it izat ion m at r ixPURPOSE
This tool is used to prioritize items and describe them
in terms of weighted criteria It uses a combination of
tree and matrix diagramming techniques to do a
pair-wise evaluation of items and to narrow down
options to the most desired or most effective
Popular applications for the prioritization matrix
include return on investment (ROI) or costbenefit
analysis (investment vs return) and time management
matrix (urgency vs importance)
RESOURCES amp EXAMPLES
- SmartDraw prioritization matrix page
- ConceptDraw prioritization matrix tutorial
- EDrawSoft prioritization matrix tutorial
Copyright 2016 Chuck Frey amp The Mind Mapping Software Blog
- 6 -
SWOT analysisPURPOSE
A SWOT analysis is a structured planning method that
evaluates 4 key elements of a project or business
venture Strengths Weaknesses Opportunities and
Threats
SWOT analysis aims to identify the key internal and
external factors seen as important to achieving an
objective SWOT analysis groups key pieces of
information into two main categories
Internal factors the strengths and weaknesses
internal to the organization
External factors the opportunities and threats
presented by the environment external to the
organization
RESOURCES amp EXAMPLES
- SmartDraw SWOT analysis page
- ConceptDraw SWOT add-in page
- LucidChart SWOT analysis page
- Creately SWOT analysis page
Copyright 2016 Chuck Frey amp The Mind Mapping Software Blog
- 7 -
Wiref ram es and UI m ockupsPURPOSE
A website wireframe is a visual prototype of a web
page that focuses on content layout and behavior
It usually doesnt include any styling color or graphics
It s like a blueprint to a house that shows the plan for
plumbing and electricity without the interior design
A website wireframe can also show the relationship
between pages allowing you to navigate between a
series of mockups with clickable components
RESOURCES amp EXAMPLES
- SmartDraw wireframe design page
- LucidChart - wireframes for web pages and apps
- ConceptDraw web page wireframe - Solution
Park
- Creately Wireframes and UI mockups web page
Copyright 2016 Chuck Frey amp The Mind Mapping Software Blog
- 8 -
Swim lane process diagramPURPOSE
A swim lane (or swimlane diagram) is a visual element
used in process flow diagrams or flowcharts that
visually distinguishes job sharing and responsibilit ies
for sub-processes of a business process Swim lanes
may be arranged either horizontally or vertically
The swim lane flowchart differs from other flowcharts
in that processes and decisions are grouped visually by
placing them in lanes Parallel lines divide the chart
into lanes with one lane for each person group or
subprocess Lanes are labelled to show how the chart
is organized
Swim lane flowcharts are especially useful in helping
teams and project managers visualize hand-offs from
one person team or department to another - a
common place where projects break down due to poor
communication or misunderstandings
RESOURCES amp EXAMPLES
- SmartDraw swim lane diagram web page
- LucidChart swim lane diagram web page
- Creately swim lane diagram article
Copyright 2016 Chuck Frey amp The Mind Mapping Software Blog
- 9 -
Value st ream m appingPURPOSE
Value stream mapping (VSM) is a lean manufacturing
or lean enterprise technique used to document
analyze and improve the flow of information or
materials required to produce a product or service for
a customer VSM helps identify waste and streamline
the production process
A value stream map (AKA end-to-end system map)
takes into account not only the activity of the product
but the management and information systems that
support the basic process This is especially helpful
when working to reduce cycle time because you gain
insight into the decision making flow in addition to the
process flow
RESOURCES amp EXAMPLES
- SmartDraw value stream mapping web page
- LucidChart value stream mapping web page
- ConceptDraw VSM template
- Creately VSM web page
- Creating a value stream map - Lean Mfg Tools
blog
- Profitable applications of VSM - ASQcom
Copyright 2016 Chuck Frey amp The Mind Mapping Software Blog
- 10 -
Net work (IT) diagramPURPOSE
A computer network diagram is a schematic depicting
the nodes and connections amongst nodes in a
computer network
Readily identifiable icons are used to depict common
network appliances eg Router and the style of lines
between them indicate the type of connection Clouds
are used to represent networks external to the one
pictured for the purposes of depicting connections
between internal and external devices without
indicating the specifics of the outside network
RESOURCES amp EXAMPLES
- SmartDraw - how to draw a network diagram
- LucidChart - how to draw a network diagram
- ConceptDraw network diagram - Solution Park
- Creately network diagram web page
Copyright 2016 Chuck Frey amp The Mind Mapping Software Blog
- 11 -
Tim elinePURPOSE
Timeline diagrams present events during specific
intervals shown chronologically along a line These
events may be historic related to a specific criminal
case or business development or they may be
important milestones in a project
Timelines are designed to provide a broad overview of
a sequence of events in time They dont go into detail
but links to events information and images may be
added as needed
RESOURCES amp EXAMPLES
- SmartDraw timeline web page
- LucidChart timeline maker web page
- ConceptDraw timeline Solution Park template
Copyright 2016 Chuck Frey amp The Mind Mapping Software Blog
- 12 -
Venn diagramPURPOSE
A Venn diagram is an illustration of the relationships
between and among sets groups of objects that share
something in common Usually Venn diagrams are
used to depict set intersections (denoted by an
upside-down letter U) This type of diagram is used in
scientific and engineering presentations in theoretical
mathematics in computer applications and in
statistics
RESOURCES amp EXAMPLES
- SmartDraw - how to make a Venn diagram
- LucidChart - Venn diagram examples
- ConceptDraw Venn diagram - Solution Park
- Creately Venn diagram maker
- Creately Venn diagram web page
Copyright 2016 Chuck Frey amp The Mind Mapping Software Blog
- 13 -
Concept m apPURPOSE
A concept map is a diagram or graphical tool that
visually represents relationships between concepts
and ideas Most concept maps depict ideas as boxes or
circles (also called nodes) which are structured
hierarchically and connected with lines or arrows (also
called arcs) These lines are labeled with linking words
and phrases to help explain the connections between
concepts
Linking words or phrases are located on the lines
connecting objects in a concept map and these words
describe the relationship between two concepts They
are as concise as possible and typically contain a verb
Examples include causes includes and requires
RESOURCES amp EXAMPLES
- LucidChart concept maps web page
- How to create concept maps in MindManager
- SmartDraw - concept mapping
Copyright 2016 Chuck Frey amp The Mind Mapping Software Blog
- 14 -
Cause and ef fect (f ishbone) diagramPURPOSE
A fishbone diagram is also known as a Ishikawa
diagram after its creator Kaoru Ishikawa It is a
versatile diagram for mapping out possible
contributors to a problem in your business It is
commonly used to identify the root cause of a problem
in manufacturing and quality control
The horizontal spine contains the name of the
problem The lines radiating from it are categories of
potential causes Within each category you can create
branching lines to describe sub-causes
RESOURCES amp EXAMPLES
- SmartDraw fishbone diagram web page
- LucidChart - How to create an Ishakawa diagram
- Creately fishbone diagrams - multiple examples
Copyright 2016 Chuck Frey amp The Mind Mapping Software Blog
- 15 -
Work f low business processPURPOSE
Business Process Model and Notation (BPMN) is a
standard for business process modeling that provides
a graphical notation for specifying business processes
in a Business Process Diagram (BPD) based on a
flowcharting technique very similar to activity diagrams
from Unified Modeling Language (UML)
The objective of BPMN is to support business process
management for both technical users and business
users by providing a notation that is intuitive to
business users yet able to represent complex process
semantics
The business objective is often to increase process
speed or reduce cycle time to increase quality or to
reduce costs such as labor materials scrap or capital
costs
RESOURCES amp EXAMPLES
- Creately business process mapping web page
- SmartDraw Business Process Mapping page
- LucidChart Business Process Modeling page
Copyright 2016 Chuck Frey amp The Mind Mapping Software Blog
- 16 -
InfographicPURPOSE
Information graphics or infographics are graphic visual
representations of information data or knowledge
intended to present information quickly and clearly
They can improve cognition by utilizing graphics to
enhance the human visual systems ability to see
patterns and trends
Many businesses use infographics as a tool for
communicating with and attracting potential
customersmInformation graphics are a form of
content marketing and have become a tool for internet
marketers and companies to create content that
others will link to thus possibly boosting a companys
reputation and online presence
RESOURCES amp EXAMPLES
- SmartDraw infographics web page
- Creately infographics page
- LucidChart make an infographic blog post
Copyright 2016 Chuck Frey amp The Mind Mapping Software Blog
- 17 -
Cycle diagramPURPOSE
A cycle diagram is used to represent a continuing
sequence of stages tasks or events in a circular flow It
emphasizes the stages or steps rather than the
connecting arrows or flow
RESOURCES amp EXAMPLES
- SmartDraw cycle diagram examples
- Creately cycle diagram examples
Copyright 2016 Chuck Frey amp The Mind Mapping Software Blog
- 18 -
Gant t char tPURPOSE
A Gantt chart is a type of bar chart that illustrates a
project schedule Gantt charts illustrate the start and
finish dates of the terminal elements and summary
elements of a project Terminal elements and
summary elements comprise the work breakdown
structure of the project
Modern Gantt charts also show the dependency (ie
precedence network) relationships between activities
Gantt charts can be used to show current schedule
status using percent complete shadings and a vertical
TODAY line
RESOURCES amp EXAMPLES
- How to Create a Gantt Chart with SmartDraw
- Creately Gantt chart web page
- MindManager project management page
Copyright 2016 Chuck Frey amp The Mind Mapping Software Blog
- 19 -
Pyram id char tPURPOSE
A pyramid chart has the form of a triangle with lines
dividing it into sections A related topic or idea is
placed in each section Because of the triangular
shape each section is a different width from the
others this width indicates a level of hierarchy among
the topics
For example the widest section may contain a general
topic and the narrowest section may contain a much
more specific topic from within that general topic
However the width is not visually representative of the
quantity beyond larger or smaller
RESOURCES amp EXAMPLES
- SmartDraw pyramid chart web page
Copyright 2016 Chuck Frey amp The Mind Mapping Software Blog
- 20 -
Organizat ional char tPURPOSE
An organization (org) chart is a graphic representation
of the structure of an organization showing the
relationships of the positions or jobs within it
An org chart consists of boxes that represent
individuals and their roles and connectors that
represent the relationships between them In most
organizations this is represented by the president or
CEO at the top branching down through layers of
direct reports
A good org chart may also include other helpful
information like contact details links to departmental
pages or sites and more
RESOURCES amp EXAMPLES
- SmartDraw How to Create an Organizational
Chart tutorial
- LucidChart How to Make an Org Chart
- Creately Tools Templates and Resource to Draw
Org Charts
Copyright 2016 Chuck Frey amp The Mind Mapping Software Blog
- 21 -
PEST analysisPURPOSE
PEST analysis is a framework that categorizes
macro-environmental influences in strategic planning
These influences may include political economic
social and technological forces often used in the
environmental scope of this process
The goal of PEST analysis is to examine the overall
impact of each of these categories (and the potential
or real correlation with each other) on the business
The results are often used either to take advantage of
potential opportunities andor to make contingency
plans for opposing threats when preparing business
and strategic plans
RESOURCES amp EXAMPLES
- SmartDraw PEST analysis web page
Copyright 2016 Chuck Frey amp The Mind Mapping Software Blog
- 22 -
Force f ield analysisPURPOSE
Force Field Analysis is a method for listing discussing
and evaluating the various forces for and against a
proposed change When a change is planned Force
Field Analysis helps you look at the big picture by
analyzing all of the forces impacting the change and
weighing the pros and cons By knowing the pros and
cons you can develop strategies to reduce the impact
of the opposing forces and strengthen the supporting
forces
Forces that help you achieve the change are called
driving forces Forces that work against the change
are called restraining forces Force Field Analysis can
be used to develop an action plan to implement a
change Specifically it can help you determine if a
proposed change can get the needed support identify
obstacles to successful solutions and suggest actions
to reduce the strength of the obstacles
RESOURCES amp EXAMPLES
- SmartDraw force field analysis examples
- MindTools force field analysis tutorial
Copyright 2016 Chuck Frey amp The Mind Mapping Software Blog
- 23 -
Com pet it ive analysisPURPOSE
This tool is used to prioritize items and describe them
in terms of weighted criteria It uses a combination of
tree and matrix diagramming techniques to do a
pair-wise evaluation of items and to narrow down
options to the most desired or most effective
Popular applications for the prioritization matrix
include return on investment (ROI) or costbenefit
analysis (investment vs return) and time management
matrix (urgency vs importance)
RESOURCES amp EXAMPLES
- EDrawSoft - 5 charts used for competitive
analysis
- SmartDraw competitive analysis diagram
examples
- ConceptDraw competitor analysis how-to guide
Copyright 2016 Chuck Frey amp The Mind Mapping Software Blog
- 24 -
St rat egy m apPURPOSE
A strategy map is a visual summary of what a company
plans to do in order to improve its business gain more
customers and improve its financial outlook
Additionally many companies find strategy maps
valuable because they include intangible factors like
culture in the strategic analysis A strategy map
provides multiple perspectives when evaluating a
company and helps in the strategys effective
execution
RESOURCES amp EXAMPLES
- SmartDraw strategy map page
- ConceptDraw Balanced Scorecard strategy map
- EDrawSoft simple strategy map creator page
Copyright 2016 Chuck Frey amp The Mind Mapping Software Blog
- 25 -
Business Process Modeling Not at ion (BPMN)PURPOSE
Business Process Model and Notation (BPMN) is a
standard for business process modeling that provides
a graphical notation for specifying business processes
in a Business Process Diagram based on a flowcharting
technique very similar to activity diagrams from
Unified Modeling Language (UML)
The objective of BPMN is to support business process
management for both technical users and business
users by providing a notation that is intuitive to
business users yet able to represent complex process
semantics
RESOURCES amp EXAMPLES
- Creately BPMN web page
- LucidChart BPMN web page
- SmartDraw BPMN examples
- How to create a BPMN diagram using
ConceptDraw PRO
Copyright 2016 Chuck Frey amp The Mind Mapping Software Blog
- 26 -
Ent it y-relat ionship diagram (ER)PURPOSE
An entityrelationship model (ER model) describes
inter-related things of interest in a specific domain of
knowledge An ER model is composed of entity types
(which classify the things of interest) and specifies
relationships that can exist between instances of those
entity types
An entityrelationship diagram for an MMORPG using
Chens notation
In software engineering an ER model is commonly
formed to represent things that a business needs to
remember in order to perform business processes
Consequently the ER model becomes an abstract data
model that defines a data or information structure that
can be implemented in a database typically a
relational database
RESOURCES amp EXAMPLES
- Creately ER web page
- LucidChart BPMN web page
- SmartDraw ER examples
Copyright 2016 Chuck Frey amp The Mind Mapping Software Blog
- 27 -
Int eract ive sit e m apPURPOSE
A site map is a list of pages of a web site accessible to
crawlers or users It can be either a document in any
form used as a planning tool for web design or a web
page that lists the pages on a website typically
organized in hierarchical fashion
Site maps make the relationships between pages and
other content components easier to understand They
can demonstrate organization navigation and labeling
systems
RESOURCES amp EXAMPLES
- Creately interactive site map page
- LucidChart site map web page
- SmartDraw ER examples
Copyright 2016 Chuck Frey amp The Mind Mapping Software Blog
- 28 -
- 29 -
- 30 -
- 31 -
- 32 -
Dont m iss t hese resources
Copyright 2016 Chuck Frey amp The Mind Mapping Software Blog
The def in it ive guide t o get t ing t he m ost out of m ind m apping sof t ware
For years mind mappers have told me in surveys and feedback messages that they want help They love their mind mapping software but dont know how to release its vast potential Im sure youve had similar feelings You could accomplish amazing things with it - if only you knew how
That s why I wrote Power Tips amp St rat egies for Mind Mapping Sof t ware - to help you to be more productive creative and successful with this powerful type of business software
9 m ust -have m ind m aps for leaders and m anagers
As a manager or leader you need to be able to digest information reach clarity on key business issues and make informed decisions quickly You must also be able to envision and capitalize on new opportunities and mobilize your direct reports with clear compelling directions The success of your department business unit and organization depends on it
This valuable repor t which I have recently updated and expanded explains how you can leverage your mind mapping software to generate superior results in areas such as business planning brainstorming and selling ideas to others and managing meetings with calm efficiency It also provides tips on how to get the best results with each type of map
- 33 -
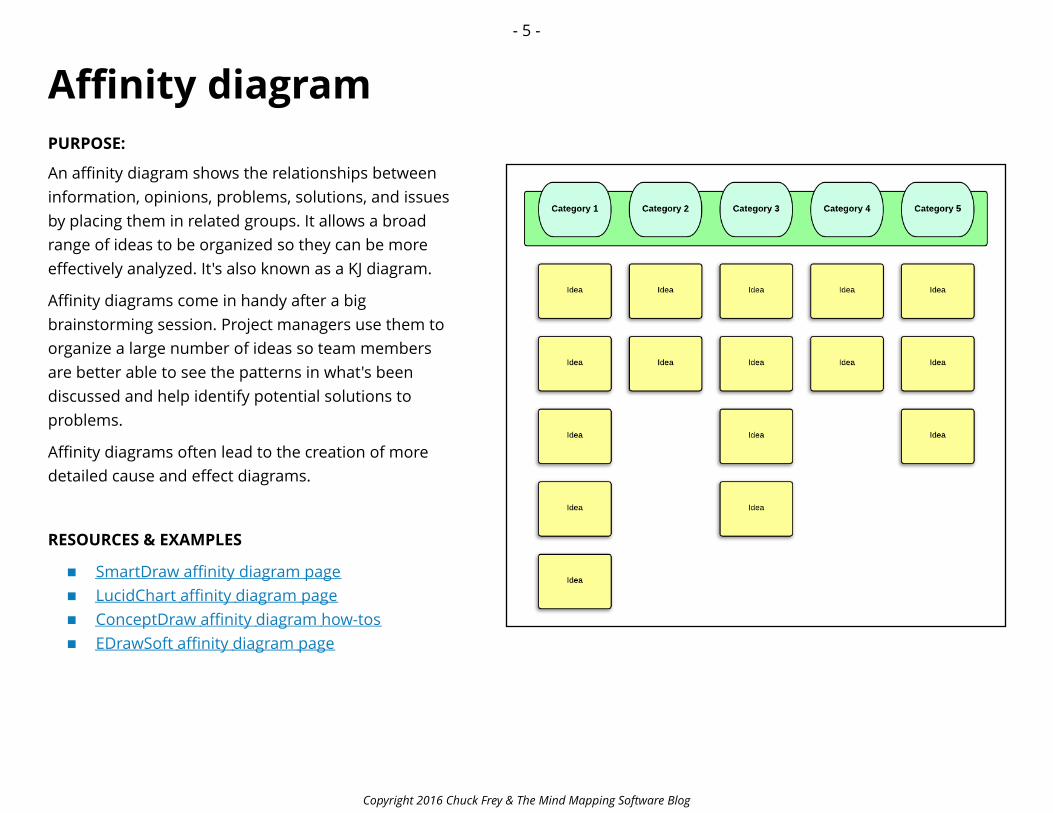
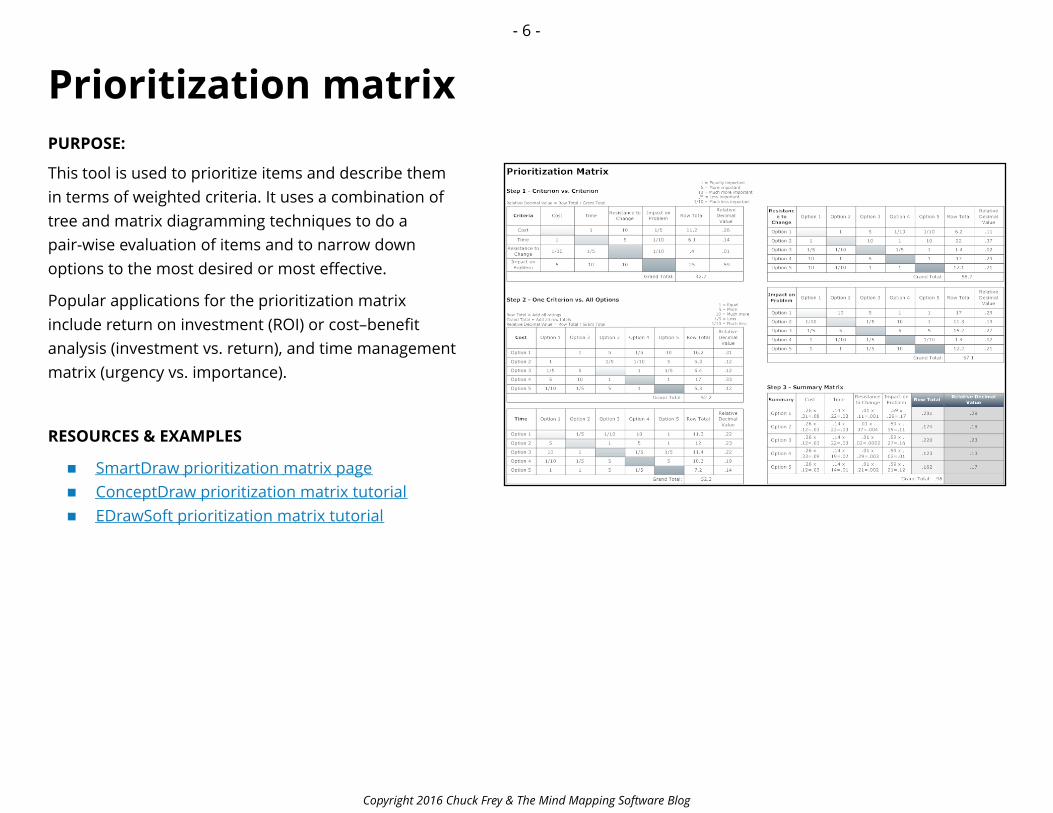
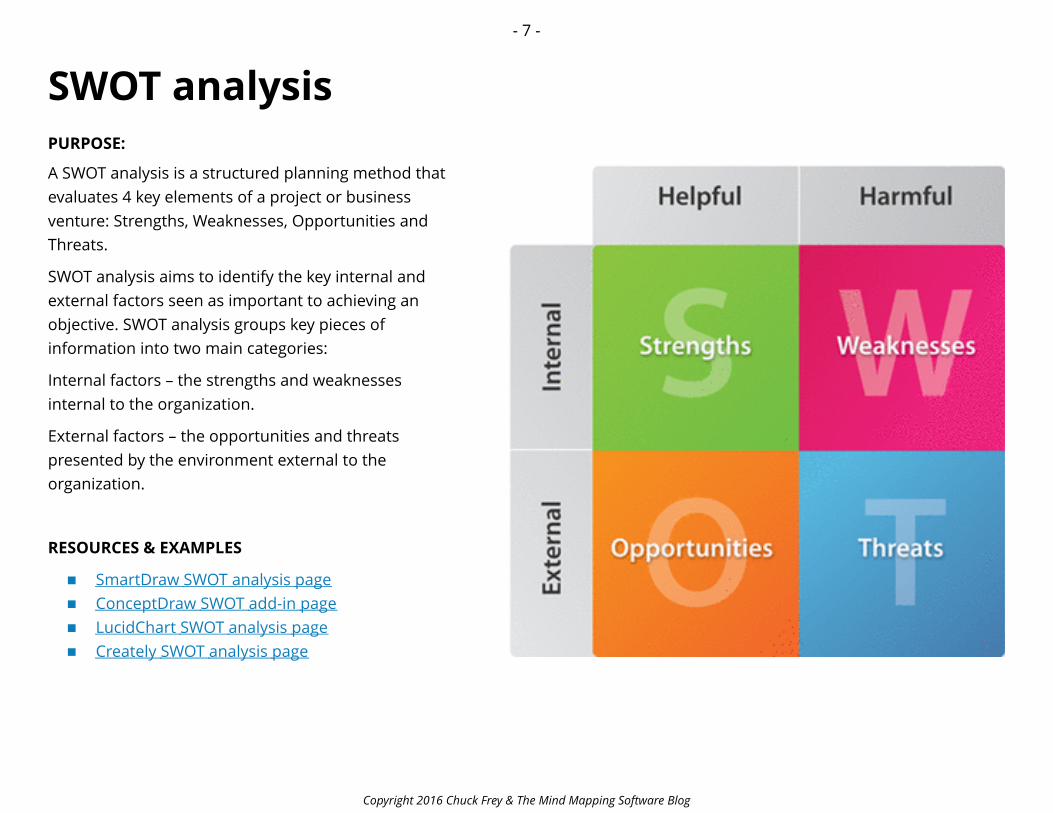
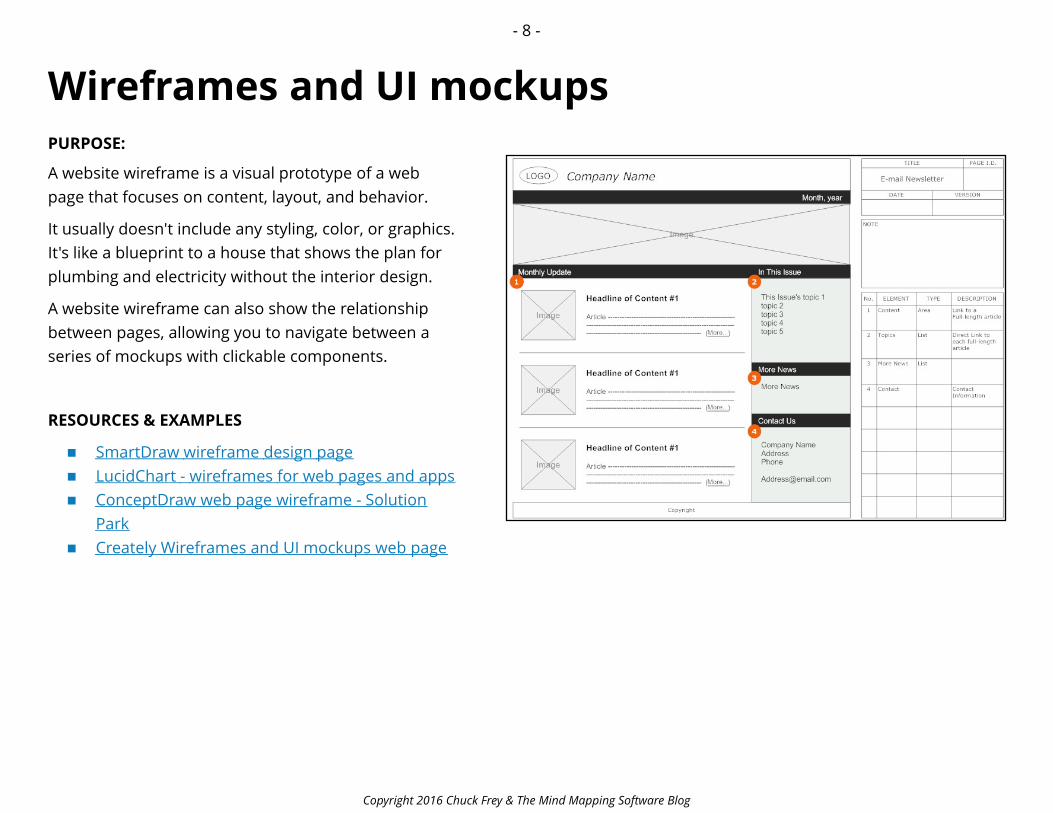
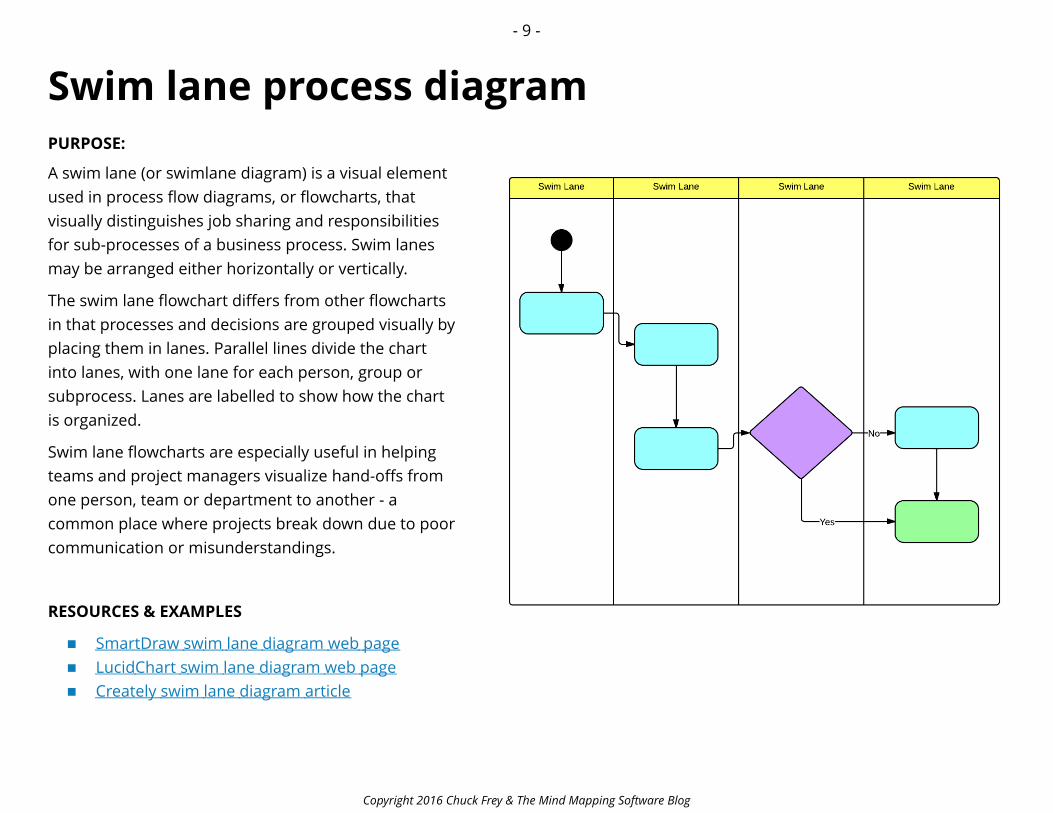
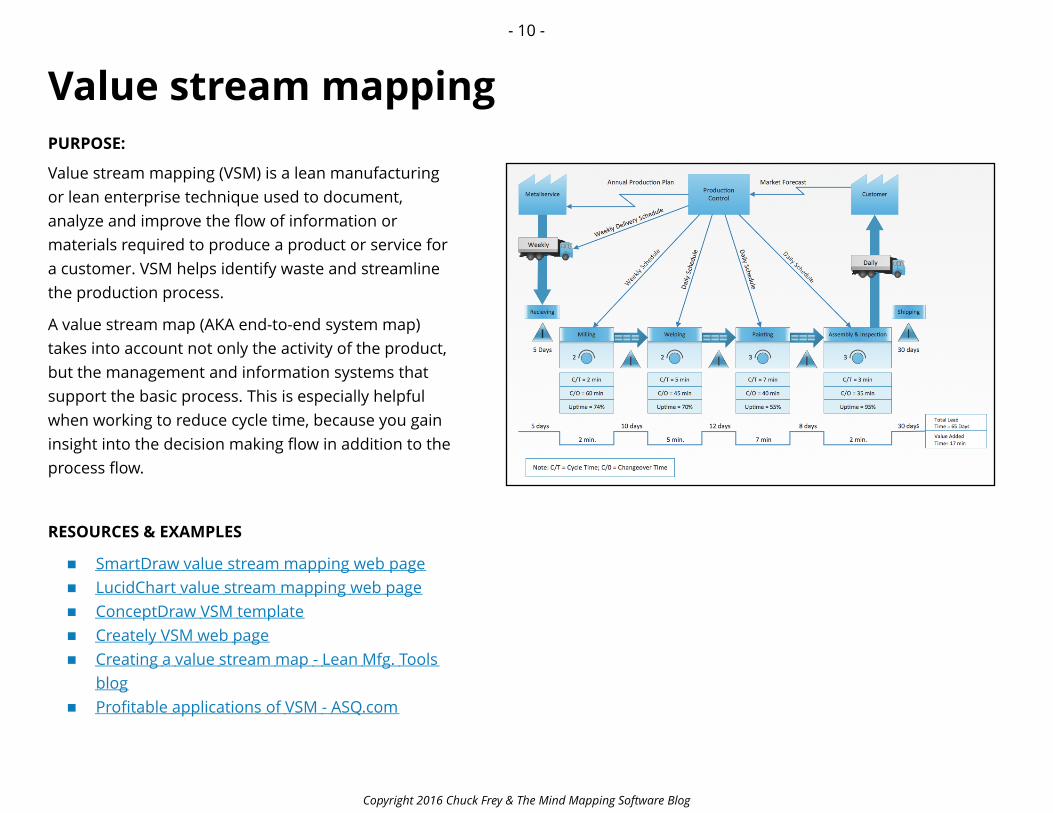
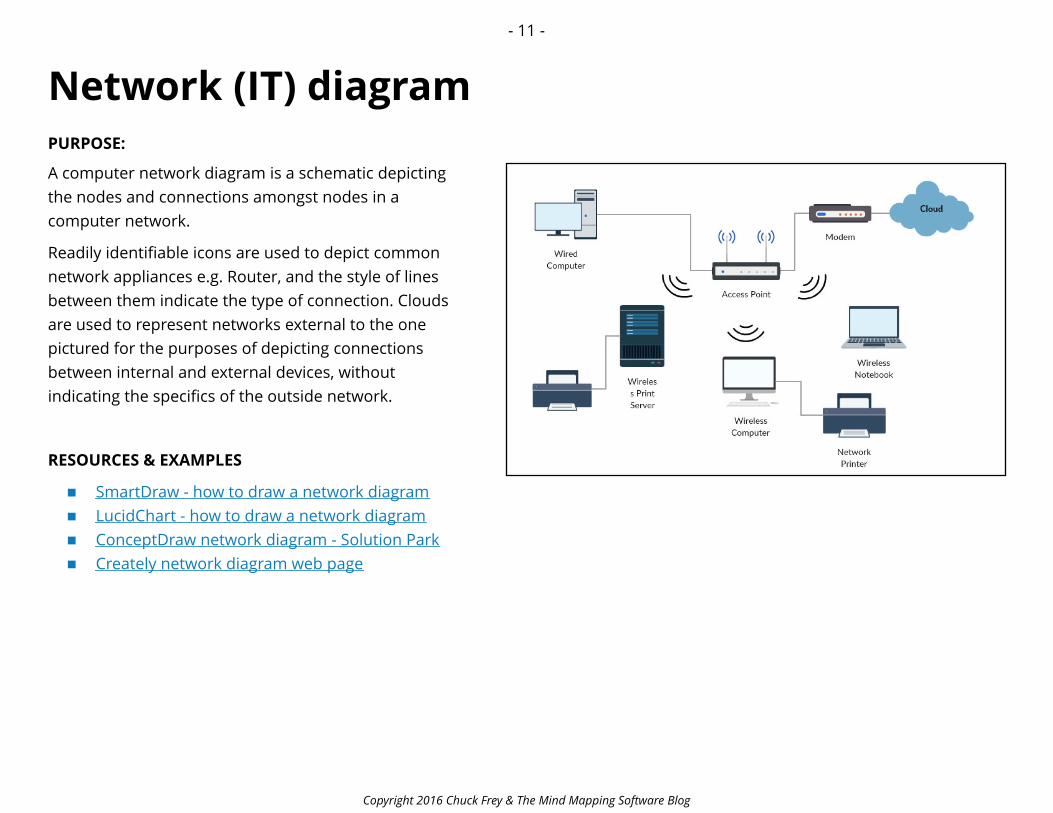
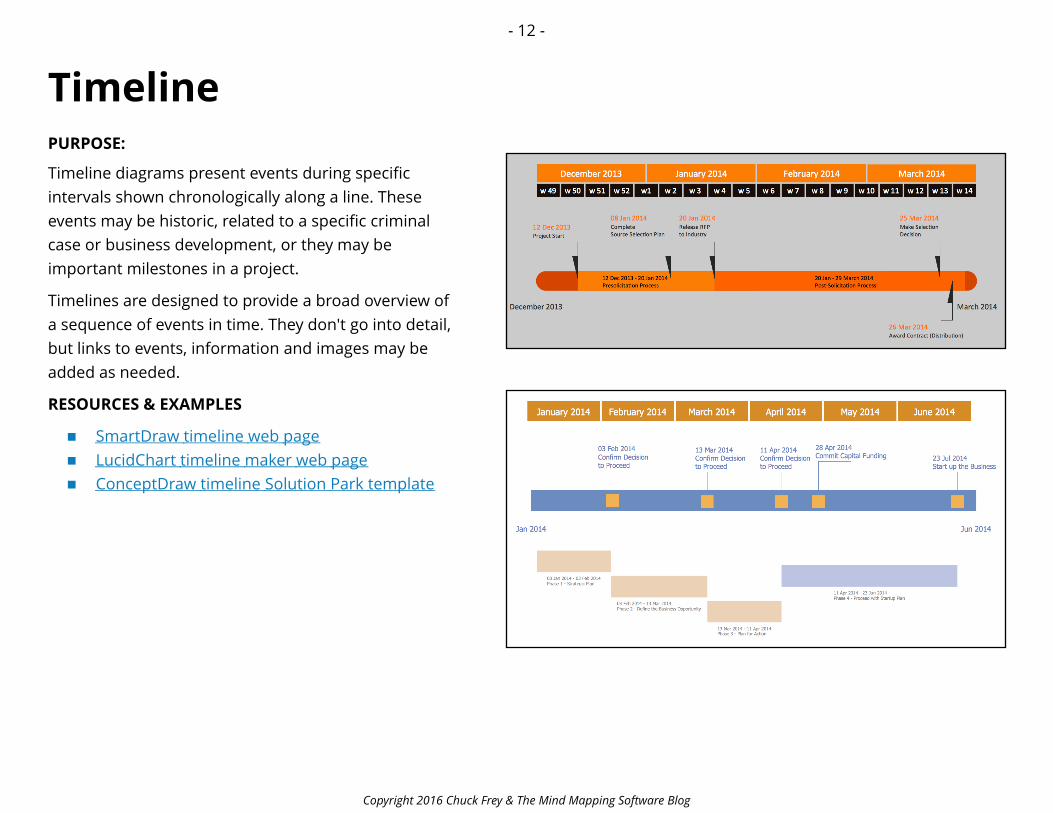
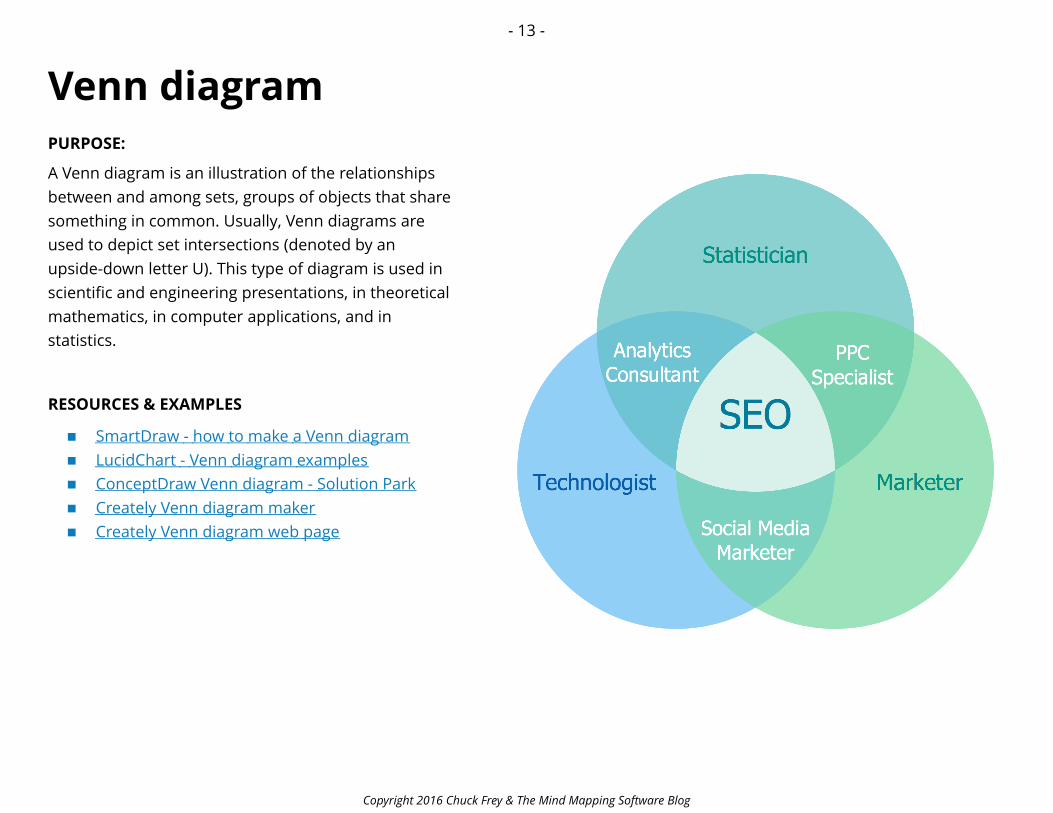
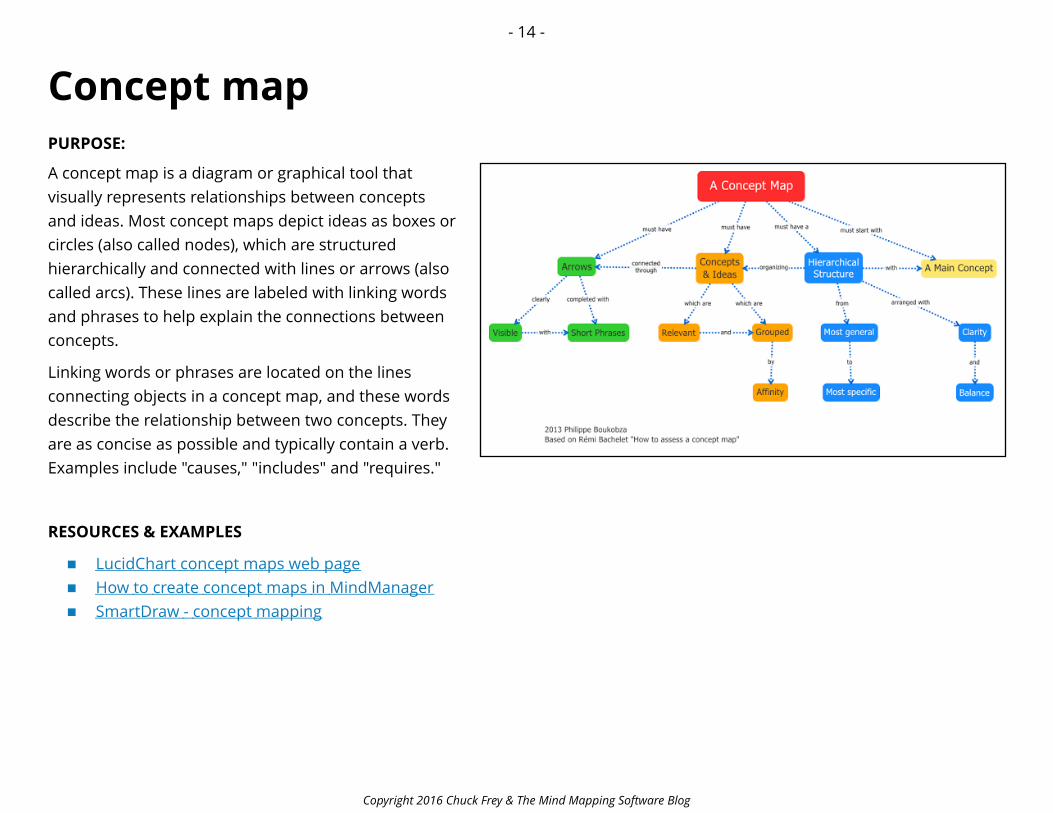
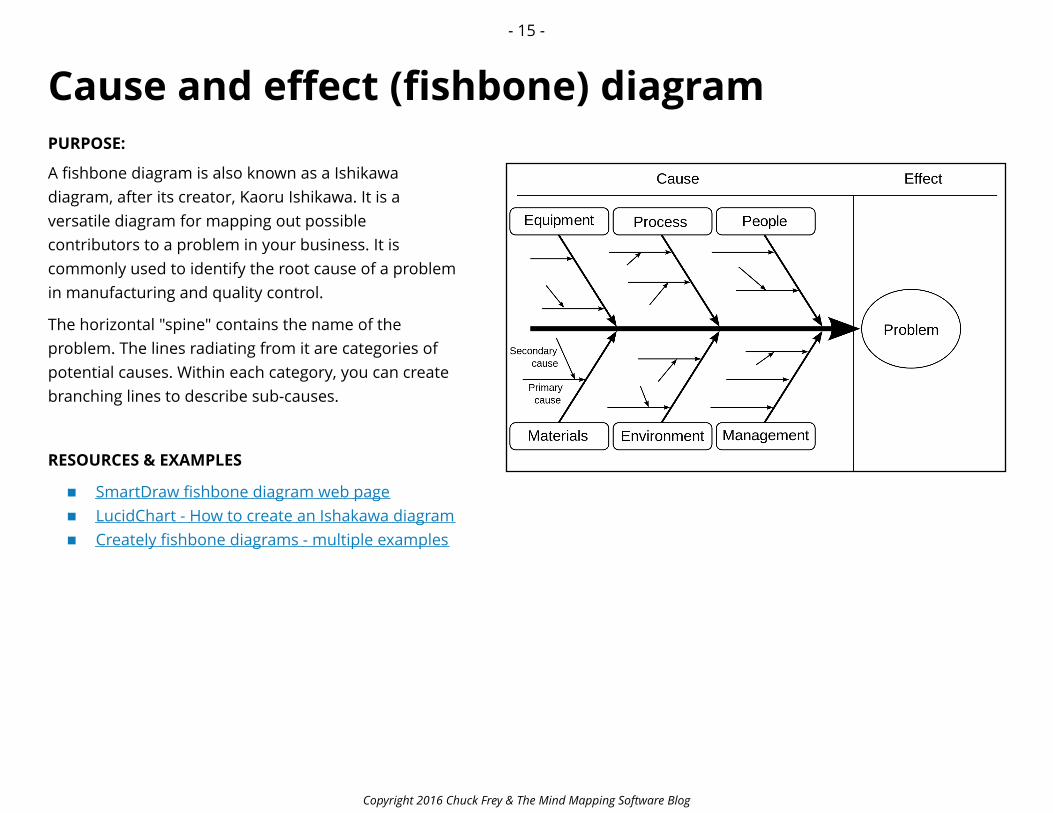
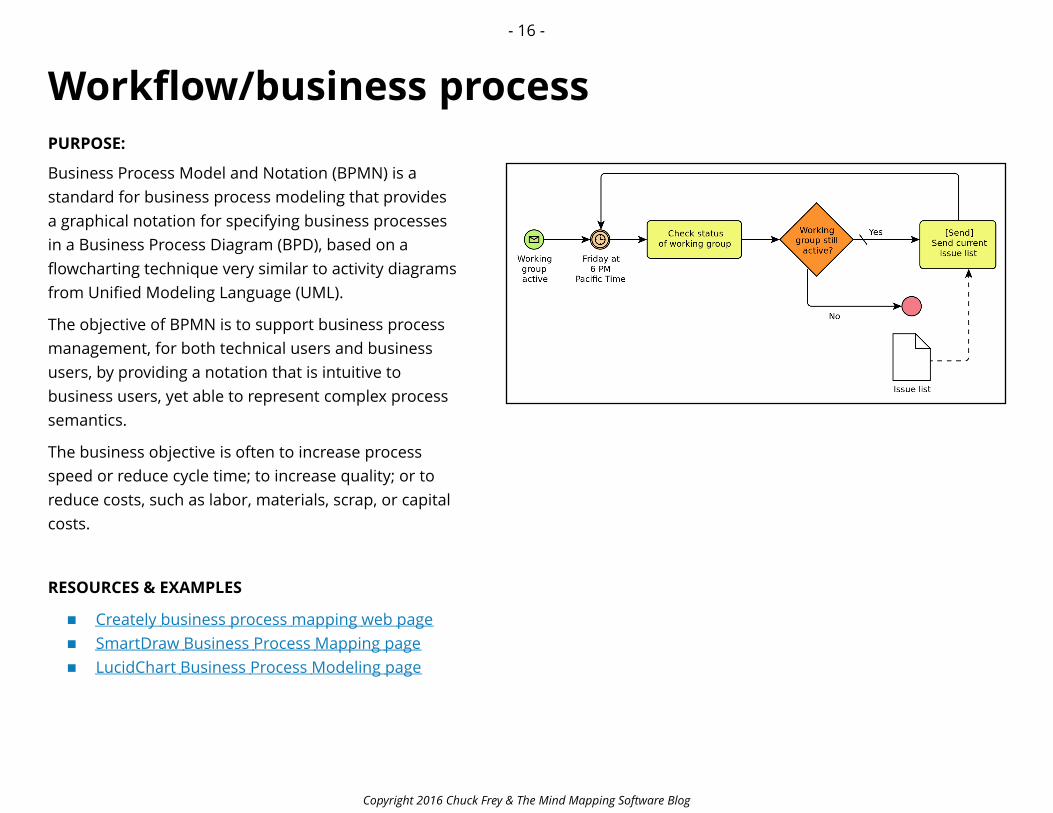
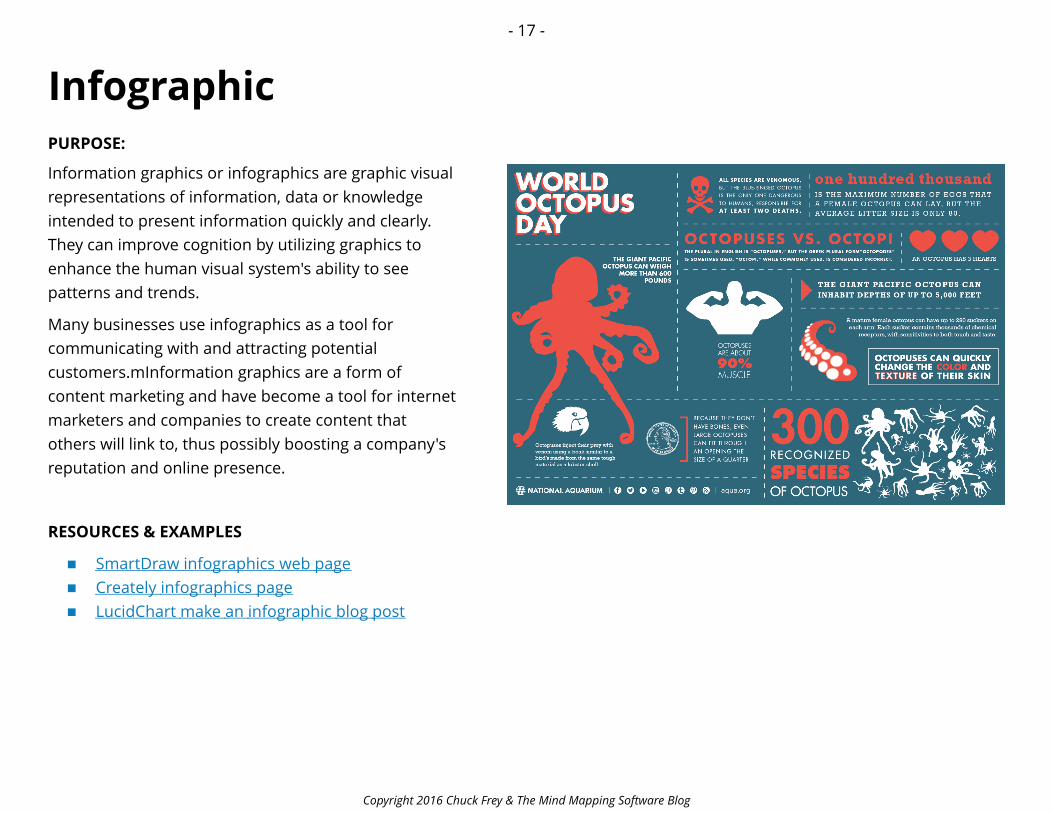
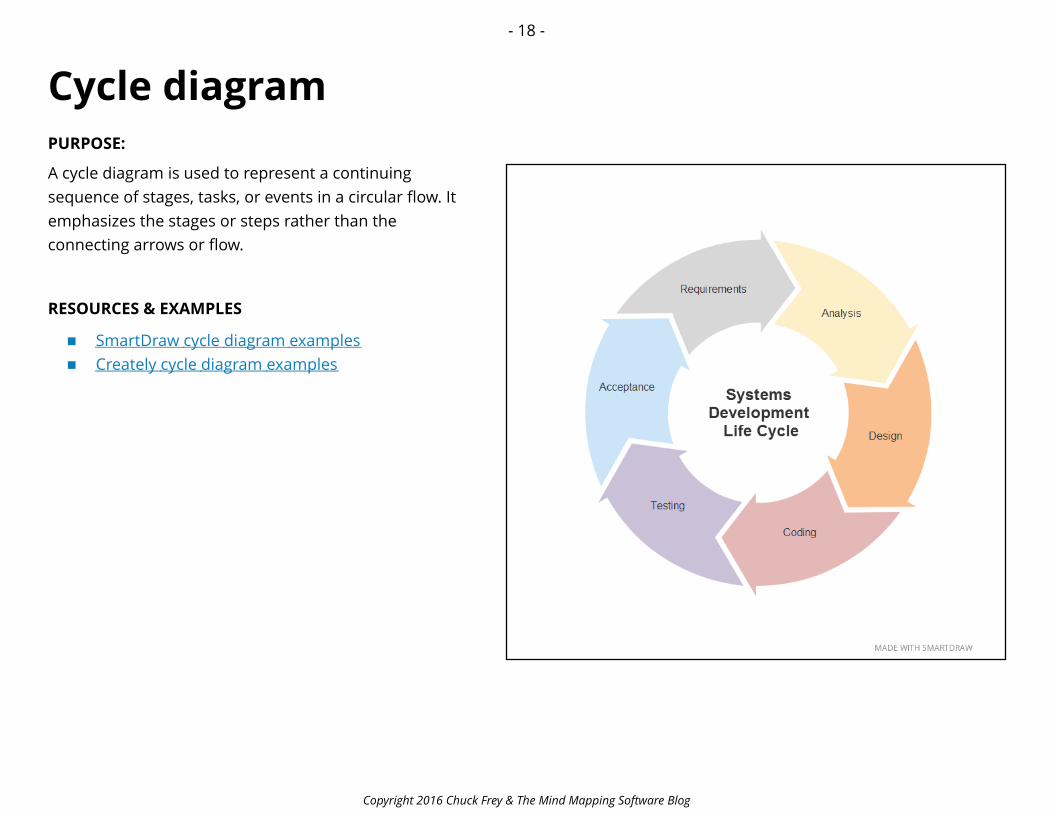
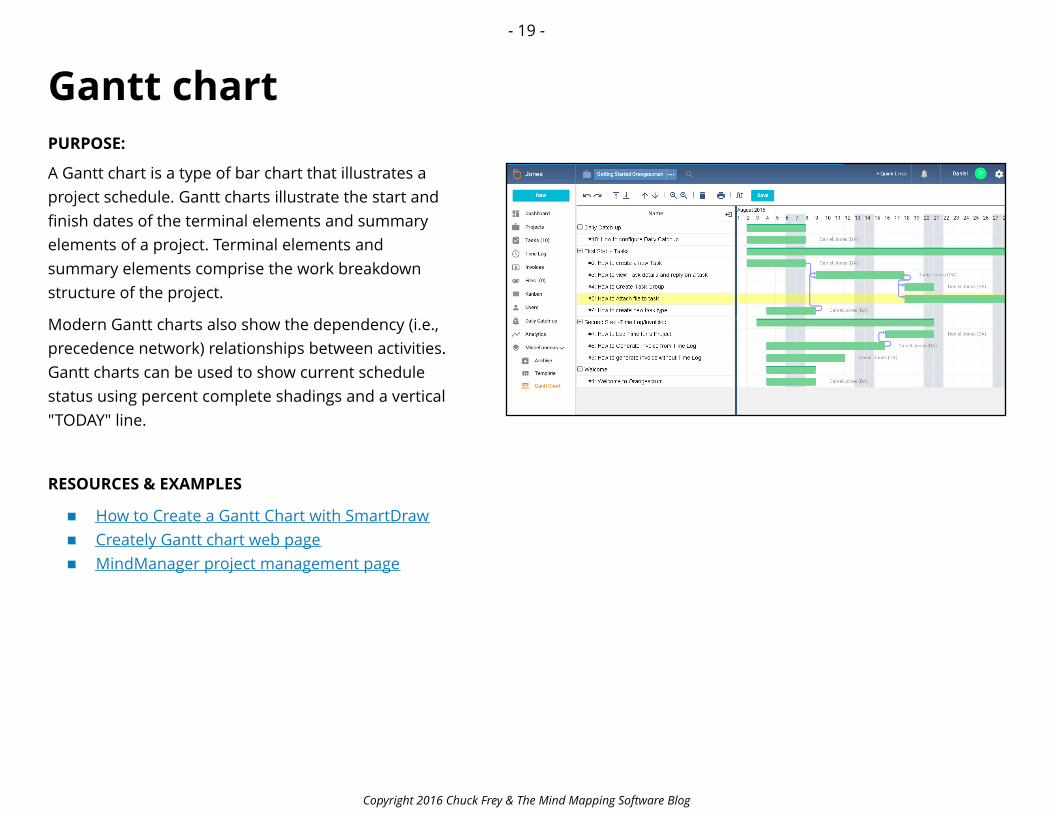
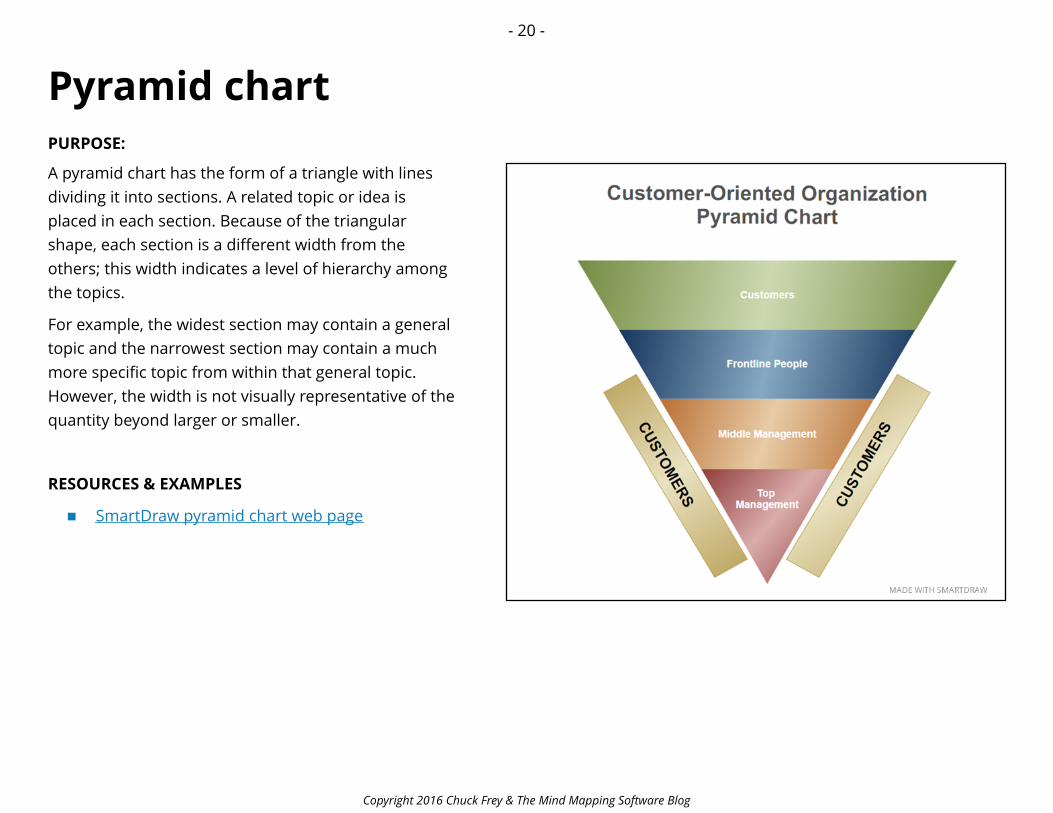
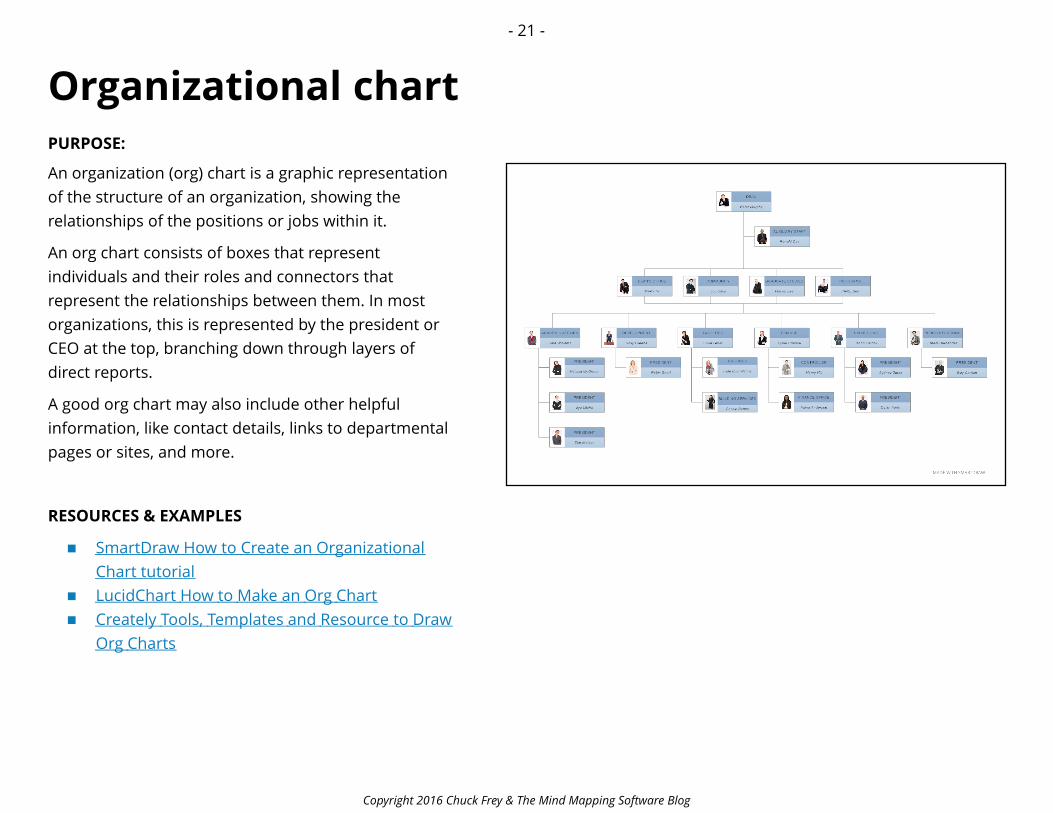
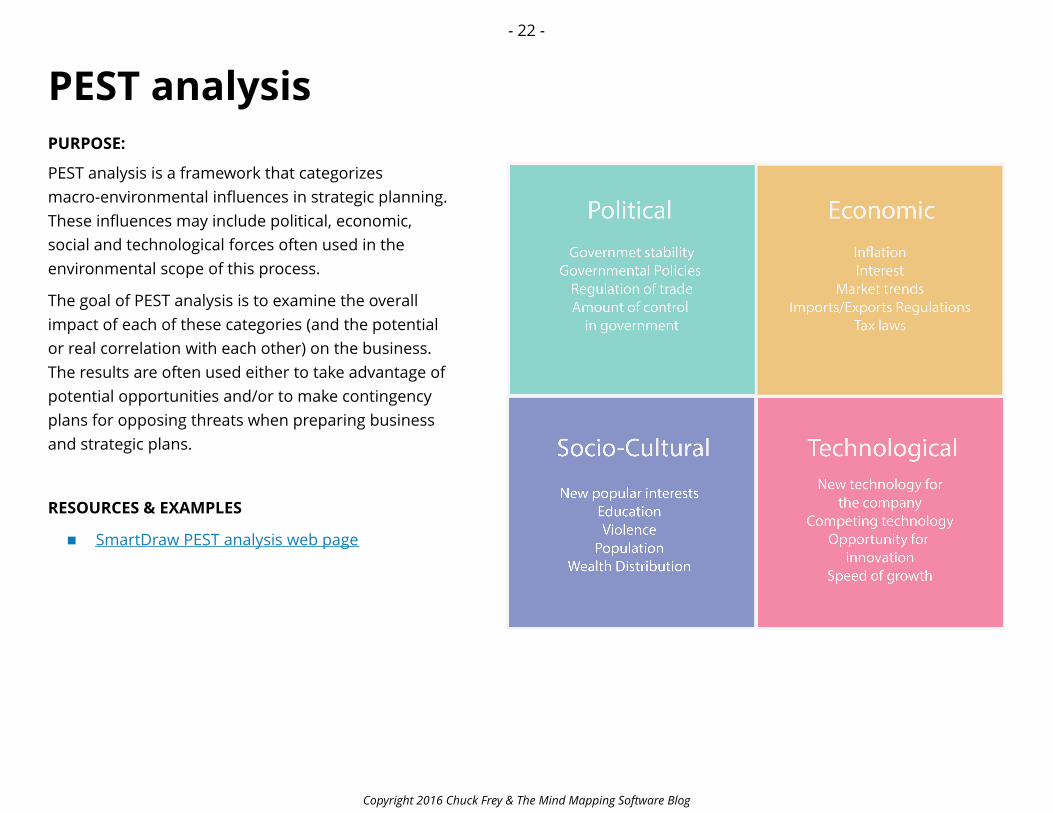
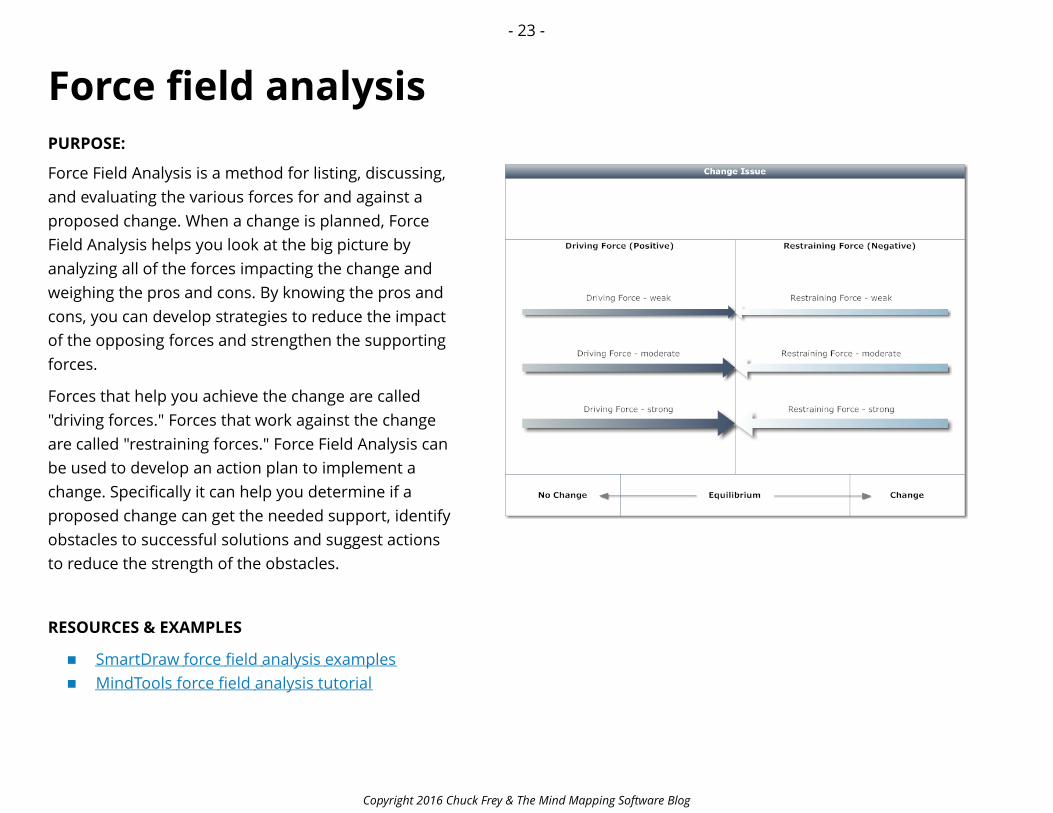
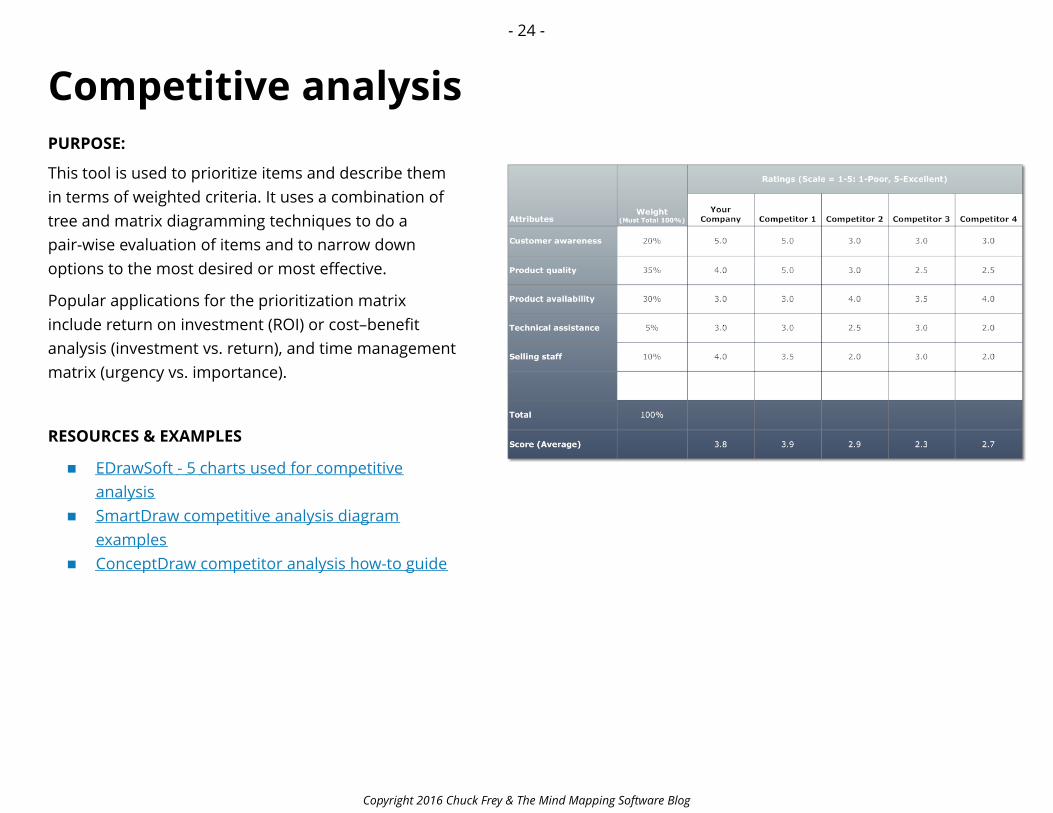
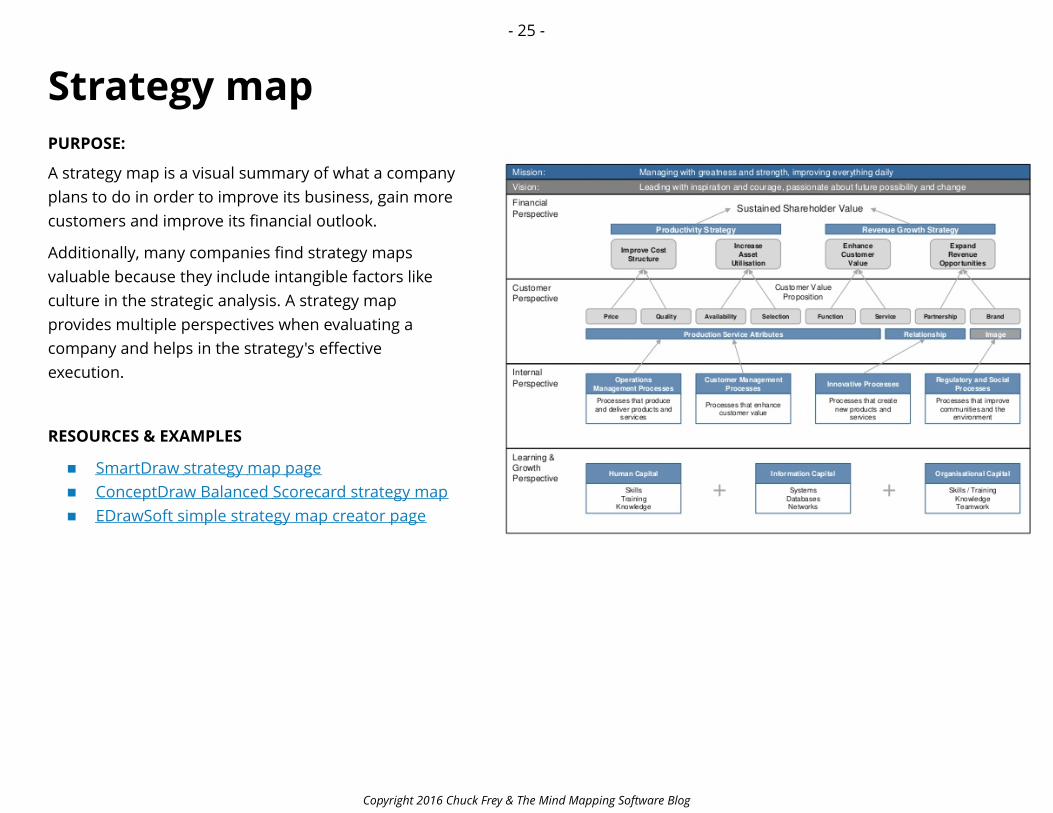
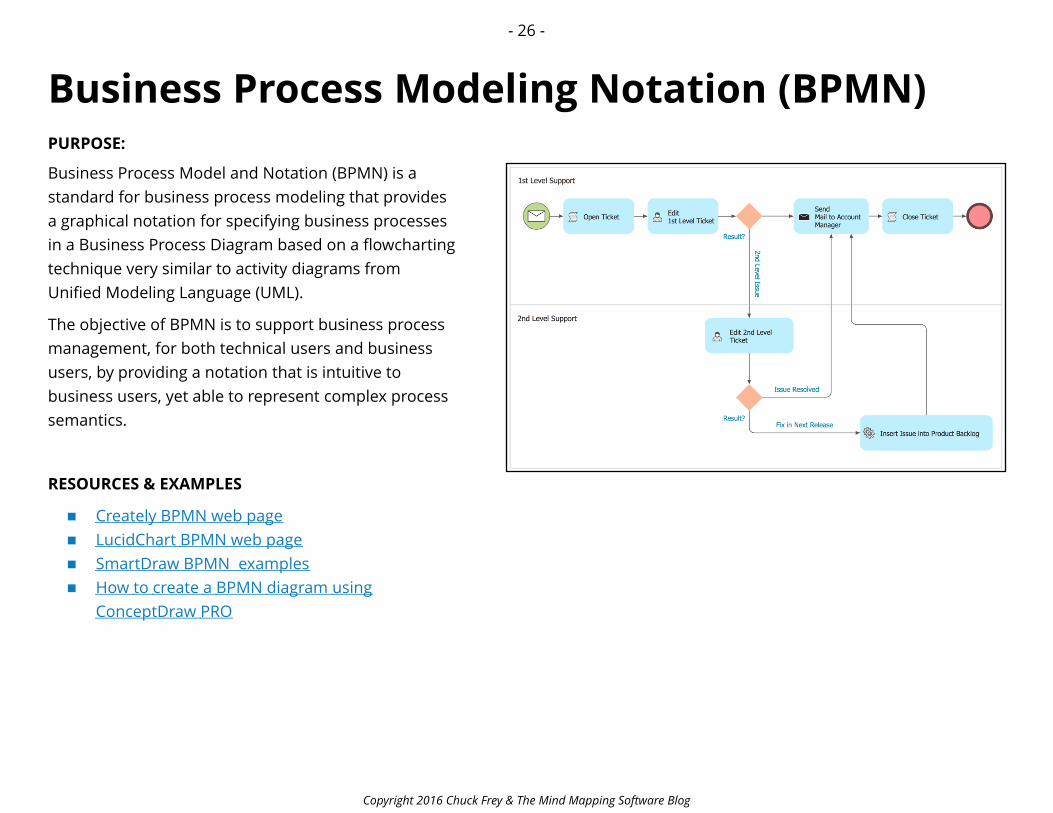
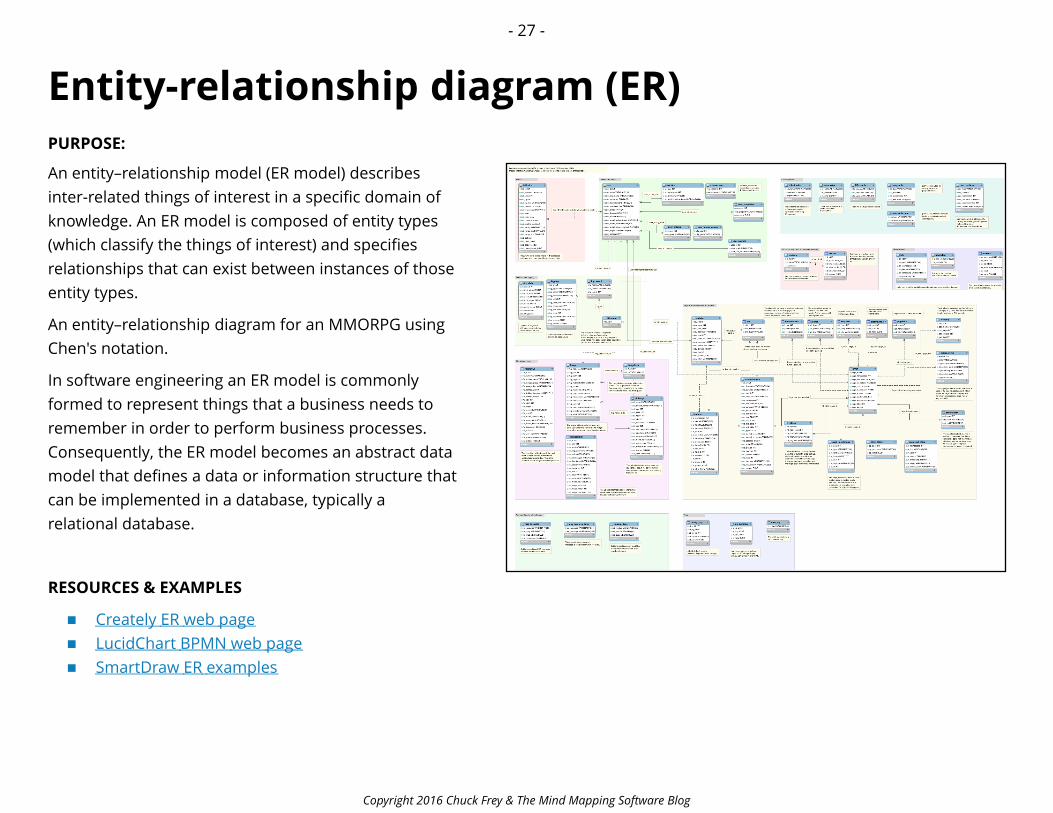
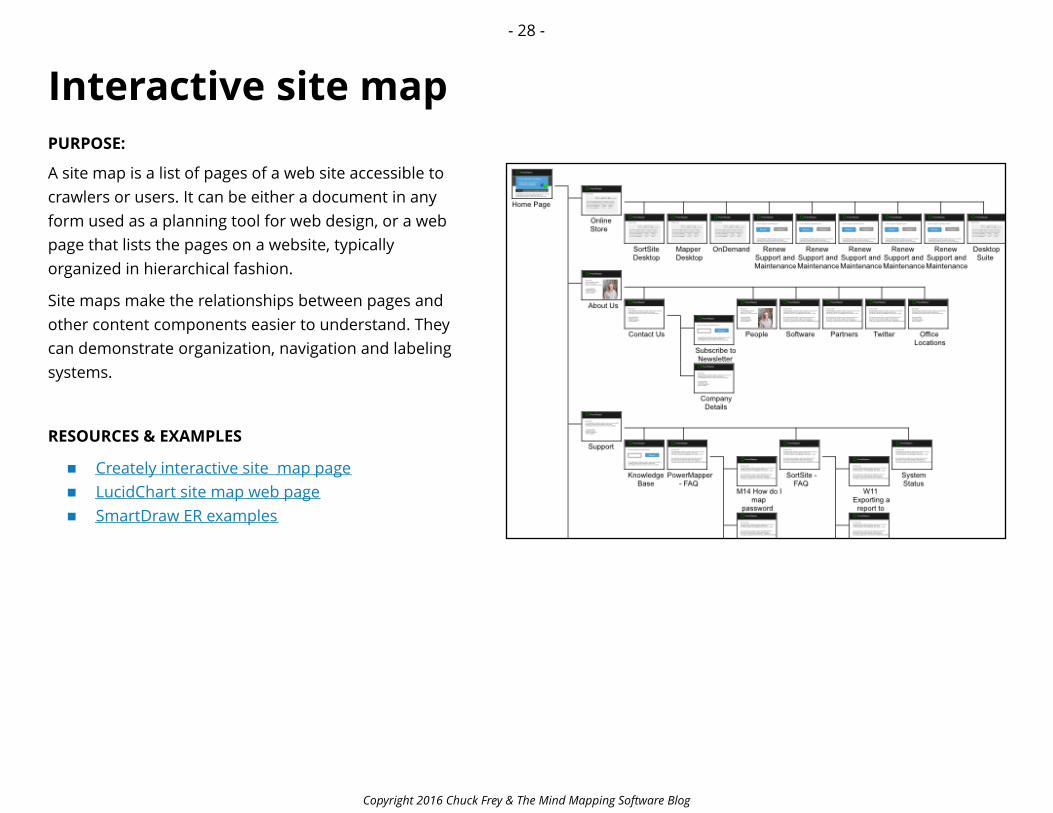
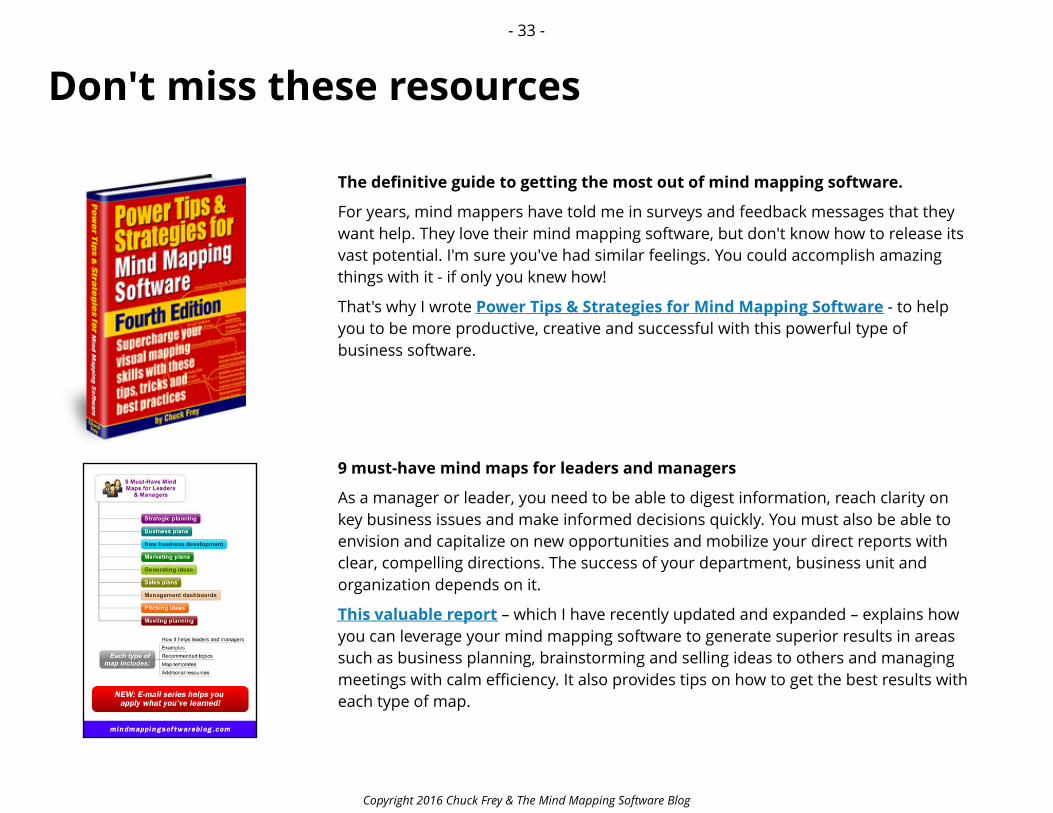
Recommended


![Getting Started with Lucidchart Webinar [Slides Only]](https://img.pdfslide.net/doc/110x75/58f044a51a28ab552b8b45f1/getting-started-with-lucidchart-webinar-slides-only.jpg)