INITIATING COVERAGE 22 MAY 2017
L&T Infotech BUY
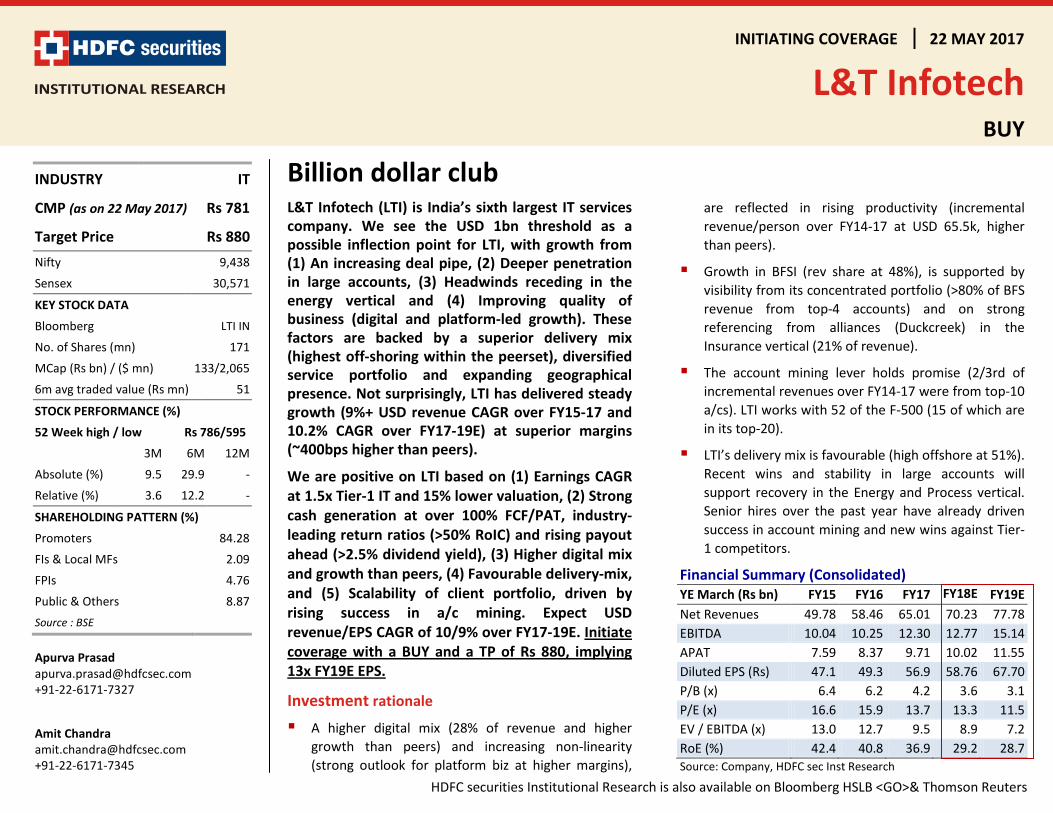
Billion dollar clubL&T Infotech (LTI) is India’s sixth largest IT services company. We see the USD 1bn threshold as a possible inflection point for LTI, with growth from (1) An increasing deal pipe, (2) Deeper penetration in large accounts, (3) Headwinds receding in the energy vertical and (4) Improving quality of business (digital and platform-led growth). These factors are backed by a superior delivery mix (highest off-shoring within the peerset), diversified service portfolio and expanding geographical presence. Not surprisingly, LTI has delivered steady growth (9%+ USD revenue CAGR over FY15-17 and 10.2% CAGR over FY17-19E) at superior margins (~400bps higher than peers).
We are positive on LTI based on (1) Earnings CAGR at 1.5x Tier-1 IT and 15% lower valuation, (2) Strong cash generation at over 100% FCF/PAT, industry-leading return ratios (>50% RoIC) and rising payout ahead (>2.5% dividend yield), (3) Higher digital mix and growth than peers, (4) Favourable delivery-mix, and (5) Scalability of client portfolio, driven by rising success in a/c mining. Expect USD revenue/EPS CAGR of 10/9% over FY17-19E. Initiate coverage with a BUY and a TP of Rs 880, implying 13x FY19E EPS.
Investment rationale
A higher digital mix (28% of revenue and higher growth than peers) and increasing non-linearity (strong outlook for platform biz at higher margins),
are reflected in rising productivity (incremental revenue/person over FY14-17 at USD 65.5k, higher than peers).
Growth in BFSI (rev share at 48%), is supported by visibility from its concentrated portfolio (>80% of BFS revenue from top-4 accounts) and on strong referencing from alliances (Duckcreek) in the Insurance vertical (21% of revenue).
The account mining lever holds promise (2/3rd of incremental revenues over FY14-17 were from top-10 a/cs). LTI works with 52 of the F-500 (15 of which are in its top-20).
LTI’s delivery mix is favourable (high offshore at 51%). Recent wins and stability in large accounts will support recovery in the Energy and Process vertical. Senior hires over the past year have already driven success in account mining and new wins against Tier-1 competitors.
Financial Summary (Consolidated) YE March (Rs bn) FY15 FY16 FY17 FY18E FY19E Net Revenues 49.78 58.46 65.01 70.23 77.78 EBITDA 10.04 10.25 12.30 12.77 15.14 APAT 7.59 8.37 9.71 10.02 11.55 Diluted EPS (Rs) 47.1 49.3 56.9 58.76 67.70 P/B (x) 6.4 6.2 4.2 3.6 3.1 P/E (x) 16.6 15.9 13.7 13.3 11.5 EV / EBITDA (x) 13.0 12.7 9.5 8.9 7.2 RoE (%) 42.4 40.8 36.9 29.2 28.7 Source: Company, HDFC sec Inst Research
INDUSTRY IT
CMP (as on 22 May 2017) Rs 781
Target Price Rs 880
Nifty 9,438
Sensex 30,571
KEY STOCK DATA
Bloomberg LTI IN
No. of Shares (mn) 171
MCap (Rs bn) / ($ mn) 133/2,065
6m avg traded value (Rs mn) 51
STOCK PERFORMANCE (%)
52 Week high / low Rs 786/595
3M 6M 12M
Absolute (%) 9.5 29.9 -
Relative (%) 3.6 12.2 -
SHAREHOLDING PATTERN (%)
Promoters 84.28
FIs & Local MFs 2.09
FPIs 4.76
Public & Others 8.87
Source : BSE
Apurva Prasad [email protected] +91-22-6171-7327
Amit Chandra [email protected] +91-22-6171-7345 HDFC securities Institutional Research is also available on Bloomberg HSLB <GO>& Thomson Reuters
L&T INFOTECH : INITIATING COVERAGE
LTI’s outperformanceEntry into USD1 bn+ will significantly improve the deal pipeline
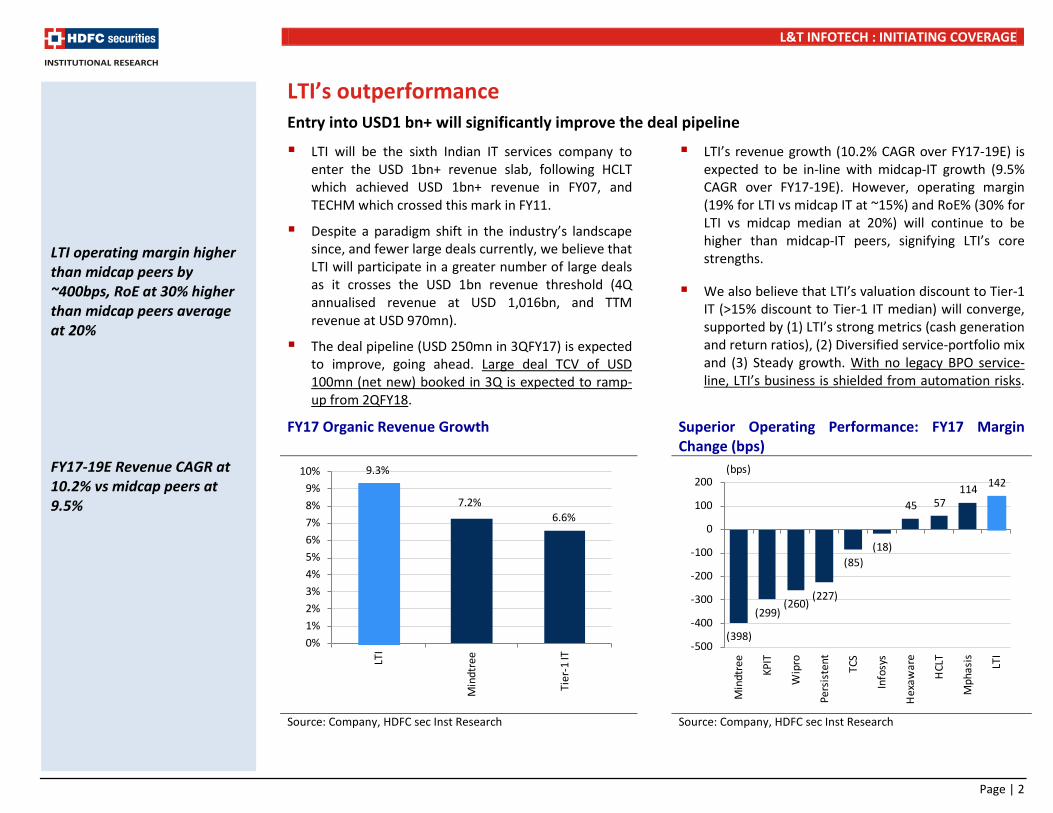
LTI will be the sixth Indian IT services company to enter the USD 1bn+ revenue slab, following HCLT which achieved USD 1bn+ revenue in FY07, and TECHM which crossed this mark in FY11.
Despite a paradigm shift in the industry’s landscape since, and fewer large deals currently, we believe that LTI will participate in a greater number of large deals as it crosses the USD 1bn revenue threshold (4Q annualised revenue at USD 1,016bn, and TTM revenue at USD 970mn).
The deal pipeline (USD 250mn in 3QFY17) is expected to improve, going ahead. Large deal TCV of USD 100mn (net new) booked in 3Q is expected to ramp-up from 2QFY18.
LTI’s revenue growth (10.2% CAGR over FY17-19E) is expected to be in-line with midcap-IT growth (9.5% CAGR over FY17-19E). However, operating margin (19% for LTI vs midcap IT at ~15%) and RoE% (30% for LTI vs midcap median at 20%) will continue to be higher than midcap-IT peers, signifying LTI’s core strengths.
We also believe that LTI’s valuation discount to Tier-1 IT (>15% discount to Tier-1 IT median) will converge, supported by (1) LTI’s strong metrics (cash generation and return ratios), (2) Diversified service-portfolio mix and (3) Steady growth. With no legacy BPO service-line, LTI’s business is shielded from automation risks.
FY17 Organic Revenue Growth Superior Operating Performance: FY17 Margin Change (bps)
Source: Company, HDFC sec Inst Research
Source: Company, HDFC sec Inst Research
9.3%
7.2%6.6%
0%
1%
2%
3%
4%
5%
6%
7%
8%
9%
10%
LTI
Min
dtre
e
Tier
-1 IT
LTI operating margin higher than midcap peers by ~400bps, RoE at 30% higher than midcap peers average at 20% FY17-19E Revenue CAGR at 10.2% vs midcap peers at 9.5%
(398)
(299)(260)
(227)
(85)(18)
45 57 114 142
-500
-400
-300
-200
-100
0
100
200
Min
dtre
e
KPIT
Wip
ro
Pers
iste
nt
TCS
Info
sys
Hex
awar
e
HCL
T
Mph
asis LTI
(bps)
Page | 2
L&T INFOTECH : INITIATING COVERAGE
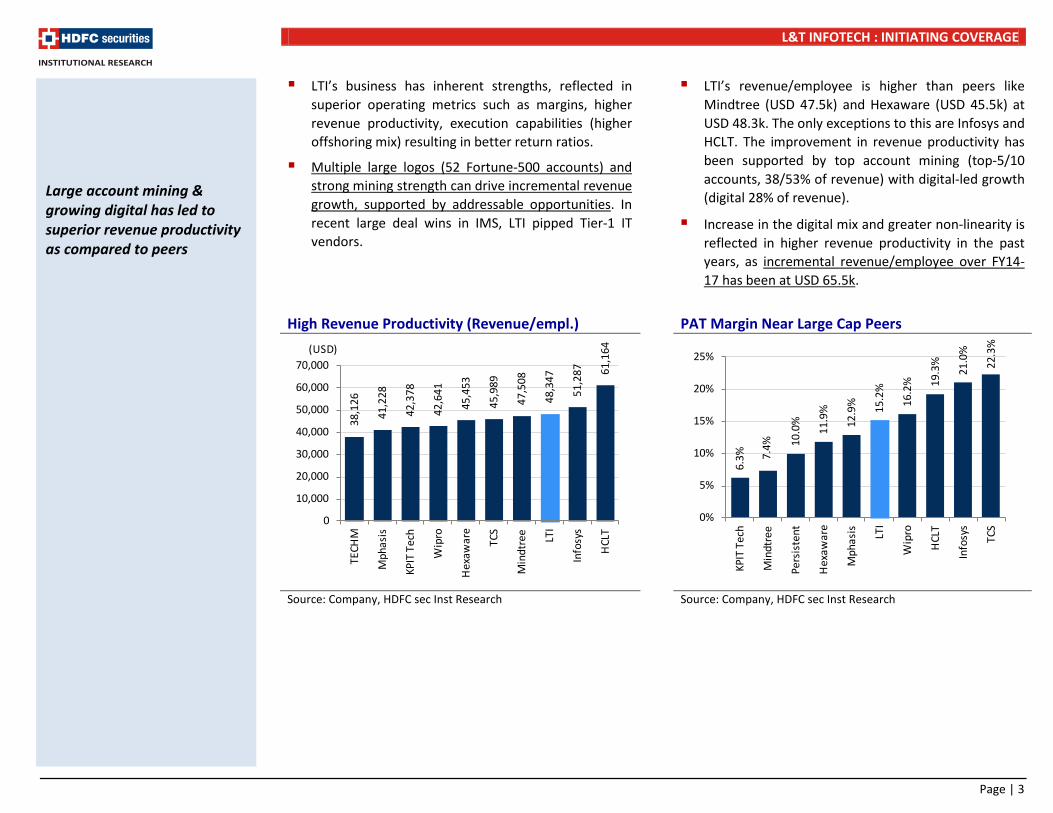
LTI’s business has inherent strengths, reflected in superior operating metrics such as margins, higher revenue productivity, execution capabilities (higher offshoring mix) resulting in better return ratios.
Multiple large logos (52 Fortune-500 accounts) and strong mining strength can drive incremental revenue growth, supported by addressable opportunities. In recent large deal wins in IMS, LTI pipped Tier-1 IT vendors.
LTI’s revenue/employee is higher than peers like Mindtree (USD 47.5k) and Hexaware (USD 45.5k) at USD 48.3k. The only exceptions to this are Infosys and HCLT. The improvement in revenue productivity has been supported by top account mining (top-5/10 accounts, 38/53% of revenue) with digital-led growth (digital 28% of revenue).
Increase in the digital mix and greater non-linearity is reflected in higher revenue productivity in the past years, as incremental revenue/employee over FY14-17 has been at USD 65.5k.
High Revenue Productivity (Revenue/empl.) PAT Margin Near Large Cap Peers
Source: Company, HDFC sec Inst Research
Source: Company, HDFC sec Inst Research
38,1
26
41,2
28
42,3
78
42,6
41
45,4
53
45,9
89
47,5
08
48,3
47
51,2
87
61,1
64
0
10,000
20,000
30,000
40,000
50,000
60,000
70,000TE
CHM
Mph
asis
KPIT
Tec
h
Wip
ro
Hex
awar
e
TCS
Min
dtre
e
LTI
Info
sys
HCL
T
(USD)
6.3% 7.
4% 10.0
%
11.9
%
12.9
% 15.2
%
16.2
% 19.3
%
21.0
%
22.3
%
0%
5%
10%
15%
20%
25%
KPIT
Tec
h
Min
dtre
e
Pers
iste
nt
Hex
awar
e
Mph
asis LTI
Wip
ro
HCL
T
Info
sys
TCS
Large account mining & growing digital has led to superior revenue productivity as compared to peers
Page | 3
L&T INFOTECH : INITIATING COVERAGE
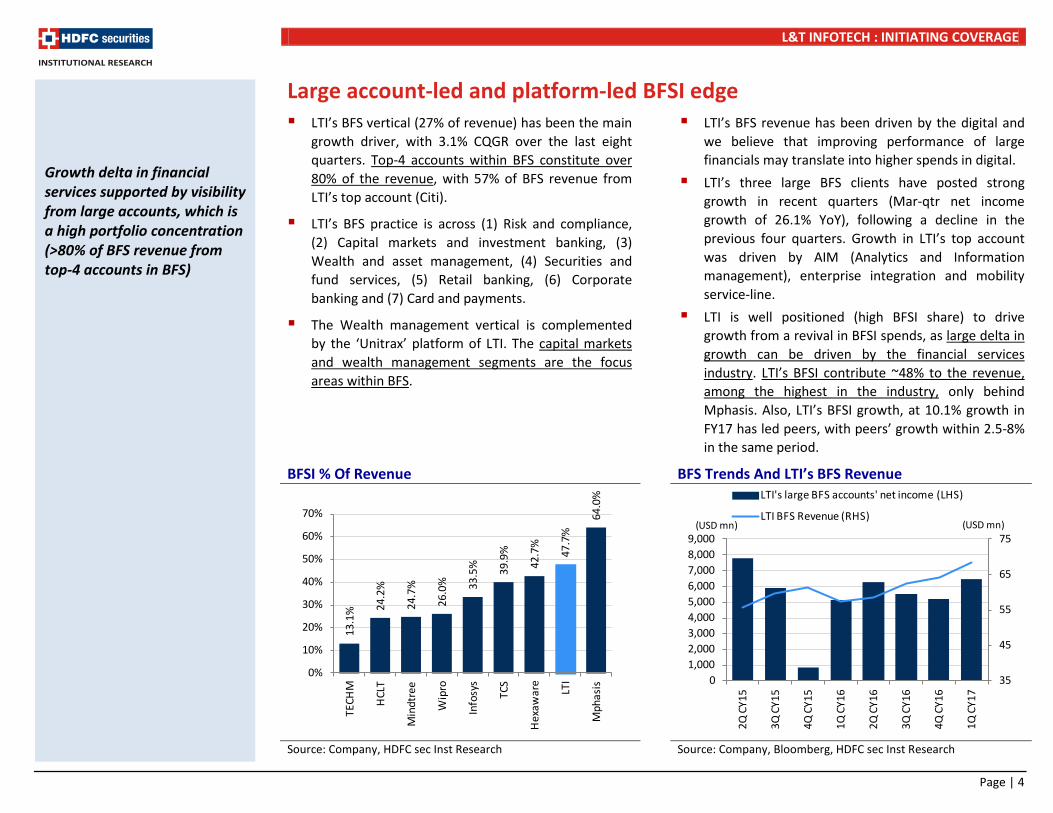
Large account-led and platform-led BFSI edge LTI’s BFS vertical (27% of revenue) has been the main
growth driver, with 3.1% CQGR over the last eight quarters. Top-4 accounts within BFS constitute over 80% of the revenue, with 57% of BFS revenue from LTI’s top account (Citi).
LTI’s BFS practice is across (1) Risk and compliance, (2) Capital markets and investment banking, (3) Wealth and asset management, (4) Securities and fund services, (5) Retail banking, (6) Corporate banking and (7) Card and payments.
The Wealth management vertical is complemented by the ‘Unitrax’ platform of LTI. The capital markets and wealth management segments are the focus areas within BFS.
LTI’s BFS revenue has been driven by the digital and we believe that improving performance of large financials may translate into higher spends in digital.
LTI’s three large BFS clients have posted strong growth in recent quarters (Mar-qtr net income growth of 26.1% YoY), following a decline in the previous four quarters. Growth in LTI’s top account was driven by AIM (Analytics and Information management), enterprise integration and mobility service-line.
LTI is well positioned (high BFSI share) to drive growth from a revival in BFSI spends, as large delta in growth can be driven by the financial services industry. LTI’s BFSI contribute ~48% to the revenue, among the highest in the industry, only behind Mphasis. Also, LTI’s BFSI growth, at 10.1% growth in FY17 has led peers, with peers’ growth within 2.5-8% in the same period.
BFSI % Of Revenue BFS Trends And LTI’s BFS Revenue
Source: Company, HDFC sec Inst Research Source: Company, Bloomberg, HDFC sec Inst Research
Growth delta in financial services supported by visibility from large accounts, which is a high portfolio concentration (>80% of BFS revenue from top-4 accounts in BFS)
35
45
55
65
75
01,0002,0003,0004,0005,0006,0007,0008,0009,000
2Q C
Y15
3Q C
Y15
4Q C
Y15
1Q C
Y16
2Q C
Y16
3Q C
Y16
4Q C
Y16
1Q C
Y17
LTI's large BFS accounts' net income (LHS)
LTI BFS Revenue (RHS)(USD mn) (USD mn)
13.1
% 24.2
%
24.7
%
26.0
% 33.5
% 39.9
%
42.7
%
47.7
%
64.0
%
0%
10%
20%
30%
40%
50%
60%
70%
TECH
M
HCL
T
Min
dtre
e
Wip
ro
Info
sys
TCS
Hex
awar
e
LTI
Mph
asis
Page | 4
L&T INFOTECH : INITIATING COVERAGE
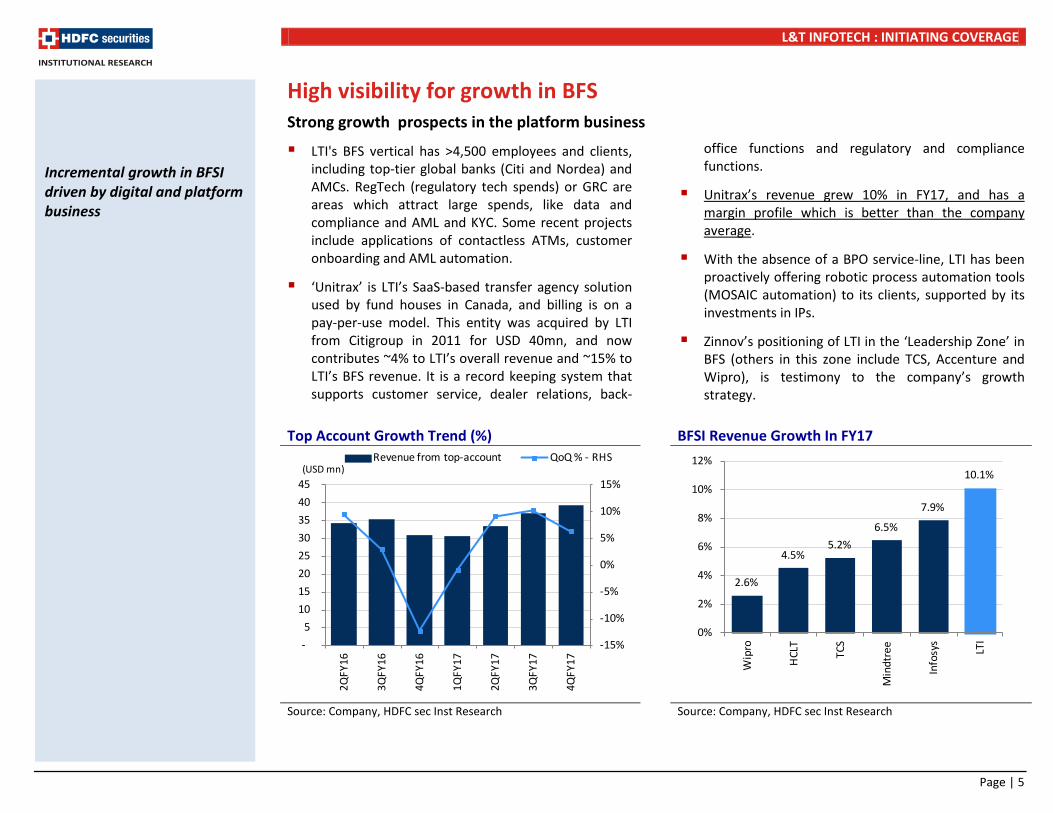
High visibility for growth in BFS Strong growth prospects in the platform business
LTI's BFS vertical has >4,500 employees and clients, including top-tier global banks (Citi and Nordea) and AMCs. RegTech (regulatory tech spends) or GRC are areas which attract large spends, like data and compliance and AML and KYC. Some recent projects include applications of contactless ATMs, customer onboarding and AML automation.
‘Unitrax’ is LTI’s SaaS-based transfer agency solution used by fund houses in Canada, and billing is on a pay-per-use model. This entity was acquired by LTI from Citigroup in 2011 for USD 40mn, and now contributes ~4% to LTI’s overall revenue and ~15% to LTI’s BFS revenue. It is a record keeping system that supports customer service, dealer relations, back-
office functions and regulatory and compliance functions.
Unitrax’s revenue grew 10% in FY17, and has a margin profile which is better than the company average.
With the absence of a BPO service-line, LTI has been proactively offering robotic process automation tools (MOSAIC automation) to its clients, supported by its investments in IPs.
Zinnov’s positioning of LTI in the ‘Leadership Zone’ in BFS (others in this zone include TCS, Accenture and Wipro), is testimony to the company’s growth strategy.
Top Account Growth Trend (%) BFSI Revenue Growth In FY17
Source: Company, HDFC sec Inst Research Source: Company, HDFC sec Inst Research
-15%
-10%
-5%
0%
5%
10%
15%
-
5
10
15
20
25
30
35
40
45
2QFY
16
3QFY
16
4QFY
16
1QFY
17
2QFY
17
3QFY
17
4QFY
17
Revenue from top-account QoQ % - RHS(USD mn)
2.6%
4.5%5.2%
6.5%
7.9%
10.1%
0%
2%
4%
6%
8%
10%
12%
Wip
ro
HCL
T
TCS
Min
dtre
e
Info
sys
LTI
Incremental growth in BFSI driven by digital and platform business
Page | 5
L&T INFOTECH : INITIATING COVERAGE
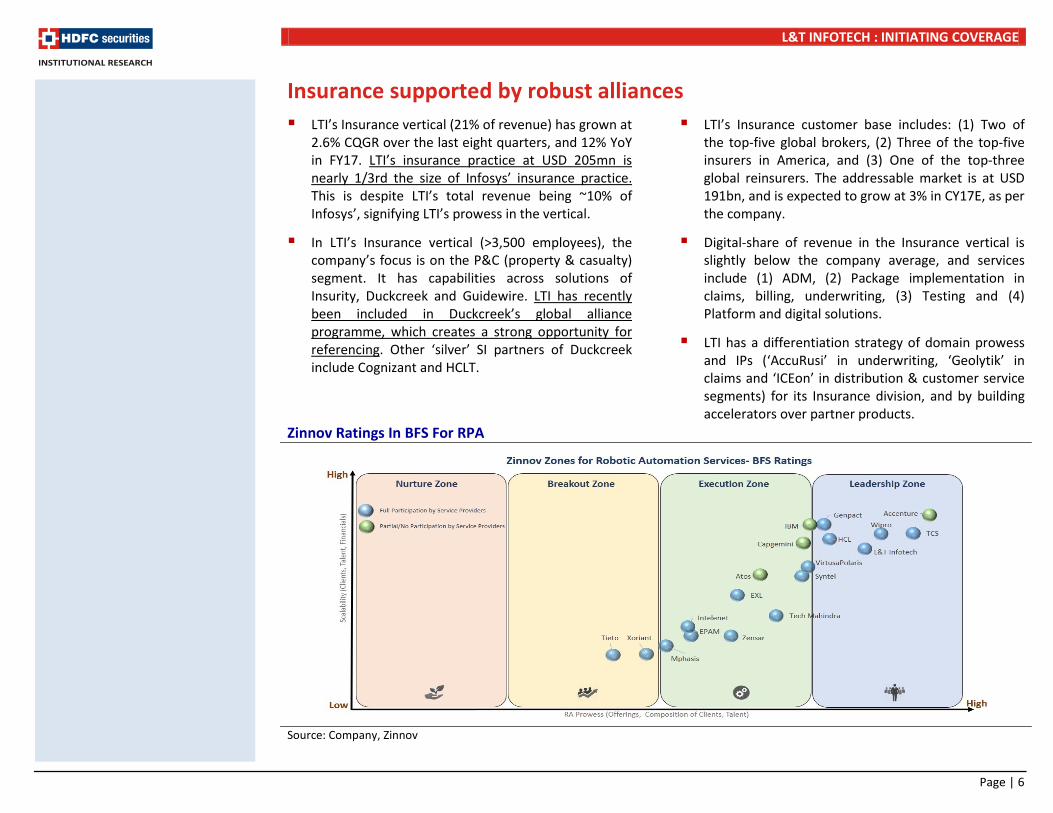
Insurance supported by robust alliances LTI’s Insurance vertical (21% of revenue) has grown at
2.6% CQGR over the last eight quarters, and 12% YoY in FY17. LTI’s insurance practice at USD 205mn is nearly 1/3rd the size of Infosys’ insurance practice. This is despite LTI’s total revenue being ~10% of Infosys’, signifying LTI’s prowess in the vertical.
In LTI’s Insurance vertical (>3,500 employees), the company’s focus is on the P&C (property & casualty) segment. It has capabilities across solutions of Insurity, Duckcreek and Guidewire. LTI has recently been included in Duckcreek’s global alliance programme, which creates a strong opportunity for referencing. Other ‘silver’ SI partners of Duckcreek include Cognizant and HCLT.
LTI’s Insurance customer base includes: (1) Two of the top-five global brokers, (2) Three of the top-five insurers in America, and (3) One of the top-three global reinsurers. The addressable market is at USD 191bn, and is expected to grow at 3% in CY17E, as per the company.
Digital-share of revenue in the Insurance vertical is slightly below the company average, and services include (1) ADM, (2) Package implementation in claims, billing, underwriting, (3) Testing and (4) Platform and digital solutions.
LTI has a differentiation strategy of domain prowess and IPs (‘AccuRusi’ in underwriting, ‘Geolytik’ in claims and ‘ICEon’ in distribution & customer service segments) for its Insurance division, and by building accelerators over partner products.
Zinnov Ratings In BFS For RPA
Source: Company, Zinnov
Page | 6
L&T INFOTECH : INITIATING COVERAGE
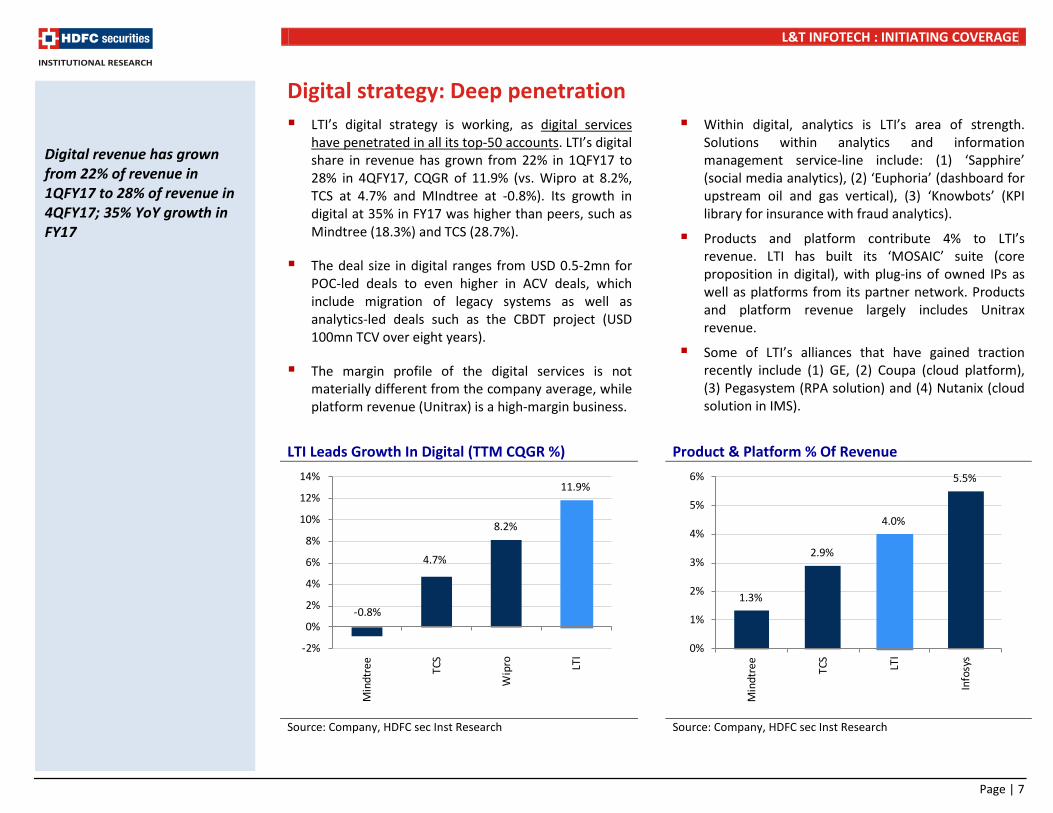
Digital strategy: Deep penetration LTI’s digital strategy is working, as digital services
have penetrated in all its top-50 accounts. LTI’s digital share in revenue has grown from 22% in 1QFY17 to 28% in 4QFY17, CQGR of 11.9% (vs. Wipro at 8.2%, TCS at 4.7% and MIndtree at -0.8%). Its growth in digital at 35% in FY17 was higher than peers, such as Mindtree (18.3%) and TCS (28.7%).
The deal size in digital ranges from USD 0.5-2mn for POC-led deals to even higher in ACV deals, which include migration of legacy systems as well as analytics-led deals such as the CBDT project (USD 100mn TCV over eight years).
The margin profile of the digital services is not materially different from the company average, while platform revenue (Unitrax) is a high-margin business.
Within digital, analytics is LTI’s area of strength. Solutions within analytics and information management service-line include: (1) ‘Sapphire’ (social media analytics), (2) ‘Euphoria’ (dashboard for upstream oil and gas vertical), (3) ‘Knowbots’ (KPI library for insurance with fraud analytics).
Products and platform contribute 4% to LTI’s revenue. LTI has built its ‘MOSAIC’ suite (core proposition in digital), with plug-ins of owned IPs as well as platforms from its partner network. Products and platform revenue largely includes Unitrax revenue.
Some of LTI’s alliances that have gained traction recently include (1) GE, (2) Coupa (cloud platform), (3) Pegasystem (RPA solution) and (4) Nutanix (cloud solution in IMS).
LTI Leads Growth In Digital (TTM CQGR %) Product & Platform % Of Revenue
Source: Company, HDFC sec Inst Research Source: Company, HDFC sec Inst Research
1.3%
2.9%
4.0%
5.5%
0%
1%
2%
3%
4%
5%
6%
Min
dtre
e
TCS
LTI
Info
sys
Digital revenue has grown from 22% of revenue in 1QFY17 to 28% of revenue in 4QFY17; 35% YoY growth in FY17
-0.8%
4.7%
8.2%
11.9%
-2%
0%
2%
4%
6%
8%
10%
12%
14%
Min
dtre
e
TCS
Wip
ro LTI
Page | 7
L&T INFOTECH : INITIATING COVERAGE
RoE (%) Higher Than Peers Growth In Rev/Employee In FY17
Source: Company, HDFC sec Inst Research; FY18E RoE% Source: Company, HDFC sec Inst Research
Revenue CAGR (FY14-17) Earnings CAGR (FY14-17)
Source: Company, HDFC sec Inst Research, * Dec Y/E Source: Company, HDFC sec Inst Research, * Dec Y/E
12.7
13.0
16.5
19.1
19.1
19.2
23.9
24.2
29.2
30.1
0
5
10
15
20
25
30
35
Mph
asis
KPIT
Tec
h
Pers
iste
nt
Min
dtre
e
Zens
ar
Cyie
nt
Hex
awar
e
eCle
rx LTI
Sona
ta
(%)
-7.7%
-3.8%
-1.6%-0.1%
1.8%
3.7% 3.9% 4.4%5.8%
-10%
-8%
-6%
-4%
-2%
0%
2%
4%
6%
8%
KPIT
Tec
h
TCS
Mph
asis
Wip
ro
Info
sys
HCL
T
Hex
awar
e
LTI
Min
dtre
e
9.3%7.4%
5.3%
10.4%9.1%
-1.9%
15.8%
12.1%
16.1%
3.6%
-4%-2%0%2%4%6%8%
10%12%14%16%18%
TCS
Info
sys
Wip
ro
HCL
T
L&T
Info
tech
Mph
asis
Min
dtre
e
Hex
awar
e *
Pers
iste
nt
KPIT
Tec
h
10.9% 10.5%
2.3%
11.7%11.6%
5.9%
-2.7%
3.0%
7.6%
-4.8%-6%-4%-2%0%2%4%6%8%
10%12%14%
TCS
Info
sys
Wip
ro
HCL
T
L&T
Info
tech
Mph
asis
Min
dtre
e
Hex
awar
e *
Pers
iste
nt
KPIT
Tec
h
Page | 8
L&T INFOTECH : INITIATING COVERAGE
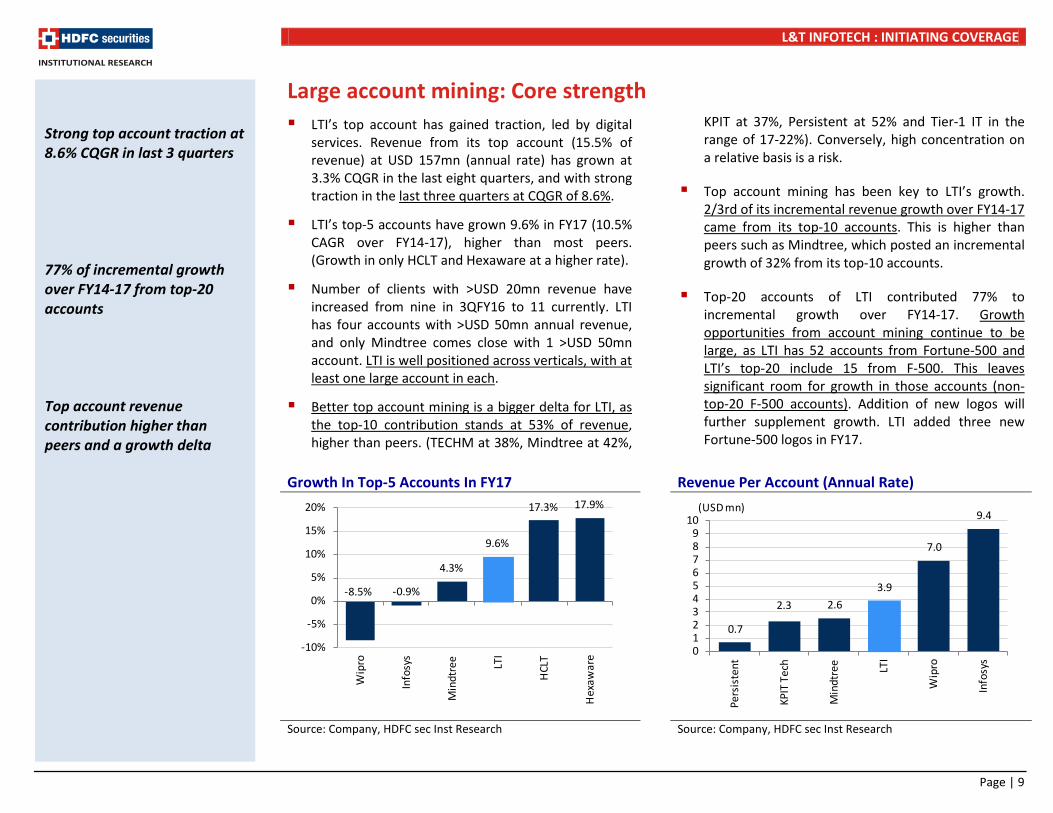
Large account mining: Core strength LTI’s top account has gained traction, led by digital
services. Revenue from its top account (15.5% of revenue) at USD 157mn (annual rate) has grown at 3.3% CQGR in the last eight quarters, and with strong traction in the last three quarters at CQGR of 8.6%.
LTI’s top-5 accounts have grown 9.6% in FY17 (10.5% CAGR over FY14-17), higher than most peers. (Growth in only HCLT and Hexaware at a higher rate).
Number of clients with >USD 20mn revenue have increased from nine in 3QFY16 to 11 currently. LTI has four accounts with >USD 50mn annual revenue, and only Mindtree comes close with 1 >USD 50mn account. LTI is well positioned across verticals, with at least one large account in each.
Better top account mining is a bigger delta for LTI, as the top-10 contribution stands at 53% of revenue, higher than peers. (TECHM at 38%, Mindtree at 42%,
KPIT at 37%, Persistent at 52% and Tier-1 IT in the range of 17-22%). Conversely, high concentration on a relative basis is a risk.
Top account mining has been key to LTI’s growth. 2/3rd of its incremental revenue growth over FY14-17 came from its top-10 accounts. This is higher than peers such as Mindtree, which posted an incremental growth of 32% from its top-10 accounts.
Top-20 accounts of LTI contributed 77% to incremental growth over FY14-17. Growth opportunities from account mining continue to be large, as LTI has 52 accounts from Fortune-500 and LTI’s top-20 include 15 from F-500. This leaves significant room for growth in those accounts (non-top-20 F-500 accounts). Addition of new logos will further supplement growth. LTI added three new Fortune-500 logos in FY17.
Growth In Top-5 Accounts In FY17 Revenue Per Account (Annual Rate)
Source: Company, HDFC sec Inst Research Source: Company, HDFC sec Inst Research
0.7
2.3 2.6
3.9
7.0
9.4
0123456789
10
Pers
iste
nt
KPIT
Tec
h
Min
dtre
e
LTI
Wip
ro
Info
sys
(USD mn)
-8.5% -0.9%
4.3%
9.6%
17.3% 17.9%
-10%
-5%
0%
5%
10%
15%
20%
Wip
ro
Info
sys
Min
dtre
e
LTI
HCL
T
Hex
awar
e
Strong top account traction at 8.6% CQGR in last 3 quarters 77% of incremental growth over FY14-17 from top-20 accounts Top account revenue contribution higher than peers and a growth delta
Page | 9
L&T INFOTECH : INITIATING COVERAGE
Balanced geographical revenue mix Geo expansion
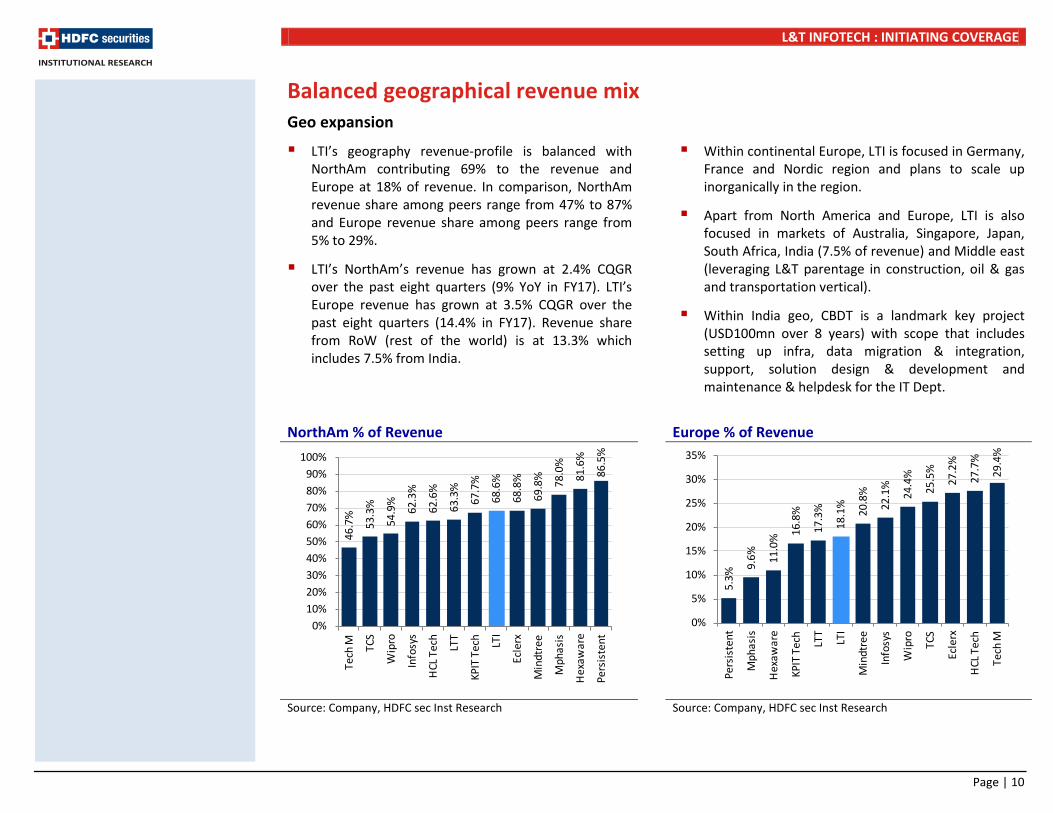
LTI’s geography revenue-profile is balanced with NorthAm contributing 69% to the revenue and Europe at 18% of revenue. In comparison, NorthAm revenue share among peers range from 47% to 87% and Europe revenue share among peers range from 5% to 29%.
LTI’s NorthAm’s revenue has grown at 2.4% CQGR over the past eight quarters (9% YoY in FY17). LTI’s Europe revenue has grown at 3.5% CQGR over the past eight quarters (14.4% in FY17). Revenue share from RoW (rest of the world) is at 13.3% which includes 7.5% from India.
Within continental Europe, LTI is focused in Germany, France and Nordic region and plans to scale up inorganically in the region.
Apart from North America and Europe, LTI is also focused in markets of Australia, Singapore, Japan, South Africa, India (7.5% of revenue) and Middle east (leveraging L&T parentage in construction, oil & gas and transportation vertical).
Within India geo, CBDT is a landmark key project (USD100mn over 8 years) with scope that includes setting up infra, data migration & integration, support, solution design & development and maintenance & helpdesk for the IT Dept.
NorthAm % of Revenue Europe % of Revenue
Source: Company, HDFC sec Inst Research Source: Company, HDFC sec Inst Research
46.7
%
53.3
%
54.9
%
62.3
%
62.6
%
63.3
%
67.7
%
68.6
%
68.8
%
69.8
%
78.0
%
81.6
%
86.5
%
0%10%20%30%40%50%60%70%80%90%
100%
Tech
M TCS
Wip
ro
Info
sys
HCL
Tec
h
LTT
KPIT
Tec
h
LTI
Ecle
rx
Min
dtre
e
Mph
asis
Hex
awar
e
Pers
iste
nt
5.3%
9.6% 11
.0% 16
.8%
17.3
%
18.1
%
20.8
%
22.1
%
24.4
%
25.5
%
27.2
%
27.7
%
29.4
%
0%
5%
10%
15%
20%
25%
30%
35%
Pers
iste
nt
Mph
asis
Hex
awar
e
KPIT
Tec
h
LTT
LTI
Min
dtre
e
Info
sys
Wip
ro
TCS
Ecle
rx
HCL
Tec
h
Tech
M
Page | 10
L&T INFOTECH : INITIATING COVERAGE
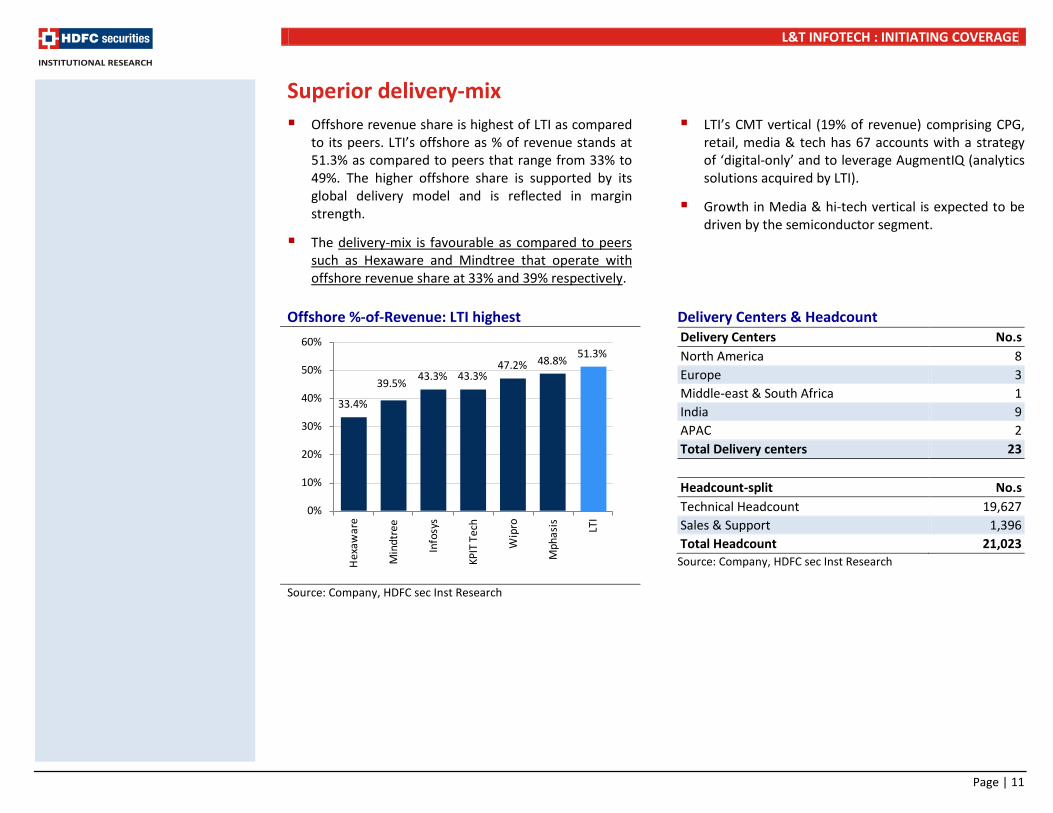
Superior delivery-mix Offshore revenue share is highest of LTI as compared
to its peers. LTI’s offshore as % of revenue stands at 51.3% as compared to peers that range from 33% to 49%. The higher offshore share is supported by its global delivery model and is reflected in margin strength.
The delivery-mix is favourable as compared to peers such as Hexaware and Mindtree that operate with offshore revenue share at 33% and 39% respectively.
LTI’s CMT vertical (19% of revenue) comprising CPG, retail, media & tech has 67 accounts with a strategy of ‘digital-only’ and to leverage AugmentIQ (analytics solutions acquired by LTI).
Growth in Media & hi-tech vertical is expected to be driven by the semiconductor segment.
Offshore %-of-Revenue: LTI highest Delivery Centers & Headcount
Delivery Centers No.s North America 8 Europe 3 Middle-east & South Africa 1 India 9 APAC 2 Total Delivery centers 23
Headcount-split No.s Technical Headcount 19,627 Sales & Support 1,396 Total Headcount 21,023
Source: Company, HDFC sec Inst Research
Source: Company, HDFC sec Inst Research
33.4%
39.5%43.3% 43.3%
47.2% 48.8%51.3%
0%
10%
20%
30%
40%
50%
60%H
exaw
are
Min
dtre
e
Info
sys
KPIT
Tec
h
Wip
ro
Mph
asis LTI
Page | 11
L&T INFOTECH : INITIATING COVERAGE
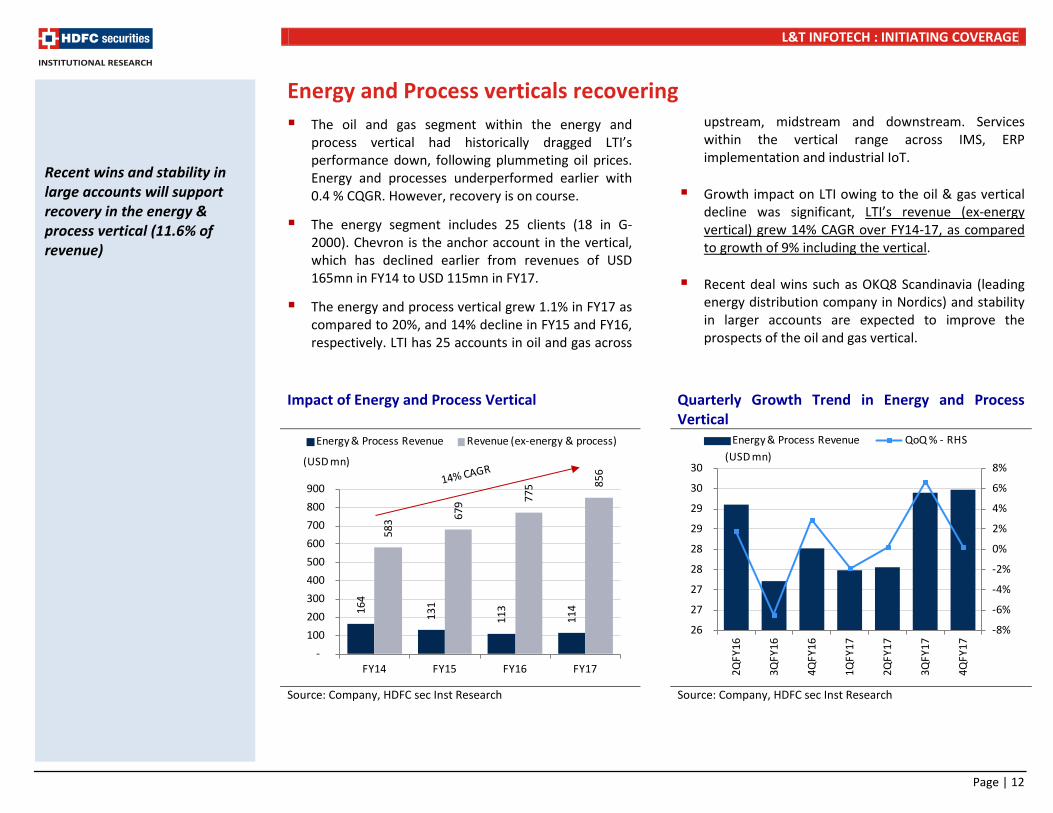
Energy and Process verticals recovering The oil and gas segment within the energy and
process vertical had historically dragged LTI’s performance down, following plummeting oil prices. Energy and processes underperformed earlier with 0.4 % CQGR. However, recovery is on course.
The energy segment includes 25 clients (18 in G-2000). Chevron is the anchor account in the vertical, which has declined earlier from revenues of USD 165mn in FY14 to USD 115mn in FY17.
The energy and process vertical grew 1.1% in FY17 as compared to 20%, and 14% decline in FY15 and FY16, respectively. LTI has 25 accounts in oil and gas across
upstream, midstream and downstream. Services within the vertical range across IMS, ERP implementation and industrial IoT.
Growth impact on LTI owing to the oil & gas vertical decline was significant, LTI’s revenue (ex-energy vertical) grew 14% CAGR over FY14-17, as compared to growth of 9% including the vertical.
Recent deal wins such as OKQ8 Scandinavia (leading energy distribution company in Nordics) and stability in larger accounts are expected to improve the prospects of the oil and gas vertical.
Impact of Energy and Process Vertical Quarterly Growth Trend in Energy and Process
Vertical
Source: Company, HDFC sec Inst Research Source: Company, HDFC sec Inst Research
164
131
113
114
583 67
9 775 85
6
-
100
200
300
400
500
600
700
800
900
FY14 FY15 FY16 FY17
Energy & Process Revenue Revenue (ex-energy & process)
(USD mn)
Recent wins and stability in large accounts will support recovery in the energy & process vertical (11.6% of revenue)
-8%
-6%
-4%
-2%
0%
2%
4%
6%
8%
26
27
27
28
28
29
29
30
30
2QFY
16
3QFY
16
4QFY
16
1QFY
17
2QFY
17
3QFY
17
4QFY
17
Energy & Process Revenue QoQ % - RHS(USD mn)
Page | 12
L&T INFOTECH : INITIATING COVERAGE
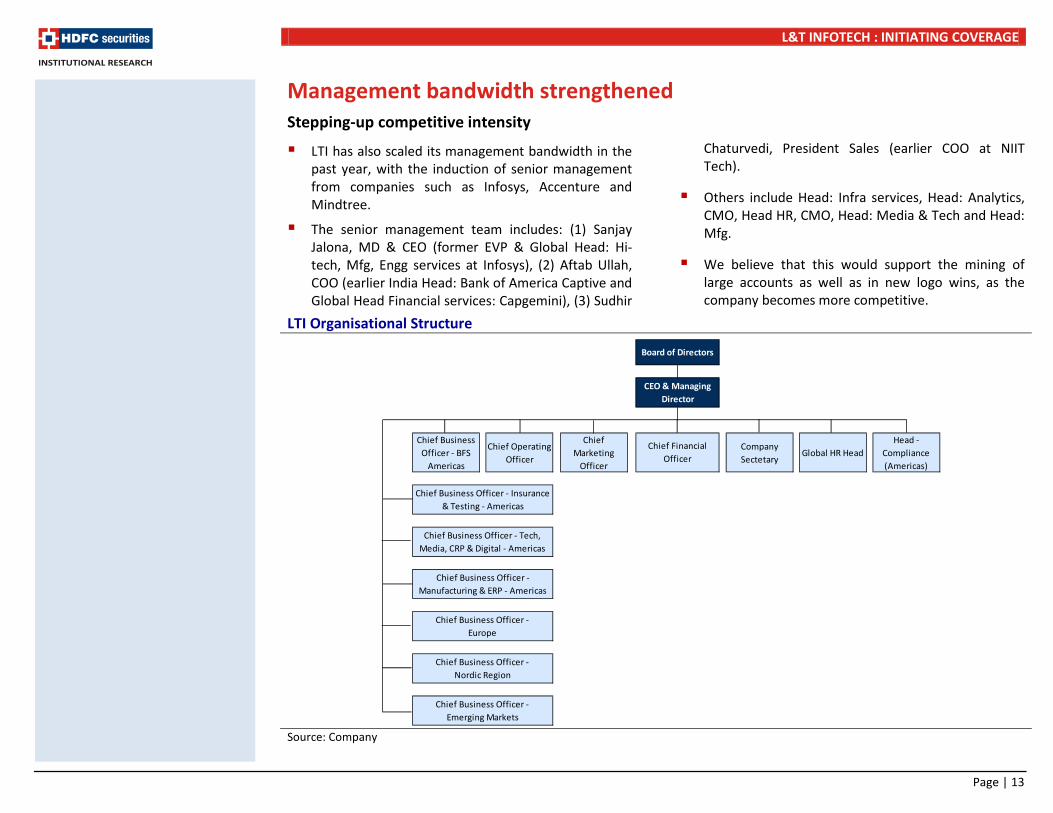
Management bandwidth strengthened Stepping-up competitive intensity
LTI has also scaled its management bandwidth in the past year, with the induction of senior management from companies such as Infosys, Accenture and Mindtree.
The senior management team includes: (1) Sanjay Jalona, MD & CEO (former EVP & Global Head: Hi-tech, Mfg, Engg services at Infosys), (2) Aftab Ullah, COO (earlier India Head: Bank of America Captive and Global Head Financial services: Capgemini), (3) Sudhir
Chaturvedi, President Sales (earlier COO at NIIT Tech).
Others include Head: Infra services, Head: Analytics, CMO, Head HR, CMO, Head: Media & Tech and Head: Mfg.
We believe that this would support the mining of large accounts as well as in new logo wins, as the company becomes more competitive.
LTI Organisational Structure
Source: Company
Chief Business Officer - BFS
Americas
Chief Operating Officer
Chief Marketing
Officer
Company Sectetary
Global HR HeadHead -
Compliance (Americas)
Chief Business Officer - Europe
Chief Business Officer - Nordic Region
Chief Business Officer - Emerging Markets
Board of Directors
CEO & Managing Director
Chief Financial Officer
Chief Business Officer - Insurance & Testing - Americas
Chief Business Officer - Tech, Media, CRP & Digital - Americas
Chief Business Officer - Manufacturing & ERP - Americas
Page | 13
L&T INFOTECH : INITIATING COVERAGE
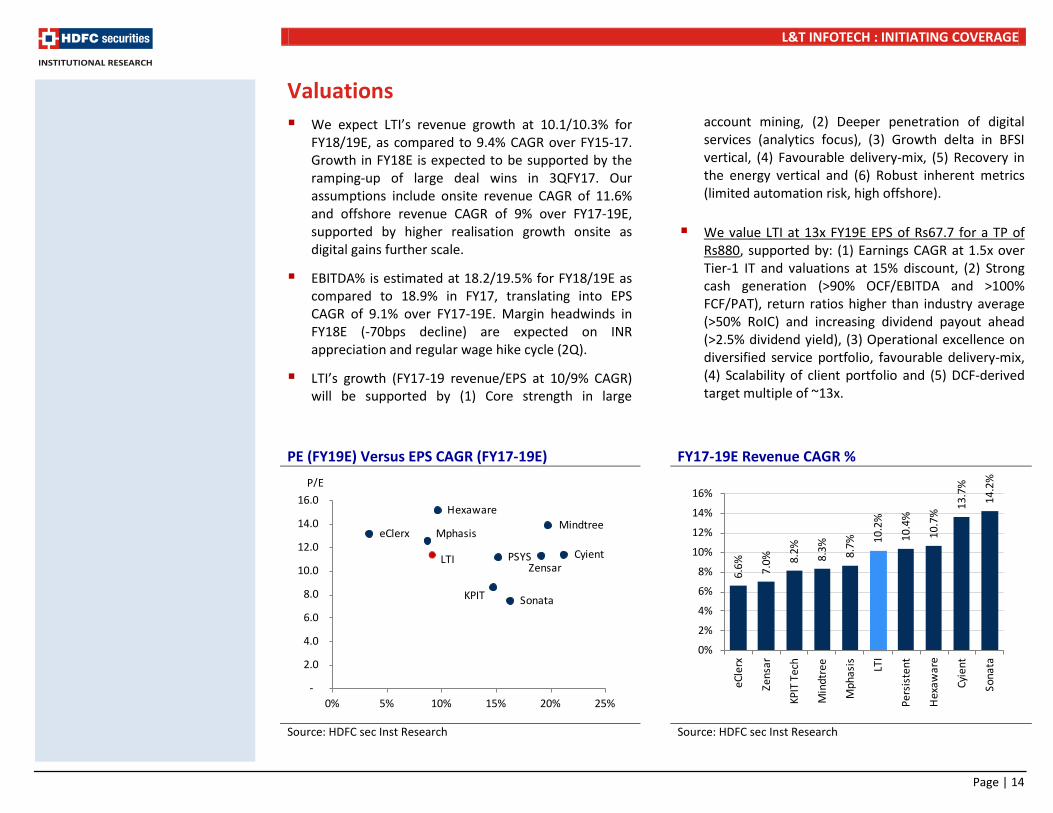
Valuations We expect LTI’s revenue growth at 10.1/10.3% for
FY18/19E, as compared to 9.4% CAGR over FY15-17. Growth in FY18E is expected to be supported by the ramping-up of large deal wins in 3QFY17. Our assumptions include onsite revenue CAGR of 11.6% and offshore revenue CAGR of 9% over FY17-19E, supported by higher realisation growth onsite as digital gains further scale.
EBITDA% is estimated at 18.2/19.5% for FY18/19E as compared to 18.9% in FY17, translating into EPS CAGR of 9.1% over FY17-19E. Margin headwinds in FY18E (-70bps decline) are expected on INR appreciation and regular wage hike cycle (2Q).
LTI’s growth (FY17-19 revenue/EPS at 10/9% CAGR) will be supported by (1) Core strength in large
account mining, (2) Deeper penetration of digital services (analytics focus), (3) Growth delta in BFSI vertical, (4) Favourable delivery-mix, (5) Recovery in the energy vertical and (6) Robust inherent metrics (limited automation risk, high offshore).
We value LTI at 13x FY19E EPS of Rs67.7 for a TP of Rs880, supported by: (1) Earnings CAGR at 1.5x over Tier-1 IT and valuations at 15% discount, (2) Strong cash generation (>90% OCF/EBITDA and >100% FCF/PAT), return ratios higher than industry average (>50% RoIC) and increasing dividend payout ahead (>2.5% dividend yield), (3) Operational excellence on diversified service portfolio, favourable delivery-mix, (4) Scalability of client portfolio and (5) DCF-derived target multiple of ~13x.
PE (FY19E) Versus EPS CAGR (FY17-19E)
FY17-19E Revenue CAGR %
Source: HDFC sec Inst Research Source: HDFC sec Inst Research
LTI
MphasisMindtree
eClerx
Hexaware
CyientPSYSZensar
KPIT Sonata
-
2.0
4.0
6.0
8.0
10.0
12.0
14.0
16.0
0% 5% 10% 15% 20% 25%
P/E
6.6% 7.0% 8.
2%
8.3% 8.7% 10
.2%
10.4
%
10.7
%
13.7
%
14.2
%
0%
2%
4%
6%
8%
10%
12%
14%
16%
eCle
rx
Zens
ar
KPIT
Tec
h
Min
dtre
e
Mph
asis LTI
Pers
iste
nt
Hex
awar
e
Cyie
nt
Sona
ta
Page | 14
L&T INFOTECH : INITIATING COVERAGE
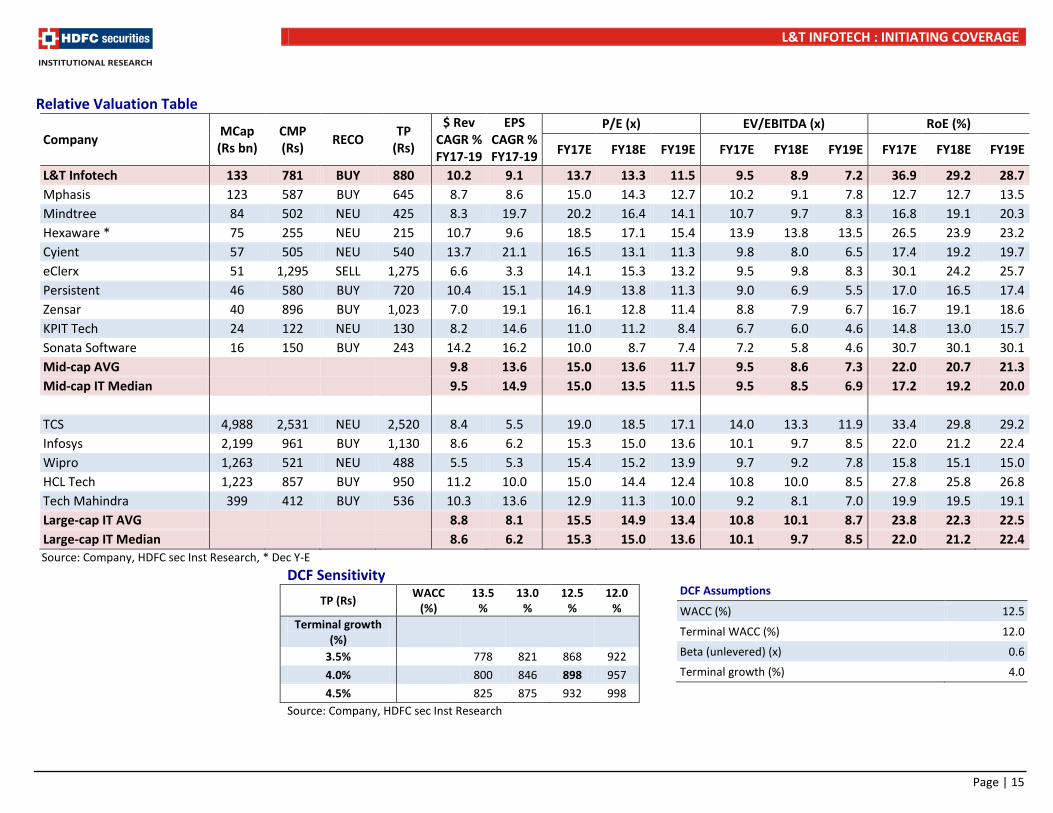
Relative Valuation Table
Company MCap (Rs bn)
CMP (Rs)
RECO TP
(Rs)
$ Rev CAGR % FY17-19
EPS CAGR % FY17-19
P/E (x) EV/EBITDA (x) RoE (%)
FY17E FY18E FY19E FY17E FY18E FY19E FY17E FY18E FY19E
L&T Infotech 133 781 BUY 880 10.2 9.1 13.7 13.3 11.5 9.5 8.9 7.2 36.9 29.2 28.7 Mphasis 123 587 BUY 645 8.7 8.6 15.0 14.3 12.7 10.2 9.1 7.8 12.7 12.7 13.5 Mindtree 84 502 NEU 425 8.3 19.7 20.2 16.4 14.1 10.7 9.7 8.3 16.8 19.1 20.3 Hexaware * 75 255 NEU 215 10.7 9.6 18.5 17.1 15.4 13.9 13.8 13.5 26.5 23.9 23.2 Cyient 57 505 NEU 540 13.7 21.1 16.5 13.1 11.3 9.8 8.0 6.5 17.4 19.2 19.7 eClerx 51 1,295 SELL 1,275 6.6 3.3 14.1 15.3 13.2 9.5 9.8 8.3 30.1 24.2 25.7 Persistent 46 580 BUY 720 10.4 15.1 14.9 13.8 11.3 9.0 6.9 5.5 17.0 16.5 17.4 Zensar 40 896 BUY 1,023 7.0 19.1 16.1 12.8 11.4 8.8 7.9 6.7 16.7 19.1 18.6 KPIT Tech 24 122 NEU 130 8.2 14.6 11.0 11.2 8.4 6.7 6.0 4.6 14.8 13.0 15.7 Sonata Software 16 150 BUY 243 14.2 16.2 10.0 8.7 7.4 7.2 5.8 4.6 30.7 30.1 30.1 Mid-cap AVG
9.8 13.6 15.0 13.6 11.7 9.5 8.6 7.3 22.0 20.7 21.3
Mid-cap IT Median
9.5 14.9 15.0 13.5 11.5 9.5 8.5 6.9 17.2 19.2 20.0
TCS 4,988 2,531 NEU 2,520 8.4 5.5 19.0 18.5 17.1 14.0 13.3 11.9 33.4 29.8 29.2 Infosys 2,199 961 BUY 1,130 8.6 6.2 15.3 15.0 13.6 10.1 9.7 8.5 22.0 21.2 22.4 Wipro 1,263 521 NEU 488 5.5 5.3 15.4 15.2 13.9 9.7 9.2 7.8 15.8 15.1 15.0 HCL Tech 1,223 857 BUY 950 11.2 10.0 15.0 14.4 12.4 10.8 10.0 8.5 27.8 25.8 26.8 Tech Mahindra 399 412 BUY 536 10.3 13.6 12.9 11.3 10.0 9.2 8.1 7.0 19.9 19.5 19.1 Large-cap IT AVG
8.8 8.1 15.5 14.9 13.4 10.8 10.1 8.7 23.8 22.3 22.5
Large-cap IT Median
8.6 6.2 15.3 15.0 13.6 10.1 9.7 8.5 22.0 21.2 22.4 Source: Company, HDFC sec Inst Research, * Dec Y-E
DCF Sensitivity
TP (Rs) WACC
(%) 13.5
% 13.0
% 12.5
% 12.0
% Terminal growth
(%) 3.5%
778 821 868 922
4.0%
800 846 898 957
4.5%
825 875 932 998 Source: Company, HDFC sec Inst Research
DCF Assumptions
WACC (%) 12.5
Terminal WACC (%) 12.0
Beta (unlevered) (x) 0.6
Terminal growth (%) 4.0
Page | 15
L&T INFOTECH : INITIATING COVERAGE
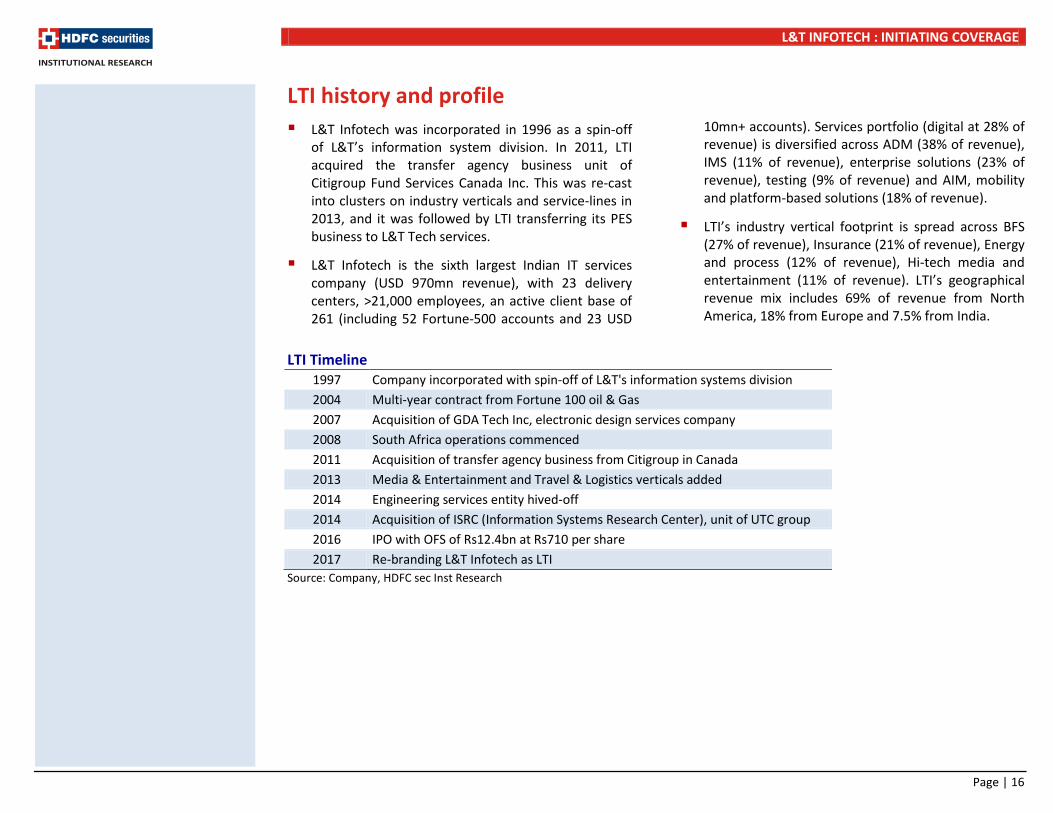
LTI history and profile L&T Infotech was incorporated in 1996 as a spin-off
of L&T’s information system division. In 2011, LTI acquired the transfer agency business unit of Citigroup Fund Services Canada Inc. This was re-cast into clusters on industry verticals and service-lines in 2013, and it was followed by LTI transferring its PES business to L&T Tech services.
L&T Infotech is the sixth largest Indian IT services company (USD 970mn revenue), with 23 delivery centers, >21,000 employees, an active client base of 261 (including 52 Fortune-500 accounts and 23 USD
10mn+ accounts). Services portfolio (digital at 28% of revenue) is diversified across ADM (38% of revenue), IMS (11% of revenue), enterprise solutions (23% of revenue), testing (9% of revenue) and AIM, mobility and platform-based solutions (18% of revenue).
LTI’s industry vertical footprint is spread across BFS (27% of revenue), Insurance (21% of revenue), Energy and process (12% of revenue), Hi-tech media and entertainment (11% of revenue). LTI’s geographical revenue mix includes 69% of revenue from North America, 18% from Europe and 7.5% from India.
LTI Timeline
1997 Company incorporated with spin-off of L&T's information systems division 2004 Multi-year contract from Fortune 100 oil & Gas 2007 Acquisition of GDA Tech Inc, electronic design services company 2008 South Africa operations commenced 2011 Acquisition of transfer agency business from Citigroup in Canada 2013 Media & Entertainment and Travel & Logistics verticals added 2014 Engineering services entity hived-off 2014 Acquisition of ISRC (Information Systems Research Center), unit of UTC group 2016 IPO with OFS of Rs12.4bn at Rs710 per share 2017 Re-branding L&T Infotech as LTI
Source: Company, HDFC sec Inst Research
Page | 16
L&T INFOTECH : INITIATING COVERAGE
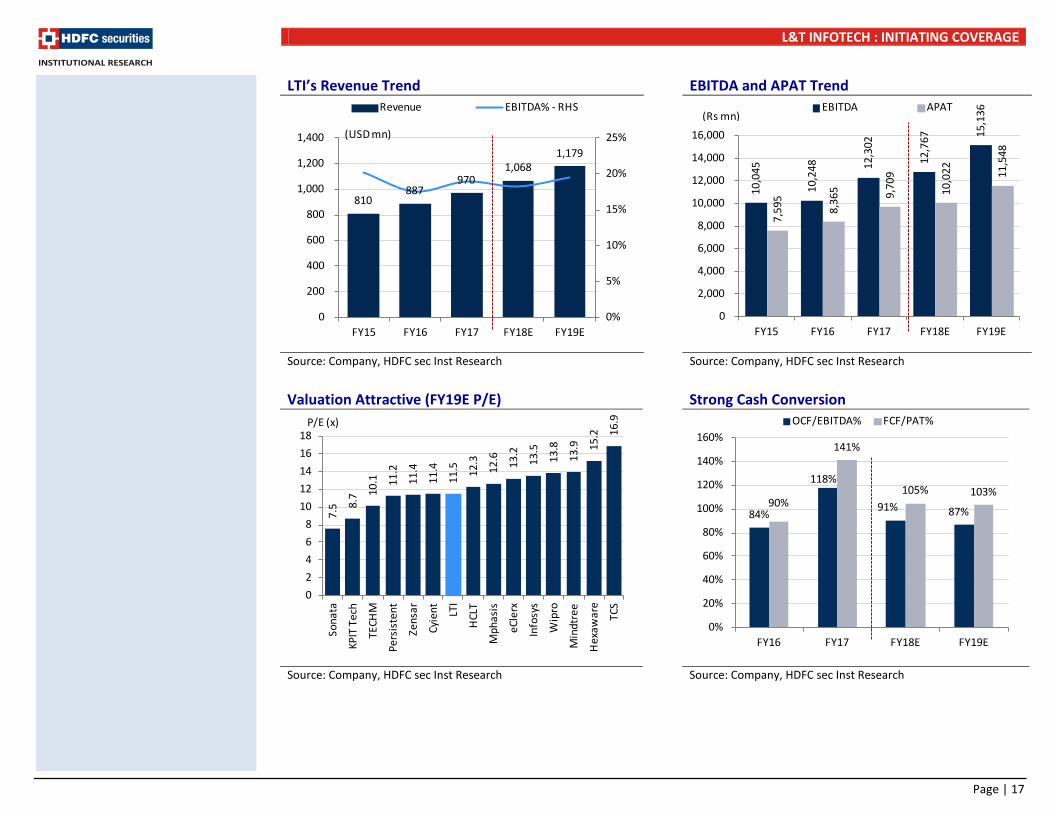
LTI’s Revenue Trend EBITDA and APAT Trend
Source: Company, HDFC sec Inst Research Source: Company, HDFC sec Inst Research Valuation Attractive (FY19E P/E) Strong Cash Conversion
Source: Company, HDFC sec Inst Research Source: Company, HDFC sec Inst Research
10,0
45
10,2
48
12,3
02
12,7
67 15
,136
7,59
5
8,36
5 9,70
9
10,0
22
11,5
48
0
2,000
4,000
6,000
8,000
10,000
12,000
14,000
16,000
FY15 FY16 FY17 FY18E FY19E
EBITDA APAT(Rs mn)
810 887
970 1,068
1,179
0%
5%
10%
15%
20%
25%
0
200
400
600
800
1,000
1,200
1,400
FY15 FY16 FY17 FY18E FY19E
Revenue EBITDA% - RHS
(USD mn)
7.5 8.
7 10.1
11.2
11.4
11.4
11.5
12.3
12.6
13.2
13.5
13.8
13.9
15.2
16.9
0
2
4
6
8
10
12
14
16
18
Sona
ta
KPIT
Tec
h
TECH
M
Pers
iste
nt
Zens
ar
Cyie
nt LTI
HCL
T
Mph
asis
eCle
rx
Info
sys
Wip
ro
Min
dtre
e
Hex
awar
e
TCS
P/E (x)
84%
118%
91% 87%90%
141%
105% 103%
0%
20%
40%
60%
80%
100%
120%
140%
160%
FY16 FY17 FY18E FY19E
OCF/EBITDA% FCF/PAT%
Page | 17
L&T INFOTECH : INITIATING COVERAGE
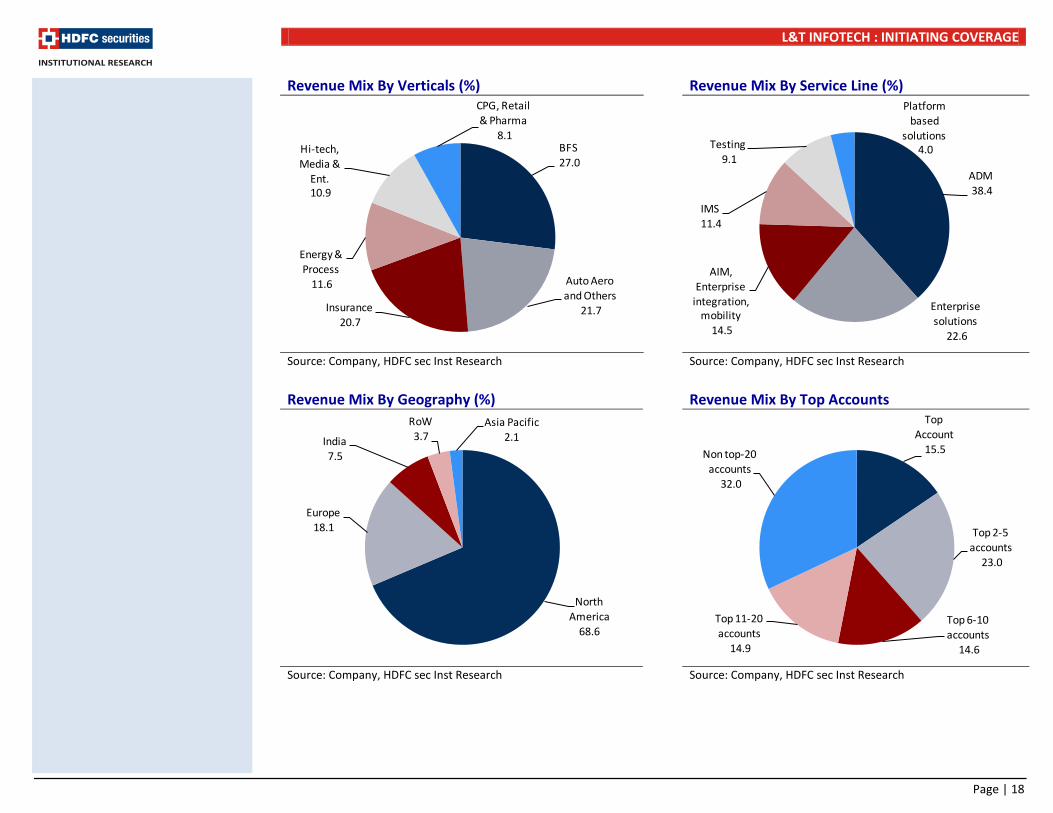
Revenue Mix By Verticals (%) Revenue Mix By Service Line (%)
Source: Company, HDFC sec Inst Research Source: Company, HDFC sec Inst Research Revenue Mix By Geography (%) Revenue Mix By Top Accounts
Source: Company, HDFC sec Inst Research Source: Company, HDFC sec Inst Research
Top Account
15.5
Top 2-5 accounts
23.0
Top 6-10 accounts
14.6
Top 11-20 accounts
14.9
Non top-20 accounts
32.0
North America
68.6
Europe18.1
India7.5
RoW3.7
Asia Pacific2.1
ADM38.4
Enterprise solutions
22.6
AIM, Enterprise
integration, mobility
14.5
IMS11.4
Testing9.1
Platform based
solutions4.0 BFS
27.0
Auto Aero and Others
21.7 Insurance20.7
Energy & Process
11.6
Hi-tech, Media &
Ent.10.9
CPG, Retail & Pharma
8.1
Page | 18
L&T INFOTECH : INITIATING COVERAGE
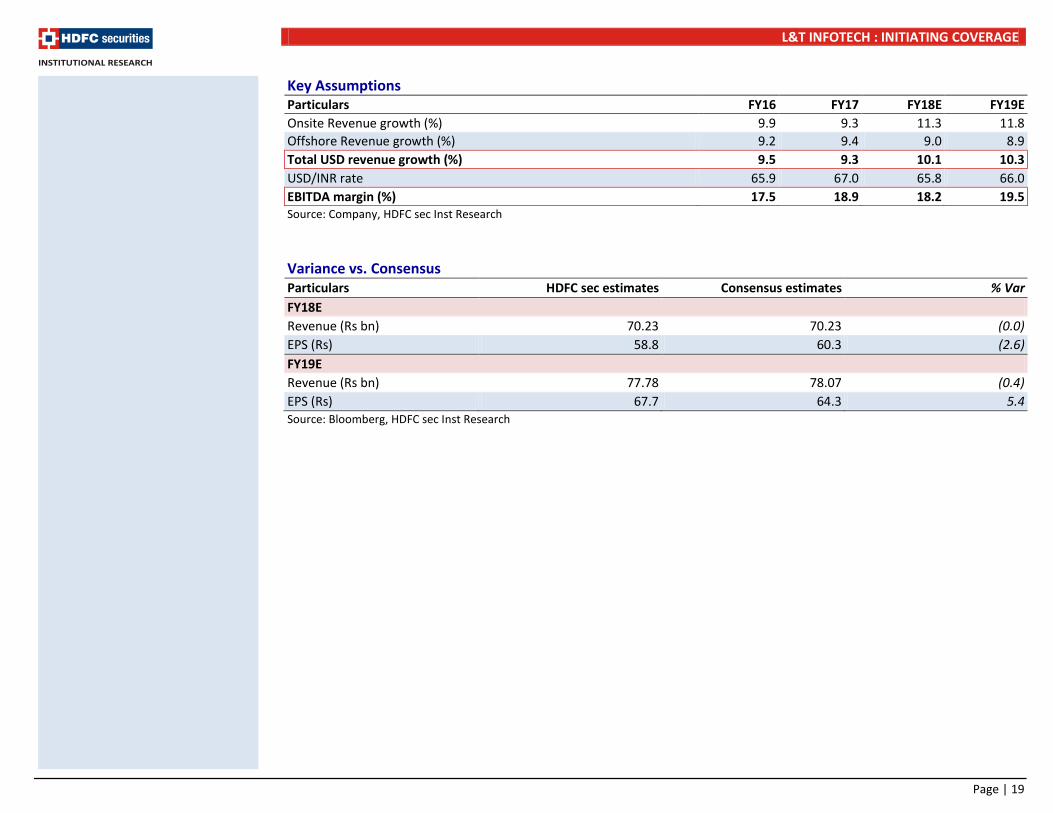
Key Assumptions Particulars FY16 FY17 FY18E FY19E Onsite Revenue growth (%) 9.9 9.3 11.3 11.8 Offshore Revenue growth (%) 9.2 9.4 9.0 8.9 Total USD revenue growth (%) 9.5 9.3 10.1 10.3 USD/INR rate 65.9 67.0 65.8 66.0 EBITDA margin (%) 17.5 18.9 18.2 19.5 Source: Company, HDFC sec Inst Research Variance vs. Consensus Particulars HDFC sec estimates Consensus estimates % Var FY18E Revenue (Rs bn) 70.23 70.23 (0.0) EPS (Rs) 58.8 60.3 (2.6) FY19E Revenue (Rs bn) 77.78 78.07 (0.4) EPS (Rs) 67.7 64.3 5.4 Source: Bloomberg, HDFC sec Inst Research
Page | 19
L&T INFOTECH : INITIATING COVERAGE
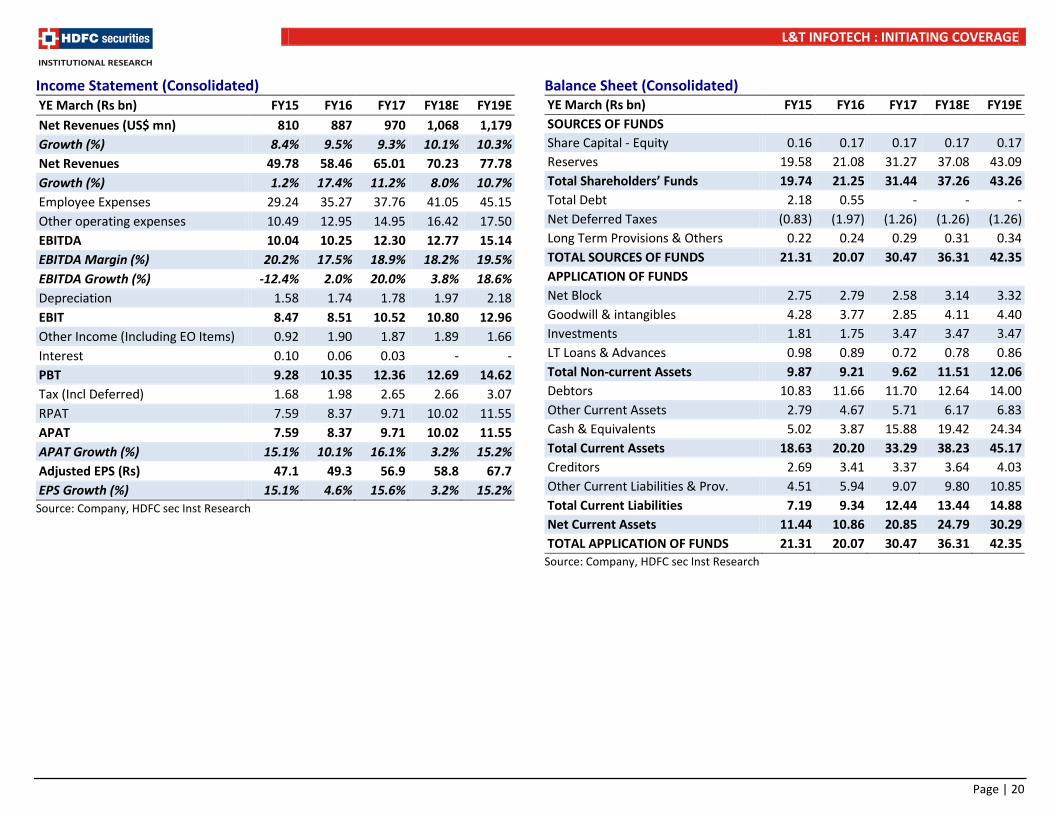
Income Statement (Consolidated) YE March (Rs bn) FY15 FY16 FY17 FY18E FY19E Net Revenues (US$ mn) 810 887 970 1,068 1,179 Growth (%) 8.4% 9.5% 9.3% 10.1% 10.3% Net Revenues 49.78 58.46 65.01 70.23 77.78 Growth (%) 1.2% 17.4% 11.2% 8.0% 10.7% Employee Expenses 29.24 35.27 37.76 41.05 45.15 Other operating expenses 10.49 12.95 14.95 16.42 17.50 EBITDA 10.04 10.25 12.30 12.77 15.14 EBITDA Margin (%) 20.2% 17.5% 18.9% 18.2% 19.5% EBITDA Growth (%) -12.4% 2.0% 20.0% 3.8% 18.6% Depreciation 1.58 1.74 1.78 1.97 2.18 EBIT 8.47 8.51 10.52 10.80 12.96 Other Income (Including EO Items) 0.92 1.90 1.87 1.89 1.66 Interest 0.10 0.06 0.03 - - PBT 9.28 10.35 12.36 12.69 14.62 Tax (Incl Deferred) 1.68 1.98 2.65 2.66 3.07 RPAT 7.59 8.37 9.71 10.02 11.55 APAT 7.59 8.37 9.71 10.02 11.55 APAT Growth (%) 15.1% 10.1% 16.1% 3.2% 15.2% Adjusted EPS (Rs) 47.1 49.3 56.9 58.8 67.7 EPS Growth (%) 15.1% 4.6% 15.6% 3.2% 15.2%
Source: Company, HDFC sec Inst Research
Balance Sheet (Consolidated) YE March (Rs bn) FY15 FY16 FY17 FY18E FY19E SOURCES OF FUNDS
Share Capital - Equity 0.16 0.17 0.17 0.17 0.17 Reserves 19.58 21.08 31.27 37.08 43.09 Total Shareholders’ Funds 19.74 21.25 31.44 37.26 43.26 Total Debt 2.18 0.55 - - - Net Deferred Taxes (0.83) (1.97) (1.26) (1.26) (1.26) Long Term Provisions & Others 0.22 0.24 0.29 0.31 0.34 TOTAL SOURCES OF FUNDS 21.31 20.07 30.47 36.31 42.35 APPLICATION OF FUNDS
Net Block 2.75 2.79 2.58 3.14 3.32 Goodwill & intangibles 4.28 3.77 2.85 4.11 4.40 Investments 1.81 1.75 3.47 3.47 3.47 LT Loans & Advances 0.98 0.89 0.72 0.78 0.86 Total Non-current Assets 9.87 9.21 9.62 11.51 12.06 Debtors 10.83 11.66 11.70 12.64 14.00 Other Current Assets 2.79 4.67 5.71 6.17 6.83 Cash & Equivalents 5.02 3.87 15.88 19.42 24.34 Total Current Assets 18.63 20.20 33.29 38.23 45.17 Creditors 2.69 3.41 3.37 3.64 4.03 Other Current Liabilities & Prov. 4.51 5.94 9.07 9.80 10.85 Total Current Liabilities 7.19 9.34 12.44 13.44 14.88 Net Current Assets 11.44 10.86 20.85 24.79 30.29 TOTAL APPLICATION OF FUNDS 21.31 20.07 30.47 36.31 42.35
Source: Company, HDFC sec Inst Research
Page | 20
L&T INFOTECH : INITIATING COVERAGE
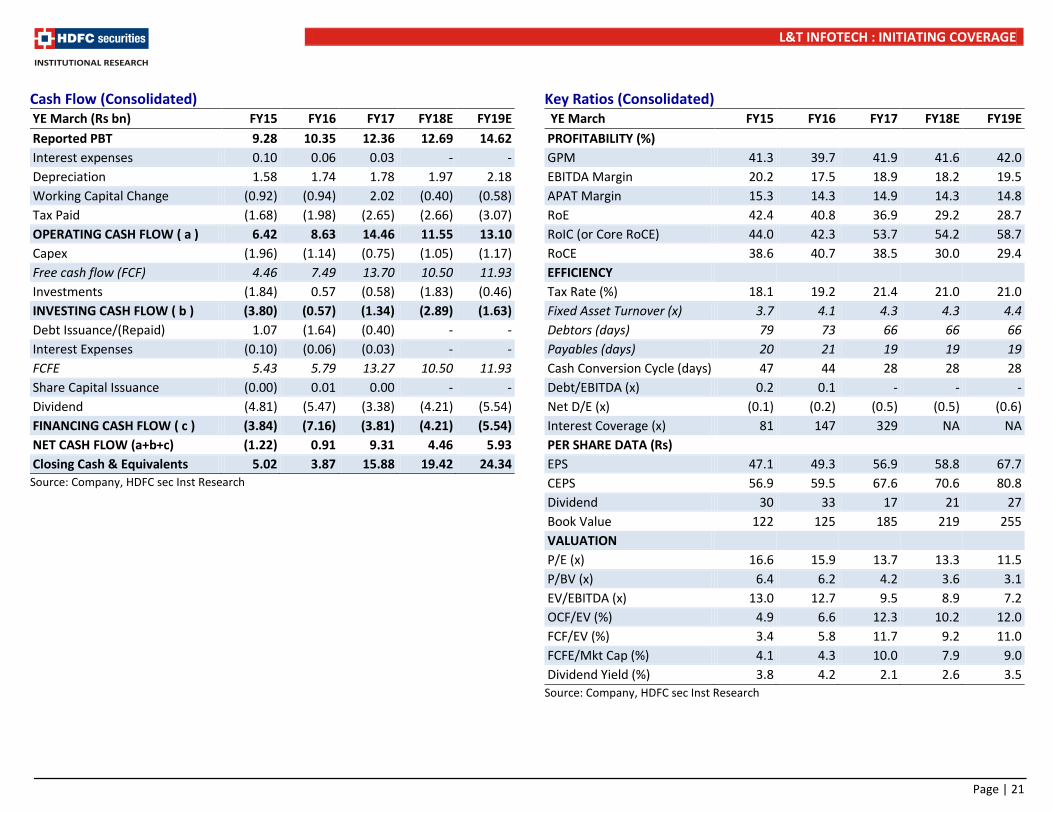
Cash Flow (Consolidated) YE March (Rs bn) FY15 FY16 FY17 FY18E FY19E Reported PBT 9.28 10.35 12.36 12.69 14.62 Interest expenses 0.10 0.06 0.03 - - Depreciation 1.58 1.74 1.78 1.97 2.18 Working Capital Change (0.92) (0.94) 2.02 (0.40) (0.58) Tax Paid (1.68) (1.98) (2.65) (2.66) (3.07) OPERATING CASH FLOW ( a ) 6.42 8.63 14.46 11.55 13.10 Capex (1.96) (1.14) (0.75) (1.05) (1.17) Free cash flow (FCF) 4.46 7.49 13.70 10.50 11.93 Investments (1.84) 0.57 (0.58) (1.83) (0.46) INVESTING CASH FLOW ( b ) (3.80) (0.57) (1.34) (2.89) (1.63) Debt Issuance/(Repaid) 1.07 (1.64) (0.40) - - Interest Expenses (0.10) (0.06) (0.03) - - FCFE 5.43 5.79 13.27 10.50 11.93 Share Capital Issuance (0.00) 0.01 0.00 - - Dividend (4.81) (5.47) (3.38) (4.21) (5.54) FINANCING CASH FLOW ( c ) (3.84) (7.16) (3.81) (4.21) (5.54) NET CASH FLOW (a+b+c) (1.22) 0.91 9.31 4.46 5.93 Closing Cash & Equivalents 5.02 3.87 15.88 19.42 24.34 Source: Company, HDFC sec Inst Research
Key Ratios (Consolidated) YE March FY15 FY16 FY17 FY18E FY19E PROFITABILITY (%)
GPM 41.3 39.7 41.9 41.6 42.0 EBITDA Margin 20.2 17.5 18.9 18.2 19.5 APAT Margin 15.3 14.3 14.9 14.3 14.8 RoE 42.4 40.8 36.9 29.2 28.7 RoIC (or Core RoCE) 44.0 42.3 53.7 54.2 58.7 RoCE 38.6 40.7 38.5 30.0 29.4 EFFICIENCY
Tax Rate (%) 18.1 19.2 21.4 21.0 21.0 Fixed Asset Turnover (x) 3.7 4.1 4.3 4.3 4.4 Debtors (days) 79 73 66 66 66 Payables (days) 20 21 19 19 19 Cash Conversion Cycle (days) 47 44 28 28 28 Debt/EBITDA (x) 0.2 0.1 - - - Net D/E (x) (0.1) (0.2) (0.5) (0.5) (0.6) Interest Coverage (x) 81 147 329 NA NA PER SHARE DATA (Rs)
EPS 47.1 49.3 56.9 58.8 67.7 CEPS 56.9 59.5 67.6 70.6 80.8 Dividend 30 33 17 21 27 Book Value 122 125 185 219 255 VALUATION
P/E (x) 16.6 15.9 13.7 13.3 11.5 P/BV (x) 6.4 6.2 4.2 3.6 3.1 EV/EBITDA (x) 13.0 12.7 9.5 8.9 7.2 OCF/EV (%) 4.9 6.6 12.3 10.2 12.0 FCF/EV (%) 3.4 5.8 11.7 9.2 11.0 FCFE/Mkt Cap (%) 4.1 4.3 10.0 7.9 9.0 Dividend Yield (%) 3.8 4.2 2.1 2.6 3.5
Source: Company, HDFC sec Inst Research
Page | 21
L&T INFOTECH : INITIATING COVERAGE
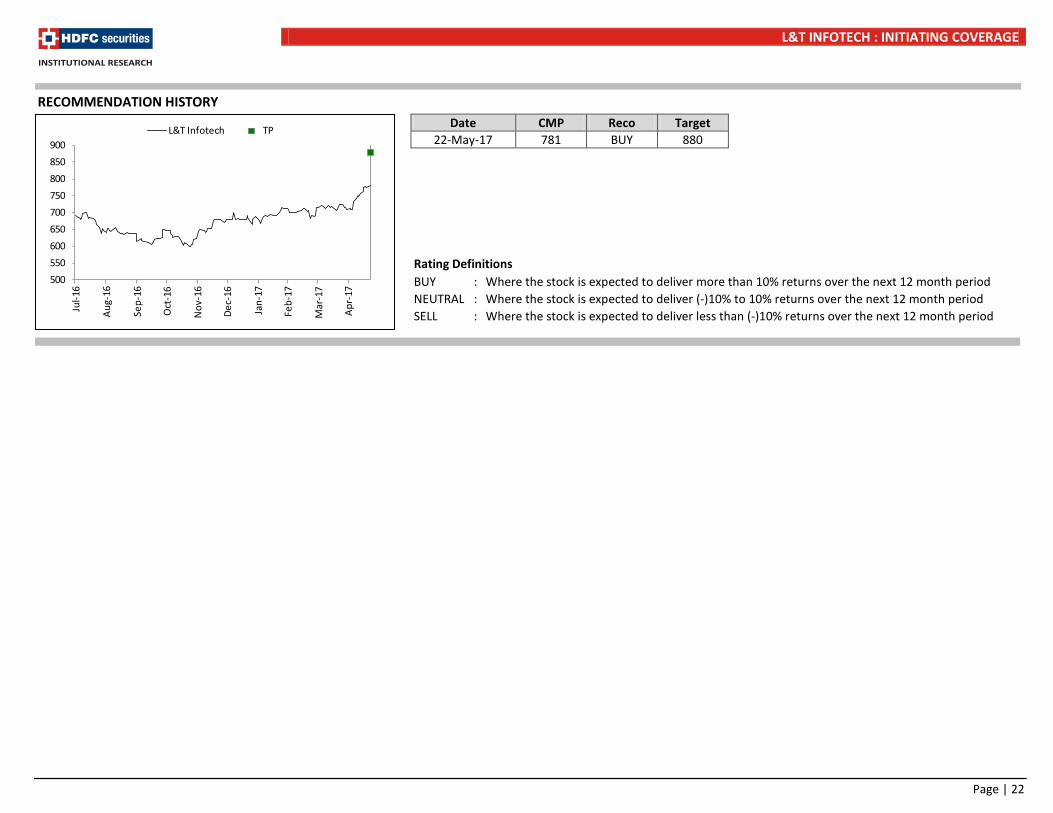
Rating Definitions BUY : Where the stock is expected to deliver more than 10% returns over the next 12 month period NEUTRAL : Where the stock is expected to deliver (-)10% to 10% returns over the next 12 month period SELL : Where the stock is expected to deliver less than (-)10% returns over the next 12 month period
Date CMP Reco Target 22-May-17 781 BUY 880
500
550
600
650
700
750
800
850
900
Jul-1
6
Aug
-16
Sep-
16
Oct
-16
Nov
-16
Dec
-16
Jan-
17
Feb-
17
Mar
-17
Apr
-17
L&T Infotech TP
RECOMMENDATION HISTORY
Page | 22
L&T INFOTECH : INITIATING COVERAGE
Disclosure: We, Apurva Prasad, MBA & Amit Chandra, MBA, authors and the names subscribed to this report, hereby certify that all of the views expressed in this research report accurately reflect our views about the subject issuer(s) or securities. HSL has no material adverse disciplinary history as on the date of publication of this report. We also certify that no part of our compensation was, is, or will be directly or indirectly related to the specific recommendation(s) or view(s) in this report. Research Analyst or his/her relative or HDFC Securities Ltd. does not have any financial interest in the subject company. Also Research Analyst or his relative or HDFC Securities Ltd. or its Associate may have beneficial ownership of 1% or more in the subject company at the end of the month immediately preceding the date of publication of the Research Report. Further Research Analyst or his relative or HDFC Securities Ltd. or its associate does not have any material conflict of interest. Any holding in stock –No HDFC Securities Limited (HSL) is a SEBI Registered Research Analyst having registration no. INH000002475. Disclaimer: This report has been prepared by HDFC Securities Ltd and is meant for sole use by the recipient and not for circulation. The information and opinions contained herein have been compiled or arrived at, based upon information obtained in good faith from sources believed to be reliable. Such information has not been independently verified and no guaranty, representation of warranty, express or implied, is made as to its accuracy, completeness or correctness. All such information and opinions are subject to change without notice. This document is for information purposes only. Descriptions of any company or companies or their securities mentioned herein are not intended to be complete and this document is not, and should not be construed as an offer or solicitation of an offer, to buy or sell any securities or other financial instruments. This report is not directed to, or intended for display, downloading, printing, reproducing or for distribution to or use by, any person or entity who is a citizen or resident or located in any locality, state, country or other jurisdiction where such distribution, publication, reproduction, availability or use would be contrary to law or regulation or what would subject HSL or its affiliates to any registration or licensing requirement within such jurisdiction. If this report is inadvertently send or has reached any individual in such country, especially, USA, the same may be ignored and brought to the attention of the sender. This document may not be reproduced, distributed or published for any purposes without prior written approval of HSL. Foreign currencies denominated securities, wherever mentioned, are subject to exchange rate fluctuations, which could have an adverse effect on their value or price, or the income derived from them. In addition, investors in securities such as ADRs, the values of which are influenced by foreign currencies effectively assume currency risk. It should not be considered to be taken as an offer to sell or a solicitation to buy any security. HSL may from time to time solicit from, or perform broking, or other services for, any company mentioned in this mail and/or its attachments. HSL and its affiliated company(ies), their directors and employees may; (a) from time to time, have a long or short position in, and buy or sell the securities of the company(ies) mentioned herein or (b) be engaged in any other transaction involving such securities and earn brokerage or other compensation or act as a market maker in the financial instruments of the company(ies) discussed herein or act as an advisor or lender/borrower to such company(ies) or may have any other potential conflict of interests with respect to any recommendation and other related information and opinions. HSL, its directors, analysts or employees do not take any responsibility, financial or otherwise, of the losses or the damages sustained due to the investments made or any action taken on basis of this report, including but not restricted to, fluctuation in the prices of shares and bonds, changes in the currency rates, diminution in the NAVs, reduction in the dividend or income, etc. HSL and other group companies, its directors, associates, employees may have various positions in any of the stocks, securities and financial instruments dealt in the report, or may make sell or purchase or other deals in these securities from time to time or may deal in other securities of the companies / organizations described in this report. HSL or its associates might have managed or co-managed public offering of securities for the subject company or might have been mandated by the subject company for any other assignment in the past twelve months. HSL or its associates might have received any compensation from the companies mentioned in the report during the period preceding twelve months from t date of this report for services in respect of managing or co-managing public offerings, corporate finance, investment banking or merchant banking, brokerage services or other advisory service in a merger or specific transaction in the normal course of business. HSL or its analysts did not receive any compensation or other benefits from the companies mentioned in the report or third party in connection with preparation of the research report. Accordingly, neither HSL nor Research Analysts have any material conflict of interest at the time of publication of this report. Compensation of our Research Analysts is not based on any specific merchant banking, investment banking or brokerage service transactions. HSL may have issued other reports that are inconsistent with and reach different conclusion from the information presented in this report. Research entity has not been engaged in market making activity for the subject company. Research analyst has not served as an officer, director or employee of the subject company. We have not received any compensation/benefits from the subject company or third party in connection with the Research Report. HDFC securities Limited, I Think Techno Campus, Building - B, "Alpha", Office Floor 8, Near Kanjurmarg Station, Opp. Crompton Greaves, Kanjurmarg (East), Mumbai 400 042 Phone: (022) 3075 3400 Fax: (022) 2496 5066 Compliance Officer: Binkle R. Oza Email: [email protected] Phone: (022) 3045 3600 HDFC Securities Limited, SEBI Reg. No.: NSE-INB/F/E 231109431, BSE-INB/F 011109437, AMFI Reg. No. ARN: 13549, PFRDA Reg. No. POP: 04102015, IRDA Corporate Agent License No.: HDF 2806925/HDF C000222657, SEBI Research Analyst Reg. No.: INH000002475, CIN - U67120MH2000PLC152193 Mutual Funds Investments are subject to market risk. Please read the offer and scheme related documents carefully before investing.
Page | 23
L&T INFOTECH : INITIATING COVERAGE
HDFC securities Institutional Equities Unit No. 1602, 16th Floor, Tower A, Peninsula Business Park, Senapati Bapat Marg, Lower Parel,Mumbai - 400 013 Board : +91-22-6171 7330 www.hdfcsec.com
Page | 24
Recommended