Candid Comparison of Operational Management Approaches
James R. Holt, Ph.D., PE, Jonah-Jonah
Washington State University-Vancouver
Engineering Management Program

Purpose for Presentation
Understand different approaches to managing repetitive production processes
Highlighting several key production measurements
Comparing performance on an equal playing field
Highlight consistent key variables Draw some conclusions of value

The Situation
Describe many different production management approaches into generally acceptable methods
Create a generic simulation model and test procedure that is fair to all management approaches
Provide sensitivity analysis to make fair comparisons

Fairness Paramount
Production process straight forward– No disassembly, no assembly, – Parallel machines accept any work – No set-ups
No people or logistics problems – No priority work– Independent - No artificial slow downs– Available material available immediately– Tolerant customer that buys all immediately

The Challenge
Production Model– 10 machines of 6 types -- mostly in parallel– Production times mostly balanced– Double Constraint– Free flow of products on any path– Normal distribution on production– 90% productive capacity– Repetitive scheduled arrivals

1Mean=8
SD=4
2Mean=26
SD=8
3Mean=28
SD=8
4Mean=26
SD=8
5Mean=19
SD=5
6Mean=19
SD=5
7Mean=20
SD=6
8Mean=20
SD=6
9Mean=9
SD=4
10Mean=8
SD=4
RawMaterial
FinishedGoods
MachineType 5
MachineType 3
MachineType 4
MachineType 2
MachineType 1
MachineType 6
Machines breakdownapproximately 10% of
the time
Production Simulation Model

0
5
10
15
20
25
30
0 200 400 600 800 1000 1200 1400 1600 1800 2000 2200 2400
Time-Mins
Nu
mb
er
of
Pro
du
cts
Product A
Product B
Arrival Schedule

Management Approaches
Traditional push manufacturing Push with batch size of 10 Work cells Just-In-Time with kanban of 1 Just-In-Time with kanban of 3 Lean manufacturing Drum-buffer-rope Agile manufacturing
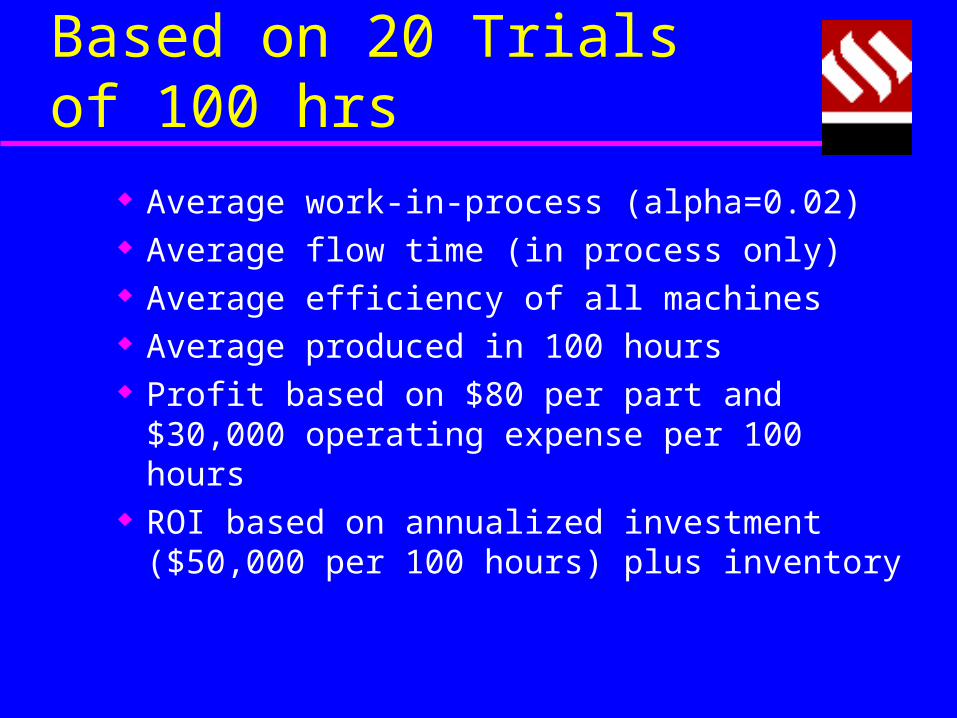
MeasurementsBased on 20 Trials of 100 hrs
Average work-in-process (alpha=0.02) Average flow time (in process only) Average efficiency of all machines Average produced in 100 hours Profit based on $80 per part and $30,000
operating expense per 100 hours ROI based on annualized investment ($50,000
per 100 hours) plus inventory

Definition:Traditional
Efficiency is very important at every work station
Push materials in as soon as possible No limit on Work-In-Process (queues) Work flows first-in-first-out No priorities Transfer batch size of one
View: Trad.sim

Definition:Traditional Batch
Optimizes the costs of efficiency and investment
Lot sizes planned to optimize individual performance
Lot sizes reduce set-up times Efficiencies of scale Parts moved between machines in lots of 10

Definition:Cell Production
Dedicate machines to products Special treatment of products Some efficiencies possible within cells Easier to manage / control / improve
processes in cells Cell draws from, connects to rest of plant
View: Cell.sim

Definition:Just-In-Time
Pull system -- produces to demand Work-In-Process controlled (limited) Kanban card governs flow between
machines (parts move only on demand) Simulation JIT1: Kanban card of 1 Simulation JIT3: Kanban card of 3 Demand is at max level of performance
View: JIT1.sim

Definition:Lean Manufacturing
Maintain low work-in-process Maintain high efficiencies (trim excess
capacity) Use push or pull approach This simulation uses a balanced line with
maximum work-in-process of 5 parts per machine
View: Lean.sim
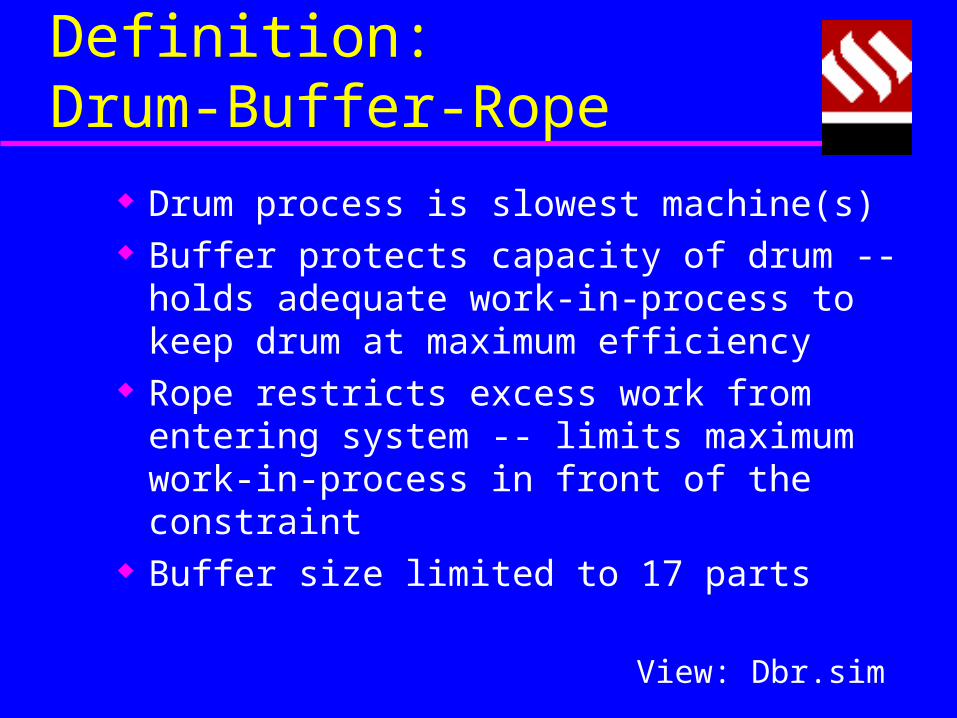
Definition:Drum-Buffer-Rope
Drum process is slowest machine(s) Buffer protects capacity of drum -- holds
adequate work-in-process to keep drum at maximum efficiency
Rope restricts excess work from entering system -- limits maximum work-in-process in front of the constraint
Buffer size limited to 17 parts
View: Dbr.sim

Definition:Agile Production
Very flexible manufacturing Respond to demand, workload shifts as needed Multi-skill machines / workers to perform a
variety of tasks Machines added / workers added / moved to
meet high demands In this simulation, workers move if own queue is
< 2 and service area average >2
View: Agile.sim

PerformanceMeasures
Traditional Batch-10 Cell
WIP 361 942 1055
FLOW TIME 39919 106019 92532
EFFICIENCY. 76%1 83%1 68%1
PRODUCED 4994 4364 4175
PROFIT $9920 $4880 $3360
ROI 19% 9% 6%

Performance Measures
Traditional JIT-1 JIT-3
WIP 361 8.55 271
FLOW TIME 39919 1363 32812
EFFICIENCY. 76%1 552 60%2
PRODUCED 4994 38130 4187
PROFIT $9920 $480 $3440
ROI 19% 1% 7%
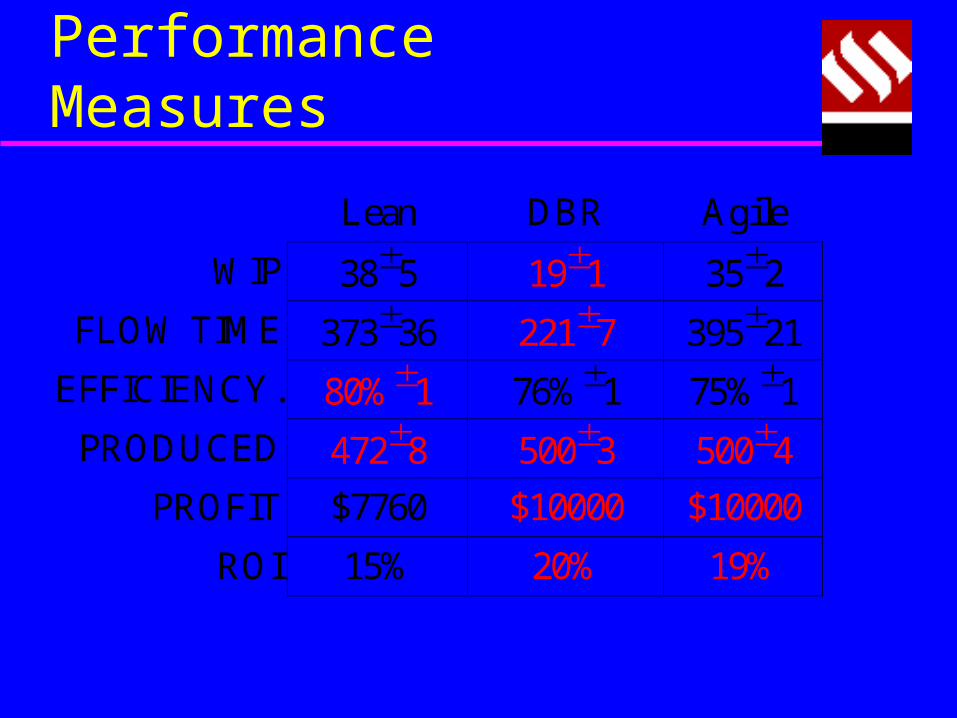
PerformanceMeasures
Lean DBR Agile
WIP 385 191 352
FLOW TIME 37336 2217 39521
EFFICIENCY. 80%1 76%1 75%1
PRODUCED 4728 5003 5004
PROFIT $7760 $10000 $10000
ROI 15% 20% 19%

Summary Measures
Pros Cons
Traditional Good Prod Mod WIP
Batch (10) High Eff. High WIP, Long Flow
Cell Control High WIP, Flow, Prod
JIT-1 Lowest WIP Lowest Production
JIT-3 Moderate Low ROI
Lean High Efficiency Mod Flow
DBR WIP, Flow, Prod Mod Efficiency
Agile High Prod Long Flow

Join WSU’sEngineeringManagement Program
EM 526 Constraints Management
EM 530 Applications in Constraints Management
http://www.cea.wsu.edu/engmgt/
Recommended