1 2 3 4 5 6 7 8 9 1011121314151617181920212223242526272829303132333435363738394041424344454647484950515253545556575859606162636465
1
To be submitted to J Hazardous Materials 1
2
3
Capability of microalgae-based wastewater 4
treatment systems to remove emerging organic 5
contaminants: a pilot-scale study 6
Víctor Matamoros1*, Raquel Gutiérrez2, Ivet Ferrer2, Joan García2, Josep M Bayona1 7
8
1Department of Environmental Chemistry, IDAEA-CSIC, c/Jordi Girona, 18-26, E-08034, Barcelona, Spain. 9
2GEMMA-Group of Environmental Engineering and Microbiology, Department of Hydraulic, Maritime and 10
Environmental Engineering, Universitat Politècnica de Catalunya BarcelonaTech, c/ Jordi Girona, 1-3, Building 11
D1, E-08034, Barcelona, Spain. 12
13
14
15
16
17
18
19
20
*Corresponding author: [email protected] 21
*Revised ManuscriptClick here to view linked References
1 2 3 4 5 6 7 8 9 1011121314151617181920212223242526272829303132333435363738394041424344454647484950515253545556575859606162636465
2
0. Abstract 22
The effect of hydraulic retention time (HRT) and seasonality on the removal efficiency of 26 23
organic microcontaminants from urban wastewater was studied in two pilot high-rate algal ponds 24
(HRAPs). The targeted compounds included pharmaceuticals and personal care products, fire 25
retardants, surfactants, anticorrosive agents, pesticides and plasticizers, among others. The pilot 26
plant, which was fed at a surface loading rate of 7-29 g of COD m-2 d-1, consisted of a 27
homogenisation tank and two parallel lines, each one with a primary settler and an HRAP with a 28
surface area of 1.5 m2 and a volume of 0.5 m3. The two HRAPs were operated with different HRTs 29
(4 and 8 d). The removal efficiency ranged from negligible removal to more than 90% depending on 30
the compound. Microcontaminant removal efficiencies were enhanced during the warm season, 31
while the HRT effect on microcontaminant removal was only noticeable in the cold season. Our 32
results suggest that biodegradation and photodegradation are the most important removal pathways, 33
whereas volatilization and sorption were solely achieved for hydrophobic compounds (log Kow>4) 34
with a moderately high Henry’s law constant values (11-12 Pa m-3 mol-1) such as musk fragrances. 35
Whereas acetaminophen, ibuprofen and oxybenzone presented ecotoxicological hazard quotients 36
(HQs) higher than 1 in the influent wastewater samples, the HQs for the effluent water samples 37
were always below 1. 38
39
40
41
42
43
Keywords: emerging organic contaminants; microalgae; high-rate algal pond; photodegradation; 44
biodegradation; volatilization. 45
1 2 3 4 5 6 7 8 9 1011121314151617181920212223242526272829303132333435363738394041424344454647484950515253545556575859606162636465
3
1. Introduction 46
Emerging organic contaminants (EOCs) include a wide range of compounds belonging to different 47
chemical classes, such as pharmaceuticals, personal care products, plasticizers, flame retardants, 48
surfactants, and certain pesticides, among others, the ecotoxicological effects of which are relatively 49
unknown [1]. Since conventional wastewater treatment plants (WWTPs) are not designed to remove 50
emerging and related contaminants, many of these compounds occur at different concentrations in 51
natural water bodies [2], where they may exert ecotoxicological effects at relatively low 52
concentrations [3, 4]. Although some of the compounds have been proposed for inclusion on 53
regulatory lists of contaminants (European Commission, 2006), there is relatively little information 54
on the ecotoxicological effects of complex mixtures at environmental levels, and, to date, they have 55
not been regulated [1]. Known environmental effects of some EOCs include the reduction of 56
macroinvertebrate diversity in rivers [3], behavioural changes in mosquito fish [4] and reproductive 57
disruption in fish [5], among others. Due to the difficulty of assessing the effects of EOCs on 58
ecosystems, the use of hazard quotients (HQs) based on the chemical composition of water samples 59
and tabulated predicted non-effect concentrations (PNECs) for different aquatic organisms has been 60
postulated as a good screening strategy [6]. 61
Microalgae-based wastewater treatment technologies such as high-rate algal ponds (HRAPs) have 62
received considerable attention in recent years due to the resource recovery of algal biomass, for use 63
as fertilizer, protein-rich feed or biofuel, and a high-quality effluent (treated wastewater)[7]. HRAPs 64
are shallow raceway reactors in which microalgae and bacteria grow in symbiosis. In such systems, 65
organic matter is degraded by heterotrophic bacteria, which consume oxygen provided by 66
microalgal photosynthesis; therefore, no aeration is needed [8]. Although the capability of 67
microalgae wastewater treatment systems to remove nutrients, heavy metals, bacteria, and 68
helminthic eggs has been studied since the 1950s, few studies have focused on the removal of 69
organic contaminants, namely, phenolic compounds, surfactants, biocides and polycyclic aromatic 70
1 2 3 4 5 6 7 8 9 1011121314151617181920212223242526272829303132333435363738394041424344454647484950515253545556575859606162636465
4
hydrocarbons [9-12]. Indeed, no attention has been paid to the effectiveness of HRAPs for 71
removing EOCs of environmental concern. 72
The removal of EOCs by conventional activated sludge WWTPs has been widely studied, but the 73
effectiveness of HRAPs for removing EOCs from wastewater has not yet been addressed. There is 74
only one study dealing with HRAPs’ capacity to remove tetracyclines, and it was performed at 75
laboratory-scale with synthetic wastewater [13]. Other studies dealing with microalgae’s capacity to 76
remove organic contaminants, such as polycyclic aromatic hydrocarbons (PAHs), biocides (e.g. 77
organotin compounds), surfactants and phenolic compounds, suggest that microalgae–based 78
wastewater technologies may remove microcontaminants by both abiotic (sorption, volatilization or 79
photodegradation) and biotic (biodegradation, microalgae uptake or metabolization) processes [14-80
16]. 81
The aim of this study was to evaluate for the first time, the effect of hydraulic retention time (HRT) 82
and ambient temperature / sunlight irradiation (seasonality) on the removal efficiency of 26 EOCs 83
in two HRAP pilot plants fed with real urban wastewater. The selected compounds were high 84
production volume chemicals (e.g. fire retardants, surfactants, anticorrosive agents, pesticides, 85
plasticizers, pharmaceuticals and personal care products, among others). Finally, aquatic risk 86
assessment was performed based on the concentrations of the detected EOCs in the influent and 87
effluent water samples, and the listed EC50 values for Daphnia magna. 88
89
2. Material and Methods 90
2.1. Chemicals and reagents 91
Gas chromatography (GC) grade (Suprasolv) hexane, methanol, and ethyl acetate were obtained 92
from Merck (Darmstadt, Germany). Analytical-grade hydrogen chloride was obtained from Panreac 93
(Barcelona, Spain). Caffeine, acetaminophen, ibuprofen, methyl dihydrojasmonate, oxybenzone, 94
1 2 3 4 5 6 7 8 9 1011121314151617181920212223242526272829303132333435363738394041424344454647484950515253545556575859606162636465
5
ketoprofen, hydrocinnamic acid, 5-methylbenzotriazole, naproxen, carbamazepine, galaxolide, 95
benzothiazole, diclofenac, methylparaben, benzotriazole, tonalide, OH-benzothiazole, tributyl 96
phosphate, tris(2-chloroethyl) phosphate, triphenyl phosphate, triclosan, cashmeran, octylphenol, 97
diazinon, celestolide, atrazine, bisphenol A, 2,4-D, atrazine D5, mecoprop D3, tonalide D3 and 98
dihydrocarbamazepine were purchased from Sigma-Aldrich (Steinheim, Germany). 99
Trimethylsulfonium hydroxide (TMSH) was obtained from Fluka (Buchs, Switzerland). Strata-X 100
polymeric SPE cartridges (200 mg) were purchased from Phenomenex (Torrance, CA, USA) and 101
the 0.7 μm glass fibre filters (ø 47 mm) were obtained from Whatman (Maidstone, UK). 102
103
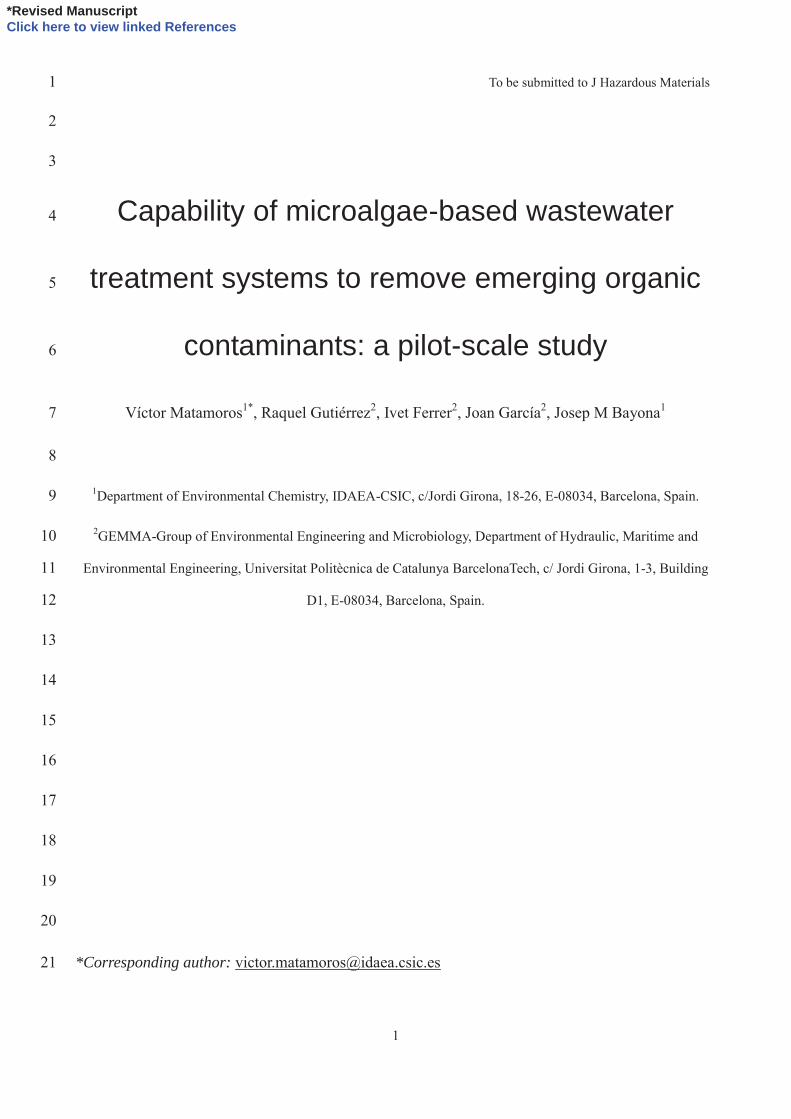
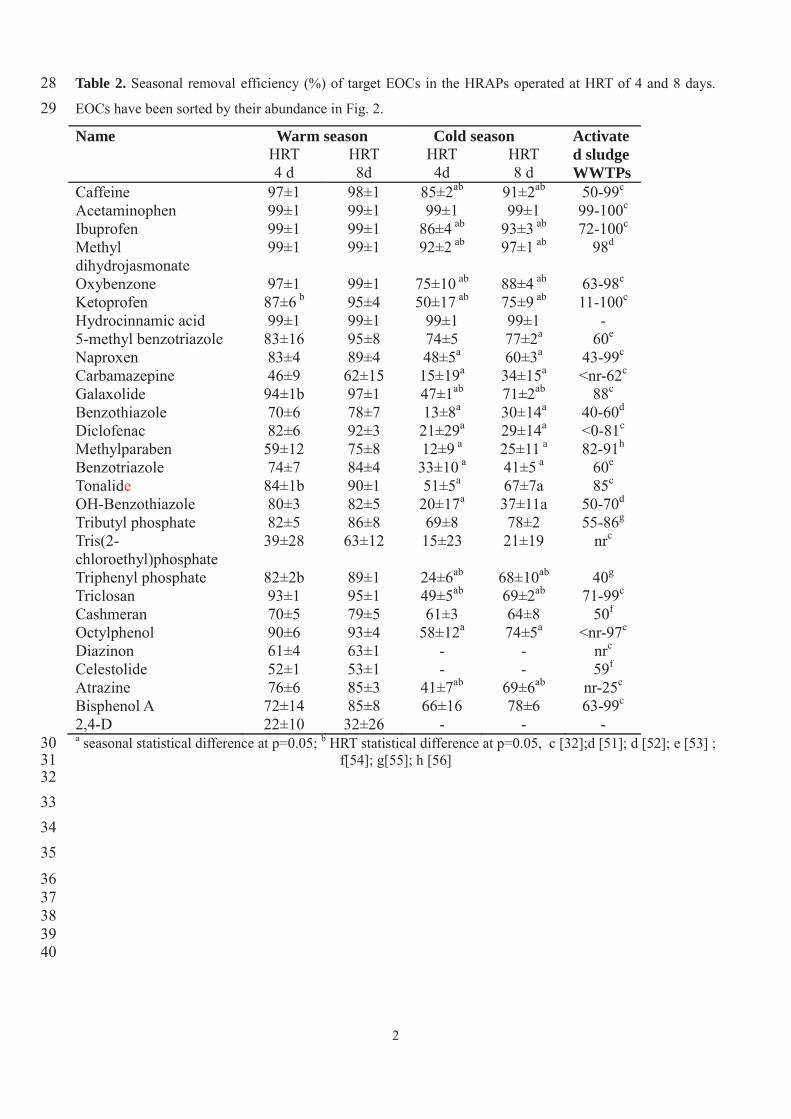
2.2. Description of the HRAP pilot plant 104
The experimental set-up was located outdoors at the laboratory of the GEMMA research group 105
(Universitat Politècnica de Catalunya-BarcelonaTech, Spain). The system has been operated since 106
March 2010. The microalgae production system was composed of a screening pre-treatment and 107
two identical parallel lines, each one equipped with a primary settler, a pilot high-rate algal pond 108
and a final settler for biomass separation (Fig. 1). Paddle wheel was set at 5 rpm giving mixed 109
liquor with a linear velocity of recirculation of 11 cm s-1, enough to ensure complete mixing. Urban 110
wastewater was pumped from a municipal sewer to a homogenisation tank (1.2 m3), which was 111
continuously stirred to avoid solids sedimentation. From there, the wastewater was pre-treated and 112
conveyed to each line. The primary treatment included a settler with an internal diameter of 0.3 m, a 113
total height of 0.4 m and an effective volume of 7 L that was operated at an HRT of 0.9 h. Primary 114
effluent from the settlers was pumped to the HRAPs by means of peristaltic pumps. The 115
experimental HRAPs were PVC raceway ponds equipped with a paddle wheel for stirring the mixed 116
liquor (Fig.1). The two HRAPs had a nominal volume of 0.47 m3, a surface area of 1.54 m2 and a 117
water depth of 0.3 m, and they were operated simultaneously with different HRTs (4 and 8 days 118
corresponding to 117.5 and 58.8 L d-1 respectively). The final settlers for biomass separation had an 119

1 2 3 4 5 6 7 8 9 1011121314151617181920212223242526272829303132333435363738394041424344454647484950515253545556575859606162636465
6
internal diameter of 0.15 m, a total height of 0.3 m and an effective volume of 3.5 L that were 120
operated at an HRT of 0.7 and 1.4 h for the HRAP set at 4 days HRT and 8 days, respectively. Note 121
that these settlers were only used for biomass separation, which was not recycled back to the 122
HRAPs. 123
124
2.3. Sampling strategy 125
Two sampling campaigns were carried out, one in July 2013 (warm season) and the other in 126
December 2013 (cold season). In each campaign, influent and effluent grab samples were collected 127
from both HRAPs at the same time each day (9:00 am) for a period of 10 days (n=8), from Monday 128
to the Wednesday of the next week, Saturday and Sunday were not sampled. The samples were 129
collected in the primary effluent from the settler and at the effluent from both HRAPs (Fig. 1). No 130
rainfall events were recorded at any time during the sampling period. All water samples were 131
collected in 1000 mL amber glass bottles, which were transported under refrigeration to the 132
laboratory, where they were stored at 4 ºC until analysis. The sample holding time was less than 12 133
hours. 134
135
2.4. Analytical procedures 136
Conventional wastewater quality parameters, including ammonium nitrogen (NH4-N), total 137
suspended solids (TSS) and chemical oxygen demand (COD), were determined using the Standard 138
Methods (APHA, 2001). Onsite measurements of water temperature, dissolved oxygen (DO) and 139
pH were taken using a Checktemp-1 Hanna thermometer, an Eutech Ecoscan DO6 oxygen meter 140
and a Crison pH-meter, respectively. 141
1 2 3 4 5 6 7 8 9 1011121314151617181920212223242526272829303132333435363738394041424344454647484950515253545556575859606162636465
7
For each campaign, 2 well-mixed 25 mL samples from each HRAP were examined by light 142
microscopy and the predominant microalgae were identified and quantified. Microalgae genus were 143
identified from classical specific literature [17, 18]. 144
All water samples were filtered and processed as previously reported (Matamoros and Bayona, 145
2006). A 100 mL sample was spiked with 50 ng of a surrogate standard (atrazine D5, mecoprop D3, 146
tonalide D3, and dihydrocarbamazepine). The spiked sample was percolated through a previously 147
activated polymeric solid-phase extraction cartridge (200 mg Strata X). Elution was performed with 148
10 mL of hexane/ethyl acetate (1:1). The eluted extract was evaporated under a gentle nitrogen 149
stream until ca. 100 μL remained, at which point 20 ng of triphenylamine was added as an internal 150
standard. Finally, the vial was reconstituted to 300 μL with ethyl acetate. 151
The TSS collected in the glass fibre filters (0.7 μm) were processed according to a previously 152
reported analytical method [19]. Briefly, the filters were freeze-dried and extracted in an ultrasonic 153
bath with hexane/acetone (3:1) for 15 minutes. The extracts were then further processed as water 154
samples. 155
Methylation of the acidic carboxyl group was performed in a hot GC PTV injector (270 ºC) by 156
adding 10 μL of TMSH solution (0.25 mol L-1 in methanol) to a 50 μL sample before injection. 157
Derivatized samples were analysed into a Bruker 450-GC gas chromatograph coupled to a Bruker 158
320-MS triple quadrupole mass spectrometer (Bruker Daltonics Inc., Billerica, MA, USA) fitted 159
with a 20 m × 0.18 mm, 0.18 μm film thickness Sapiens X5-MS capillary column coated with 5% 160
diphenyl 95% dimethyl polysiloxane from Teknokroma (Sant Cugat del Vallès, Spain) operated in 161
the multiple reaction mode (MRM). Validation of the analytical methodology has been described 162
elsewhere [20]. The limit of detection (LOD) and limit of quantification (LOQ) of the analytical 163
methodology were determined (using ultra-pure water) based on the mean background noise plus 3 164
or 10 times the standard deviation of the background noise, respectively. The LOD and LOQ ranged 165
from 1 to 40 ng L-1 and from 3 to 80 ng L-1, respectively. Recoveries and repeatability were always 166
1 2 3 4 5 6 7 8 9 1011121314151617181920212223242526272829303132333435363738394041424344454647484950515253545556575859606162636465
8
higher than 80% and lower than 20%, respectively. 167
168
2.5. Data analysis 169
The removal efficiencies of conventional water quality parameters and EOCs were calculated as 170
follows (equation 1): 171
172
173
(Equation 1) 174
175
where C’a is the average concentration of a selected compound in the HRAP influents in each 176
sampling campaign, Ci is the concentration in the HRAP effluents on each sampling day, and n is 177
the number of samples collected per sampling campaign (n=8). HLR are 83 or 43 L m-2 d-1 at a HRT 178
of 8 and 4 days, respectively. Evaporation rates (EVRs) are 21 and 9 L m-2 d-1 in warm and cold 179
season, respectively calculated from Turc’s equation. 180
181
The experimental results were statistically evaluated using the SPSS v.13 package (Chicago, IL, 182
USA). According with the data set size, non-parametric statistics were applied. The comparison of 183
means was conducted by means of the Kruskal–Wallis test. Spearman's coefficients were used for 184
correlations between variables (physicochemical parameters, removal efficiencies and influent 185
concentration). Significance was defined as p < 0.05. 186
187
188
189
190
1 2 3 4 5 6 7 8 9 1011121314151617181920212223242526272829303132333435363738394041424344454647484950515253545556575859606162636465
9
3. Results and Discussion 191
3.1 Assessment of conventional water quality parameters 192
The HRAPs’ performance was monitored in warm and cold seasons (Table 1). COD, TSS and NH4-193
N concentrations in the primary settlers’ effluents were within the typical range of a conventional 194
primary effluent [21]. Note that DO concentration was quite high for a primary effluent due to 195
wastewater stirring in the homogenisation tank. The actual surface organic loading rates (OLRs) 196
applied to the HRAPs were, on average, 13 and 26 g total COD m-2 d-1 (HRT=8 and 4 d 197
respectively) in the warm season and 29 and 58 g total COD m-2 d-1 (HRT=8 and 4 d respectively) 198
in the cold season. 199
The microalgae present in the HRAPs were mostly species of the Phylum Chlorophyta, and varied 200
depending on seasonal conditions. In the warm season, predominant algae species were 201
Stigeoclonium sp. (filamentous algae); diatoms, Chlorella sp. and Monoraphidium sp. In the cold 202
season, predominant algae species were Chlorella sp.; diatoms, Stigeoclonium sp. In both 203
campaigns, the number of species was higher in the HRAP set at HRT of 8 days. 204
In the present study, mixed liquor TSS was analyzed as an indicator of biomass concentration in the 205
HRAP. Note that biomass in such type of systems corresponds to microalgae as well as bacteria, and 206
the proportion of each cannot be easily estimated with conventional well-established kinetics and 207
thermodynamic data for heterotrophic cultures. However, previous studies based on microscope 208
observations and the linear correlation between chlorophyll a and TSS suggest that the percentage 209
of microalgal biomass in HRAPs is higher than 80-90% [22-24]. Average microalgal biomass 210
concentration and production were clearly higher in the warm season than in the cold season in 211
relation with the higher solar radiation (Table 1). Biomass concentration was slightly higher in the 212
HRAP with a HRT 8 days where lower flow-rate gave place to less biomass wash-up, as already 213
observed in other studies [22, 25, 26]. Despite this, biomass production was higher in the HRAP 214
operated at a HRT of 4 days, in these systems biomass production usually increases inversely with 215
1 2 3 4 5 6 7 8 9 1011121314151617181920212223242526272829303132333435363738394041424344454647484950515253545556575859606162636465
10
the HRT [27]. 216
Biomass production values are in accordance with those previously reported [28]. De Godos et al. 217
[29] observed a biomass production of 21.3-27.7 g TSS m-2 d-1 in summer (average solar radiation 218
of 6774 W d-1 m-2) for HRAPs operating at 10 HRT fed with diluted swine manure. In winter period 219
(solar radiation of 1785 W d-1 m-2) biomass production decreased to 5.7-6.1 g TSS m-2 d-1. García et 220
al. [23] using the same HRAPs as in the present study reported a production between 12.7 and 14.8 221
m-2 d-1. The HRAPs’ performance (Table 1) was consistent throughout the experimental period, with 222
removal efficiencies similar to those reported in previous studies for this pilot plant [8] and others 223
previously reported [28]. COD removal was moderate (66-85%) and its removal in these systems 224
depends on influent concentration because background concentration remains around 50-70 mg L-1 225
[23]. Up to 99% of NH4-N was removed in the HRAPs in the warm season at both HRTs, whereas 226
the removal rate was lower and different at both HRTs (90 vs 98%) in the cold season. Hence, 227
environmental conditions (i.e. temperature and solar radiation) played an important role in NH4-N 228
removal, whereas HRT was only relevant in the cold season. Mechanisms for nitrogen removal have 229
been studied in detail in the past and the most predominant include volatilisation, biological uptake 230
and nitrification [24, 28]. NH4-N removal values were similar to those found in the literature. De 231
Godos et al. [29] found in summer a COD and NH4-N removal of 76 and 96% respectively, whereas 232
in winter those removal decreased to 57 and 92% for HRAPs operating at a HRT of 10 days. 233
Sutherland et al. [30] found a decrease on NH4-N removal between summer (77%) and winter 234
(53%) in a HRAP operating at a HRT of 4 and 9 days respectively. 235
236
3.2. Occurrence and removal efficiency of EOCs 237
For this study, we selected the emerging contaminants with the highest concentrations that are most 238
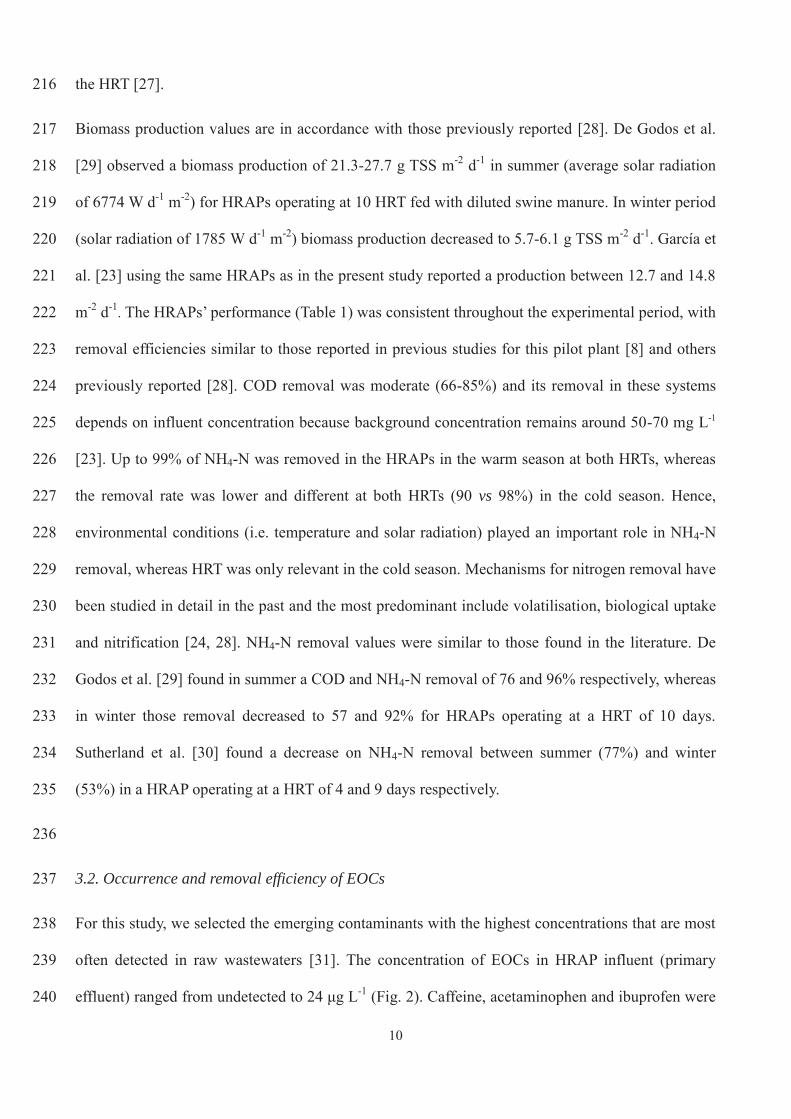
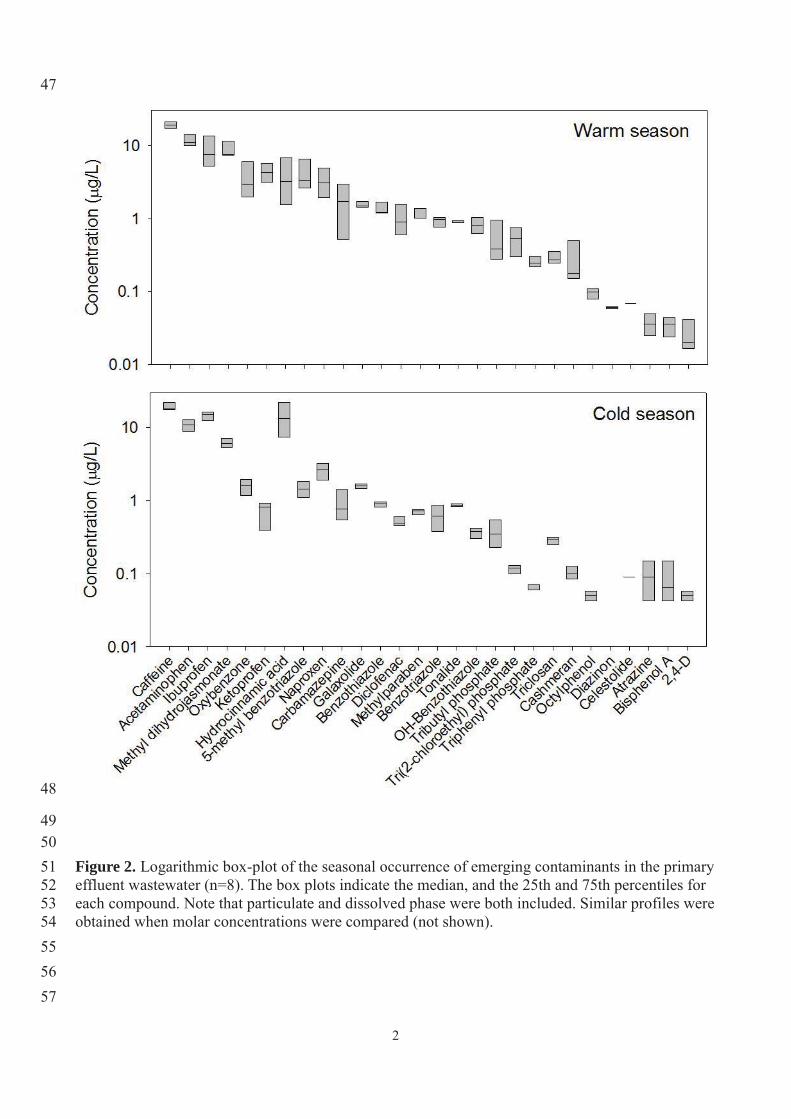
often detected in raw wastewaters [31]. The concentration of EOCs in HRAP influent (primary 239
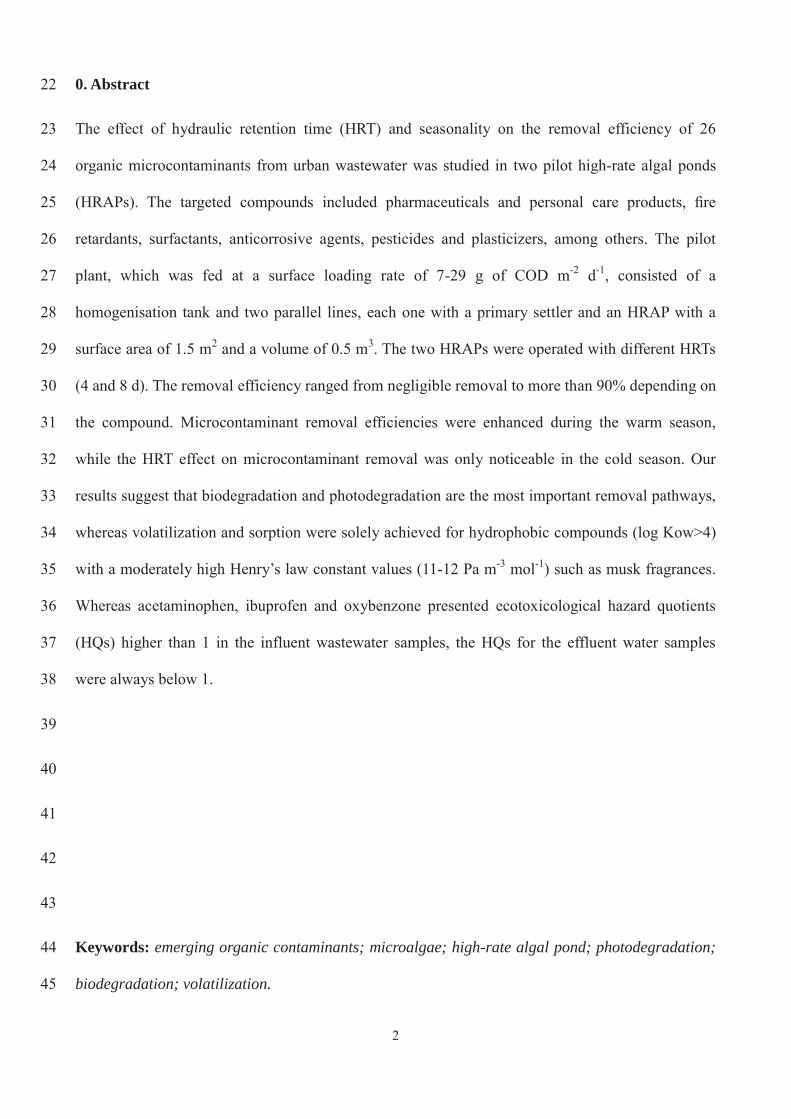
effluent) ranged from undetected to 24 μg L-1 (Fig. 2). Caffeine, acetaminophen and ibuprofen were 240

1 2 3 4 5 6 7 8 9 1011121314151617181920212223242526272829303132333435363738394041424344454647484950515253545556575859606162636465
11
usually detected at concentrations higher than 9 μg L-1, in keeping with the reported literature [32]. 241
Although the influent COD showed a high seasonal variability (Table 1), the concentration of the 242
studied EOCs showed no statistically significant seasonal difference (p=0.84). This may be 243
explained by the presence of a primary treatment that favours a more constant influent wastewater 244
in terms of quality, as can be seen in the low variability of the EOC concentrations (Fig. 2). 245
Table 2 shows the removal efficiencies of the target EOCs. They can be classified into four groups 246
in accordance with the corresponding overall average removal efficiency in the HRAPs: high 247
removal (>90%: caffeine, acetaminophen, ibuprofen, methyl dihydrojasmonate and hydrocinnamic 248
acid), moderate-to-high removal (from 60% to 90%: oxybenzone, ketoprofen, 5-249
methyl/benzotriazole, naproxen, galaxolide, tonalide, tributyl phosphate, triclosan, bisphenol A and 250
octylphenol), moderate-to-low removal (from 40 to 60%: diclofenac, benzotriazole, OH-251
benzothiazole, triphenyl phosphate, cashmeran, diazinon, benzothiazole, celestolide, 2,4-D and 252
atrazine) and poor or no removal (<40%, carbamazepine, methyl paraben, tris(2-chloroethyl) 253
phosphate). 254
Taking into account the configuration of the HRAPs, the most relevant removal processes that may 255
occur in these systems can be biodegradation, photodegradation, volatilization and sorption to 256
microalgae biomass. Uptake by microalgae is an important removal process, and it was assessed by 257
analysing the occurrence of EOCs in the TSS (solids retained in the filters). Table 1 in the 258
Supplementary Material (SM) shows that the most abundant compounds in the biomass (mostly 259
microalgae) were the most hydrophobic ones, such as galaxolide and tonalide (log Kow>5). Hence, 260
HRAPs may remove hydrophobic compounds by sorption, similarly to other wastewater treatment 261
technologies such as constructed wetlands (CWs) and activated sludge systems [33, 34]. Despite the 262
higher concentration of TSS in the HRAPs during the warm season, due to the greater biomass 263
production and evaporation losses (Table 1), the concentration of musk fragrances in the TSS was 264
higher in winter. Therefore, it may be postulated that the increase in biomass (microalgae, 265
1 2 3 4 5 6 7 8 9 1011121314151617181920212223242526272829303132333435363738394041424344454647484950515253545556575859606162636465
12
heterotrophs and non-photosynthetic autotrophs organisms) improved the biodegradability of these 266
compounds or that the higher sunlight irradiation and temperatures in warm season improved the 267
volatilization rates. This is in keeping with the moderate biodegradability found for musk fragrances 268
(>75%) in lab-scale activated sludge reactors [35] and the tabulated high Henry’s law constants (a 269
measure of air-water partitioning) for musk fragrances (11-12 Pa m-3 mol-1). The occurrence of most 270
of the studied EOCs in the filters was below their LOD. This may be due to the fact that these EOCs 271
were not uptaken by microalgae or because they were removed by microalgal metabolism. A 272
microalgae removal effect due to the release of exudates likewise cannot be disregarded [36]. In 273
fact, it has been proved that the consortia of cyanobacteria/microalgae and bacteria can be efficient 274
in detoxification of organic and inorganic pollutants, and removal of nutrients from wastewaters, 275
compared to the individual microorganisms. Cyanobacterial/algal photosynthesis provides oxygen 276
and organic exudates that serves to the pollutant-degrading heterotrophic bacteria [37]. 277
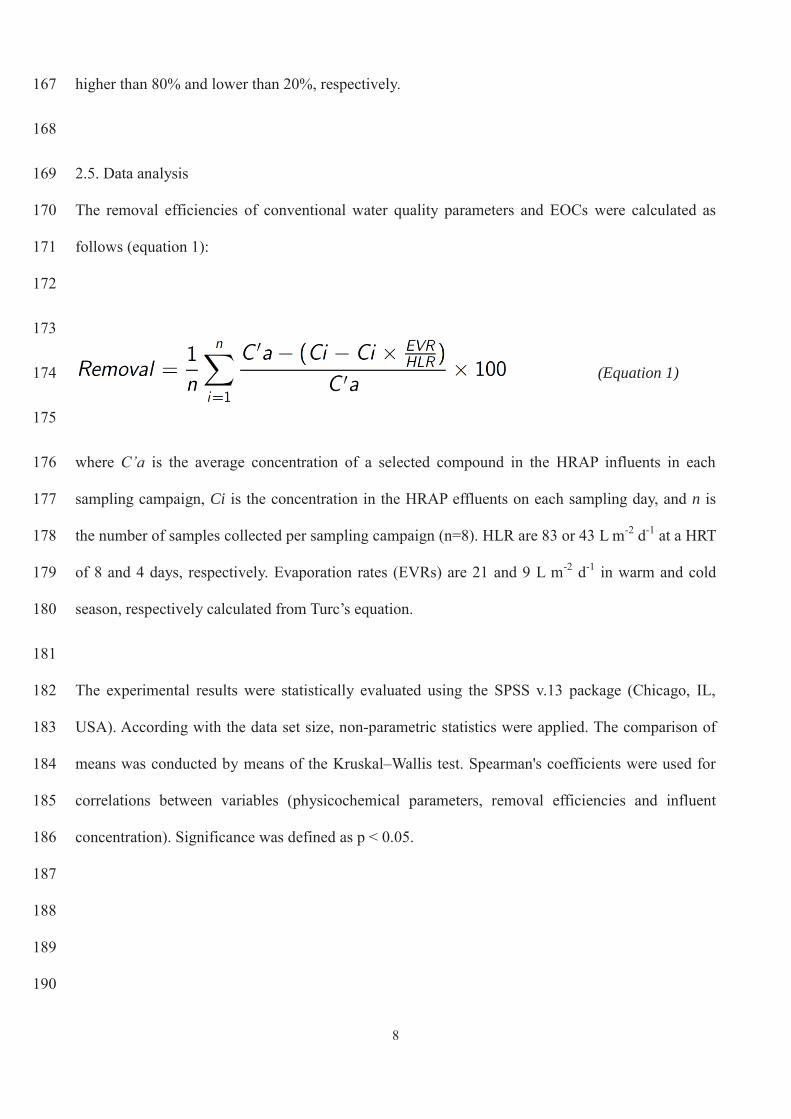
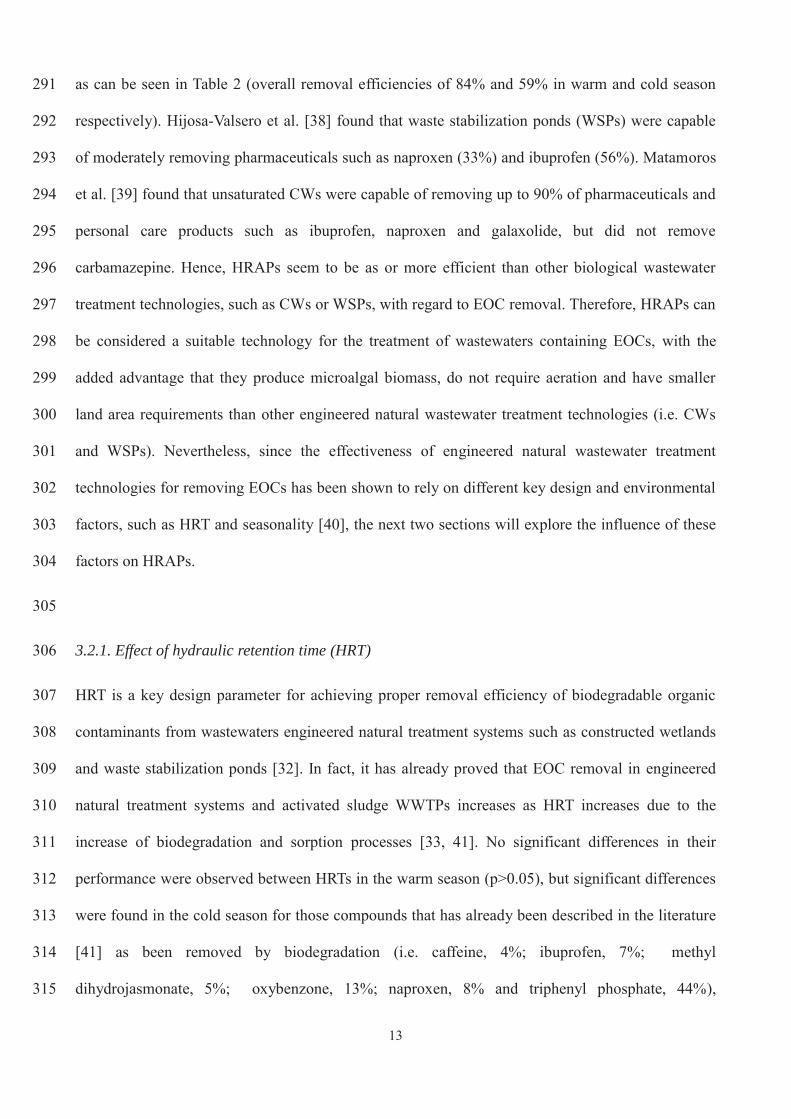
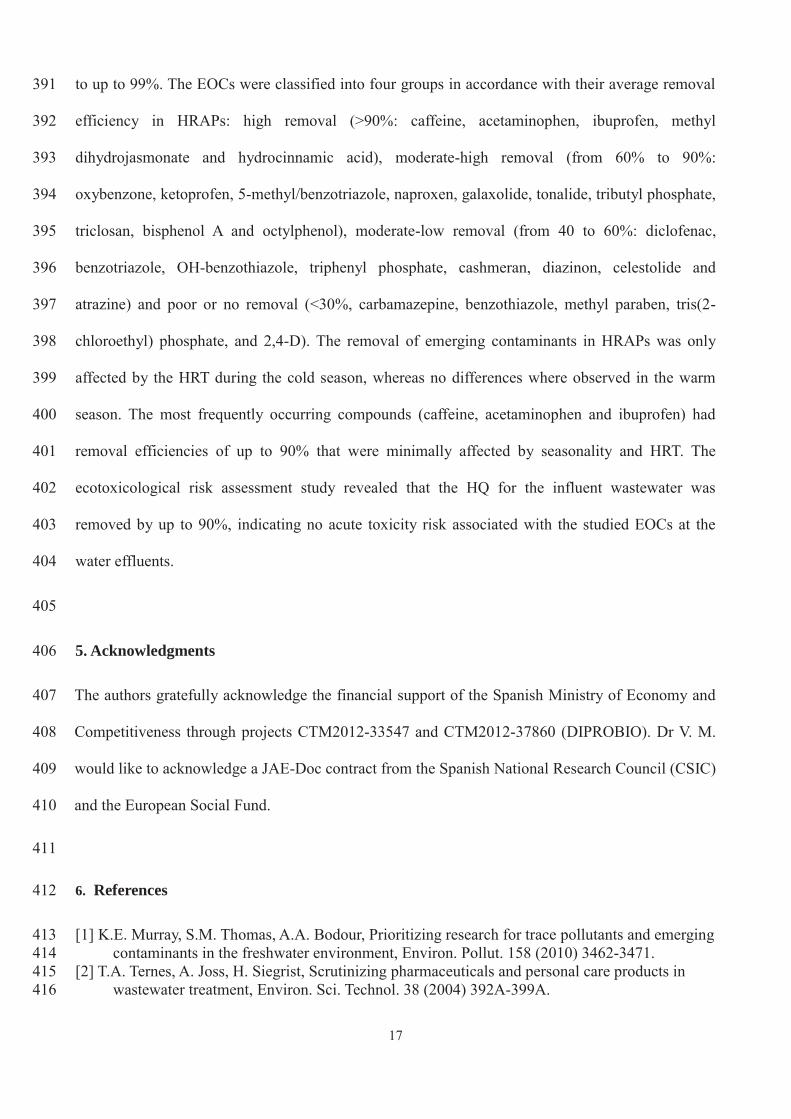
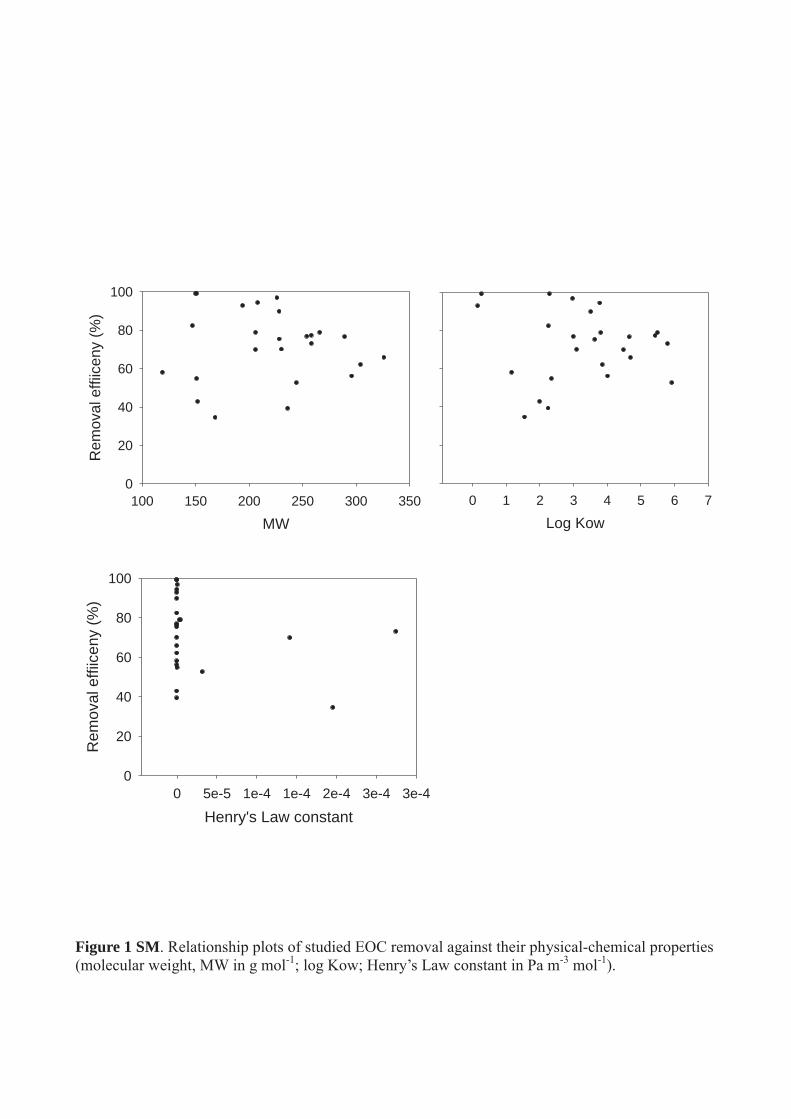
The overall average removal efficiencies of the studied EOCs were plotted against their 278
physicochemical properties (log Kow, molecular weight (MW) and Henry’s law constant) as is 279
shown in Fig. 1 SM. Although the plots seem to show a relationship between the EOC removal 280
efficiencies and MW (Spearman’s correlation coefficient = -0.197), log Kow (Spearman’s 281
correlation coefficient = -0.080) and Henry’s law constant (Spearman’s correlation coefficient = -282
0.075), no significant correlations were found (significance level >0.05). This may be explained by 283
the complexity of the chemical compounds studied as well as the fact that different removal 284
processes occurred simultaneously. Conversely, a statistically significant relationship between 285
influent concentration and removal efficiency was obtained (Spearman’s correlation coefficient = 286
0.627, significance level =0.002). This may be explained by the fact that biodegradation needs a 287
certain compound concentration before microbial degradation is stimulated. Nevertheless, this 288
general rule must be applied with care and further work is necessary in this field. 289
The removal efficiency of HRAPs is comparable to that of conventional activated sludge WWTPs, 290
1 2 3 4 5 6 7 8 9 1011121314151617181920212223242526272829303132333435363738394041424344454647484950515253545556575859606162636465
13
as can be seen in Table 2 (overall removal efficiencies of 84% and 59% in warm and cold season 291
respectively). Hijosa-Valsero et al. [38] found that waste stabilization ponds (WSPs) were capable 292
of moderately removing pharmaceuticals such as naproxen (33%) and ibuprofen (56%). Matamoros 293
et al. [39] found that unsaturated CWs were capable of removing up to 90% of pharmaceuticals and 294
personal care products such as ibuprofen, naproxen and galaxolide, but did not remove 295
carbamazepine. Hence, HRAPs seem to be as or more efficient than other biological wastewater 296
treatment technologies, such as CWs or WSPs, with regard to EOC removal. Therefore, HRAPs can 297
be considered a suitable technology for the treatment of wastewaters containing EOCs, with the 298
added advantage that they produce microalgal biomass, do not require aeration and have smaller 299
land area requirements than other engineered natural wastewater treatment technologies (i.e. CWs 300
and WSPs). Nevertheless, since the effectiveness of engineered natural wastewater treatment 301
technologies for removing EOCs has been shown to rely on different key design and environmental 302
factors, such as HRT and seasonality [40], the next two sections will explore the influence of these 303
factors on HRAPs. 304
305
3.2.1. Effect of hydraulic retention time (HRT) 306
HRT is a key design parameter for achieving proper removal efficiency of biodegradable organic 307
contaminants from wastewaters engineered natural treatment systems such as constructed wetlands 308
and waste stabilization ponds [32]. In fact, it has already proved that EOC removal in engineered 309
natural treatment systems and activated sludge WWTPs increases as HRT increases due to the 310
increase of biodegradation and sorption processes [33, 41]. No significant differences in their 311
performance were observed between HRTs in the warm season (p>0.05), but significant differences 312
were found in the cold season for those compounds that has already been described in the literature 313
[41] as been removed by biodegradation (i.e. caffeine, 4%; ibuprofen, 7%; methyl 314
dihydrojasmonate, 5%; oxybenzone, 13%; naproxen, 8% and triphenyl phosphate, 44%), 315
1 2 3 4 5 6 7 8 9 1011121314151617181920212223242526272829303132333435363738394041424344454647484950515253545556575859606162636465
14
photodegradegradation (i.e. ketoprofen; 25% and triclosan, 20%) and sorption or volatilization (i.e. 316
galaxolide, 24% and tonalide, 16%). As already noted, conventional water quality parameters such 317
as COD and NH4-N behaved similarly. From these results, it can be postulated that biodegradation, 318
photodegradation, sorption and volatilization removal mechanism were likely affected by the 319
increase of HRT in the cold season. García-Rodríguez et al. [40] reported that biological wastewater 320
treatment technologies for removing EOCs are highly dependent on HRT because it enhances 321
biodegradation, photodegradation and sorption removal processes. In general, the higher the HRT, 322
the greater the EOC removal efficiency. However, our results suggest that an HRT of 4 days is 323
enough to remove most of the compounds in both seasons. Therefore, while this technology is 324
competitive in terms of HRT compared to CWs and WSPs, activated sludge WWTPs are generally 325
set at an HRT of 12-24 hours or lower. Notwithstanding the foregoing, activated sludge WWTPs 326
also have higher energy requirements (0.6 kWh m-3 for activated sludge WWTPs vs. 0.02 kWh m-3 327
for HRAPs). Finally, the lower microcontaminant sorption onto the biomass (table 1-SM) than in 328
conventional activated sludge WWTPs biosolids [42] is relevant for risk management and sludge 329
valorisation. This low bioaccumulation of microcontaminants into the biomass have already been 330
reported for vegetables [43], but this is the first time that it has been assessed for microalgae. 331
332
3.2.2 Seasonality (environmental conditions) 333
Seasonality is relevant to achieving adequate EOC removal efficiency in mild climates such as that 334
of the NW Mediterranean because it affects temperature, daylight duration and intensity, and 335
biomass production, four important factors influencing biodegradation, photodegradation, 336
volatilization and sorption EOC removal processes [40]. Significant differences (p<0.05) between 337
the warm and cold seasons were observed for the removal of above described biodegradable 338
compounds (i.e. caffeine, ibuprofen, methyl dihydrojasmonate, oxybenzone, naproxen, 339
benzothiazole, methylparaben, benzotriazole, 5-methyl-benzotriazole, OH-benzothiazole, and 340
1 2 3 4 5 6 7 8 9 1011121314151617181920212223242526272829303132333435363738394041424344454647484950515253545556575859606162636465
15
triphenyl phosphate), photodegradable compounds (i.e. ketoprofen, diclofenac, and triclosan) and 341
highly hydrophobic / moderately volatile compounds (i.e. galaxolide and tonalide). The higher 342
temperature (11 vs. 26 ºC, on a daily average) and greater solar radiation (1675 vs. 7049 W d-1 m-2) 343
in the warm season may explain these differences. It should be noted that the effect of seasonality 344
on the pollutant removal performance of this technology for the most abundant compounds was low 345
(around 10-20%) or null (i.e. for caffeine, acetaminophen, ibuprofen and methyl dihydrojasmonate). 346
In contrast, various authors [44-46] have reported higher seasonal variability for EOC removal by 347
other engineered natural wastewater treatment technologies (CWs or WSPs). Hence, although the 348
HRAP technology seems to be a robust and reliable wastewater treatment technology in terms of 349
EOC removal efficiency, further studies are required to provide more insight. 350
351
3.3. Aquatic risk assessment 352
Aquatic risk assessment throughout the HRAP treatment was performed based on the 353
concentrations of the detected EOCs in the influent and effluent water samples, and the listed EC50 354
values for Daphnia magna. Hazard quotient indexes (HQs) were calculated according to the 355
following equation (2): 356
(Equation 2) 357
358
where PNEC is the predicted non-effect concentration and MEC is the measured environmental 359
concentration at the influent or effluent of each HRAP reactor. PNEC values were estimated for 360
Daphnia magna, dividing the EC50 values (48 hours) by a recommended arbitrary safety factor of 361
1000 [47]. The EC50 values used in this study were collected from the literature and are 362
summarized in Table 2SM. When more than one EC50 value was reported for a single compound, 363
the lowest value was used. When no experimental values were available, the EC50 values were 364
estimated with ECOSAR v1.10 (EPI Suite software, US EPA). 365
1 2 3 4 5 6 7 8 9 1011121314151617181920212223242526272829303132333435363738394041424344454647484950515253545556575859606162636465
16
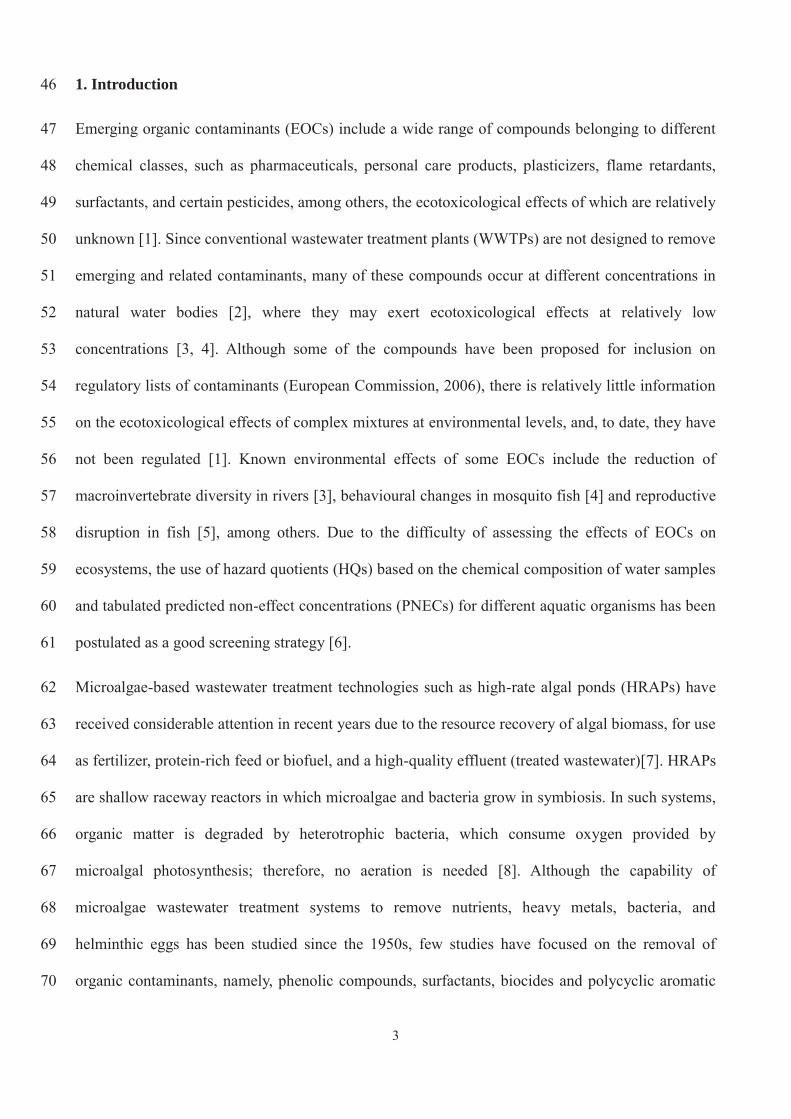
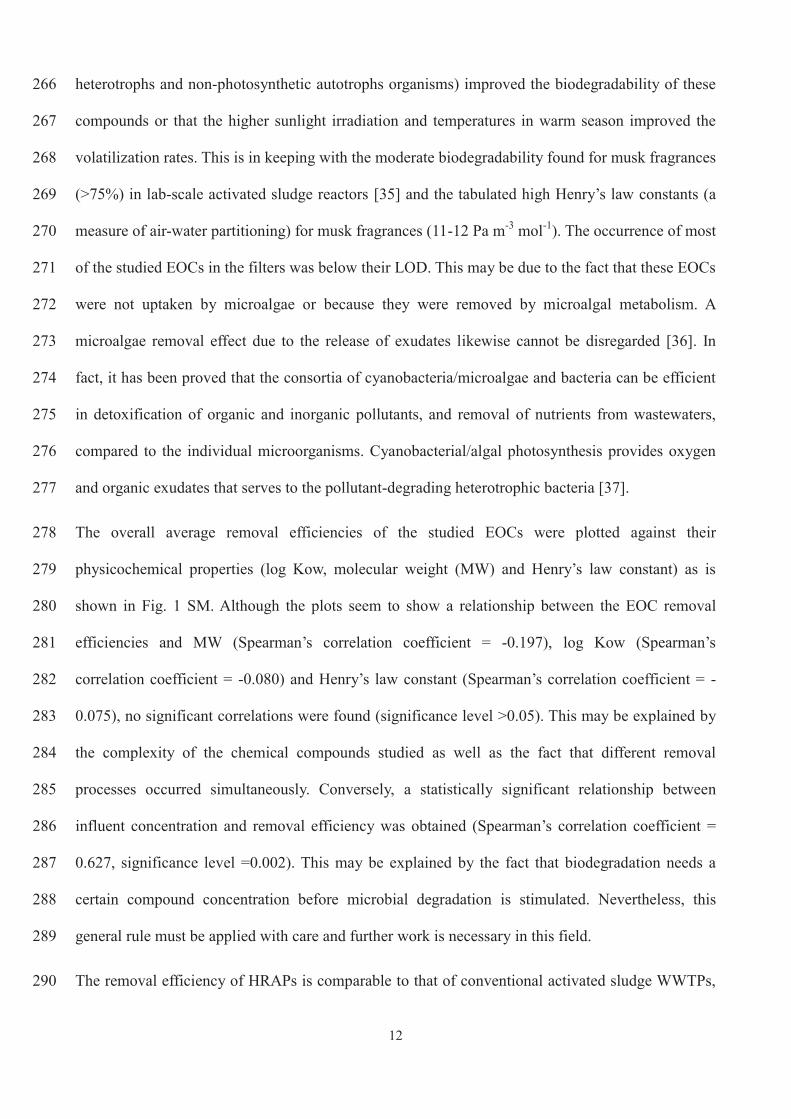
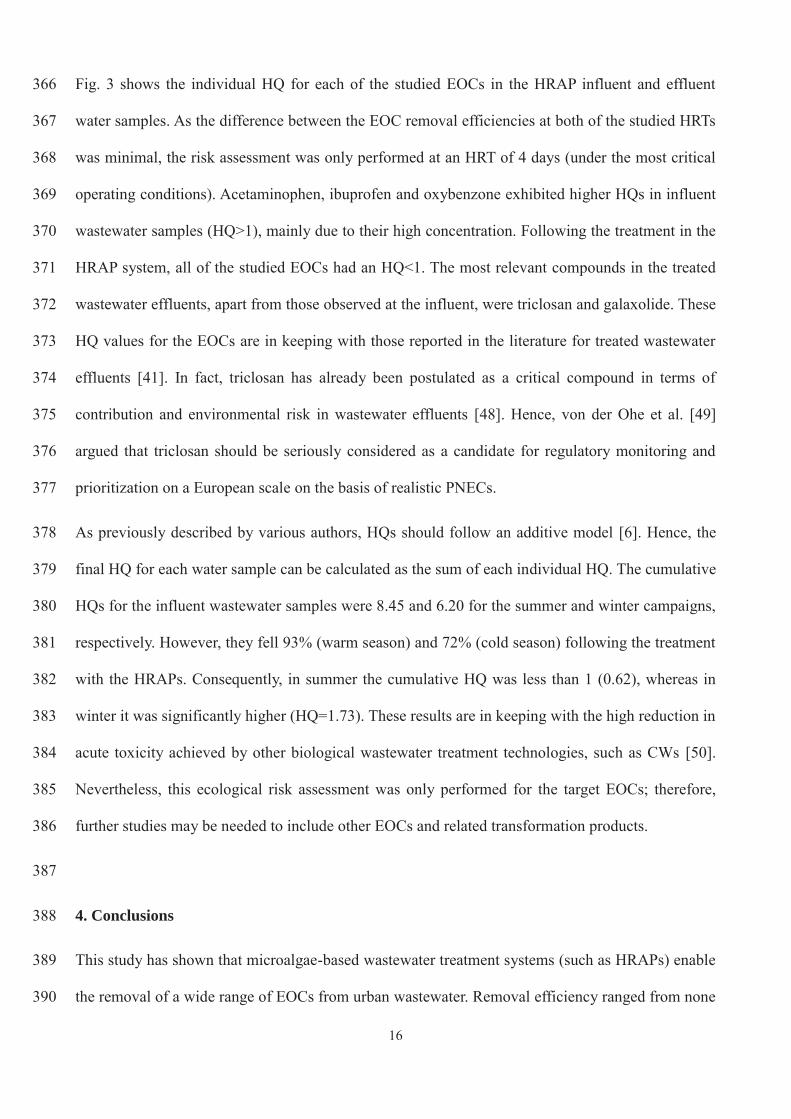
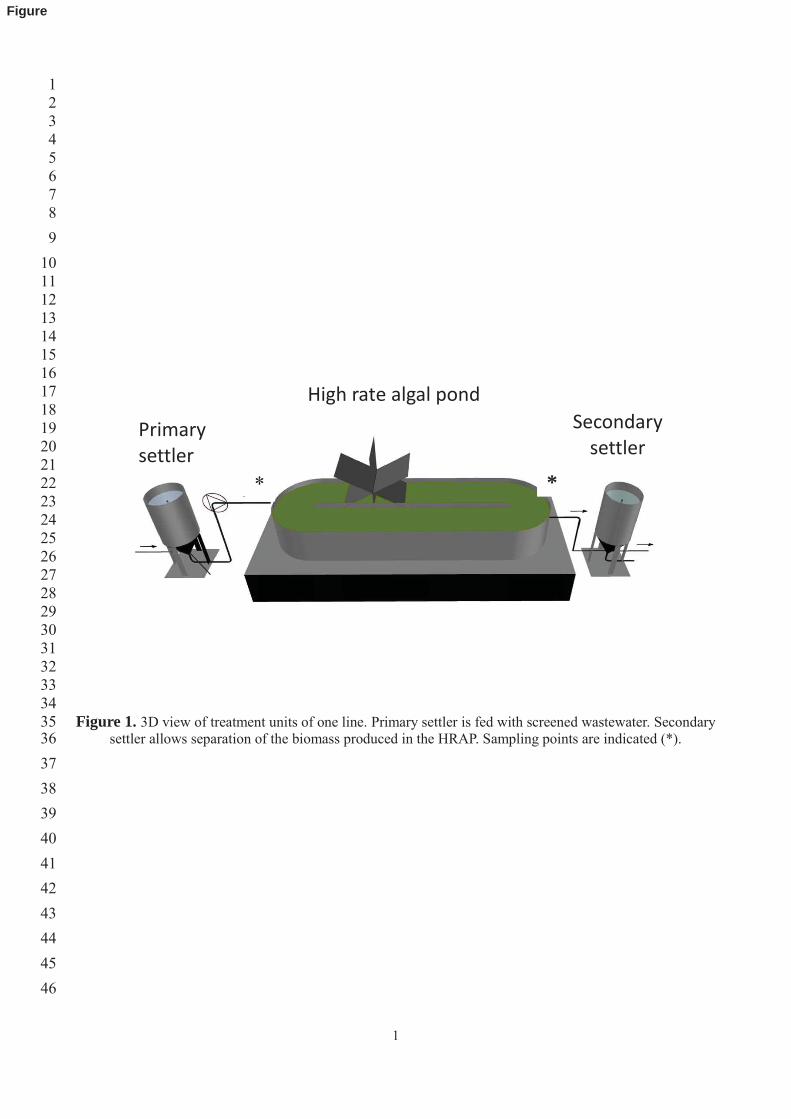
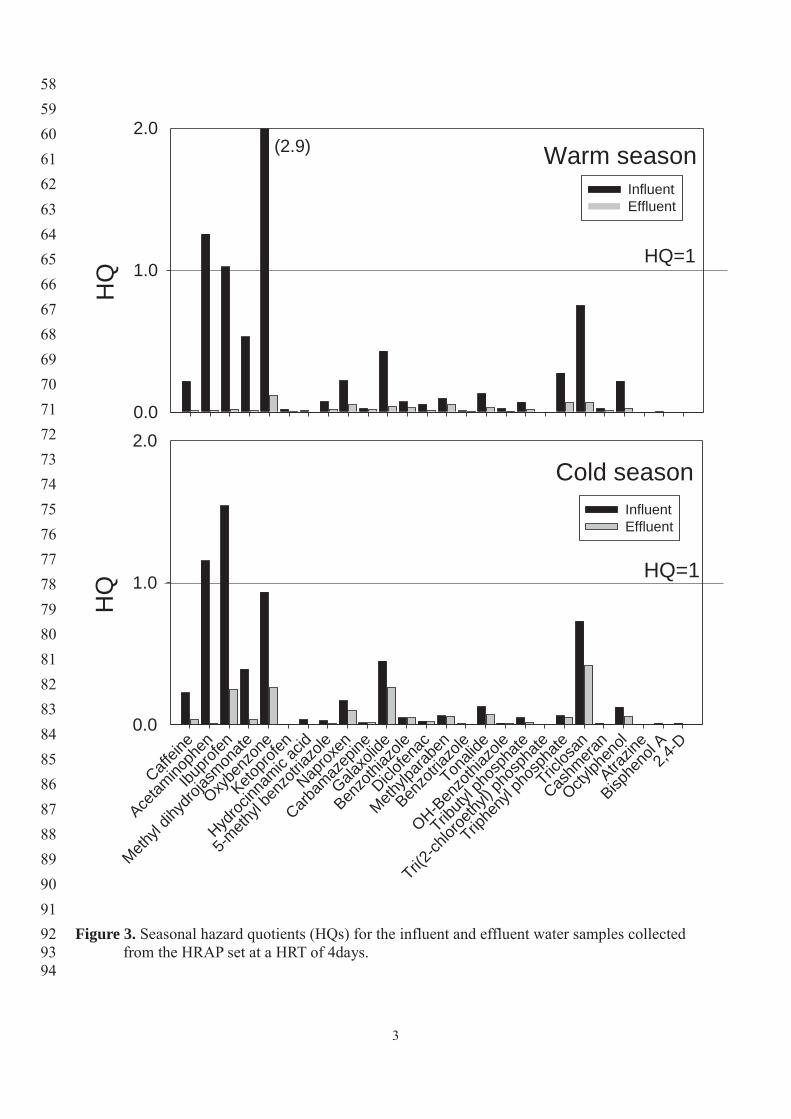
Fig. 3 shows the individual HQ for each of the studied EOCs in the HRAP influent and effluent 366
water samples. As the difference between the EOC removal efficiencies at both of the studied HRTs 367
was minimal, the risk assessment was only performed at an HRT of 4 days (under the most critical 368
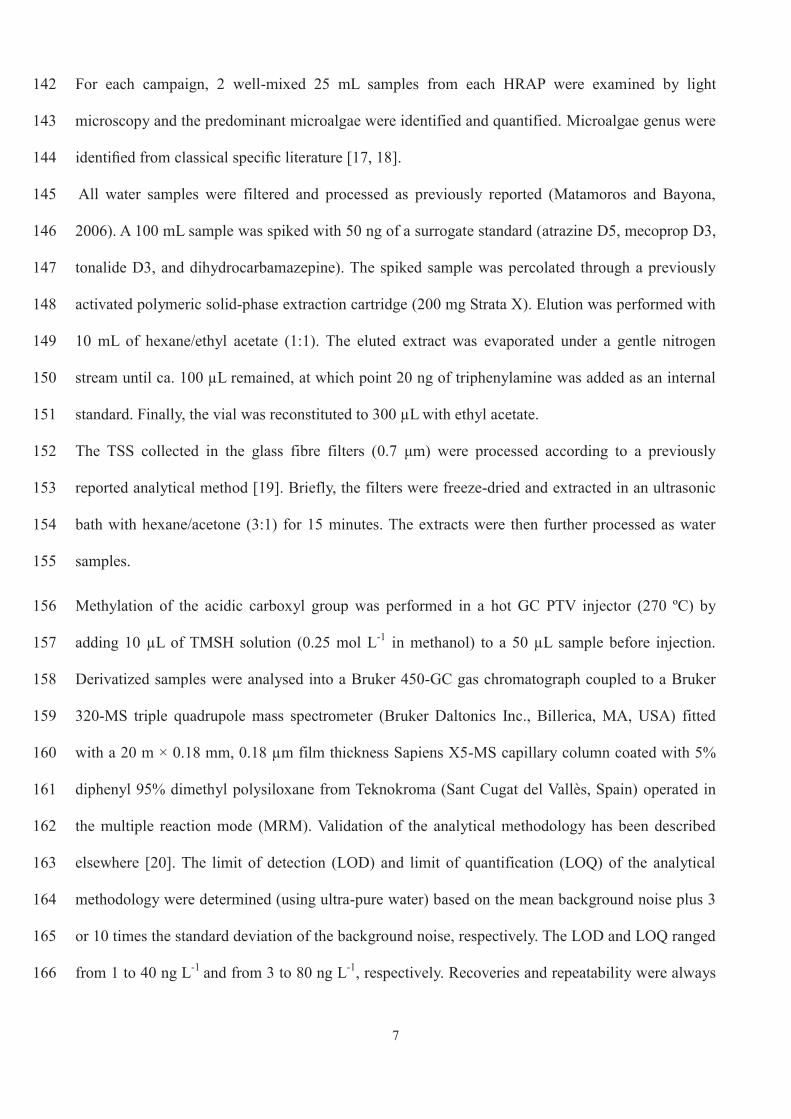
operating conditions). Acetaminophen, ibuprofen and oxybenzone exhibited higher HQs in influent 369
wastewater samples (HQ>1), mainly due to their high concentration. Following the treatment in the 370
HRAP system, all of the studied EOCs had an HQ<1. The most relevant compounds in the treated 371
wastewater effluents, apart from those observed at the influent, were triclosan and galaxolide. These 372
HQ values for the EOCs are in keeping with those reported in the literature for treated wastewater 373
effluents [41]. In fact, triclosan has already been postulated as a critical compound in terms of 374
contribution and environmental risk in wastewater effluents [48]. Hence, von der Ohe et al. [49] 375
argued that triclosan should be seriously considered as a candidate for regulatory monitoring and 376
prioritization on a European scale on the basis of realistic PNECs. 377
As previously described by various authors, HQs should follow an additive model [6]. Hence, the 378
final HQ for each water sample can be calculated as the sum of each individual HQ. The cumulative 379
HQs for the influent wastewater samples were 8.45 and 6.20 for the summer and winter campaigns, 380
respectively. However, they fell 93% (warm season) and 72% (cold season) following the treatment 381
with the HRAPs. Consequently, in summer the cumulative HQ was less than 1 (0.62), whereas in 382
winter it was significantly higher (HQ=1.73). These results are in keeping with the high reduction in 383
acute toxicity achieved by other biological wastewater treatment technologies, such as CWs [50]. 384
Nevertheless, this ecological risk assessment was only performed for the target EOCs; therefore, 385
further studies may be needed to include other EOCs and related transformation products. 386
387
4. Conclusions 388
This study has shown that microalgae-based wastewater treatment systems (such as HRAPs) enable 389
the removal of a wide range of EOCs from urban wastewater. Removal efficiency ranged from none 390
1 2 3 4 5 6 7 8 9 1011121314151617181920212223242526272829303132333435363738394041424344454647484950515253545556575859606162636465
17
to up to 99%. The EOCs were classified into four groups in accordance with their average removal 391
efficiency in HRAPs: high removal (>90%: caffeine, acetaminophen, ibuprofen, methyl 392
dihydrojasmonate and hydrocinnamic acid), moderate-high removal (from 60% to 90%: 393
oxybenzone, ketoprofen, 5-methyl/benzotriazole, naproxen, galaxolide, tonalide, tributyl phosphate, 394
triclosan, bisphenol A and octylphenol), moderate-low removal (from 40 to 60%: diclofenac, 395
benzotriazole, OH-benzothiazole, triphenyl phosphate, cashmeran, diazinon, celestolide and 396
atrazine) and poor or no removal (<30%, carbamazepine, benzothiazole, methyl paraben, tris(2-397
chloroethyl) phosphate, and 2,4-D). The removal of emerging contaminants in HRAPs was only 398
affected by the HRT during the cold season, whereas no differences where observed in the warm 399
season. The most frequently occurring compounds (caffeine, acetaminophen and ibuprofen) had 400
removal efficiencies of up to 90% that were minimally affected by seasonality and HRT. The 401
ecotoxicological risk assessment study revealed that the HQ for the influent wastewater was 402
removed by up to 90%, indicating no acute toxicity risk associated with the studied EOCs at the 403
water effluents. 404
405
5. Acknowledgments 406
The authors gratefully acknowledge the financial support of the Spanish Ministry of Economy and 407
Competitiveness through projects CTM2012-33547 and CTM2012-37860 (DIPROBIO). Dr V. M. 408
would like to acknowledge a JAE-Doc contract from the Spanish National Research Council (CSIC) 409
and the European Social Fund. 410
411
6. References 412
[1] K.E. Murray, S.M. Thomas, A.A. Bodour, Prioritizing research for trace pollutants and emerging 413 contaminants in the freshwater environment, Environ. Pollut. 158 (2010) 3462-3471. 414
[2] T.A. Ternes, A. Joss, H. Siegrist, Scrutinizing pharmaceuticals and personal care products in 415 wastewater treatment, Environ. Sci. Technol. 38 (2004) 392A-399A. 416

1 2 3 4 5 6 7 8 9 1011121314151617181920212223242526272829303132333435363738394041424344454647484950515253545556575859606162636465
18
[3] I. Muñoz, J.C. López-Doval, M. Ricart, M. Villagrasa, R. Brix, A. Geiszinger, A. Ginebreda, H. 417 Guasch, M.J.L. de Alda, A.M. Romaní, S. Sabater, D. Barceló, Bridging levels of 418 pharmaceuticals in river water with biological community structure in the llobregat river basin 419 (northeast Spain), Environ. Toxicol. Chem. 28 (2009) 2706-2714. 420
[4] T. Henry, M. Black, Acute and chronic toxicity of fluoxetine (selective serotonin reuptake 421 inhibitor) in western mosquitofish, Arch. Environ. Contam. Toxicol. 54 (2008) 325-330. 422
[5] A.M. Vajda, L.B. Barber, J.L. Gray, E.M. Lopez, J.D. Woodling, D.O. Norris, Reproductive 423 disruption in fish downstream from an estrogenic wastewater effluent, Environ. Sci. Technol. 424 42 (2008) 3407-3414. 425
[6] A. Ginebreda, I. Muñoz, M.L. de Alda, R. Brix, J. López-Doval, D. Barceló, Environmental risk 426 assessment of pharmaceuticals in rivers: Relationships between hazard indexes and aquatic 427 macroinvertebrate diversity indexes in the Llobregat River (NE Spain), Environ. Int. 36 428 (2010) 153-162. 429
[7] R. Craggs, D. Sutherland, H. Campbell, Hectare-scale demonstration of high rate algal ponds for 430 enhanced wastewater treatment and biofuel production, J. Appl. Phycol. 24 (2012) 329-337. 431
[8] F. Passos, H.-M. Mariona, J. García, I. Ferrer, Long-term anaerobic digestion of microalgae 432 grown in HRAP for wastewater treatment. Effect of microwave pretreatment, Water Res. 49 433 (2014) 351-359. 434
[9] B. El Hamouri, K. Khallayoune, K. Bouzoubaa, N. Rhallabi, M. Chalabi, High-rate algal pond 435 performances in faecal coliforms and helminth egg removals, Water Research, 28 (1994) 171-436 174. 437
[10] R. Muñoz, B. Guieysse, Algal-bacterial processes for the treatment of hazardous contaminants: 438 A review, Water Res. 40 (2006) 2799-2815. 439
[11] N. Abdel-Raouf, A.A. Al-Homaidan, I.B.M. Ibraheem, Microalgae and wastewater treatment, 440 Saudi J. Biol. Sci. 19 (2012) 257-275. 441
[12] K. Lika, I.A. Papadakis, Modeling the biodegradation of phenolic compounds by microalgae, J. 442 Sea Res. 62 (2009) 135-146. 443
[13] I. de Godos, R. Muñóz, B. Guieysse, Tetracycline removal during wastewater treatment in 444 high-rate algal ponds, J. Hazard. Mater. 229-230 (2012) 446-449. 445
[14] M.R. Abargues, J. Ferrer, A. Bouzas, A. Seco, Removal and fate of endocrine disruptors 446 chemicals under lab-scale postreatment stage. Removal assessment using light, oxygen and 447 microalgae, Bioresour. Technol. 149 (2013) 142-148. 448
[15] A.K. Haritash, C.P. Kaushik, Biodegradation aspects of polycyclic aromatic hydrocarbons 449 (PAHs): A review, J. Hazard. Mater. 169 (2009) 1-15. 450
[16] L.E. de-Bashan, Y. Bashan, Immobilized microalgae for removing pollutants: Review of 451 practical aspects, Bioresour. Technol. 101 (2010) 1611-1627. 452
[17] J.J. Lee, G.F. Leedale, P. Bradbury, The illustrated guide to the protozoa, second ed., Wiley-453 Blackwell, Lawrence, 2000. 454
[18] D.M. John, B.A. Whitton, A.J. Brook, The Freshwater Algal Flora of the British Isles: An 455 Identification Guide to Freshwater and Terrestrial Algae, second ed., Cambridge University 456 Press, 2011. 457
[19] V. Matamoros, J.M. Bayona, Elimination of pharmaceuticals and personal care products in 458 subsurface flow constructed wetlands, Environ. Sci. Technol. 40 (2006) 5811-5816. 459
[20] V. Matamoros, E. Jover, J.M. Bayona, Part-per-Trillion determination of pharmaceuticals, 460 pesticides, and related organic contaminants in river water by solid-phase extraction followed 461 by comprehensive two-dimensional gas chromatography time-of-flight mass spectrometry, 462 Anal. Chem. 82 (2010) 699-706. 463
[21] A. Pedescoll, A. Corzo, E. Álvarez, J. Puigagut, J. García, Contaminant removal efficiency 464 depending on primary treatment and operational strategy in horizontal subsurface flow 465 treatment wetlands, Ecol. Eng. 37 (2011) 372-380. 466
1 2 3 4 5 6 7 8 9 1011121314151617181920212223242526272829303132333435363738394041424344454647484950515253545556575859606162636465
19
[22] J.B. Park, R.J. Craggs, Wastewater treatment and algal production in high rate algal ponds with 467 carbon dioxide addition, Water Sci. Technol. 63(2010) 633-639. 468
[23] J. García, B.F. Green, T. Lundquist, R. Mujeriego, M. Hernández-Mariné, W.J. Oswald, Long 469 term diurnal variations in contaminant removal in high rate ponds treating urban wastewater, 470 Bioresour. Technol. 97 (2006) 1709-1715. 471
[24] J. García, R. Mujeriego, M. Hernández-Mariné, High rate algal pond operating strategies for 472 urban wastewater nitrogen removal, J. Appl. Phycol. 12 (2000) 331-339. 473
[25] Z. Arbib, J. Ruiz, P. Álvarez-Díaz, C. Garrido-P'erez, J. Barragan, J. Perales, Long term 474 outdoor operation of a tubular airlift pilot photobioreactor and a high rate algal pond as 475 tertiary treatment of urban wastewater, Ecol. Eng. 52 (2013) 143-153. 476
[26] D.L. Sutherland, M.H. Turnbull, R.J. Craggs, Increased pond depth improves algal productivity 477 and nutrient removal in wastewater treatment high rate algal ponds, Water Res. 53 (2014) 478 271-281. 479
[27] Y. Azov, G. Shelef, Operation of high-rate oxidation ponds: theory and experiments, Water Res. 480 16 (1982) 1153-1160. 481
[28] J.B. Park, R.J. Craggs, Nutrient removal in wastewater treatment high rate algal ponds with 482 carbon dioxide addition, Water Sci. Technol. 63 (2011) 1758-1764. 483
[29] I.d. Godos, S. Blanco, P.A. García-Encina, E. Becares, R. Muñoz, Long-term operation of high 484 rate algal ponds for the bioremediation of piggery wastewaters at high loading rates, 485 Bioresour. Technol. 100 (2009) 4332-4339. 486
[30] D.L. Sutherland, C. Howard-Williams, M.H. Turnbull, P.A. Broady, R.J. Craggs, Seasonal 487 variation in light utilisation, biomass production and nutrient removal by wastewater 488 microalgae in a full-scale high-rate algal pond, J. Appl. Phycol. 26 (2014) 1317-1329. 489
[31] J.Q. Jiang, Z. Zhou, V.K. Sharma, Occurrence, transportation, monitoring and treatment of 490 emerging micro-pollutants in waste water - A review from global views, Microchem. J. 110 491 (2013) 292-300. 492
[32] Y. Luo, W. Guo, H.H. Ngo, L.D. Nghiem, F.I. Hai, J. Zhang, S. Liang, X.C. Wang, A review on 493 the occurrence of micropollutants in the aquatic environment and their fate and removal 494 during wastewater treatment, Sci. Total Environ. 473-474 (2014) 619-641. 495
[33] V. Matamoros, J.M. Bayona, Chapter 12 - Removal of Pharmaceutical Compounds from 496 Wastewater and Surface Water by Natural Treatments, in: D. Barceló, S. Pérez and M. 497 Petrovic (Eds.), Comprehensive Analytical Chemistry, Elsevier, Amsterdam, 2013, pp. 409-498 433. 499
[34] K.Y. Bell, J. Bandy, B.J. Finnegan, O. Keen, M.S. Mauter, A.M. Parker, L.C. Sima, H.A. 500 Stretz, Emerging pollutants - Part II: Treatment, Water Environ. Res. 85 (2013) 2022-2071. 501
[35] S. Suarez, J.M. Lema, F. Omil, Removal of Pharmaceutical and Personal Care Products 502 (PPCPs) under nitrifying and denitrifying conditions, Water Res. 44 (2010) 3214-3224. 503
[36] V.V. Unnithan, A. Unc, G.B. Smith, Mini-review: A priori considerations for bacteria-algae 504 interactions in algal biofuel systems receiving municipal wastewaters, Algal Res. 4 (2014) 35-505 40. 506
[37] S.R. Subashchandrabose, B. Ramakrishnan, M. Megharaj, K. Venkateswarlu, R. Naidu, 507 Consortia of cyanobacteria/microalgae and bacteria: Biotechnological potential, Biotechnol. 508 Advan. 29 (2011) 896-907. 509
[38] M. Hijosa-Valsero, V. Matamoros, J. Martín-Villacorta, E. Bécares, J.M. Bayona, Assessment 510 of full-scale natural systems for the removal of PPCPs from wastewater in small communities, 511 Water Res. 44 (2010) 1429-1439. 512
[39] V. Matamoros, C. Arias, H. Brix, J.M. Bayona, Removal of pharmaceuticals and personal care 513 products (PPCPs) from urban wastewater in a pilot vertical flow constructed wetland and a 514 sand filter, Environ. Sci. Technol. 41 (2007) 8171-8177. 515
[40] A. Garcia-Rodríguez, V. Matamoros, C. Fontàs, V. Salvadó, The ability of biologically based 516

1 2 3 4 5 6 7 8 9 1011121314151617181920212223242526272829303132333435363738394041424344454647484950515253545556575859606162636465
20
wastewater treatment systems to remove emerging organic contaminants-a review, Environ. 517 Sci. Pollut. Res. (2014) 1-21. 518
[41] M. Gros, M. Petrovic, A. Ginebreda, D. Barceló, Removal of pharmaceuticals during 519 wastewater treatment and environmental risk assessment using hazard indexes, Environ. Int. 520 36 (2010) 15-26. 521
[42] A. Garcia-Rodríguez, E. Sagristà , V. Matamoros, C. Fontàs, M. Hidalgo, V. Salvadó, 522 Determination of pharmaceutical compounds in sewage sludge using a standard addition 523 method approach, Int. J. Environ. Anal. (2014) 1-11. 524
[43] X. Wu, J.L. Conkle, F. Ernst, J.J. Gan, Treated wastewater irrigation: Uptake of pharmaceutical 525 and personal care products by common vegetables under field conditions, Environ. Sci. 526 Technol. (2014). 527
[44] C. Reyes-Contreras, M. Hijosa-Valsero, R. Sidrach-Cardona, J.M. Bayona, E. Bécares, 528 Temporal evolution in PPCP removal from urban wastewater by constructed wetlands of 529 different configuration: A medium-term study, Chemosphere, 88 (2012) 161-167. 530
[45] M.E. Hoque, F. Cloutier, C. Arcieri, M. McInnes, T. Sultana, C. Murray, P.A. Vanrolleghem, 531 C.D. Metcalfe, Removal of selected pharmaceuticals, personal care products and artificial 532 sweetener in an aerated sewage lagoon, Sci. Total Environ. (2014). 533
[46] A. Dordio, A.J.P. Carvalho, D.M. Teixeira, C.B. Dias, A.P. Pinto, Removal of pharmaceuticals 534 in microcosm constructed wetlands using Typha spp. and LECA, Bioresour. Technol. 101 535 (2010) 886-892. 536
[47] H. Sanderson, D.J. Johnson, T. Reitsma, R.A. Brain, C.J. Wilson, K.R. Solomon, ranking and 537 prioritization of environmental risks of pharmaceuticals in surface waters, Regul. Toxicol. 538 Pharm. 39 (2004) 158-183. 539
[48] C.I. Kosma, D.A. Lambropoulou, T.A. Albanis, Investigation of PPCPs in wastewater 540 treatment plants in Greece: Occurrence, removal and environmental risk assessment, Sci. 541 Total Environ.466-467 (2014) 421-438. 542
[49] P.C. von der Ohe, M. Schmitt-Jansen, J. Slobodnik, W. Brack, Triclosan-the forgotten priority 543 substance? Environ. Sci. Pollut. Res. 19 (2012) 585-591. 544
[50] C. Ávila, V. Matamoros, C. Reyes-Contreras, B. Piña, M. Casado, L. Mita, C. Rivetti, C. 545 Barata, J. García, J.M. Bayona, Attenuation of emerging organic contaminants in a hybrid 546 constructed wetland system under different hydraulic loading rates and their associated 547 toxicological effects in wastewater, Sci. Total Environ. 470-471 (2014) 1272-1280. 548
[51] S.L. Simonich, T.W. Federle, W.S. Eckhoff, A. Rottiers, S. Webb, D. Sabaliunas, W. de Wolf, 549 Removal of fragrance materials during U.S. and European wastewater treatment, Environ. 550 Sci. Technol. 36 (2002) 2839-2847. 551
[52] A. Kloepfer, M. Jekel, T. Reemtsma, Occurrence, sources, and fate of benzothiazoles in 552 municipal wastewater treatment plants, Environ. Sci. Technol. 39 (2005) 3792-3798. 553
[53] A.S. Stasinakis, N.S. Thomaidis, O.S. Arvaniti, A.G. Asimakopoulos, V.G. Samaras, A. Ajibola, 554 D. Mamais, T.D. Lekkas, Contribution of primary and secondary treatment on the removal of 555 benzothiazoles, benzotriazoles, endocrine disruptors, pharmaceuticals and perfluorinated 556 compounds in a sewage treatment plant, Sci. Total Environ. 463-464 (2013) 1067-1075. 557
[54] J.-J. Yang, C.D. Metcalfe, Fate of synthetic musks in a domestic wastewater treatment plant 558 and in an agricultural field amended with biosolids, Sci. Total Environ. 363 (2006) 149-165. 559
[55] J. Meyer, K. Bester, Organophosphate flame retardants and plasticisers in wastewater treatment 560 plants, J. Environ. Monit. 6 (2004) 599-605. 561
[56] Q. Sun, M. Lv, A. Hu, X. Yang, C.-P. Yu, Seasonal variation in the occurrence and removal of 562 pharmaceuticals and personal care products in a wastewater treatment plant in Xiamen, China, 563 J. Hazard. Mater. (2014). 564
565 566
1
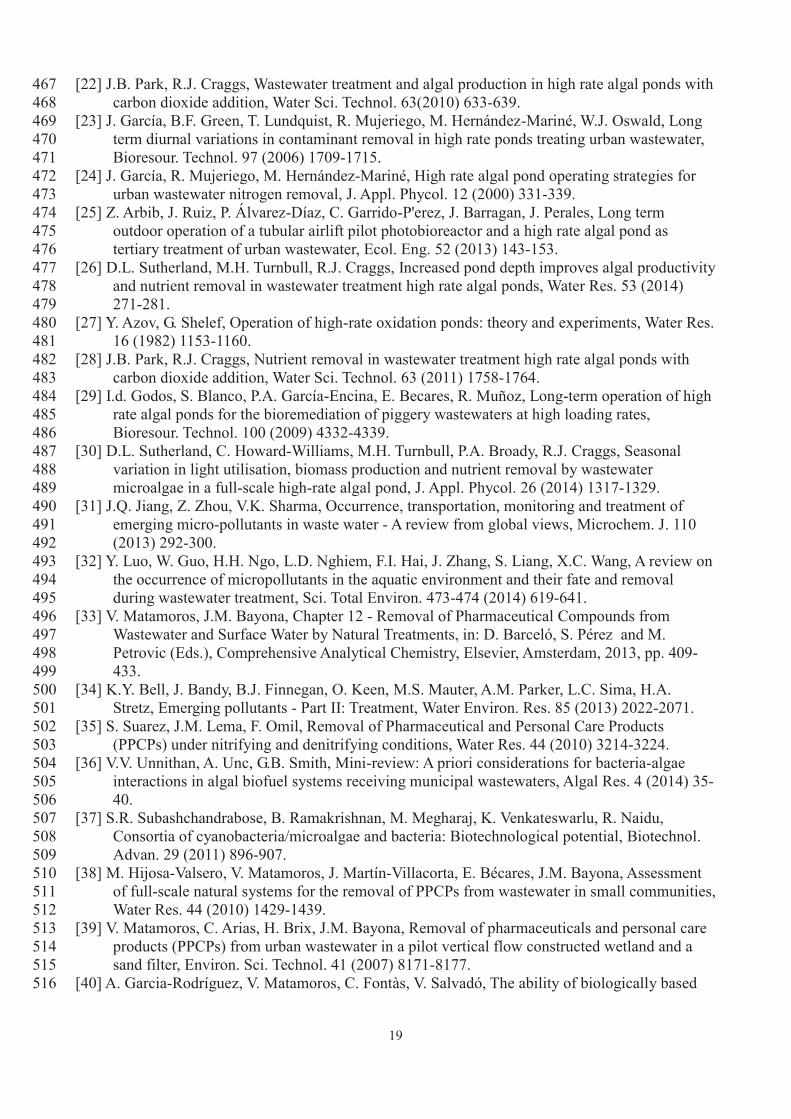
1 2 3 Table 1. Average concentration and standard deviation of conventional water quality parameters (n=8 per 4 campaign). Removal efficiencies for COD and NH4-N are shown in brackets for the two HRAP (4 and 8 d 5 HRT). COD (chemical oxygen demand); DO (dissolved oxygen); TSS (total suspended solids). 6 7
Warm season Cold season
Primary effluent HRT = 4 d HRT = 8d Primary
effluent HRT = 4 d HRT = 8d
Solar radiation (W m-2d-1) 7347.5±898 1674.6±744
T (°C) 28±1 25±1 25±1 16±1 13±1 13±1 DO (mg L-1) 2±1 6±1 8±1 7±2 10±1 12±2
pH 8±1 8±1 9±1 8±1 8±1 9±1 TSS (mg L-1) 118±112 316±50 346±38 - 110±23 149±15
Biomass production
(gTSS m-2d-1) - 24±8 13±2 - 8±2 6±0.3
COD (mg L-1) 156±79 52±9* (75**) 52±12* (84**) 342±107 67±7*
(83**) 52±7* (88**)
NH4-N (mg L-1) 81±9 0.6±0.3(99**) 0.7±0.5(99**) 19±4 2±1 (90**)
0.4±0.1 (98**)
* soluble COD; ** calculation corrected for evaporation water losses. 8 9 10 11 12 13 14 15 16 17 18 19 20 21 22 23 24 25 26 27
Table
2
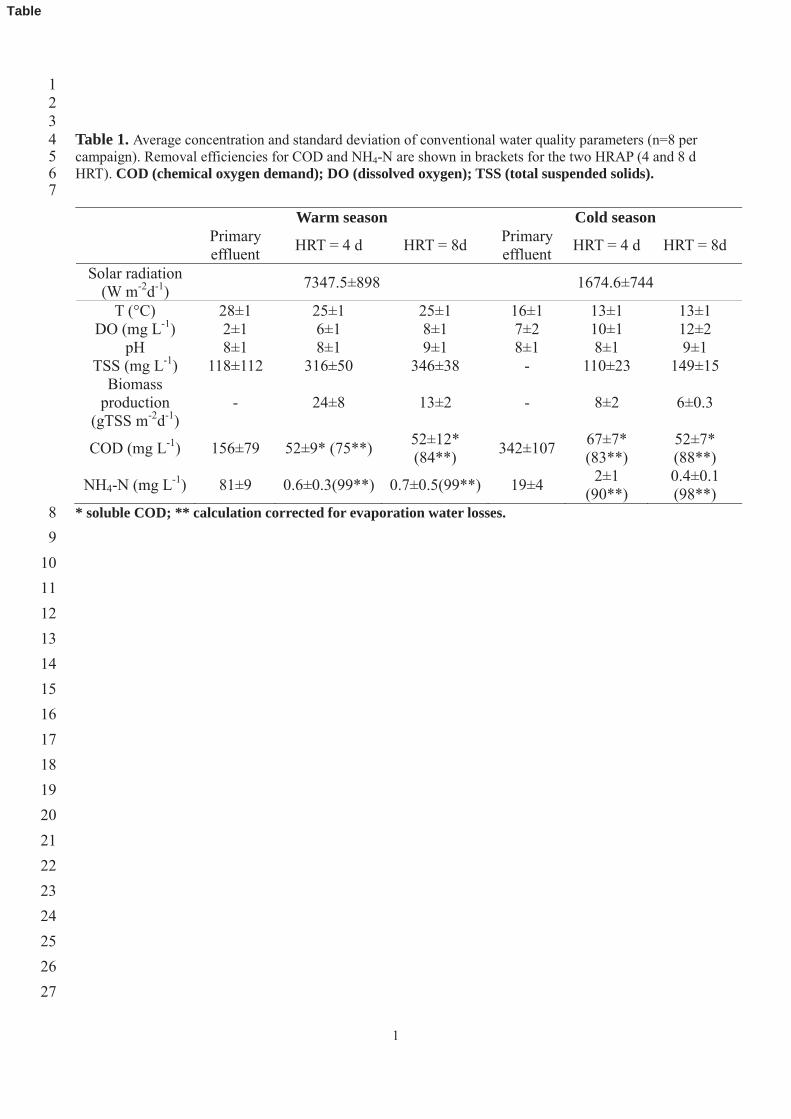
Table 2. Seasonal removal efficiency (%) of target EOCs in the HRAPs operated at HRT of 4 and 8 days. 28 EOCs have been sorted by their abundance in Fig. 2. 29
Name Warm season Cold season Activated sludge WWTPs
HRT 4 d
HRT 8d
HRT 4d
HRT 8 d
Caffeine 97±1 98±1 85±2ab 91±2ab 50-99c Acetaminophen 99±1 99±1 99±1 99±1 99-100c Ibuprofen 99±1 99±1 86±4 ab 93±3 ab 72-100c Methyl dihydrojasmonate
99±1 99±1 92±2 ab 97±1 ab 98d
Oxybenzone 97±1 99±1 75±10 ab 88±4 ab 63-98c Ketoprofen 87±6 b 95±4 50±17 ab 75±9 ab 11-100c Hydrocinnamic acid 99±1 99±1 99±1 99±1 - 5-methyl benzotriazole 83±16 95±8 74±5 77±2a 60e Naproxen 83±4 89±4 48±5a 60±3a 43-99c Carbamazepine 46±9 62±15 15±19a 34±15a <nr-62c Galaxolide 94±1b 97±1 47±1ab 71±2ab 88c Benzothiazole 70±6 78±7 13±8a 30±14a 40-60d Diclofenac 82±6 92±3 21±29a 29±14a <0-81c Methylparaben 59±12 75±8 12±9 a 25±11 a 82-91h Benzotriazole 74±7 84±4 33±10 a 41±5 a 60e Tonalide 84±1b 90±1 51±5a 67±7a 85c OH-Benzothiazole 80±3 82±5 20±17a 37±11a 50-70d Tributyl phosphate 82±5 86±8 69±8 78±2 55-86g Tris(2-chloroethyl)phosphate
39±28 63±12 15±23 21±19 nrc
Triphenyl phosphate 82±2b 89±1 24±6ab 68±10ab 40g Triclosan 93±1 95±1 49±5ab 69±2ab 71-99c Cashmeran 70±5 79±5 61±3 64±8 50f Octylphenol 90±6 93±4 58±12a 74±5a <nr-97c Diazinon 61±4 63±1 - - nrc Celestolide 52±1 53±1 - - 59f Atrazine 76±6 85±3 41±7ab 69±6ab nr-25c Bisphenol A 72±14 85±8 66±16 78±6 63-99c 2,4-D 22±10 32±26 - - - a seasonal statistical difference at p=0.05; b HRT statistical difference at p=0.05, c [32];d [51]; d [52]; e [53] ; 30
f[54]; g[55]; h [56] 31 32
33 34 35
36 37 38 39 40
1
1 2 3 4 5 6 7 8 9 10 11 12 13 14 15 16 17 18 19 20 21 22 23 24 25 26 27 28 29
30 31
32 33 34
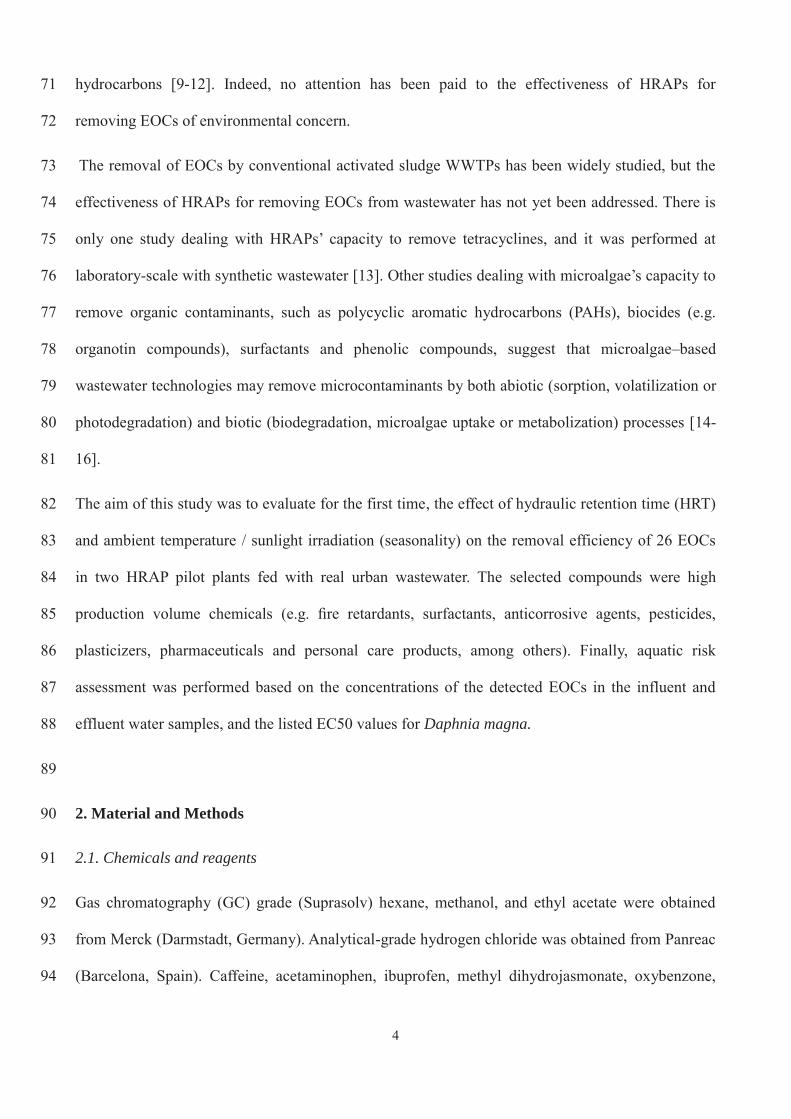
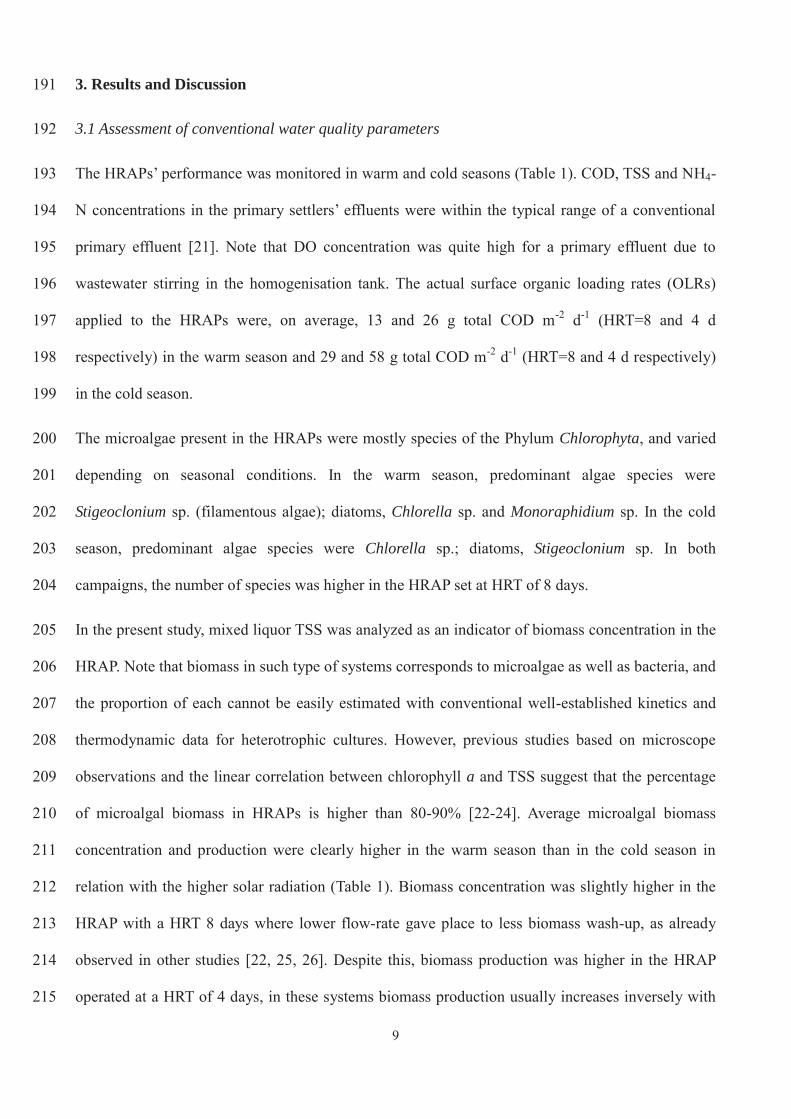
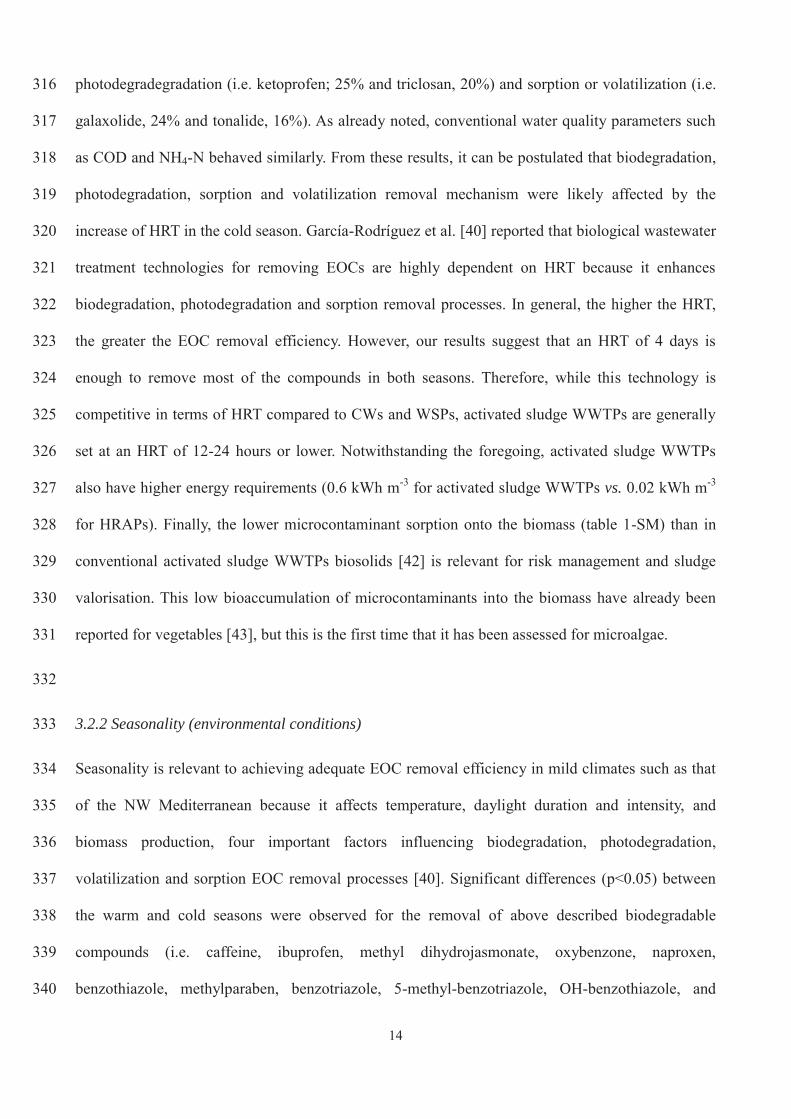
Figure 1. 3D view of treatment units of one line. Primary settler is fed with screened wastewater. Secondary 35 settler allows separation of the biomass produced in the HRAP. Sampling points are indicated (*). 36
37 38 39 40 41 42 43 44 45 46
Primary settler
Secondary settler
High rate algal pond
* *
Figure
2
47
48
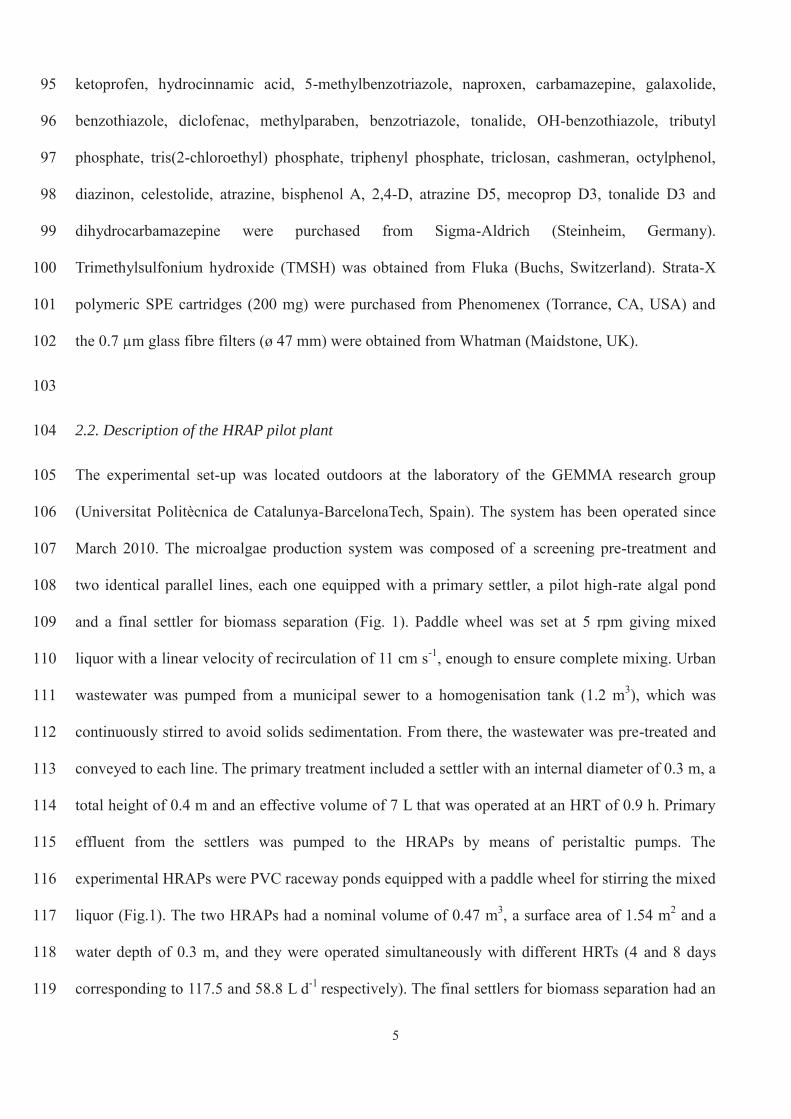
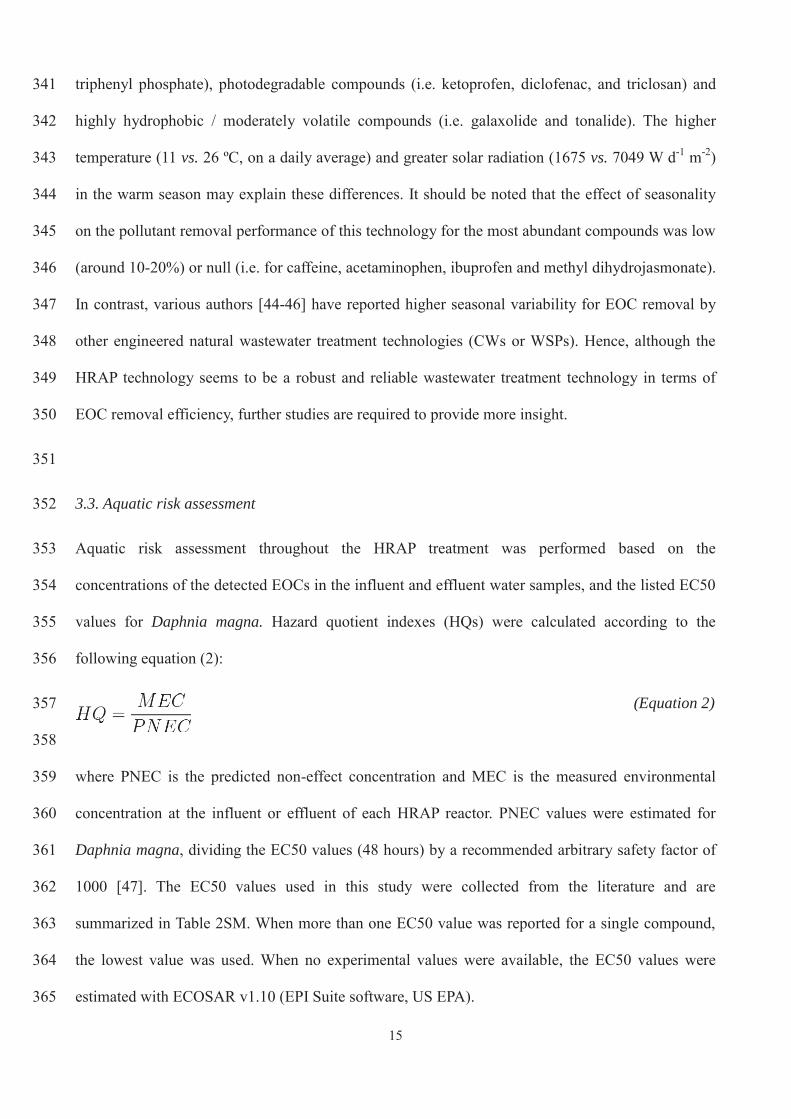
49 50 Figure 2. Logarithmic box-plot of the seasonal occurrence of emerging contaminants in the primary 51 effluent wastewater (n=8). The box plots indicate the median, and the 25th and 75th percentiles for 52 each compound. Note that particulate and dissolved phase were both included. Similar profiles were 53 obtained when molar concentrations were compared (not shown). 54 55 56 57
3
Caffein
e
Acetam
inoph
en
Ibupro
fen
Methyl
dihyd
rojas
monate
Oxybe
nzon
e
Ketopro
fen
Hydroc
innam
ic ac
id
5-meth
yl be
nzotr
iazole
Naprox
en
Carbam
azep
ine
Galaxo
lide
Benzo
thiaz
ole
Diclofen
ac
Methylp
arabe
n
Benzo
triazo
le
Tonali
de
OH-Ben
zothi
azole
Tributy
l pho
spha
te
Tri(2-ch
loroe
thyl) p
hosp
hate
Triphe
nyl p
hosp
hate
Triclos
an
Cashm
eran
Octylph
enol
Atrazin
e
Bisphe
nol A2,4
-D
HQ
0.0
1.0
2.0
HQ
0.0
1.0
2.0
InfluentEffluent
HQ=1
HQ=1
Warm season
Cold season
(2.9)
InfluentEffluent
58 59 60 61 62 63 64 65 66 67 68 69 70 71 72 73 74 75 76 77 78 79 80 81 82 83 84 85 86 87 88 89 90 91 Figure 3. Seasonal hazard quotients (HQs) for the influent and effluent water samples collected 92
from the HRAP set at a HRT of 4days. 93 94
To be submitted to J Hazardous Materials
Capability of microalgae-based wastewater
treatment systems to remove emerging organic
contaminants: a pilot-scale study
Víctor Matamoros1*, Raquel Gutiérrez2, Ivet Ferrer2, Joan García2, Josep M Bayona1
1Department of Environmental Chemistry, IDAEA-CSIC, c/Jordi Girona, 18-26, E-08034, Barcelona, Spain.
2GEMMA-Group of Environmental Engineering and Microbiology, Department of Hydraulic, Maritime and
Environmental Engineering, Universitat Politècnica de Catalunya BarcelonaTech, c/ Jordi Girona, 1-3, Building
D1, E-08034, Barcelona, Spain.
Number of tables = 2
Number of figures = 1
*Corresponding author: [email protected]
Supplementary Material

Table 1SM. Seasonal occurrence of studied EOCs (ng g-1) in the particulate phase.
Name Log kow Warm season Cold season Influent Effluent * Influent Effluent*
Caffeine 0.16 4.2±1.1 0.1±0.1/0.1±0.2 2±1 0.8±0.3/0.5±0.5 Acetaminophen 0.27 <LOD <LOD <LOD <LOD Ibuprofen 3.79 3.1±1.2 <LOD 2±0.01 <LOD Methyl dihydrojasmonate
2.98 2.2±1.0 0.1±0.1/0.1±0.01 0.9±0.2 0.5±0.3/0.1±0.1
Oxybenzone 3.79 8.5±3.2 0.1±0.1/0.2±0.1 5.2±2.1 1.5±1.0/01.7±0.9 Ketoprofen 3.00 <LOD <LOD <LOD <LOD Hydrocinnamic acid 2.29 0.9±0.7 0.1±0.1/0.1±0.1 2.6±0.2 0.1±0.1/0.1±0.1 5-methyl benzotriazole 1.71 <LOD <LOD - <LOD Naproxen 3.10 1.0±0.1 <LOD 0.3±0.1 <LOD Carbamazepine 2.25 0.2±0.1 <0.1 0.2±0.1 <0.01 Galaxolide 6.26 12±5.2 0.5±0.1/0.5±0.1 9.2±1.9 3.1±0.2/1.8±0.5 Benzothiazole 2.17 <LOD <LOD <LOD <LOD Diclofenac 4.02 <LOD <LOD <LOD <LOD Methylparaben 1.96 1.2±0.7 0.1±0.2/0.2±0.1 0.3±0.3 0.2±0.2/0.1±0.1 Benzotriazole 1.17 <LOD <LOD <LOD <LOD Tonalide 5.80 7.8±2.5 0.2±0.1/0.2±0.1 5.0±0.5 1.2±0.4/0.6±0.2 OH-Benzothiazole 2.35 <LOD <LOD <LOD <LOD Tributyl phosphate 3.82 <LOD <LOD <LOD <LOD Tris(2-chloroethyl)phosphate
1.63 <LOD <LOD <LOD <LOD
Triphenyl phosphate 4.59 0.5±0.2 <LOD 0.2±0.1 0.1±0.1/<LOD Triclosan 4.66 1.8±0.8 <LOD 0.6±0.5 0.5±0.2/0.3±0.1 Cashmeran 4.49 0.2±0.1 <LOD 0.2±0.1 <LOD Octylphenol 5.28 0.3±0.1 <LOD 0.2±0.2 <LOD Diazinone 3.86 <LOD <LOD <LOD <LOD Celestolide <LOD <LOD <LOD <LOD Atrazine 2.82 <LOD <LOD <LOD <LOD Bisphenol A 3.64 1.2±0.5 <LOD 0.1±0.1 <LOD 2,4-D <LOD <LOD <LOD <LOD
*First value in the effluent shows concentration at the HRT of 4 days and second value at the HRT of 8 days.
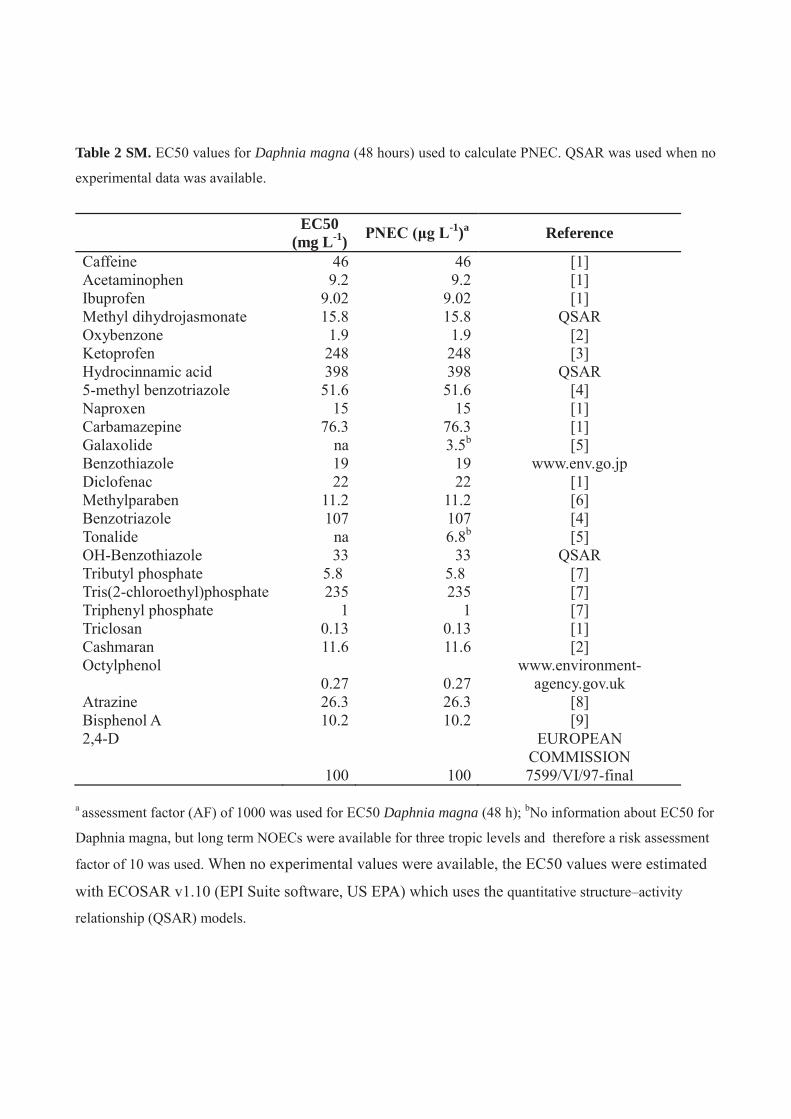
Table 2 SM. EC50 values for Daphnia magna (48 hours) used to calculate PNEC. QSAR was used when no
experimental data was available.
EC50 (mg L-1) PNEC (μg L-1)a Reference
Caffeine 46 46 [1] Acetaminophen 9.2 9.2 [1] Ibuprofen 9.02 9.02 [1] Methyl dihydrojasmonate 15.8 15.8 QSAR Oxybenzone 1.9 1.9 [2] Ketoprofen 248 248 [3] Hydrocinnamic acid 398 398 QSAR 5-methyl benzotriazole 51.6 51.6 [4] Naproxen 15 15 [1] Carbamazepine 76.3 76.3 [1] Galaxolide na 3.5b [5] Benzothiazole 19 19 www.env.go.jp Diclofenac 22 22 [1] Methylparaben 11.2 11.2 [6] Benzotriazole 107 107 [4] Tonalide na 6.8b [5] OH-Benzothiazole 33 33 QSAR Tributyl phosphate 5.8 5.8 [7] Tris(2-chloroethyl)phosphate 235 235 [7] Triphenyl phosphate 1 1 [7] Triclosan 0.13 0.13 [1] Cashmaran 11.6 11.6 [2] Octylphenol
0.27 0.27 www.environment-
agency.gov.uk Atrazine 26.3 26.3 [8] Bisphenol A 10.2 10.2 [9] 2,4-D
100 100
EUROPEAN COMMISSION 7599/VI/97-final
a assessment factor (AF) of 1000 was used for EC50 Daphnia magna (48 h); bNo information about EC50 for
Daphnia magna, but long term NOECs were available for three tropic levels and therefore a risk assessment
factor of 10 was used. When no experimental values were available, the EC50 values were estimated
with ECOSAR v1.10 (EPI Suite software, US EPA) which uses the quantitative structure–activity
relationship (QSAR) models.
Log Kow0 1 2 3 4 5 6 7
Rem
oval
effi
icen
y (%
)
0
20
40
60
80
100
MW100 150 200 250 300 350
Rem
oval
effi
icen
y (%
)
0
20
40
60
80
100
Henry's Law constant0 5e-5 1e-4 1e-4 2e-4 3e-4 3e-4
Rem
oval
effi
icen
y (%
)
0
20
40
60
80
100
Figure 1 SM. Relationship plots of studied EOC removal against their physical-chemical properties (molecular weight, MW in g mol-1; log Kow; Henry’s Law constant in Pa m-3 mol-1).

References: [1] C.I. Kosma, D.A. Lambropoulou and T.A. Albanis, Sci. Total Environ., 466-467: 421-438, 2014. [2] J.M. Brausch and G.M. Rand, Chemosphere, 82: 1518-1532, 2011. [3] A. Ginebreda, I. Muñoz, M.L. de Alda, R. Brix, J. López-Doval and D. Barceló, Environ. Int., 36: 153-162, 2010. [4] A. Seeland, M. Oetken, A. Kiss, E. Fries and J. Oehlmann, Environ. Sci. Pollut. Res., 19: 1781-1790, 2012. [5] F. Balk and R.A. Ford, Toxicol. Lett., 111: 81-94, 1999. [6] H. Yamamoto, I. Tamura, Y. Hirata, J. Kato, K. Kagota, S. Katsuki, A. Yamamoto, Y. Kagami and N. Tatarazako, Sci. Total Environ., 410-411: 102-111, 2011. [7] J. Cristale, A. García Vázquez, C. Barata and S. Lacorte, Environ. Int., 59: 232-243, 2013. [8] P. Palma, V.L. Palma, R.M. Fernandes, A.M.V.M. Soares and I.R. Barbosa, Bull. Environ. Contam. Toxicol., 81: 485-489, 2008. [9] H.C. Alexander, D.C. Dill, L.W. Smith, P.D. Guiney and P. Dorn, Environ. Toxicol. Chem., 7: 19-26, 1988.
Recommended