WHO’S MORE LOYAL?
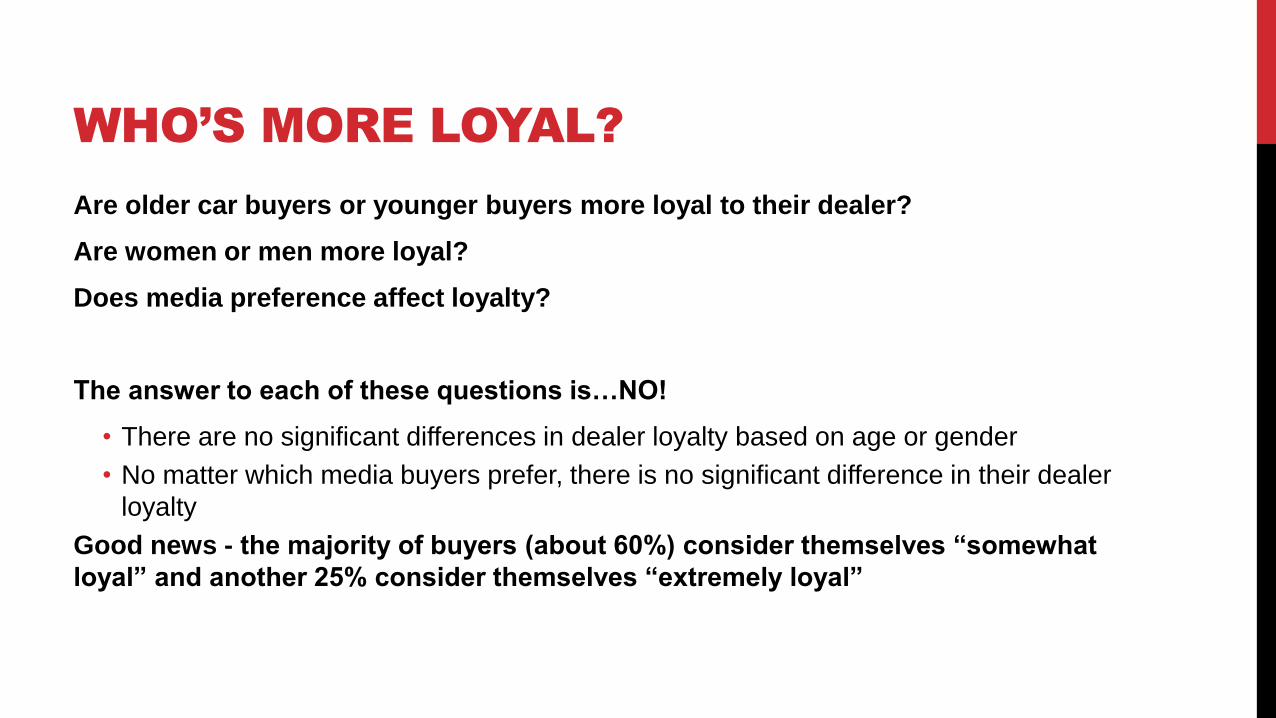
Are older car buyers or younger buyers more loyal to their dealer?
Are women or men more loyal?
Does media preference affect loyalty?
The answer to each of these questions is…NO!
• There are no significant differences in dealer loyalty based on age or gender
• No matter which media buyers prefer, there is no significant difference in their dealer
loyalty
Good news - the majority of buyers (about 60%) consider themselves “somewhat
loyal” and another 25% consider themselves “extremely loyal”
IMPORTANT BUYING FACTORS
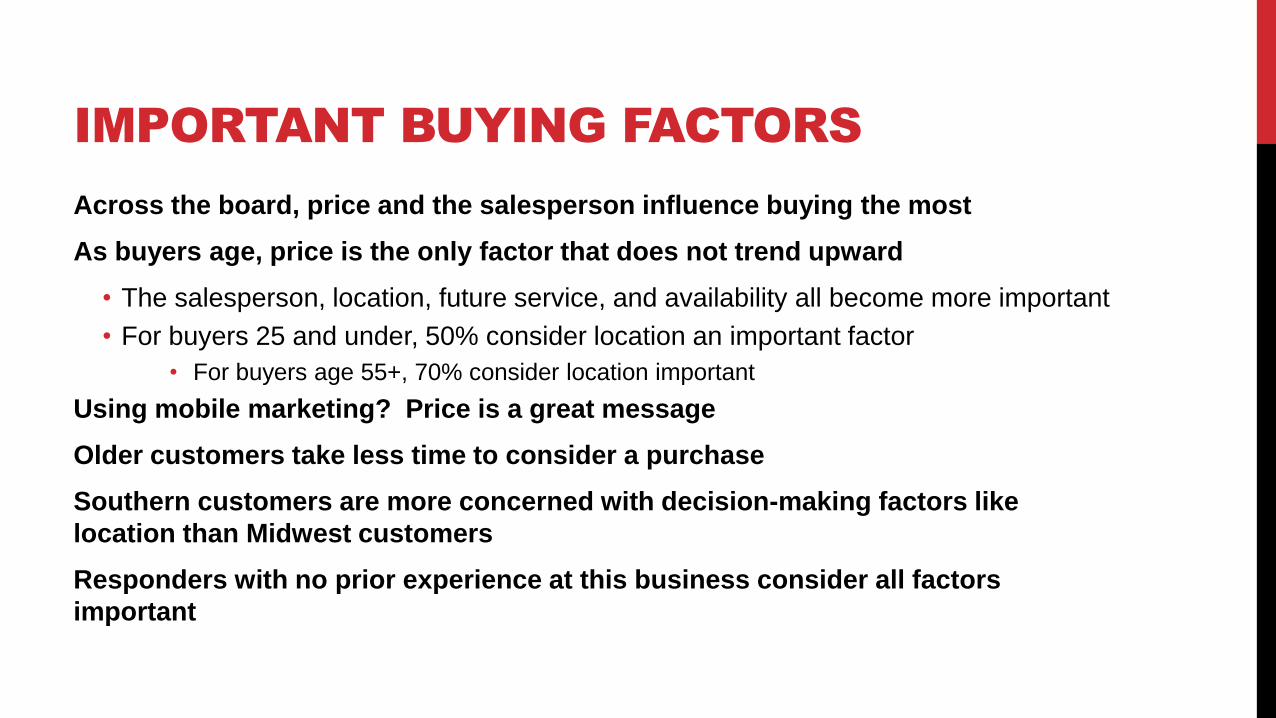
Across the board, price and the salesperson influence buying the most
As buyers age, price is the only factor that does not trend upward
• The salesperson, location, future service, and availability all become more important
• For buyers 25 and under, 50% consider location an important factor
• For buyers age 55+, 70% consider location important
Using mobile marketing? Price is a great message
Older customers take less time to consider a purchase
Southern customers are more concerned with decision-making factors like
location than Midwest customers
Responders with no prior experience at this business consider all factors
important
SELLING USED CARS?
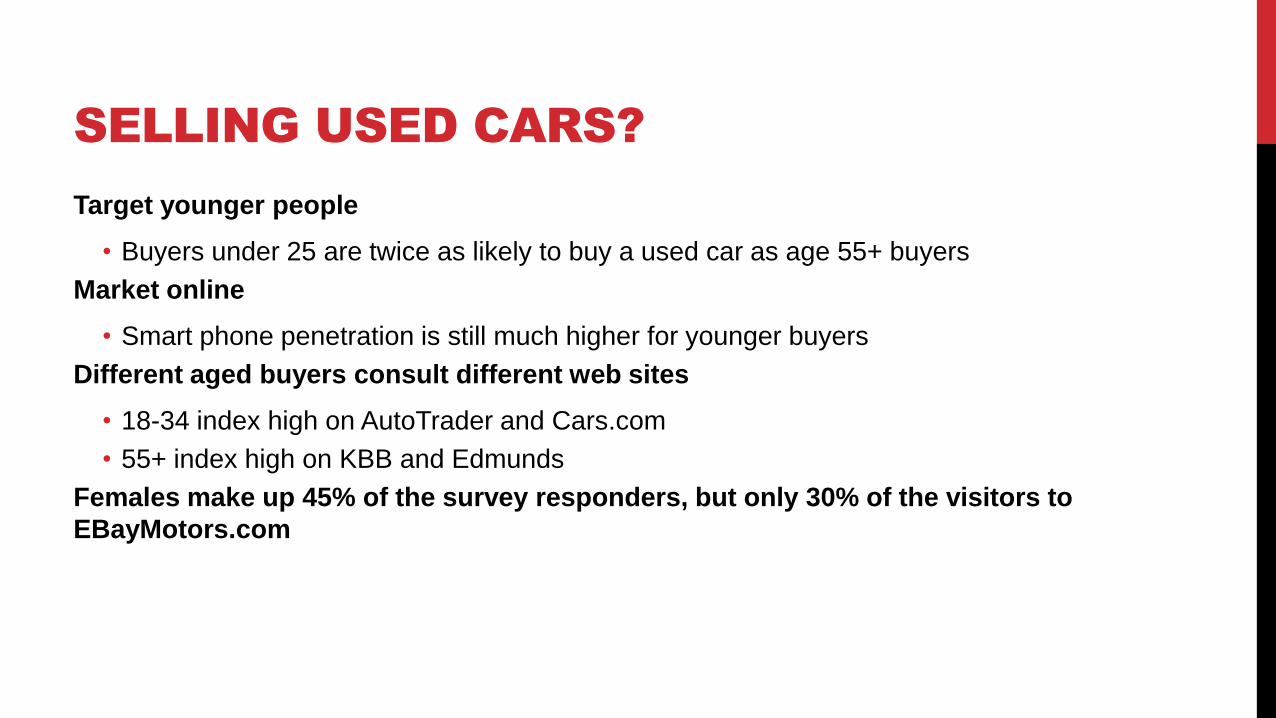
Target younger people
• Buyers under 25 are twice as likely to buy a used car as age 55+ buyers
Market online
• Smart phone penetration is still much higher for younger buyers
Different aged buyers consult different web sites
• 18-34 index high on AutoTrader and Cars.com
• 55+ index high on KBB and Edmunds
Females make up 45% of the survey responders, but only 30% of the visitors to
EBayMotors.com
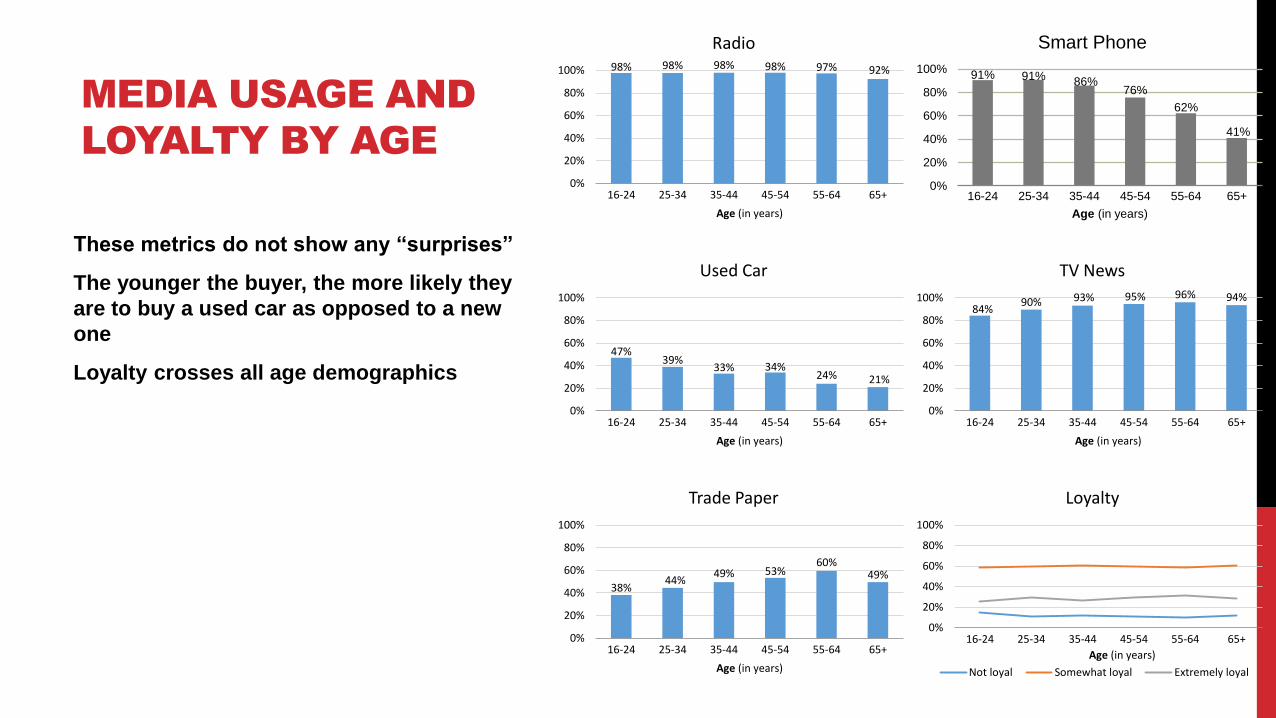
These metrics do not show any “surprises”
The younger the buyer, the more likely they
are to buy a used car as opposed to a new
one
Loyalty crosses all age demographics
MEDIA USAGE AND
LOYALTY BY AGE
91% 91% 86%76%
62%
41%
0%
20%
40%
60%
80%
100%
16-24 25-34 35-44 45-54 55-64 65+
Age (in years)
Smart Phone
84%90% 93% 95% 96% 94%
0%
20%
40%
60%
80%
100%
16-24 25-34 35-44 45-54 55-64 65+
Age (in years)
TV News
0%
20%
40%
60%
80%
100%
16-24 25-34 35-44 45-54 55-64 65+
Age (in years)
Loyalty
Not loyal Somewhat loyal Extremely loyal
98% 98% 98% 98% 97% 92%
0%
20%
40%
60%
80%
100%
16-24 25-34 35-44 45-54 55-64 65+
Age (in years)
Radio
47%39%
33% 34%24% 21%
0%
20%
40%
60%
80%
100%
16-24 25-34 35-44 45-54 55-64 65+
Age (in years)
Used Car
38%44%
49% 53%60%
49%
0%
20%
40%
60%
80%
100%
16-24 25-34 35-44 45-54 55-64 65+
Age (in years)
Trade Paper
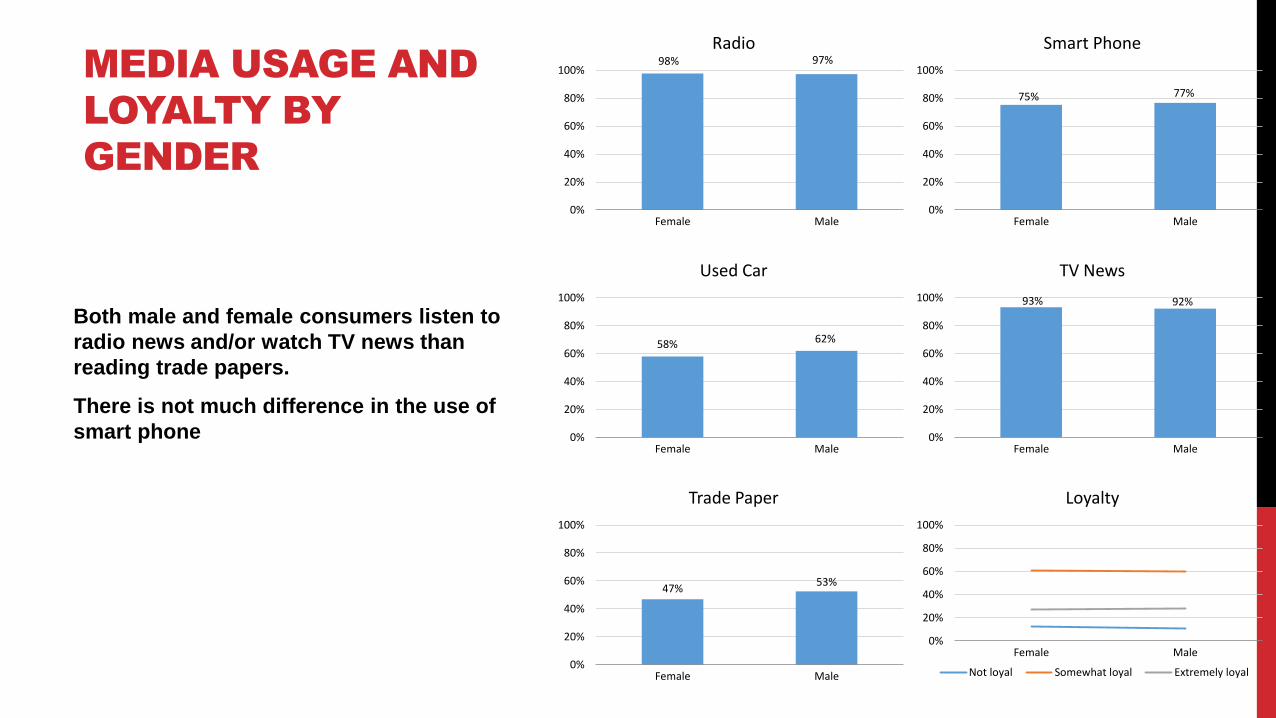
Both male and female consumers listen to
radio news and/or watch TV news than
reading trade papers.
There is not much difference in the use of
smart phone
MEDIA USAGE AND
LOYALTY BY
GENDER
98% 97%
0%
20%
40%
60%
80%
100%
Female Male
Radio
0%
20%
40%
60%
80%
100%
Female Male
Loyalty
Not loyal Somewhat loyal Extremely loyal
58% 62%
0%
20%
40%
60%
80%
100%
Female Male
Used Car
93% 92%
0%
20%
40%
60%
80%
100%
Female Male
TV News
47%53%
0%
20%
40%
60%
80%
100%
Female Male
Trade Paper
75% 77%
0%
20%
40%
60%
80%
100%
Female Male
Smart Phone
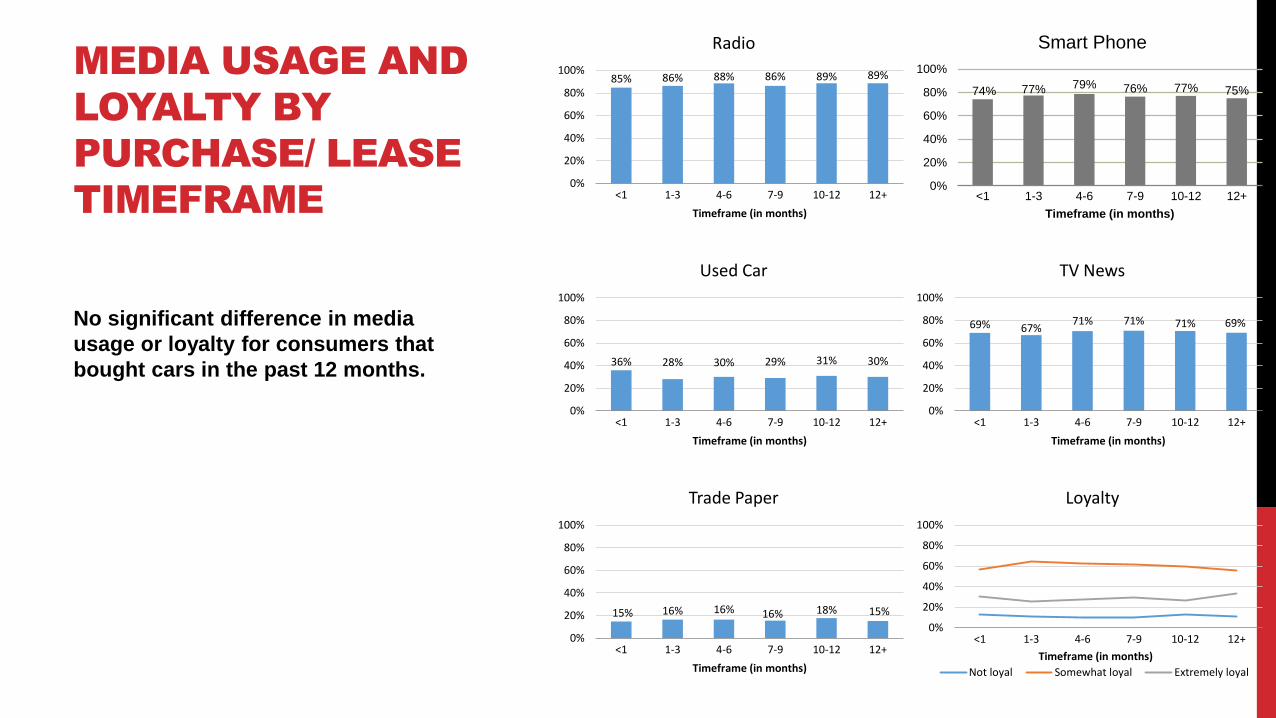
No significant difference in media
usage or loyalty for consumers that
bought cars in the past 12 months.
MEDIA USAGE AND
LOYALTY BY
PURCHASE/ LEASE
TIMEFRAME
74% 77% 79% 76% 77% 75%
0%
20%
40%
60%
80%
100%
<1 1-3 4-6 7-9 10-12 12+
Timeframe (in months)
Smart Phone
69% 67%71% 71% 71% 69%
0%
20%
40%
60%
80%
100%
<1 1-3 4-6 7-9 10-12 12+
Timeframe (in months)
TV News
0%
20%
40%
60%
80%
100%
<1 1-3 4-6 7-9 10-12 12+
Timeframe (in months)
Loyalty
Not loyal Somewhat loyal Extremely loyal
85% 86% 88% 86% 89% 89%
0%
20%
40%
60%
80%
100%
<1 1-3 4-6 7-9 10-12 12+
Timeframe (in months)
Radio
36% 28% 30% 29% 31% 30%
0%
20%
40%
60%
80%
100%
<1 1-3 4-6 7-9 10-12 12+
Timeframe (in months)
Used Car
15% 16% 16% 16% 18% 15%
0%
20%
40%
60%
80%
100%
<1 1-3 4-6 7-9 10-12 12+
Timeframe (in months)
Trade Paper
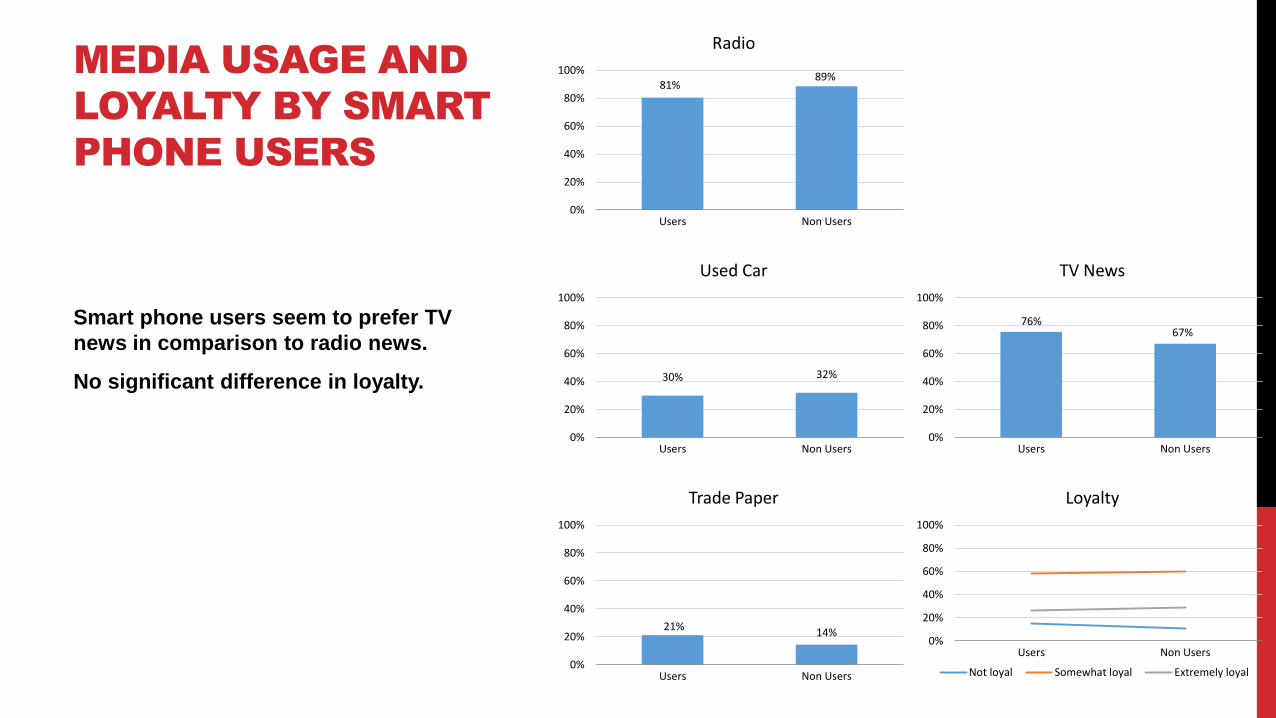
Smart phone users seem to prefer TV
news in comparison to radio news.
No significant difference in loyalty.
MEDIA USAGE AND
LOYALTY BY SMART
PHONE USERS
81%89%
0%
20%
40%
60%
80%
100%
Users Non Users
Radio
0%
20%
40%
60%
80%
100%
Users Non Users
Loyalty
Not loyal Somewhat loyal Extremely loyal
30% 32%
0%
20%
40%
60%
80%
100%
Users Non Users
Used Car
76%67%
0%
20%
40%
60%
80%
100%
Users Non Users
TV News
21%14%
0%
20%
40%
60%
80%
100%
Users Non Users
Trade Paper
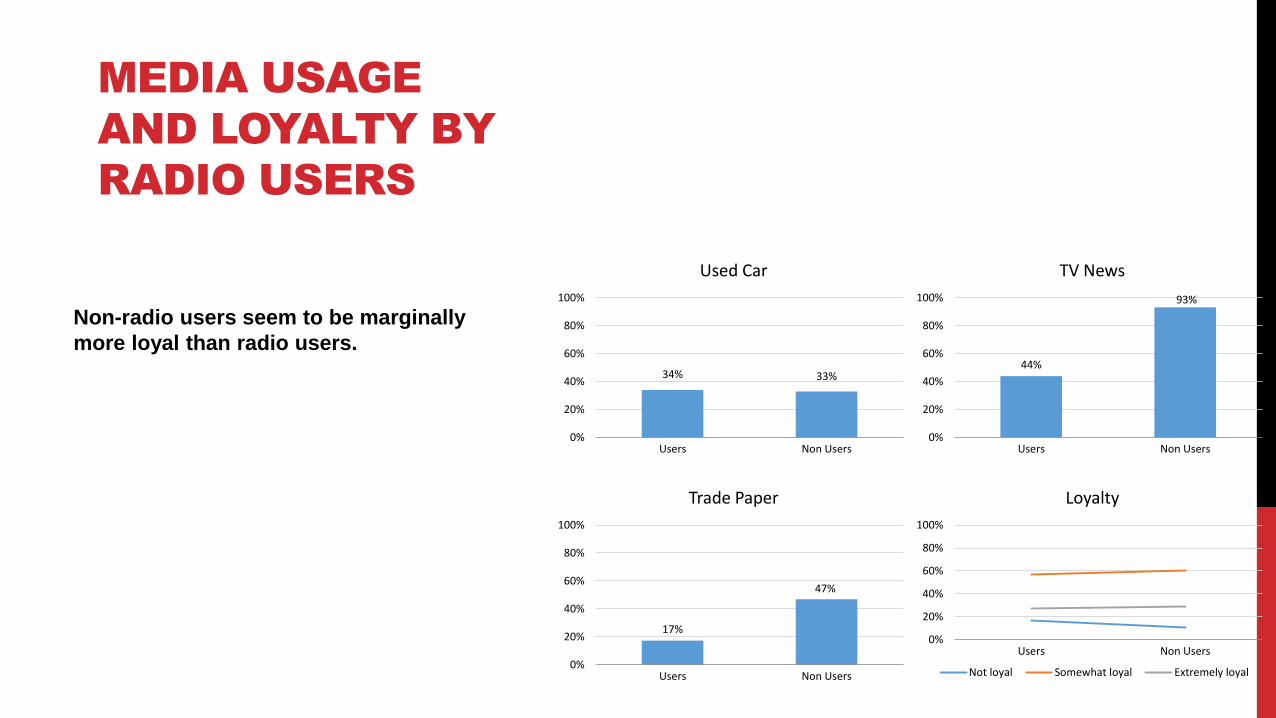
Non-radio users seem to be marginally
more loyal than radio users.
MEDIA USAGE
AND LOYALTY BY
RADIO USERS
0%
20%
40%
60%
80%
100%
Users Non Users
Loyalty
Not loyal Somewhat loyal Extremely loyal
34% 33%
0%
20%
40%
60%
80%
100%
Users Non Users
Used Car
44%
93%
0%
20%
40%
60%
80%
100%
Users Non Users
TV News
17%
47%
0%
20%
40%
60%
80%
100%
Users Non Users
Trade Paper
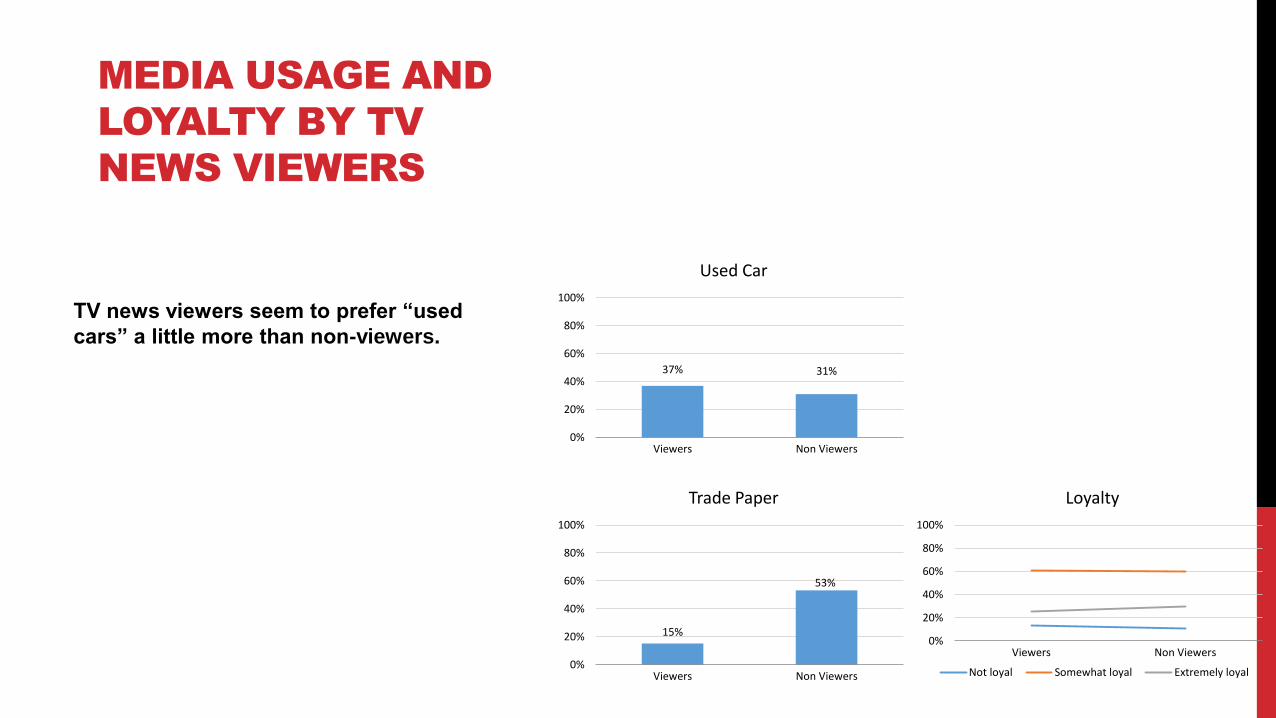
TV news viewers seem to prefer “used
cars” a little more than non-viewers.
MEDIA USAGE AND
LOYALTY BY TV
NEWS VIEWERS
0%
20%
40%
60%
80%
100%
Viewers Non Viewers
Loyalty
Not loyal Somewhat loyal Extremely loyal
37% 31%
0%
20%
40%
60%
80%
100%
Viewers Non Viewers
Used Car
15%
53%
0%
20%
40%
60%
80%
100%
Viewers Non Viewers
Trade Paper
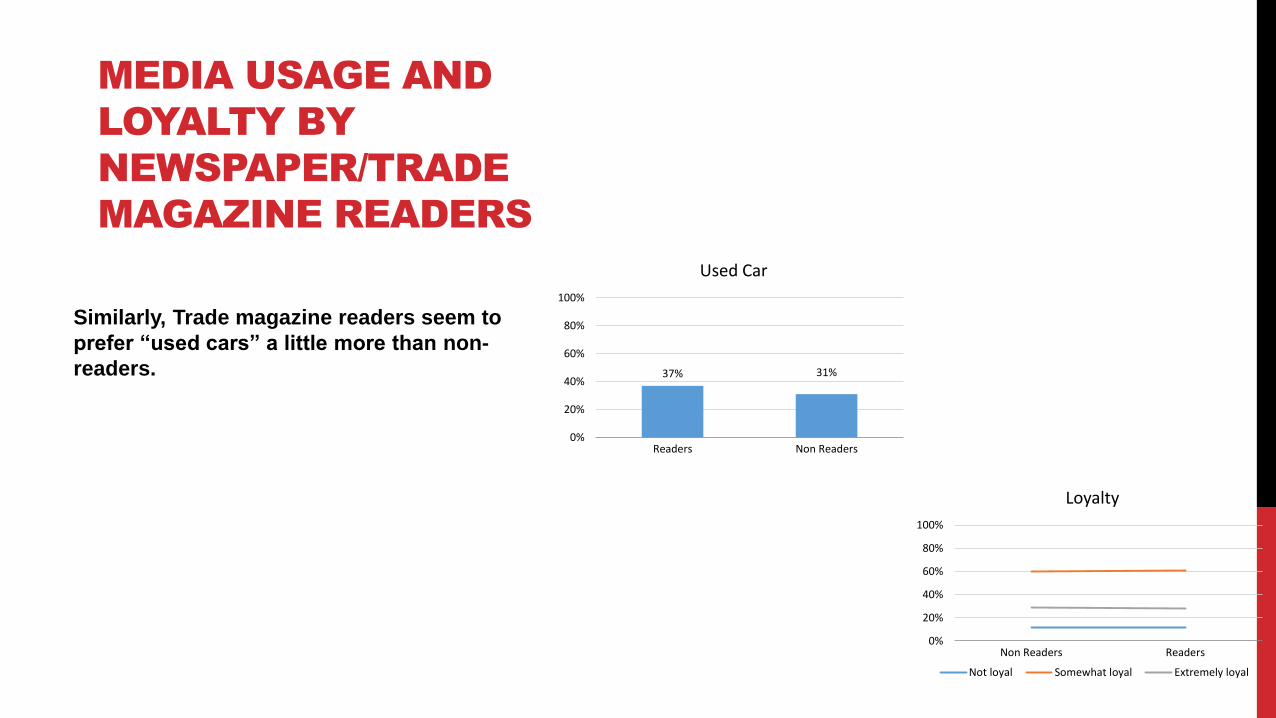
Similarly, Trade magazine readers seem to
prefer “used cars” a little more than non-
readers.
MEDIA USAGE AND
LOYALTY BY
NEWSPAPER/TRADE
MAGAZINE READERS
0%
20%
40%
60%
80%
100%
Non Readers Readers
Loyalty
Not loyal Somewhat loyal Extremely loyal
37% 31%
0%
20%
40%
60%
80%
100%
Readers Non Readers
Used Car
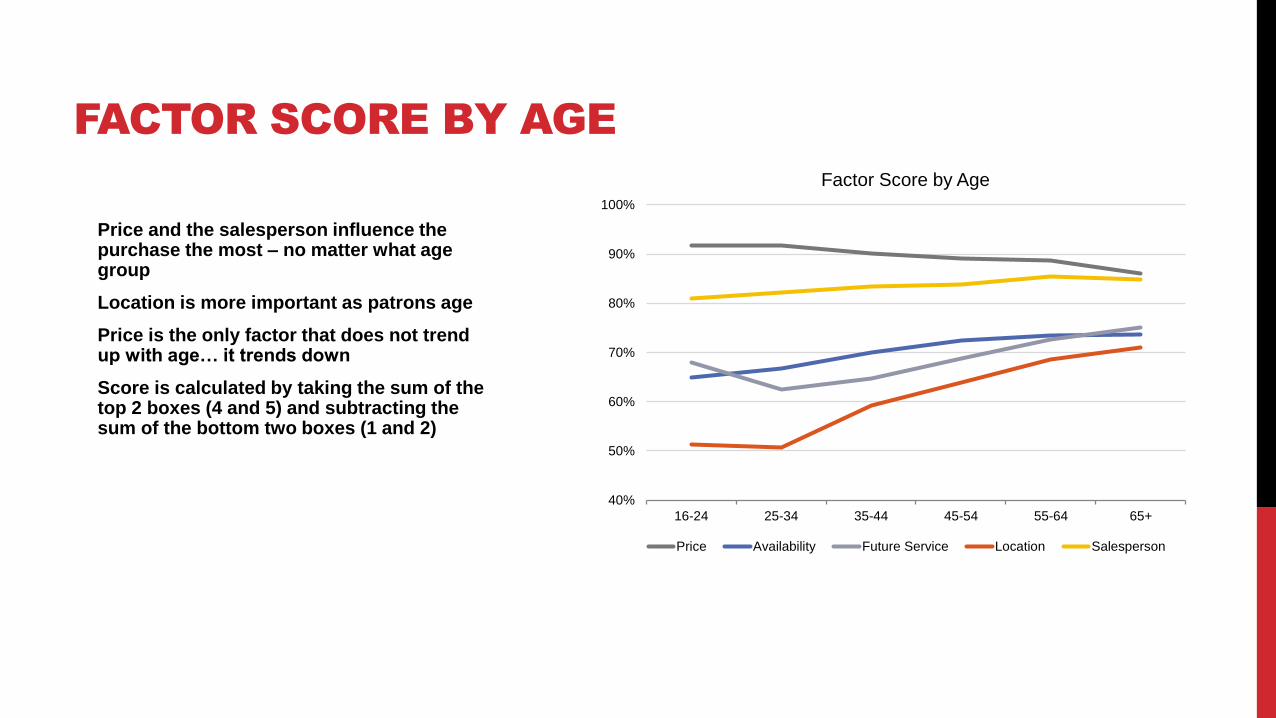
Price and the salesperson influence the purchase the most – no matter what age group
Location is more important as patrons age
Price is the only factor that does not trend up with age… it trends down
Score is calculated by taking the sum of the top 2 boxes (4 and 5) and subtracting the sum of the bottom two boxes (1 and 2)
FACTOR SCORE BY AGE
40%
50%
60%
70%
80%
90%
100%
16-24 25-34 35-44 45-54 55-64 65+
Factor Score by Age
Price Availability Future Service Location Salesperson
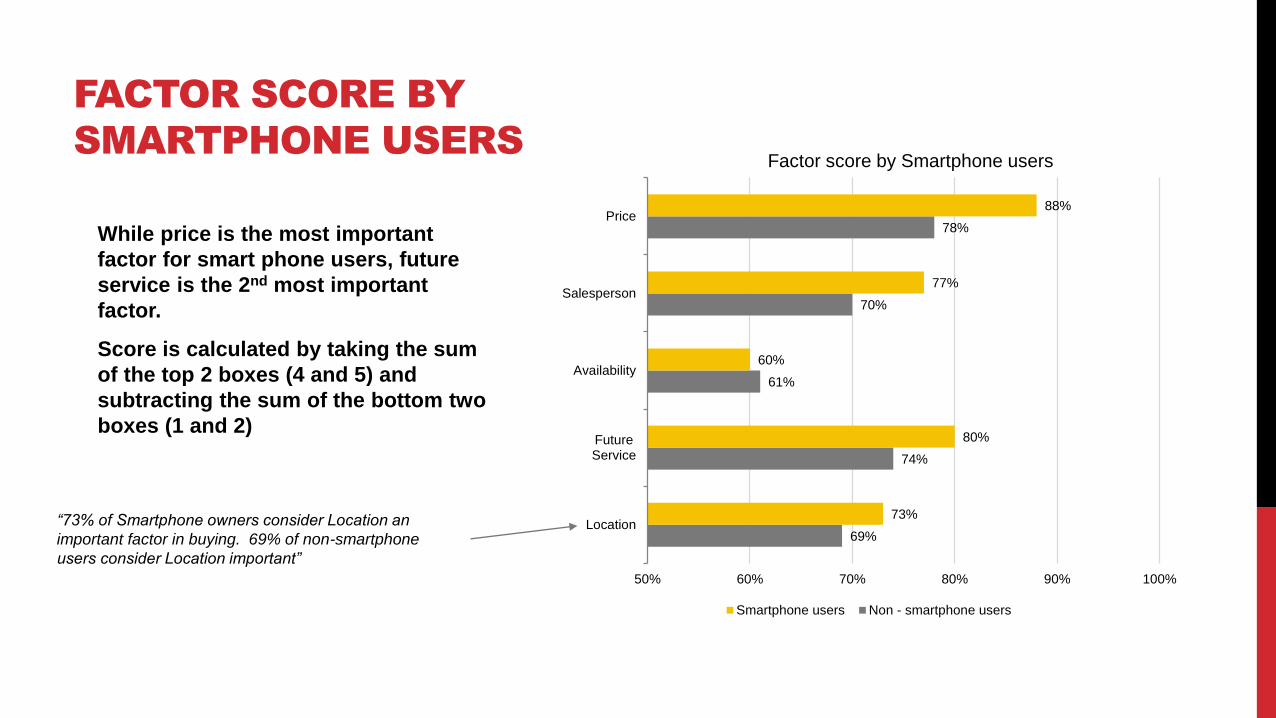
While price is the most important
factor for smart phone users, future
service is the 2nd most important
factor.
Score is calculated by taking the sum
of the top 2 boxes (4 and 5) and
subtracting the sum of the bottom two
boxes (1 and 2)
FACTOR SCORE BY
SMARTPHONE USERS
69%
74%
61%
70%
78%
73%
80%
60%
77%
88%
50% 60% 70% 80% 90% 100%
Location
FutureService
Availability
Salesperson
Price
Factor score by Smartphone users
Smartphone users Non - smartphone users
“73% of Smartphone owners consider Location an
important factor in buying. 69% of non-smartphone
users consider Location important”
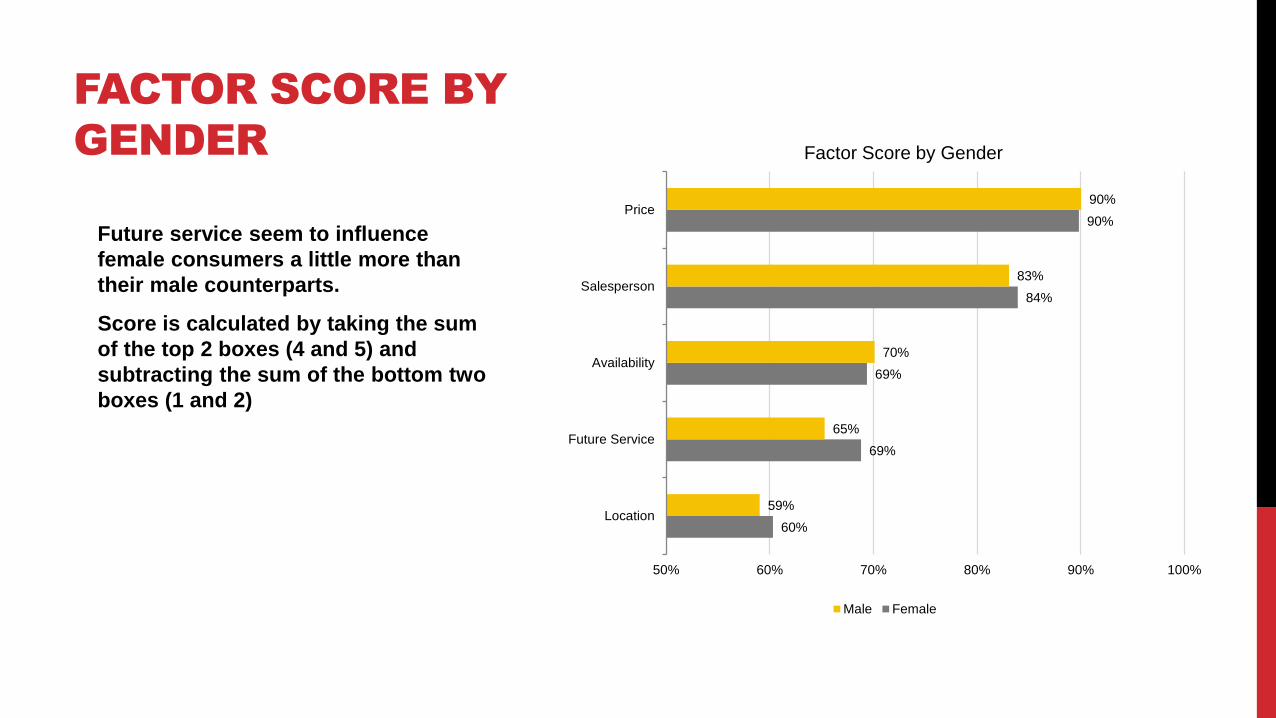
Future service seem to influence
female consumers a little more than
their male counterparts.
Score is calculated by taking the sum
of the top 2 boxes (4 and 5) and
subtracting the sum of the bottom two
boxes (1 and 2)
FACTOR SCORE BY
GENDER
60%
69%
69%
84%
90%
59%
65%
70%
83%
90%
50% 60% 70% 80% 90% 100%
Location
Future Service
Availability
Salesperson
Price
Factor Score by Gender
Male Female
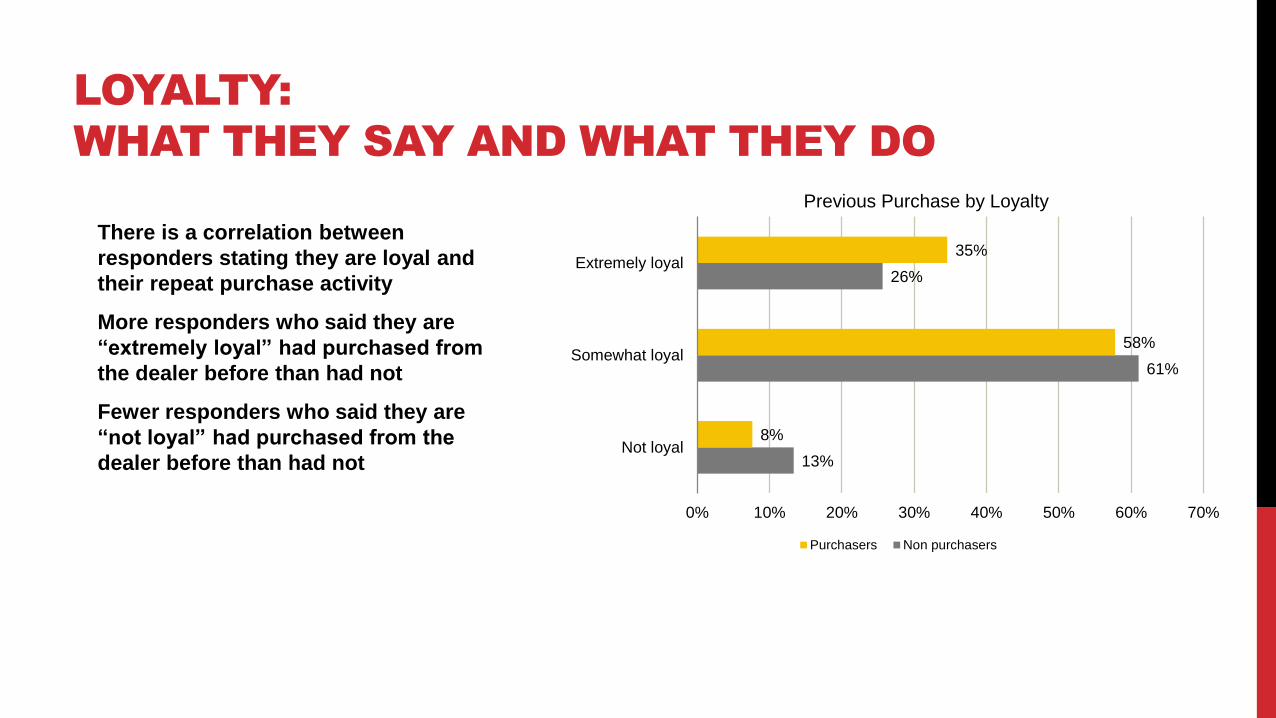
There is a correlation between
responders stating they are loyal and
their repeat purchase activity
More responders who said they are
“extremely loyal” had purchased from
the dealer before than had not
Fewer responders who said they are
“not loyal” had purchased from the
dealer before than had not
LOYALTY:
WHAT THEY SAY AND WHAT THEY DO
13%
61%
26%
8%
58%
35%
0% 10% 20% 30% 40% 50% 60% 70%
Not loyal
Somewhat loyal
Extremely loyal
Previous Purchase by Loyalty
Purchasers Non purchasers
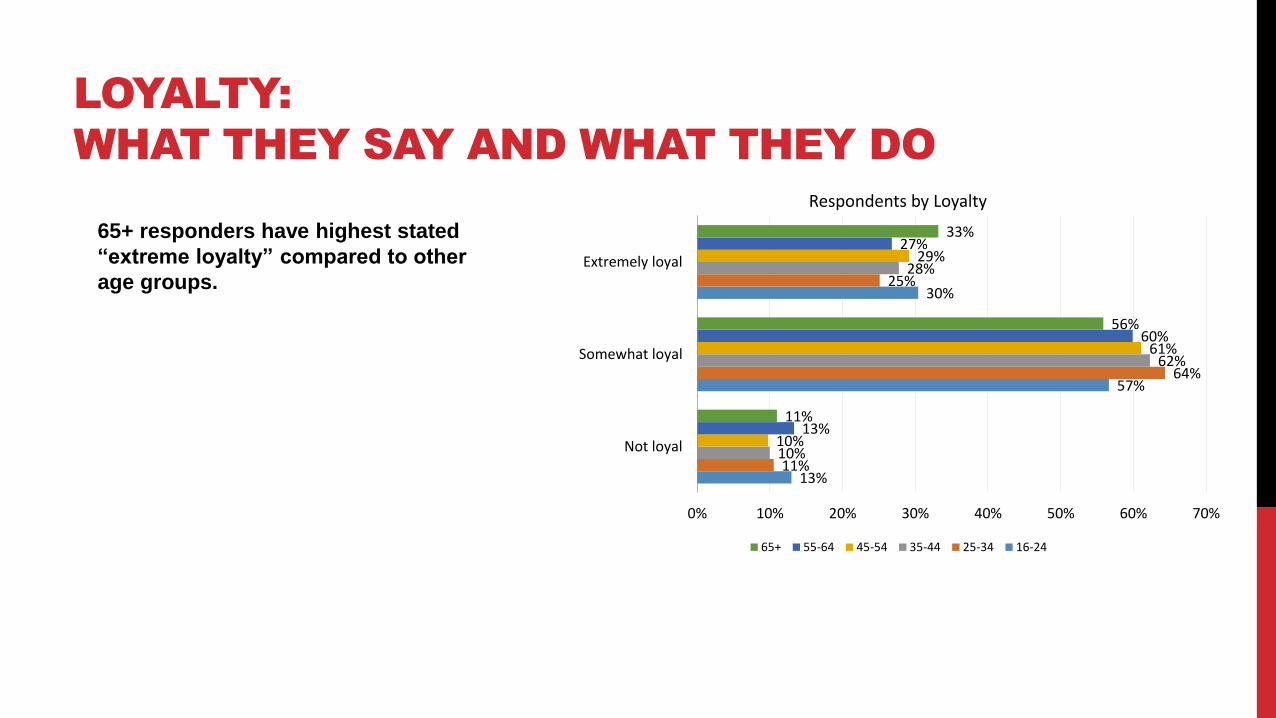
65+ responders have highest stated
“extreme loyalty” compared to other
age groups.
LOYALTY:
WHAT THEY SAY AND WHAT THEY DO
13%
57%
30%
11%
64%
25%
10%
62%
28%
10%
61%
29%
13%
60%
27%
11%
56%
33%
0% 10% 20% 30% 40% 50% 60% 70%
Not loyal
Somewhat loyal
Extremely loyal
Respondents by Loyalty
65+ 55-64 45-54 35-44 25-34 16-24
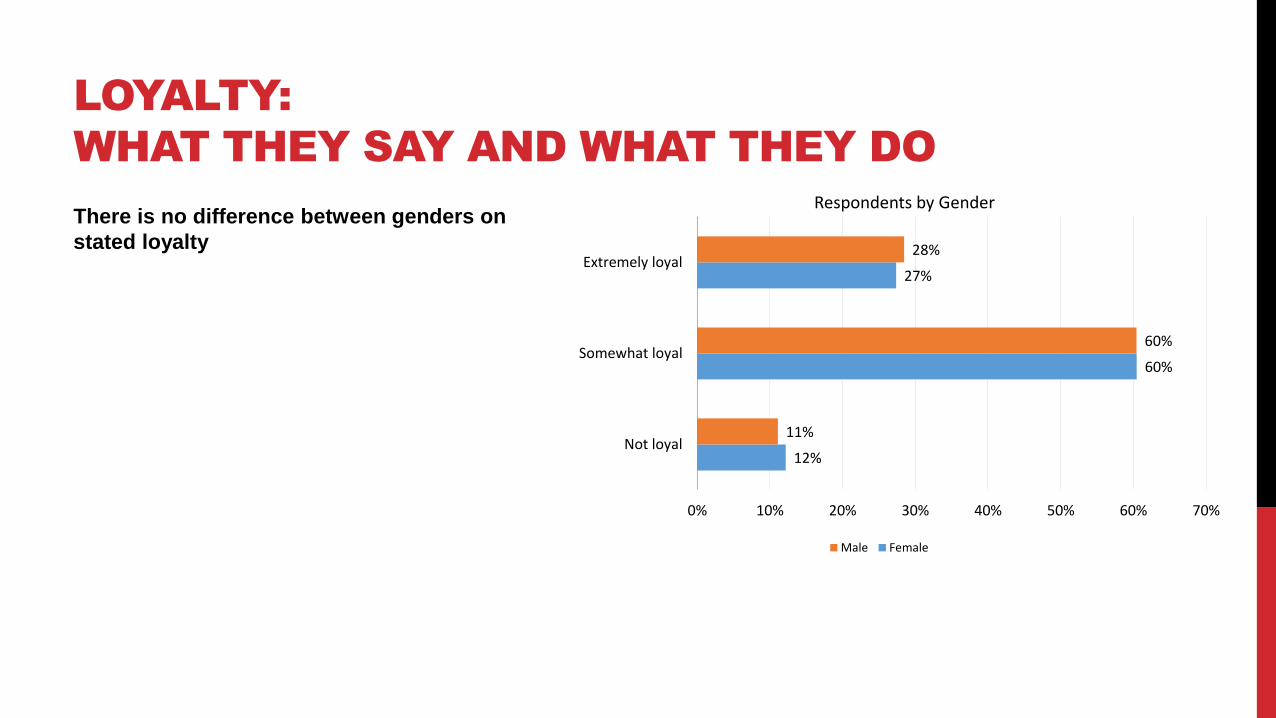
There is no difference between genders on
stated loyalty
LOYALTY:
WHAT THEY SAY AND WHAT THEY DO
12%
60%
27%
11%
60%
28%
0% 10% 20% 30% 40% 50% 60% 70%
Not loyal
Somewhat loyal
Extremely loyal
Respondents by Gender
Male Female
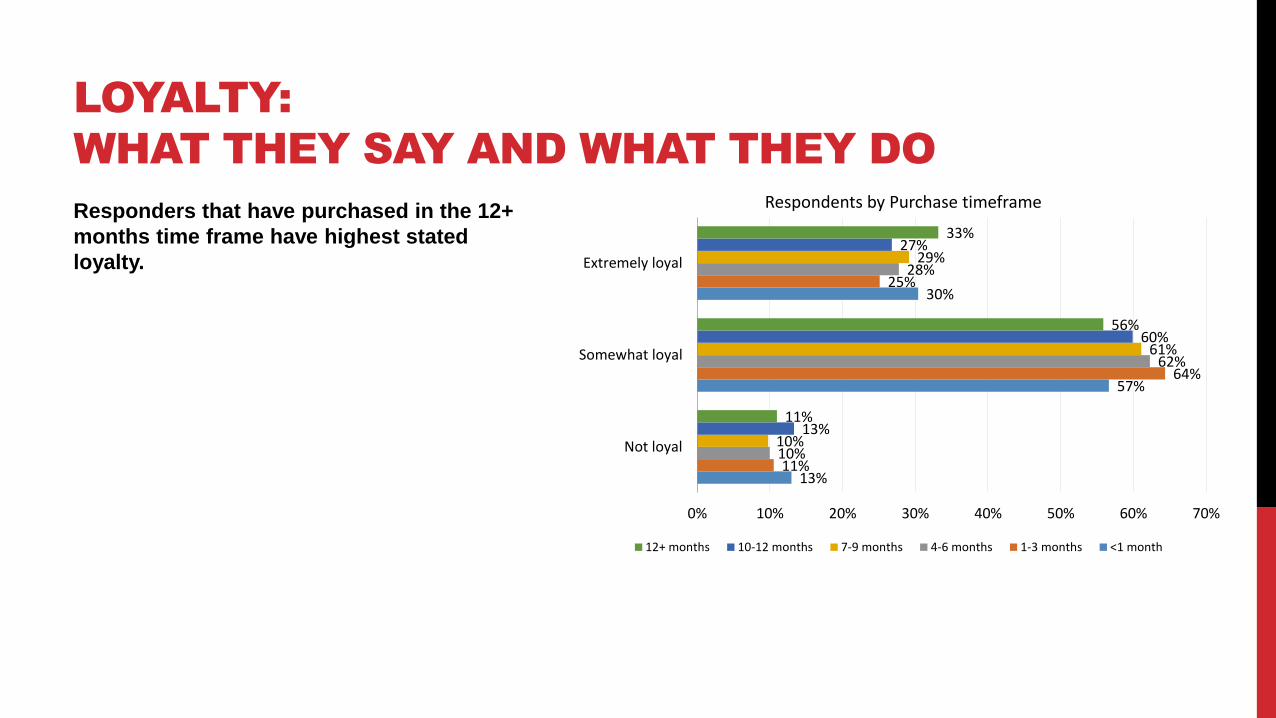
Responders that have purchased in the 12+
months time frame have highest stated
loyalty.
LOYALTY:
WHAT THEY SAY AND WHAT THEY DO
13%
57%
30%
11%
64%
25%
10%
62%
28%
10%
61%
29%
13%
60%
27%
11%
56%
33%
0% 10% 20% 30% 40% 50% 60% 70%
Not loyal
Somewhat loyal
Extremely loyal
Respondents by Purchase timeframe
12+ months 10-12 months 7-9 months 4-6 months 1-3 months <1 month
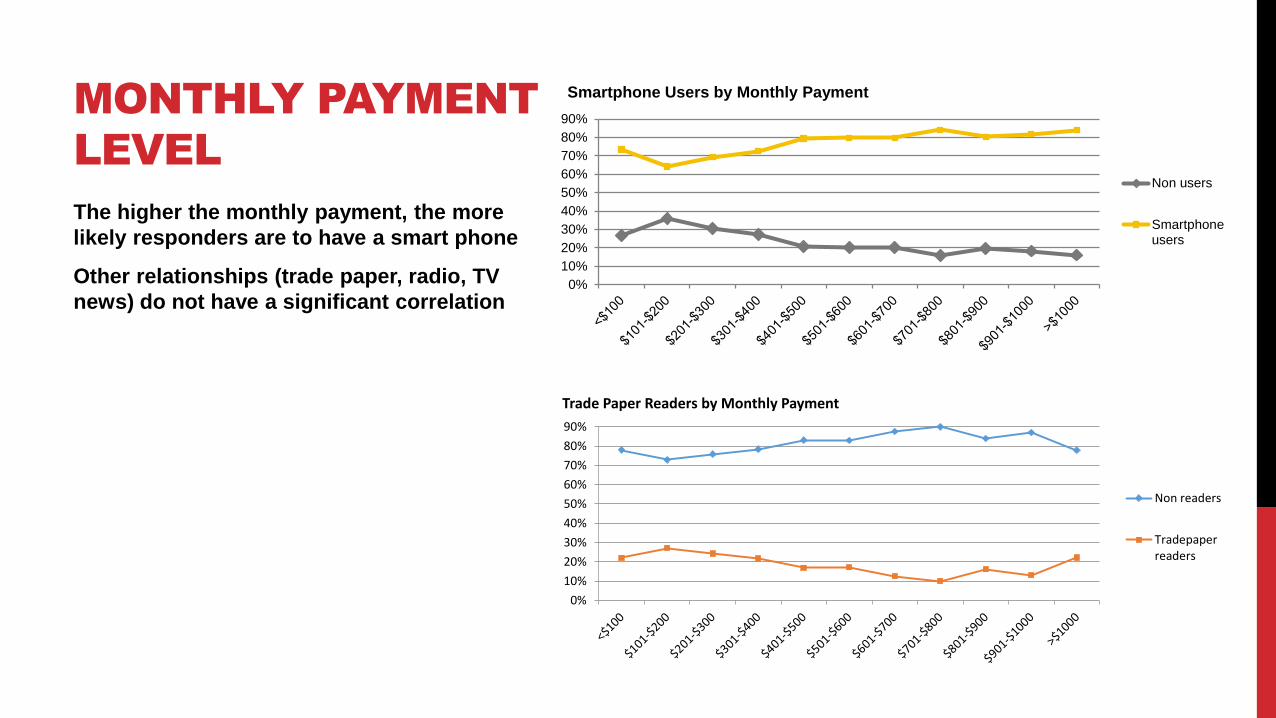
The higher the monthly payment, the more
likely responders are to have a smart phone
Other relationships (trade paper, radio, TV
news) do not have a significant correlation
MONTHLY PAYMENT
LEVEL
0%
10%
20%
30%
40%
50%
60%
70%
80%
90%
Smartphone Users by Monthly Payment
Non users
Smartphoneusers
0%
10%
20%
30%
40%
50%
60%
70%
80%
90%
Trade Paper Readers by Monthly Payment
Non readers
Tradepaperreaders
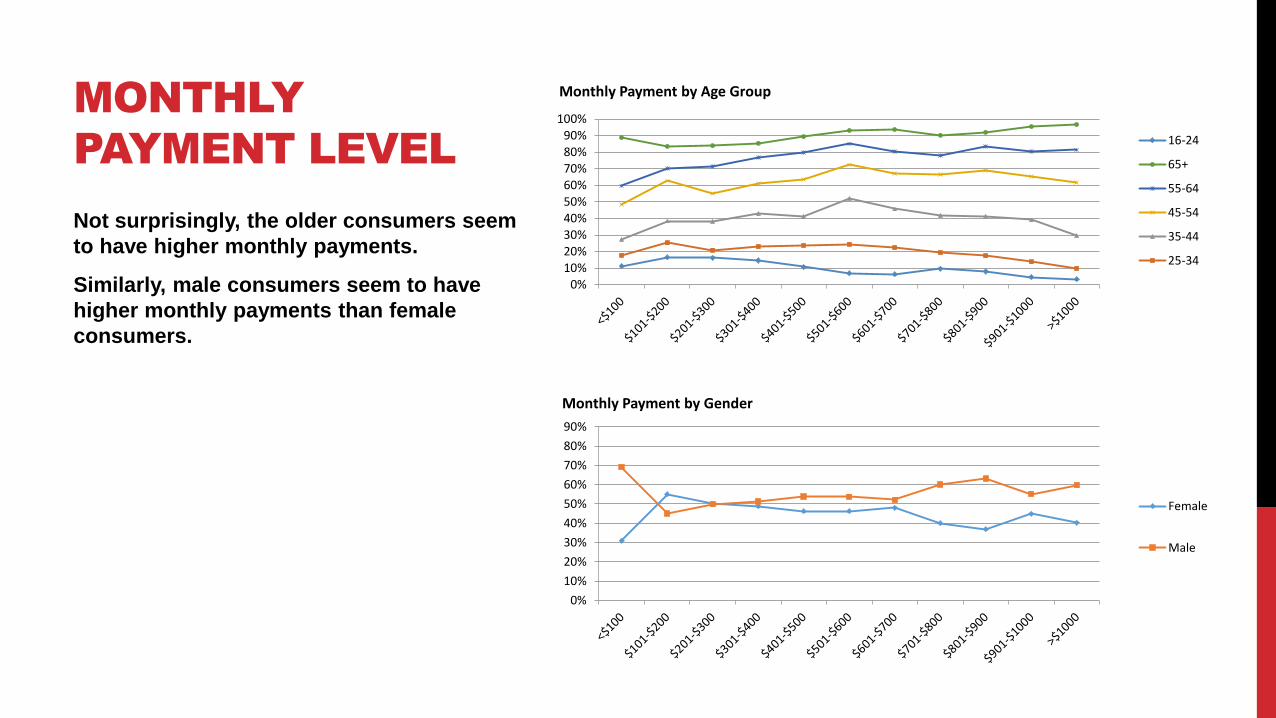
Not surprisingly, the older consumers seem
to have higher monthly payments.
Similarly, male consumers seem to have
higher monthly payments than female
consumers.
MONTHLY
PAYMENT LEVEL
0%10%20%
30%40%
50%
60%70%
80%90%
100%
Monthly Payment by Age Group
16-24
65+
55-64
45-54
35-44
25-34
0%
10%
20%
30%
40%
50%
60%
70%
80%
90%
Monthly Payment by Gender
Female
Male
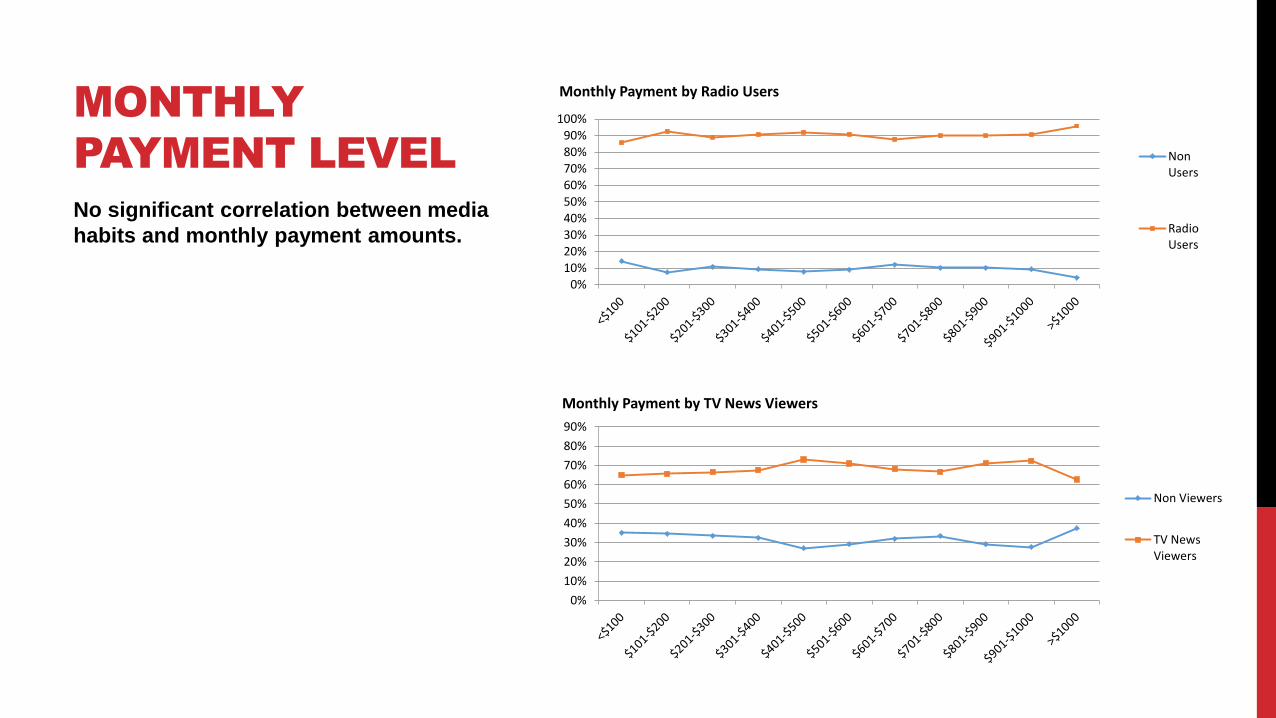
No significant correlation between media
habits and monthly payment amounts.
MONTHLY
PAYMENT LEVEL
0%
10%
20%
30%
40%
50%
60%
70%
80%
90%
Monthly Payment by TV News Viewers
Non Viewers
TV NewsViewers
0%10%20%
30%40%
50%
60%70%
80%90%
100%
Monthly Payment by Radio Users
NonUsers
RadioUsers
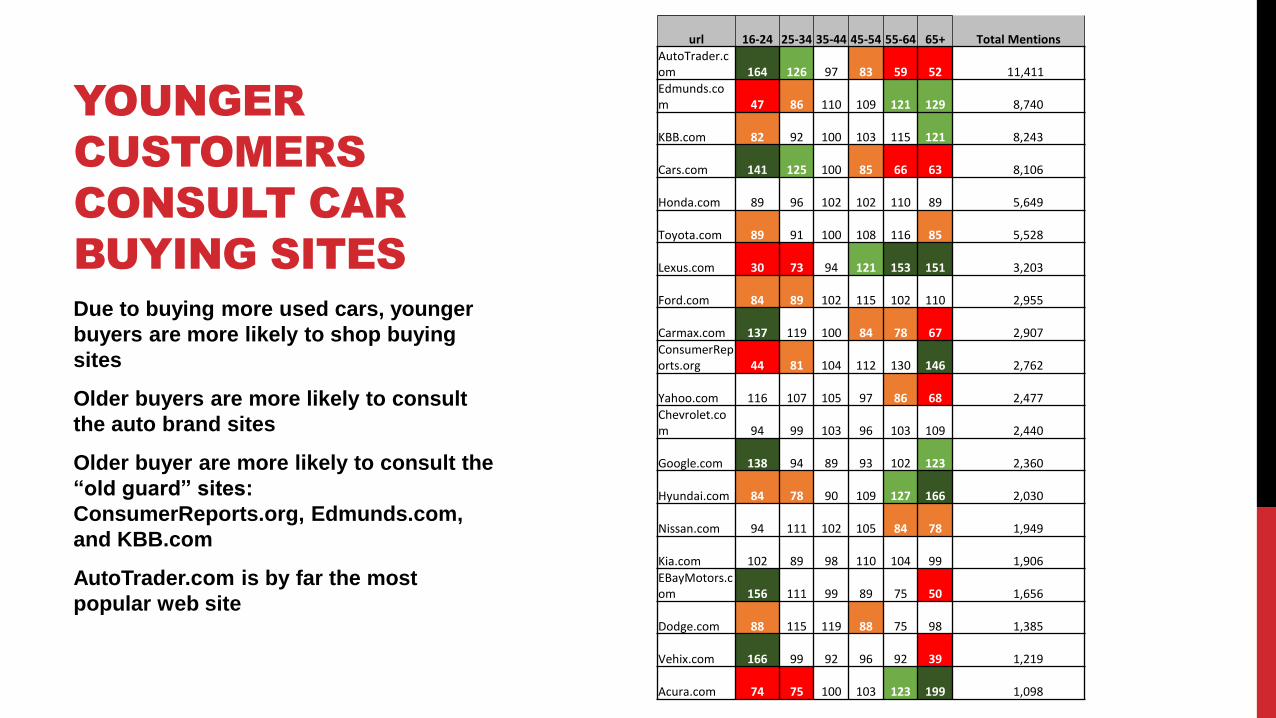
url 16-24 25-34 35-44 45-54 55-64 65+ Total Mentions
AutoTrader.com 164 126 97 83 59 52 11,411
Edmunds.com 47 86 110 109 121 129 8,740
KBB.com 82 92 100 103 115 121 8,243
Cars.com 141 125 100 85 66 63 8,106
Honda.com 89 96 102 102 110 89 5,649
Toyota.com 89 91 100 108 116 85 5,528
Lexus.com 30 73 94 121 153 151 3,203
Ford.com 84 89 102 115 102 110 2,955
Carmax.com 137 119 100 84 78 67 2,907
ConsumerReports.org 44 81 104 112 130 146 2,762
Yahoo.com 116 107 105 97 86 68 2,477
Chevrolet.com 94 99 103 96 103 109 2,440
Google.com 138 94 89 93 102 123 2,360
Hyundai.com 84 78 90 109 127 166 2,030
Nissan.com 94 111 102 105 84 78 1,949
Kia.com 102 89 98 110 104 99 1,906
EBayMotors.com 156 111 99 89 75 50 1,656
Dodge.com 88 115 119 88 75 98 1,385
Vehix.com 166 99 92 96 92 39 1,219
Acura.com 74 75 100 103 123 199 1,098
Due to buying more used cars, younger
buyers are more likely to shop buying
sites
Older buyers are more likely to consult
the auto brand sites
Older buyer are more likely to consult the
“old guard” sites:
ConsumerReports.org, Edmunds.com,
and KBB.com
AutoTrader.com is by far the most
popular web site
YOUNGER
CUSTOMERS
CONSULT CAR
BUYING SITES
20% 25% 30% 35% 40% 45% 50% 55% 60%
EBayMotors.com
GM.com
AutoTrader.com
cars.com
Edmunds.com
Dodge.com
Lexus.com
yahoo.com
Chevrolet.com
msn.com
KBB.com
Ford.com
Jeep.com
Acura.com
ConsumerReports.org
Vehix.com
Google.com
Toyota.com
Hyundai.com
Nissan.com
Carmax.com
Honda.com
Kia.com
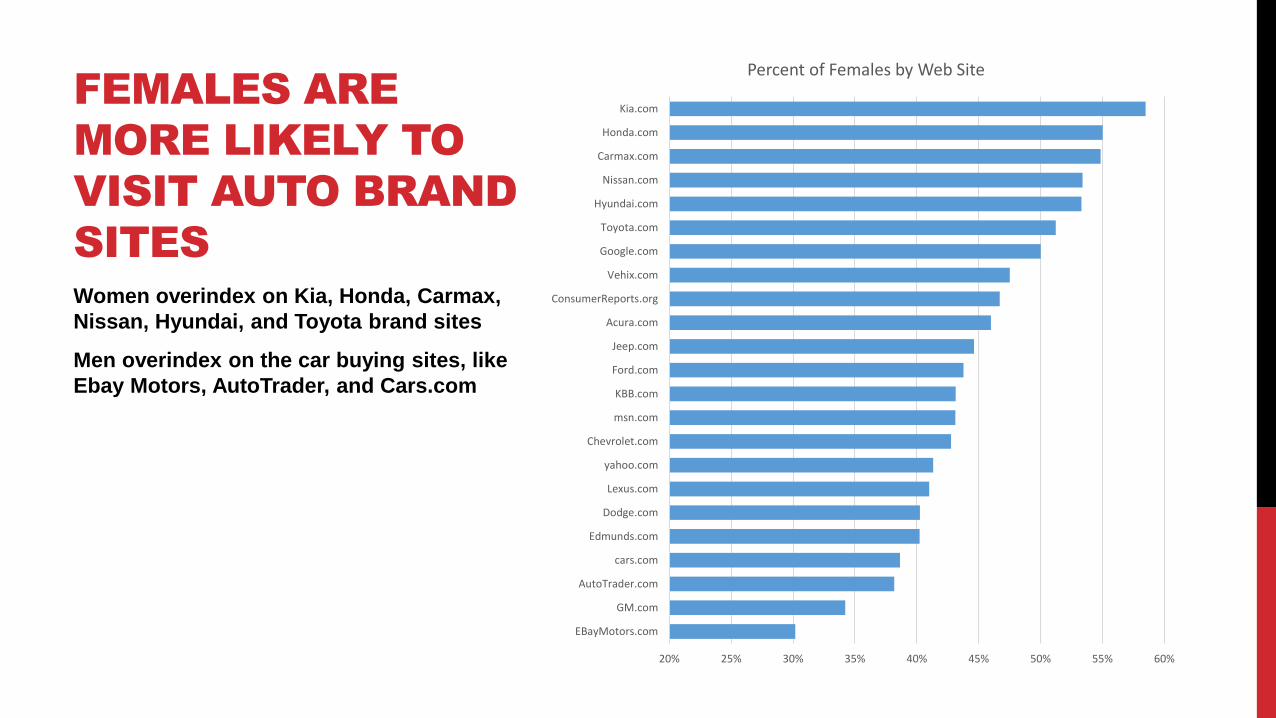
Percent of Females by Web Site
Women overindex on Kia, Honda, Carmax,
Nissan, Hyundai, and Toyota brand sites
Men overindex on the car buying sites, like
Ebay Motors, AutoTrader, and Cars.com
FEMALES ARE
MORE LIKELY TO
VISIT AUTO BRAND
SITES
0%
20%
40%
60%
80%
100%
120%
16-24 25-34 35-44 45-54 55-64 65+
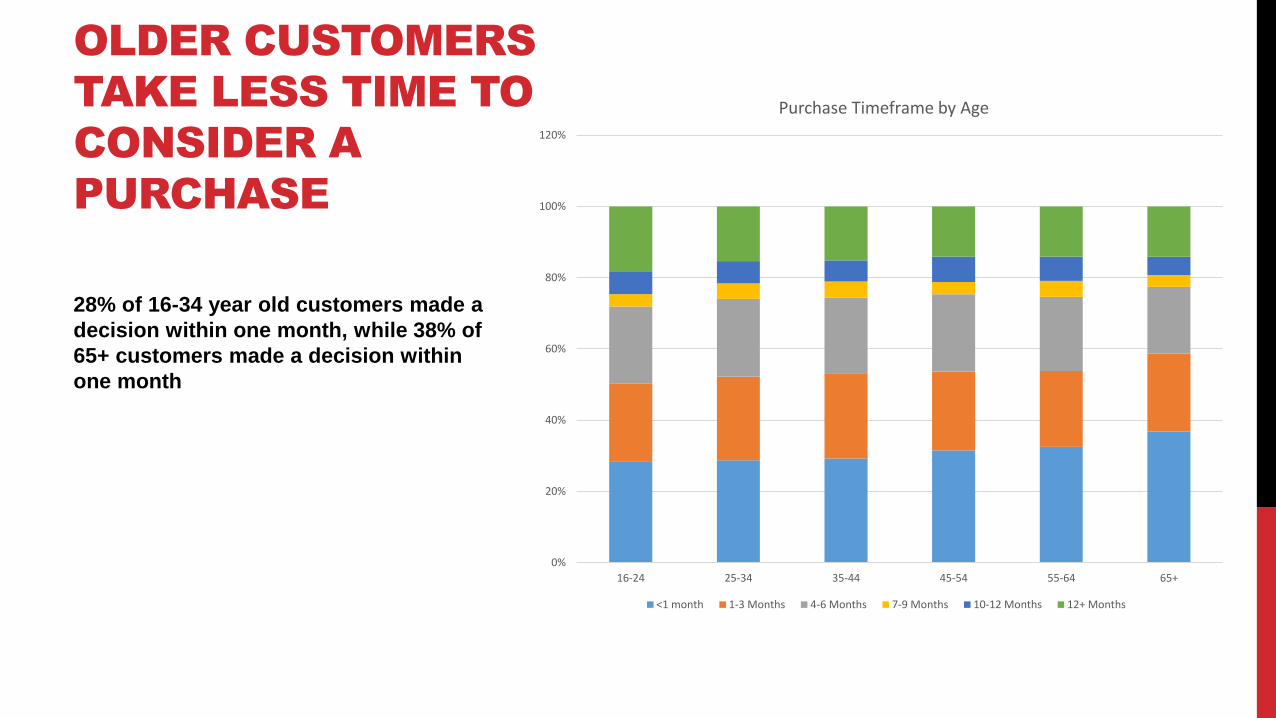
Purchase Timeframe by Age
<1 month 1-3 Months 4-6 Months 7-9 Months 10-12 Months 12+ Months
28% of 16-34 year old customers made a
decision within one month, while 38% of
65+ customers made a decision within
one month
OLDER CUSTOMERS
TAKE LESS TIME TO
CONSIDER A
PURCHASE
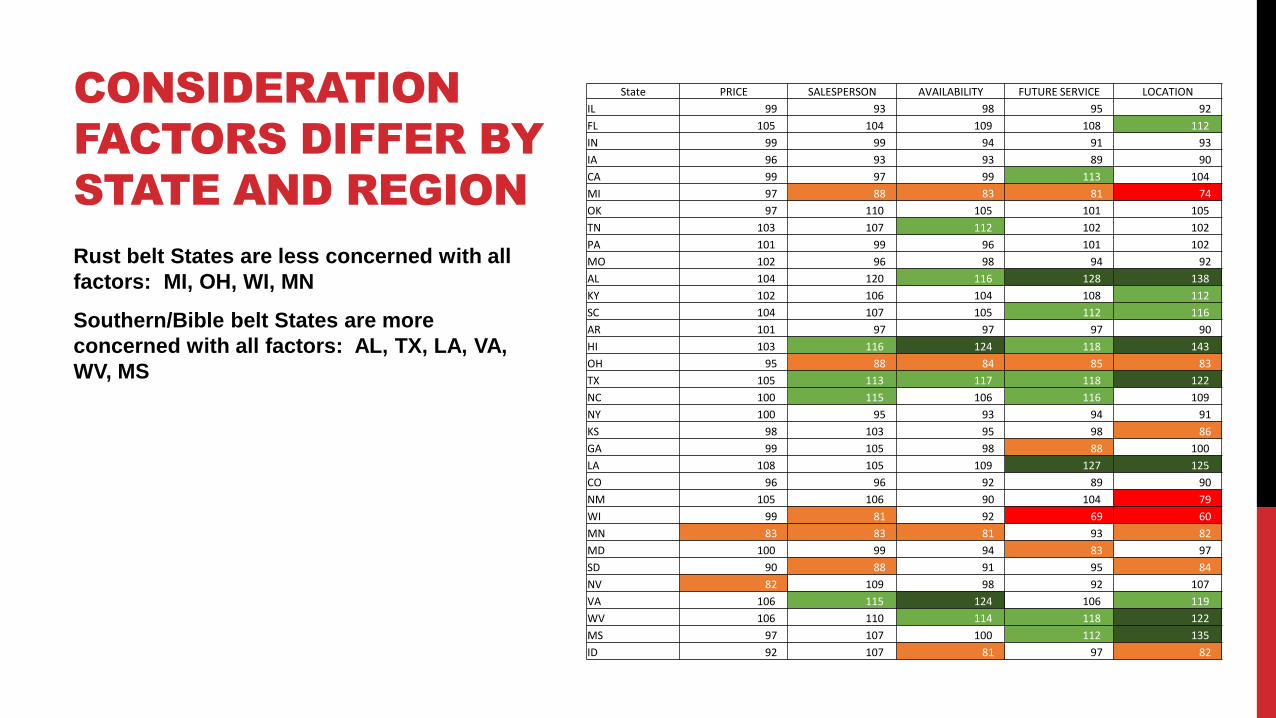
State PRICE SALESPERSON AVAILABILITY FUTURE SERVICE LOCATION
IL 99 93 98 95 92
FL 105 104 109 108 112
IN 99 99 94 91 93
IA 96 93 93 89 90
CA 99 97 99 113 104
MI 97 88 83 81 74
OK 97 110 105 101 105
TN 103 107 112 102 102
PA 101 99 96 101 102
MO 102 96 98 94 92
AL 104 120 116 128 138
KY 102 106 104 108 112
SC 104 107 105 112 116
AR 101 97 97 97 90
HI 103 116 124 118 143
OH 95 88 84 85 83
TX 105 113 117 118 122
NC 100 115 106 116 109
NY 100 95 93 94 91
KS 98 103 95 98 86
GA 99 105 98 88 100
LA 108 105 109 127 125
CO 96 96 92 89 90
NM 105 106 90 104 79
WI 99 81 92 69 60
MN 83 83 81 93 82
MD 100 99 94 83 97
SD 90 88 91 95 84
NV 82 109 98 92 107
VA 106 115 124 106 119
WV 106 110 114 118 122
MS 97 107 100 112 135
ID 92 107 81 97 82
Rust belt States are less concerned with all
factors: MI, OH, WI, MN
Southern/Bible belt States are more
concerned with all factors: AL, TX, LA, VA,
WV, MS
CONSIDERATION
FACTORS DIFFER BY
STATE AND REGION
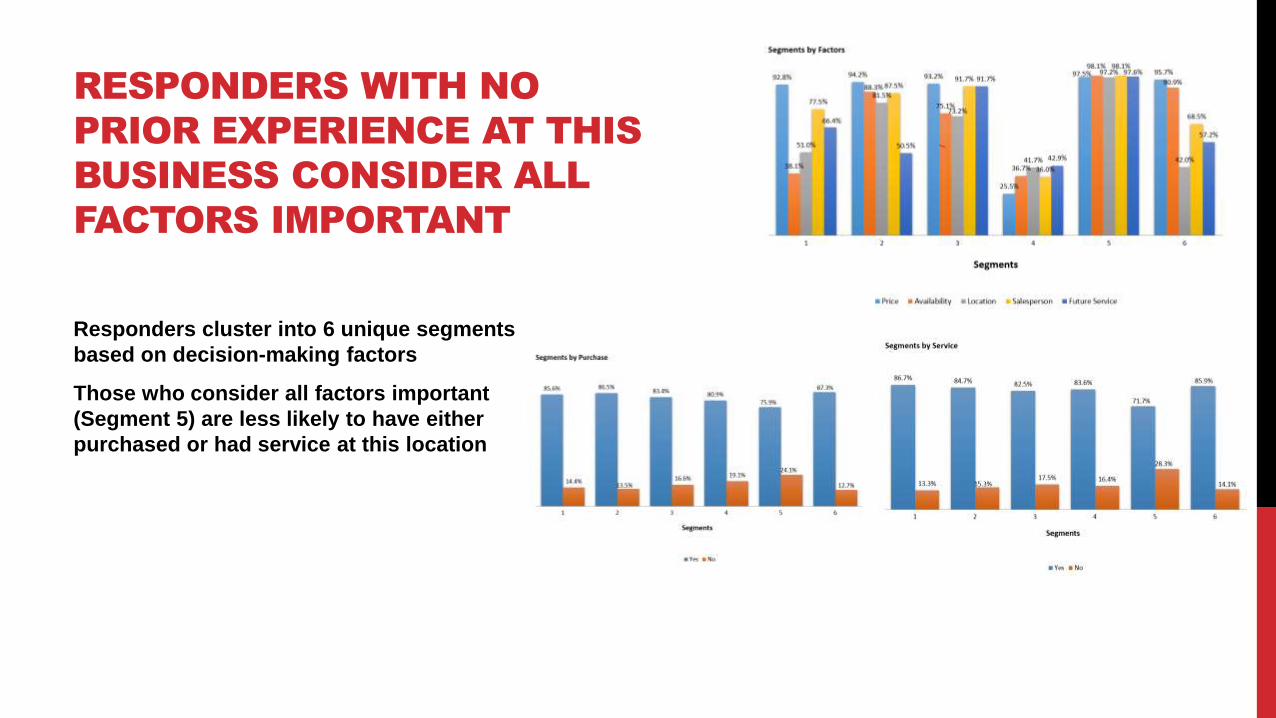
Responders cluster into 6 unique segments
based on decision-making factors
Those who consider all factors important
(Segment 5) are less likely to have either
purchased or had service at this location
RESPONDERS WITH NO
PRIOR EXPERIENCE AT THIS
BUSINESS CONSIDER ALL
FACTORS IMPORTANT
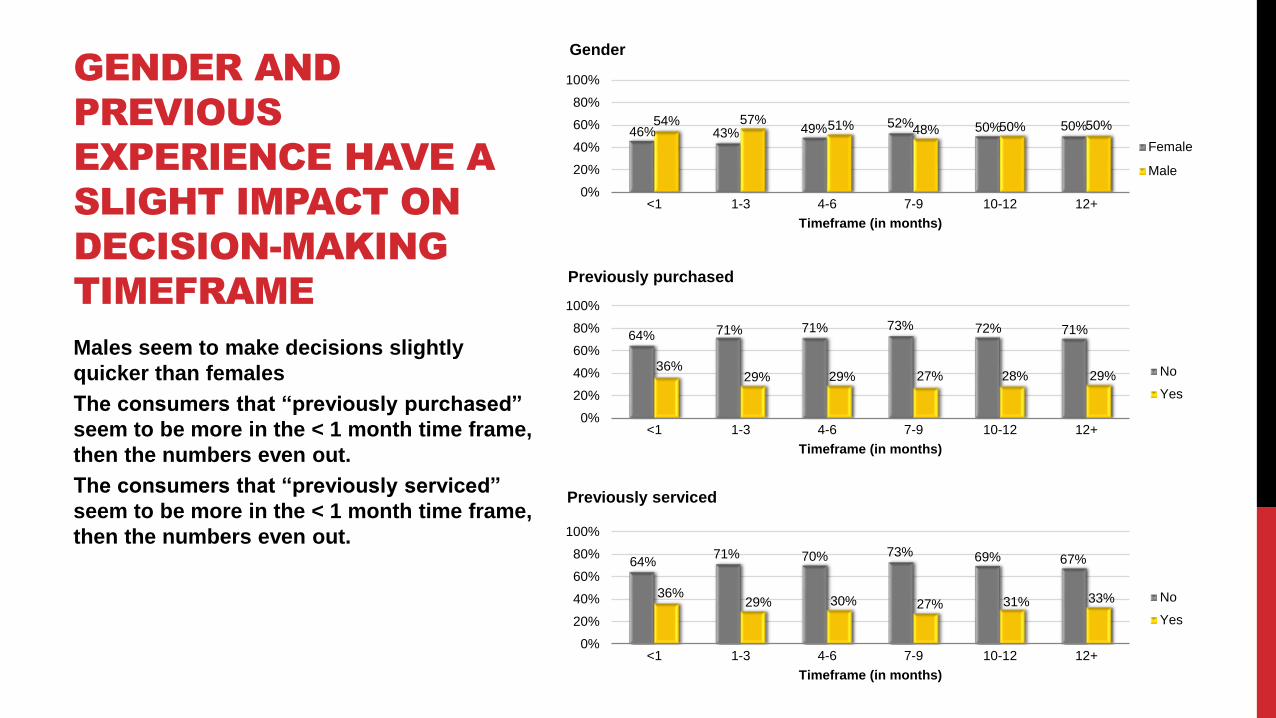
Males seem to make decisions slightly
quicker than females
The consumers that “previously purchased”
seem to be more in the < 1 month time frame,
then the numbers even out.
The consumers that “previously serviced”
seem to be more in the < 1 month time frame,
then the numbers even out.
GENDER AND
PREVIOUS
EXPERIENCE HAVE A
SLIGHT IMPACT ON
DECISION-MAKING
TIMEFRAME
64%71% 70% 73% 69% 67%
36%29% 30% 27% 31% 33%
0%
20%
40%
60%
80%
100%
<1 1-3 4-6 7-9 10-12 12+
Timeframe (in months)
Previously serviced
No
Yes
46% 43% 49% 52% 50% 50%54% 57% 51% 48% 50% 50%
0%
20%
40%
60%
80%
100%
<1 1-3 4-6 7-9 10-12 12+
Timeframe (in months)
Gender
Female
Male
64% 71% 71% 73% 72% 71%
36%29% 29% 27% 28% 29%
0%
20%
40%
60%
80%
100%
<1 1-3 4-6 7-9 10-12 12+
Timeframe (in months)
Previously purchased
No
Yes
Recommended