Celebrating the Past, Embracing the Future.
Quarterly Report - March 31, 2017

Corporate Information 2
Condensed Interim Consolidated Financial Information 3
Directors’ Review - English 4
Directors’ Review - Urdu 6
Condensed Interim Consolidated Statement of Financial Position 10
Condensed Interim Consolidated Profit & Loss Account 11
Condensed Interim Consolidated Statement of Comprehensive Income 12
Condensed Interim Consolidated Statement of Changes in Equity 13
Condensed Interim Consolidated Cash Flow Statement 14
Notes to the Condensed Interim Consolidated Financial Information 15
Condensed Interim Unconsolidated Financial Information 29
Directors’ Review - English 30
Directors’ Review - Urdu 32
Condensed Interim Unconsolidated Statement of Financial Position 36
Condensed Interim Unconsolidated Profit & Loss Account 37
Condensed Interim Unconsolidated Statement of Comprehensive Income 38
Condensed Interim Unconsolidated Statement of Changes in Equity 39
Condensed Interim Unconsolidated Cash Flow Statement 40
Notes to the Condensed Interim Unconsolidated Financial Information 41
Table of Contents
01Quarterly Report - March 2017

Corporate Information
Board of Directors
Mr. Sultan Ali Allana Chairman
Mr. Shaffiq DharamshiDirector
Mr. Moez Ahamed Jamal Director
Dr. Najeeb Samie Director
Mr. Agha Sher Shah Director
Mr. Sajid Zahid Director
Mr. Nauman K. Dar President & CEO
Chief Financial Officer Mr. Rayomond Kotwal
Company Secretary Ms. Nausheen Ahmad
Auditors A. F. Ferguson & Co.Chartered Accountants
Head Office Habib Bank LimitedHabib Bank Plaza I. I. Chundrigar Road,Karachi - 75650, Pakistan.Phone : (92-21) 32418000 [50 lines]
WebsitesCorporate Website www.hbl.com
Internet Banking www.hblibank.com.pk
Registered Office Habib Bank Limited9th Floor, Habib Bank Tower,Jinnah Avenue, Blue Area,Islamabad, Pakistan.Phone : (92-51) 2872203, (92-51) 2821183Fax : (92-51) 2872205
Registrars Central Depository Company of Pakistan LimitedCDC House, 99-B, Block ‘B’, S.M.C.H.S., Main Shahrah-e-Faisal,Karachi - 74400, Pakistan.Tel: Customer Support Services (Toll Free) 0800-CDCPL (23275)Fax: (92-21) 34326053Email: [email protected]: www.cdcpakistan.com
02Quarterly Report - March 2017

Condensed Interim ConsolidatedFinancialInformation
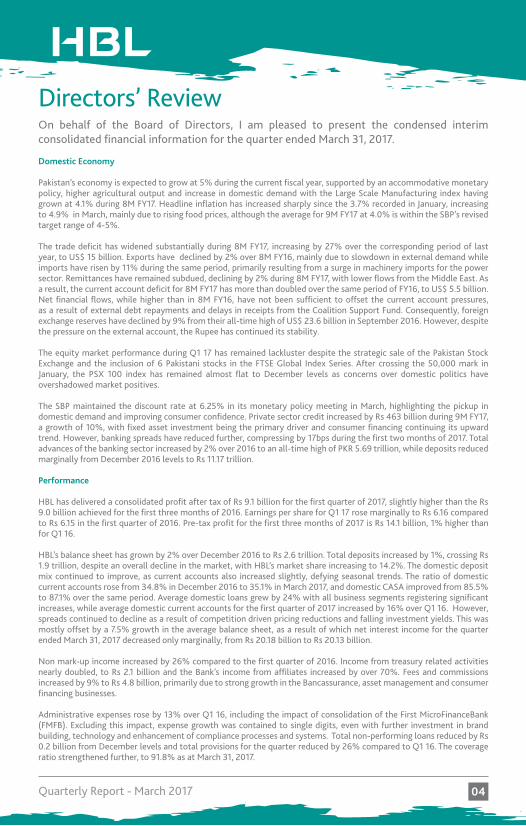
On behalf of the Board of Directors, I am pleased to present the condensed interim consolidated financial information for the quarter ended March 31, 2017.
Domestic Economy
Pakistan’s economy is expected to grow at 5% during the current fiscal year, supported by an accommodative monetary policy, higher agricultural output and increase in domestic demand with the Large Scale Manufacturing index having grown at 4.1% during 8M FY17. Headline inflation has increased sharply since the 3.7% recorded in January, increasing to 4.9% in March, mainly due to rising food prices, although the average for 9M FY17 at 4.0% is within the SBP’s revised target range of 4-5%.
The trade deficit has widened substantially during 8M FY17, increasing by 27% over the corresponding period of last year, to US$ 15 billion. Exports have declined by 2% over 8M FY16, mainly due to slowdown in external demand while imports have risen by 11% during the same period, primarily resulting from a surge in machinery imports for the power sector. Remittances have remained subdued, declining by 2% during 8M FY17, with lower flows from the Middle East. As a result, the current account deficit for 8M FY17 has more than doubled over the same period of FY16, to US$ 5.5 billion. Net financial flows, while higher than in 8M FY16, have not been sufficient to offset the current account pressures, as a result of external debt repayments and delays in receipts from the Coalition Support Fund. Consequently, foreign exchange reserves have declined by 9% from their all-time high of US$ 23.6 billion in September 2016. However, despite the pressure on the external account, the Rupee has continued its stability.
The equity market performance during Q1 17 has remained lackluster despite the strategic sale of the Pakistan Stock Exchange and the inclusion of 6 Pakistani stocks in the FTSE Global Index Series. After crossing the 50,000 mark in January, the PSX 100 index has remained almost flat to December levels as concerns over domestic politics have overshadowed market positives.
The SBP maintained the discount rate at 6.25% in its monetary policy meeting in March, highlighting the pickup in domestic demand and improving consumer confidence. Private sector credit increased by Rs 463 billion during 9M FY17, a growth of 10%, with fixed asset investment being the primary driver and consumer financing continuing its upward trend. However, banking spreads have reduced further, compressing by 17bps during the first two months of 2017. Total advances of the banking sector increased by 2% over 2016 to an all-time high of PKR 5.69 trillion, while deposits reduced marginally from December 2016 levels to Rs 11.17 trillion.
Performance
HBL has delivered a consolidated profit after tax of Rs 9.1 billion for the first quarter of 2017, slightly higher than the Rs 9.0 billion achieved for the first three months of 2016. Earnings per share for Q1 17 rose marginally to Rs 6.16 compared to Rs 6.15 in the first quarter of 2016. Pre-tax profit for the first three months of 2017 is Rs 14.1 billion, 1% higher than for Q1 16.
HBL’s balance sheet has grown by 2% over December 2016 to Rs 2.6 trillion. Total deposits increased by 1%, crossing Rs 1.9 trillion, despite an overall decline in the market, with HBL’s market share increasing to 14.2%. The domestic deposit mix continued to improve, as current accounts also increased slightly, defying seasonal trends. The ratio of domestic current accounts rose from 34.8% in December 2016 to 35.1% in March 2017, and domestic CASA improved from 85.5% to 87.1% over the same period. Average domestic loans grew by 24% with all business segments registering significant increases, while average domestic current accounts for the first quarter of 2017 increased by 16% over Q1 16. However, spreads continued to decline as a result of competition driven pricing reductions and falling investment yields. This was mostly offset by a 7.5% growth in the average balance sheet, as a result of which net interest income for the quarter ended March 31, 2017 decreased only marginally, from Rs 20.18 billion to Rs 20.13 billion.
Non mark-up income increased by 26% compared to the first quarter of 2016. Income from treasury related activities nearly doubled, to Rs 2.1 billion and the Bank’s income from affiliates increased by over 70%. Fees and commissions increased by 9% to Rs 4.8 billion, primarily due to strong growth in the Bancassurance, asset management and consumer financing businesses.
Administrative expenses rose by 13% over Q1 16, including the impact of consolidation of the First MicroFinanceBank (FMFB). Excluding this impact, expense growth was contained to single digits, even with further investment in brand building, technology and enhancement of compliance processes and systems. Total non-performing loans reduced by Rs 0.2 billion from December levels and total provisions for the quarter reduced by 26% compared to Q1 16. The coverage ratio strengthened further, to 91.8% as at March 31, 2017.
Directors’ Review
04Quarterly Report - March 2017
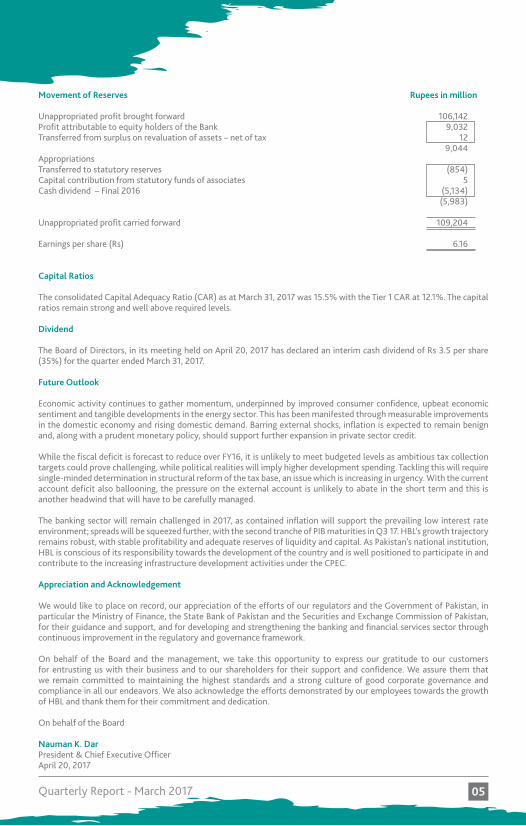
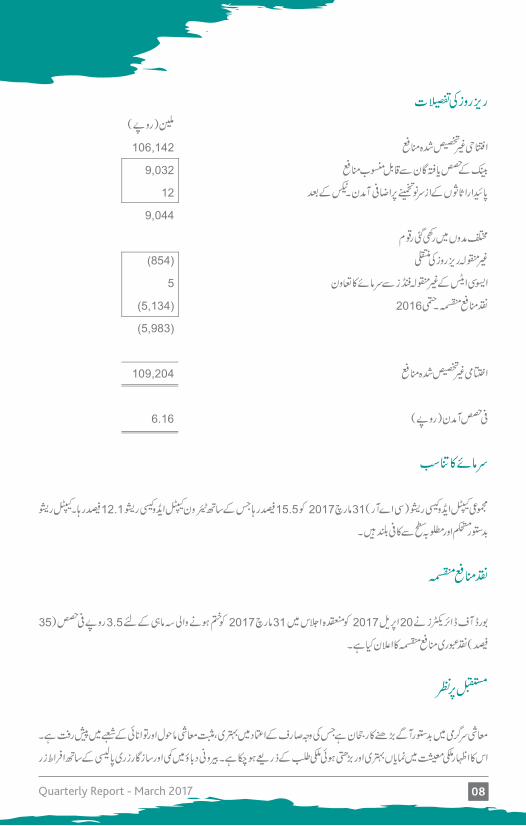
Movement of Reserves Rupees in million
Unappropriated profit brought forward 106,142Profit attributable to equity holders of the Bank 9,032Transferred from surplus on revaluation of assets – net of tax 12 9,044Appropriations Transferred to statutory reserves (854)Capital contribution from statutory funds of associates 5Cash dividend – Final 2016 (5,134) (5,983) Unappropriated profit carried forward 109,204
Earnings per share (Rs) 6.16
Capital Ratios
The consolidated Capital Adequacy Ratio (CAR) as at March 31, 2017 was 15.5% with the Tier 1 CAR at 12.1%. The capital ratios remain strong and well above required levels.
Dividend
The Board of Directors, in its meeting held on April 20, 2017 has declared an interim cash dividend of Rs 3.5 per share (35%) for the quarter ended March 31, 2017.
Future Outlook
Economic activity continues to gather momentum, underpinned by improved consumer confidence, upbeat economic sentiment and tangible developments in the energy sector. This has been manifested through measurable improvements in the domestic economy and rising domestic demand. Barring external shocks, inflation is expected to remain benign and, along with a prudent monetary policy, should support further expansion in private sector credit.
While the fiscal deficit is forecast to reduce over FY16, it is unlikely to meet budgeted levels as ambitious tax collection targets could prove challenging, while political realities will imply higher development spending. Tackling this will require single-minded determination in structural reform of the tax base, an issue which is increasing in urgency. With the current account deficit also ballooning, the pressure on the external account is unlikely to abate in the short term and this is another headwind that will have to be carefully managed.
The banking sector will remain challenged in 2017, as contained inflation will support the prevailing low interest rate environment; spreads will be squeezed further, with the second tranche of PIB maturities in Q3 17. HBL’s growth trajectory remains robust, with stable profitability and adequate reserves of liquidity and capital. As Pakistan’s national institution, HBL is conscious of its responsibility towards the development of the country and is well positioned to participate in and contribute to the increasing infrastructure development activities under the CPEC.
Appreciation and Acknowledgement
We would like to place on record, our appreciation of the efforts of our regulators and the Government of Pakistan, in particular the Ministry of Finance, the State Bank of Pakistan and the Securities and Exchange Commission of Pakistan, for their guidance and support, and for developing and strengthening the banking and financial services sector through continuous improvement in the regulatory and governance framework.
On behalf of the Board and the management, we take this opportunity to express our gratitude to our customers for entrusting us with their business and to our shareholders for their support and confidence. We assure them that we remain committed to maintaining the highest standards and a strong culture of good corporate governance and compliance in all our endeavors. We also acknowledge the efforts demonstrated by our employees towards the growth of HBL and thank them for their commitment and dedication.
On behalf of the Board
Nauman K. DarPresident & Chief Executive OfficerApril 20, 2017
05Quarterly Report - March 2017
06Quarterly Report - March 2017 07
07Quarterly Report - March 2017 06
08Quarterly Report - March 2017 09
09Quarterly Report - March 2017 08
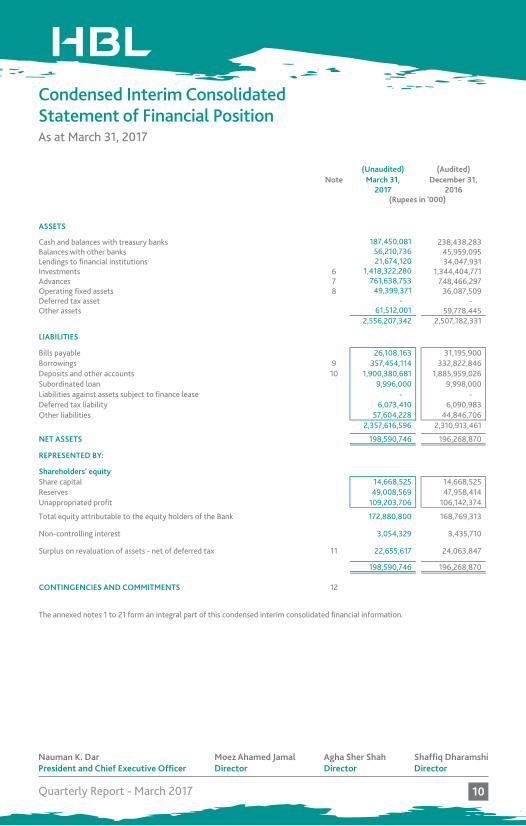
Condensed Interim Consolidated Statement of Financial PositionAs at March 31, 2017HABIB BANK LIMITEDCONDENSED INTERIM CONSOLIDATED STATEMENT OF FINANCIAL POSITIONAS AT MARCH 31, 2017
(Unaudited) (Audited)Note March 31, December 31,
2017 2016
ASSETS
Cash and balances with treasury banks 187,450,081 238,438,283 Balances with other banks 56,210,736 45,959,095 Lendings to financial institutions 21,674,120 34,047,931 Investments 6 1,418,322,280 1,344,404,771 Advances 7 761,638,753 748,466,297 Operating fixed assets 8 49,399,371 36,087,509 Deferred tax asset - - Other assets 61,512,001 59,778,445
2,556,207,342 2,507,182,331
LIABILITIES
Bills payable 26,108,163 31,195,900 Borrowings 9 357,454,114 332,822,846 Deposits and other accounts 10 1,900,380,681 1,885,959,026 Subordinated loan 9,996,000 9,998,000 Liabilities against assets subject to finance lease - - Deferred tax liability 6,073,410 6,090,983 Other liabilities 57,604,228 44,846,706
2,357,616,596 2,310,913,461
NET ASSETS 198,590,746 196,268,870
REPRESENTED BY:
Shareholders' equityShare capital 14,668,525 14,668,525 Reserves 49,008,569 47,958,414 Unappropriated profit 109,203,706 106,142,374
Total equity attributable to the equity holders of the Bank 172,880,800 168,769,313
Non-controlling interest 3,054,329 3,435,710
Surplus on revaluation of assets - net of deferred tax 11 22,655,617 24,063,847
198,590,746 196,268,870
CONTINGENCIES AND COMMITMENTS 12
The annexed notes 1 to 21 form an integral part of this condensed interim consolidated financial information.
President and Chief Executive Officer Director Director Director
(Rupees in '000)
Nauman K. DarPresident and Chief Executive Officer
Agha Sher ShahDirector
Shaffiq DharamshiDirector
Moez Ahamed JamalDirector
10Quarterly Report - March 2017
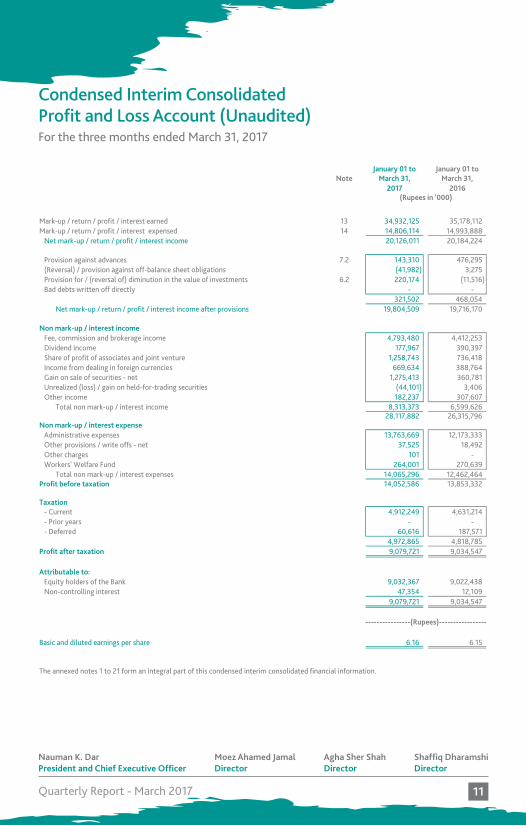
Condensed Interim Consolidated Profit and Loss Account (Unaudited)For the three months ended March 31, 2017HABIB BANK LIMITEDCONDENSED INTERIM CONSOLIDATED PROFIT AND LOSS ACCOUNT (UNAUDITED)FOR THE THREE MONTHS ENDED MARCH 31, 2017
January 01 to January 01 toNote March 31, March 31,
2017 2016
Mark-up / return / profit / interest earned 13 34,932,125 35,178,112 Mark-up / return / profit / interest expensed 14 14,806,114 14,993,888
Net mark-up / return / profit / interest income 20,126,011 20,184,224
Provision against advances 7.2 143,310 476,295 (Reversal) / provision against off-balance sheet obligations (41,982) 3,275 Provision for / (reversal of) diminution in the value of investments 6.2 220,174 (11,516) Bad debts written off directly - -
321,502 468,054 Net mark-up / return / profit / interest income after provisions 19,804,509 19,716,170
Non mark-up / interest incomeFee, commission and brokerage income 4,793,480 4,412,253 Dividend income 177,967 390,397 Share of profit of associates and joint venture 1,258,743 736,418 Income from dealing in foreign currencies 669,634 388,764 Gain on sale of securities - net 1,275,413 360,781 Unrealized (loss) / gain on held-for-trading securities (44,101) 3,406 Other income 182,237 307,607
Total non mark-up / interest income 8,313,373 6,599,626 28,117,882 26,315,796
Non mark-up / interest expenseAdministrative expenses 13,763,669 12,173,333 Other provisions / write offs - net 37,525 18,492 Other charges 101 - Workers' Welfare Fund 264,001 270,639
Total non mark-up / interest expenses 14,065,296 12,462,464 Profit before taxation 14,052,586 13,853,332
Taxation- Current 4,912,249 4,631,214 - Prior years - - - Deferred 60,616 187,571
4,972,865 4,818,785 Profit after taxation 9,079,721 9,034,547
Attributable to:Equity holders of the Bank 9,032,367 9,022,438 Non-controlling interest 47,354 12,109
9,079,721 9,034,547
Basic and diluted earnings per share 6.16 6.15
The annexed notes 1 to 21 form an integral part of this condensed interim consolidated financial information.
President and Chief Executive Officer Director Director Director
(Rupees in '000)
----------------(Rupees)-----------------
Nauman K. DarPresident and Chief Executive Officer
Agha Sher ShahDirector
Shaffiq DharamshiDirector
Moez Ahamed JamalDirector
11Quarterly Report - March 2017
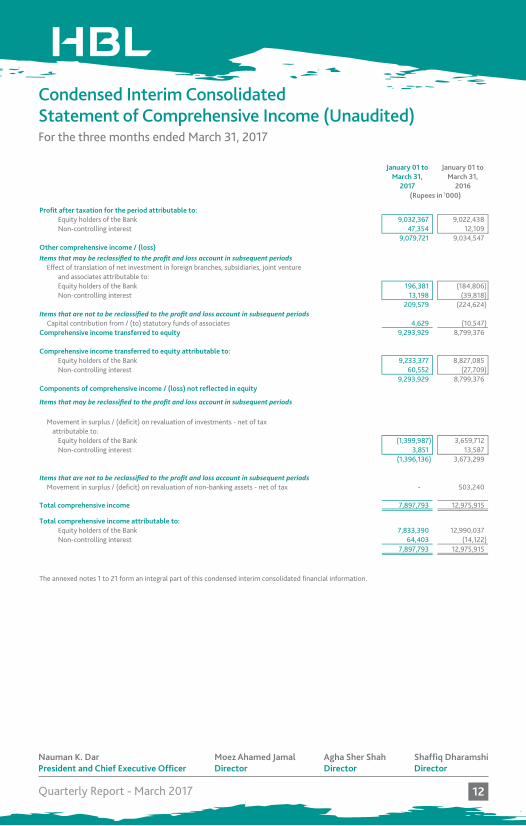
HABIB BANK LIMITEDCONDENSED INTERIM CONSOLIDATED STATEMENT OF COMPREHENSIVE INCOME (UNAUDITED)FOR THE THREE MONTHS ENDED MARCH 31, 2017
January 01 to January 01 toMarch 31, March 31,
2017 2016
Profit after taxation for the period attributable to: Equity holders of the Bank 9,032,367 9,022,438 Non-controlling interest 47,354 12,109
9,079,721 9,034,547 Other comprehensive income / (loss)Items that may be reclassified to the profit and loss account in subsequent periods
Effect of translation of net investment in foreign branches, subsidiaries, joint ventureand associates attributable to:Equity holders of the Bank 196,381 (184,806) Non-controlling interest 13,198 (39,818)
209,579 (224,624) Items that are not to be reclassified to the profit and loss account in subsequent periods
Capital contribution from / (to) statutory funds of associates 4,629 (10,547) Comprehensive income transferred to equity 9,293,929 8,799,376
Comprehensive income transferred to equity attributable to:Equity holders of the Bank 9,233,377 8,827,085 Non-controlling interest 60,552 (27,709)
9,293,929 8,799,376 Components of comprehensive income / (loss) not reflected in equity
Items that may be reclassified to the profit and loss account in subsequent periods
Movement in surplus / (deficit) on revaluation of investments - net of tax attributable to:
Equity holders of the Bank (1,399,987) 3,659,712 Non-controlling interest 3,851 13,587
(1,396,136) 3,673,299
Items that are not to be reclassified to the profit and loss account in subsequent periodsMovement in surplus / (deficit) on revaluation of non-banking assets - net of tax - 503,240
Total comprehensive income 7,897,793 12,975,915
Total comprehensive income attributable to:Equity holders of the Bank 7,833,390 12,990,037 Non-controlling interest 64,403 (14,122)
7,897,793 12,975,915
The annexed notes 1 to 21 form an integral part of this condensed interim consolidated financial information.
President and Chief Executive Officer Direct or Director Director
(Rupees in '000)
Condensed Interim Consolidated Statement of Comprehensive Income (Unaudited)For the three months ended March 31, 2017
Nauman K. DarPresident and Chief Executive Officer
Agha Sher ShahDirector
Shaffiq DharamshiDirector
Moez Ahamed JamalDirector
12Quarterly Report - March 2017
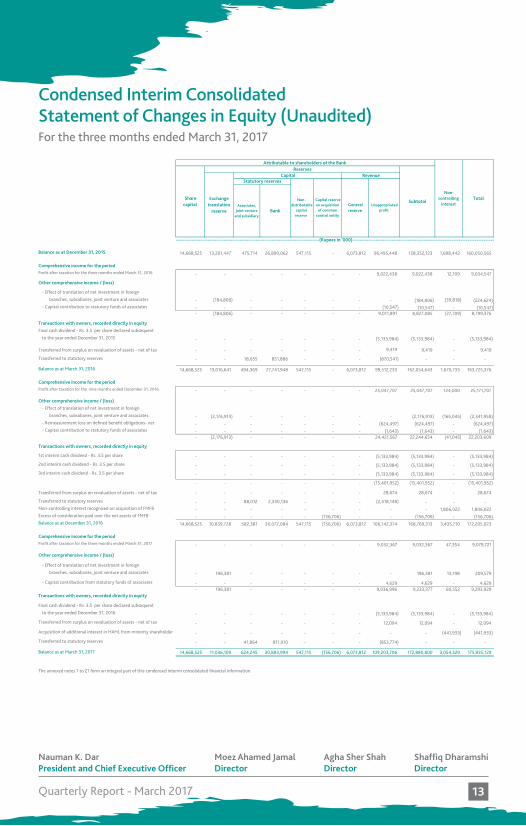
HABIB BANK LIMITEDCONDENSED INTERIM CONSOLIDATED STATEMENT OF CHANGES IN EQUITY (UNAUDITED)FOR THE THREE MONTHS ENDED MARCH 31, 2017
Associates, Joint venture
and subsidiaryBank
Balance as at December 31, 2015 14,668,525 13,201,447 475,714 26,890,062 547,115 - 6,073,812 96,495,448 158,352,123 1,698,442 160,050,565
Comprehensive income for the periodProfit after taxation for the three months ended March 31, 2016 - - - - - - - 9,022,438 9,022,438 12,109 9,034,547
Other comprehensive income / (loss)
- Effect of translation of net investment in foreign
branches, subsidiaries, joint venture and associates - (184,806) - - - - - - (184,806) (39,818) (224,624) - Capital contribution to statutory funds of associates - - - - - - - (10,547) (10,547) - (10,547)
- (184,806) - - - - - 9,011,891 8,827,085 (27,709) 8,799,376
Transactions with owners, recorded directly in equity
Final cash dividend - Rs. 3.5 per share declared subsequent
to the year ended December 31, 2015 - - - - - - - (5,133,984) (5,133,984) - (5,133,984)
Transferred from surplus on revaluation of assets - net of tax - - - - - - - 9,419 9,419 - 9,419
Transferred to statutory reserves - - 18,655 851,886 - - - (870,541) - - -
Balance as at March 31, 2016 14,668,525 13,016,641 494,369 27,741,948 547,115 - 6,073,812 99,512,233 162,054,643 1,670,733 163,725,376
Comprehensive income for the periodProfit after taxation for the nine months ended December 31, 2016 - - - - - - - 25,047,707 25,047,707 124,000 25,171,707
Other comprehensive income / (loss)
- Effect of translation of net investment in foreign
branches, subsidiaries, joint venture and associates - (2,176,913) - - - - - - (2,176,913) (165,045) (2,341,958) - Remeasurement loss on defined benefit obligations- net - - - - - - - (624,497) (624,497) - (624,497) - Capital contribution to statutory funds of associates - - - - - - - (1,643) (1,643) - (1,643)
- (2,176,913) - - - - - 24,421,567 22,244,654 (41,045) 22,203,609
Transactions with owners, recorded directly in equity
1st interim cash dividend - Rs. 3.5 per share - - - - - - - (5,133,984) (5,133,984) - (5,133,984)
2nd interim cash dividend - Rs. 3.5 per share - - - - - - - (5,133,984) (5,133,984) - (5,133,984)
3rd interim cash dividend - Rs. 3.5 per share - - - - - - - (5,133,984) (5,133,984) - (5,133,984)
- - - - - - - (15,401,952) (15,401,952) - (15,401,952)
Transferred from surplus on revaluation of assets - net of tax - - - - - - - 28,674 28,674 - 28,674
Transferred to statutory reserves - - 88,012 2,330,136 - - - (2,418,148) - - - Non-controlling interest recognised on acquisition of FMFB - - - - - - - - - 1,806,022 1,806,022 Excess of consideration paid over the net assets of FMFB - - - - - (156,706) - - (156,706) - (156,706) Balance as at December 31, 2016 14,668,525 10,839,728 582,381 30,072,084 547,115 (156,706) 6,073,812 106,142,374 168,769,313 3,435,710 172,205,023
Comprehensive income for the periodProfit after taxation for the three months ended March 31, 2017 - - - - - - - 9,032,367 9,032,367 47,354 9,079,721
Other comprehensive income / (loss)
- Effect of translation of net investment in foreign
branches, subsidiaries, joint venture and associates - 196,381 - - - - - - 196,381 13,198 209,579
- Capital contribution from statutory funds of associates - - - - - - - 4,629 4,629 - 4,629 - 196,381 - - - - - 9,036,996 9,233,377 60,552 9,293,929
Transactions with owners, recorded directly in equity
Final cash dividend - Rs. 3.5 per share declared subsequent
to the year ended December 31, 2016 - - - - - - - (5,133,984) (5,133,984) - (5,133,984)
Transferred from surplus on revaluation of assets - net of tax - - - - - - - 12,094 12,094 - 12,094
Acquisition of additional interest in HAHL from minority shareholder - - - - - - - - - (441,933) (441,933)
Transferred to statutory reserves - - 41,864 811,910 - - - (853,774) - - -
Balance as at March 31, 2017 14,668,525 11,036,109 624,245 30,883,994 547,115 (156,706) 6,073,812 109,203,706 172,880,800 3,054,329 175,935,129
The annexed notes 1 to 21 form an integral part of this condensed interim consolidated financial information.
President and Chief Executive Officer Director Director Director
Statutory reserves Capital
General reserve
Unappropriated profit
Capital reserve on acquisition
of common control entity
Subtotal
Reserves
Total
---------------------------------------------------------------------------------(Rupees in '000)--------------------------------------------------------------------------------
Attributable to shareholders of the Bank
Exchange translation
reserve
Revenue
Share capital
Non-controlling
interest Non -
distributablecapital
reserve
Condensed Interim Consolidated Statement of Changes in Equity (Unaudited)For the three months ended March 31, 2017
Nauman K. DarPresident and Chief Executive Officer
Agha Sher ShahDirector
Shaffiq DharamshiDirector
Moez Ahamed JamalDirector
13Quarterly Report - March 2017
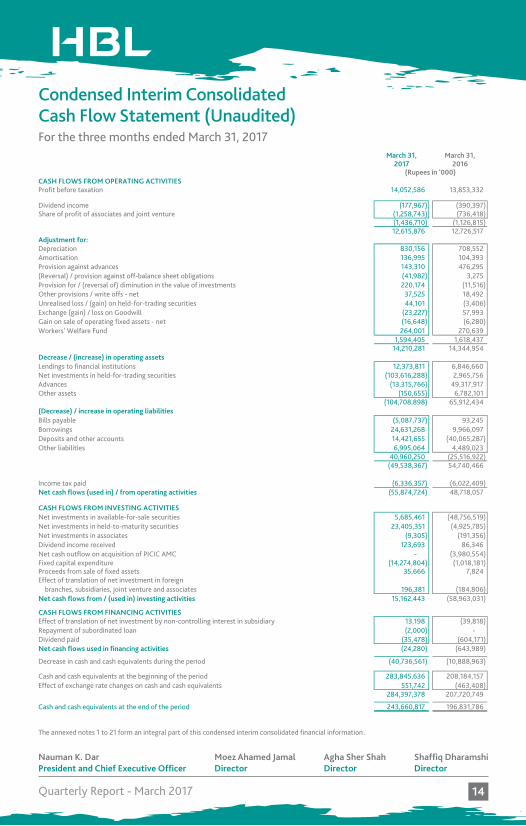
HABIB BANK LIMITEDCONDENSED INTERIM CONSOLIDATED CASH FLOW STATEMENT (UNAUDITED)FOR THE THREE MONTHS ENDED MARCH 31, 2017
March 31, March 31,2017 2016
CASH FLOWS FROM OPERATING ACTIVITIES Profit before taxation 14,052,586 13,853,332
Dividend income (177,967) (390,397) Share of profit of associates and joint venture (1,258,743) (736,418)
(1,436,710) (1,126,815) 12,615,876 12,726,517
Adjustment for:Depreciation 830,156 708,552 Amortisation 136,995 104,393 Provision against advances 143,310 476,295 (Reversal) / provision against off-balance sheet obligations (41,982) 3,275 Provision for / (reversal of) diminution in the value of investments 220,174 (11,516) Other provisions / write offs - net 37,525 18,492 Unrealised loss / (gain) on held-for-trading securities 44,101 (3,406) Exchange (gain) / loss on Goodwill (23,227) 57,993 Gain on sale of operating fixed assets - net (16,648) (6,280) Workers' Welfare Fund 264,001 270,639
1,594,405 1,618,437 14,210,281 14,344,954
Decrease / (increase) in operating assets Lendings to financial institutions 12,373,811 6,846,660 Net investments in held-for-trading securities (103,616,288) 2,965,756 Advances (13,315,766) 49,317,917 Other assets (150,655) 6,782,101
(104,708,898) 65,912,434 (Decrease) / increase in operating liabilitiesBills payable (5,087,737) 93,245 Borrowings 24,631,268 9,966,097 Deposits and other accounts 14,421,655 (40,065,287) Other liabilities 6,995,064 4,489,023
40,960,250 (25,516,922) (49,538,367) 54,740,466
Income tax paid (6,336,357) (6,022,409) Net cash flows (used in) / from operating activities (55,874,724) 48,718,057
CASH FLOWS FROM INVESTING ACTIVITIES Net investments in available-for-sale securities 5,685,461 (48,756,519) Net investments in held-to-maturity securities 23,405,351 (4,925,785) Net investments in associates (9,305) (191,356) Dividend income received 123,693 86,346 Net cash outflow on acquisition of PICIC AMC - (3,980,554) Fixed capital expenditure (14,274,804) (1,018,181) Proceeds from sale of fixed assets 35,666 7,824 Effect of translation of net investment in foreign branches, subsidiaries, joint venture and associates 196,381 (184,806) Net cash flows from / (used in) investing activities 15,162,443 (58,963,031)
CASH FLOWS FROM FINANCING ACTIVITIESEffect of translation of net investment by non-controlling interest in subsidiary 13,198 (39,818) Repayment of subordinated loan (2,000) - Dividend paid (35,478) (604,171) Net cash flows used in financing activities (24,280) (643,989)
Decrease in cash and cash equivalents during the period (40,736,561) (10,888,963)
Cash and cash equivalents at the beginning of the period 283,845,636 208,184,157 Effect of exchange rate changes on cash and cash equivalents 551,742 (463,408)
284,397,378 207,720,749
Cash and cash equivalents at the end of the period 243,660,817 196,831,786
The annexed notes 1 to 21 form an integral part of this condensed interim consolidated financial information.
President and Chief Executive Officer Direct or Director
(Rupees in '000)
Director
Condensed Interim Consolidated Cash Flow Statement (Unaudited)For the three months ended March 31, 2017
Nauman K. DarPresident and Chief Executive Officer
Agha Sher ShahDirector
Shaffiq DharamshiDirector
Moez Ahamed JamalDirector
14Quarterly Report - March 2017
HABIB BANK LIMITEDNOTES TO THE CONDENSED INTERIM CONSOLIDATED FINANCIAL INFORMATION (UNAUDITED)FOR THE THREE MONTHS ENDED MARCH 31, 2017
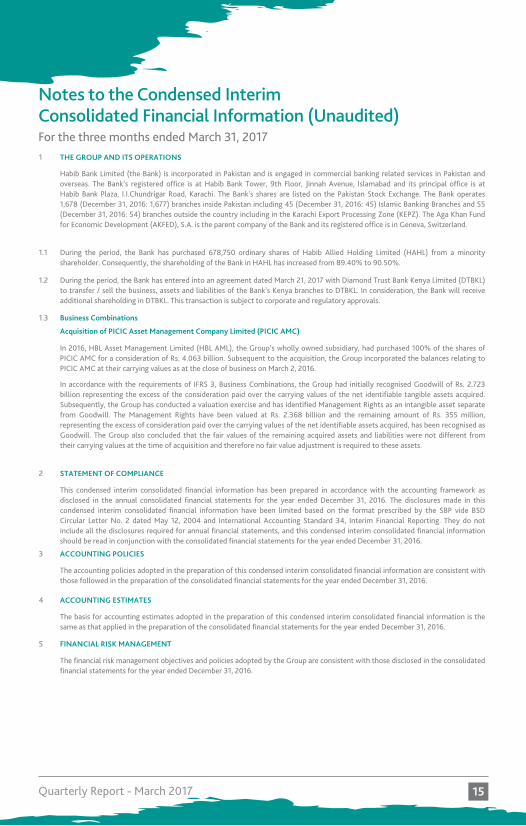
1 THE GROUP AND ITS OPERATIONS
1.1
1.2
1.3
2 STATEMENT OF COMPLIANCE
3 ACCOUNTING POLICIES
4 ACCOUNTING ESTIMATES
5 FINANCIAL RISK MANAGEMENT
The accounting policies adopted in the preparation of this condensed interim consolidated financial information are consistent withthose followed in the preparation of the consolidated financial statements for the year ended December 31, 2016.
Business Combinations
Acquisition of PICIC Asset Management Company Limited (PICIC AMC)
Habib Bank Limited (the Bank) is incorporated in Pakistan and is engaged in commercial banking related services in Pakistan andoverseas. The Bank’s registered office is at Habib Bank Tower, 9th Floor, Jinnah Avenue, Islamabad and its principal office is atHabib Bank Plaza, I.I.Chundrigar Road, Karachi. The Bank's shares are listed on the Pakistan Stock Exchange. The Bank operates1,678 (December 31, 2016: 1,677) branches inside Pakistan including 45 (December 31, 2016: 45) Islamic Banking Branches and 55(December 31, 2016: 54) branches outside the country including in the Karachi Export Processing Zone (KEPZ). The Aga Khan Fundfor Economic Development (AKFED), S.A. is the parent company of the Bank and its registered office is in Geneva, Switzerland.
In 2016, HBL Asset Management Limited (HBL AML), the Group’s wholly owned subsidiary, had purchased 100% of the shares ofPICIC AMC for a consideration of Rs. 4.063 billion. Subsequent to the acquisition, the Group incorporated the balances relating toPICIC AMC at their carrying values as at the close of business on March 2, 2016.
In accordance with the requirements of IFRS 3, Business Combinations, the Group had initially recognised Goodwill of Rs. 2.723billion representing the excess of the consideration paid over the carrying values of the net identifiable tangible assets acquired.Subsequently, the Group has conducted a valuation exercise and has identified Management Rights as an intangible asset separatefrom Goodwill. The Management Rights have been valued at Rs. 2.368 billion and the remaining amount of Rs. 355 million,representing the excess of consideration paid over the carrying values of the net identifiable assets acquired, has been recognised asGoodwill. The Group also concluded that the fair values of the remaining acquired assets and liabilities were not different fromtheir carrying values at the time of acquisition and therefore no fair value adjustment is required to these assets.
This condensed interim consolidated financial information has been prepared in accordance with the accounting framework asdisclosed in the annual consolidated financial statements for the year ended December 31, 2016. The disclosures made in thiscondensed interim consolidated financial information have been limited based on the format prescribed by the SBP vide BSDCircular Letter No. 2 dated May 12, 2004 and International Accounting Standard 34, Interim Financial Reporting. They do notinclude all the disclosures required for annual financial statements, and this condensed interim consolidated financial informationshould be read in conjunction with the consolidated financial statements for the year ended December 31, 2016.
During the period, the Bank has purchased 678,750 ordinary shares of Habib Allied Holding Limited (HAHL) from a minorityshareholder. Consequently, the shareholding of the Bank in HAHL has increased from 89.40% to 90.50%.
During the period, the Bank has entered into an agreement dated March 21, 2017 with Diamond Trust Bank Kenya Limited (DTBKL)to transfer / sell the business, assets and liabilities of the Bank's Kenya branches to DTBKL. In consideration, the Bank will receiveadditional shareholding in DTBKL. This transaction is subject to corporate and regulatory approvals.
The basis for accounting estimates adopted in the preparation of this condensed interim consolidated financial information is thesame as that applied in the preparation of the consolidated financial statements for the year ended December 31, 2016.
The financial risk management objectives and policies adopted by the Group are consistent with those disclosed in the consolidatedfinancial statements for the year ended December 31, 2016.
Notes to the Condensed InterimConsolidated Financial Information (Unaudited)For the three months ended March 31, 2017
15Quarterly Report - March 2017
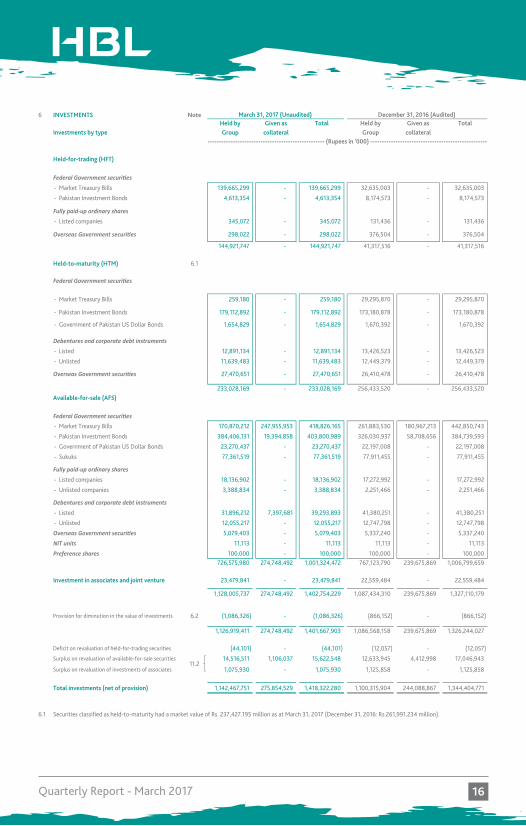
6 INVESTMENTS NoteHeld by Given as Total Held by Given as Total
Investments by type Group collateral Group collateral
Held-for-trading (HFT)
Federal Government securi�es- Market Treasury Bills 139,665,299 - 139,665,299 32,635,003 - 32,635,003
- Pakistan Investment Bonds 4,613,354 - 4,613,354 8,174,573 - 8,174,573
Fully paid-up ordinary shares- Listed companies 345,072 - 345,072 131,436 - 131,436
Overseas Government securi�es 298,022 - 298,022 376,504 - 376,504
144,921,747 - 144,921,747 41,317,516 - 41,317,516
Held-to-maturity (HTM) 6.1
Federal Government securi�es
- Market Treasury Bills 259,180 - 259,180 29,295,870 - 29,295,870
- Pakistan Investment Bonds 179,112,892 - 179,112,892 173,180,878 - 173,180,878
- Government of Pakistan US Dollar Bonds 1,654,829 - 1,654,829 1,670,392 - 1,670,392
Debentures and corporate debt instruments - Listed 12,891,134 - 12,891,134 13,426,523 - 13,426,523
- Unlisted 11,639,483 - 11,639,483 12,449,379 - 12,449,379
Overseas Government securi�es 27,470,651 - 27,470,651 26,410,478 - 26,410,478
233,028,169 - 233,028,169 256,433,520 - 256,433,520 Available-for-sale (AFS)
Federal Government securi�es- Market Treasury Bills 170,870,212 247,955,953 418,826,165 261,883,530 180,967,213 442,850,743
- Pakistan Investment Bonds 384,406,131 19,394,858 403,800,989 326,030,937 58,708,656 384,739,593
- Government of Pakistan US Dollar Bonds 23,270,437 - 23,270,437 22,197,008 - 22,197,008
- Sukuks 77,361,519 - 77,361,519 77,911,455 - 77,911,455
Fully paid-up ordinary shares- Listed companies 18,136,902 - 18,136,902 17,272,992 - 17,272,992
- Unlisted companies 3,388,834 - 3,388,834 2,251,466 - 2,251,466
Debentures and corporate debt instruments - Listed 31,896,212 7,397,681 39,293,893 41,380,251 - 41,380,251
- Unlisted 12,055,217 - 12,055,217 12,747,798 - 12,747,798
Overseas Government securi�es 5,079,403 - 5,079,403 5,337,240 - 5,337,240
NIT units 11,113 - 11,113 11,113 - 11,113
Preference shares 100,000 - 100,000 100,000 - 100,000 726,575,980 274,748,492 1,001,324,472 767,123,790 239,675,869 1,006,799,659
Investment in associates and joint venture 23,479,841 - 23,479,841 22,559,484 - 22,559,484
1,128,005,737 274,748,492 1,402,754,229 1,087,434,310 239,675,869 1,327,110,179
Provision for diminution in the value of investments 6.2 (1,086,326) - (1,086,326) (866,152) - (866,152)
1,126,919,411 274,748,492 1,401,667,903 1,086,568,158 239,675,869 1,326,244,027
Deficit on revaluation of held-for-trading securities (44,101) - (44,101) (12,057) - (12,057)
Surplus on revaluation of available-for-sale securities 14,516,511 1,106,037 15,622,548 12,633,945 4,412,998 17,046,943 Surplus on revaluation of investments of associates 1,075,930 - 1,075,930 1,125,858 - 1,125,858
Total investments (net of provision) 1,142,467,751 275,854,529 1,418,322,280 1,100,315,904 244,088,867 1,344,404,771
6.1
--------------------------------------------------- (Rupees in '000) ---------------------------------------------------
Securities classified as held-to-maturity had a market value of Rs. 237,427.195 million as at March 31, 2017 (December 31, 2016: Rs.261,991.234 million).
December 31, 2016 (Audited)March 31, 2017 (Unaudited)
11.2
16Quarterly Report - March 2017
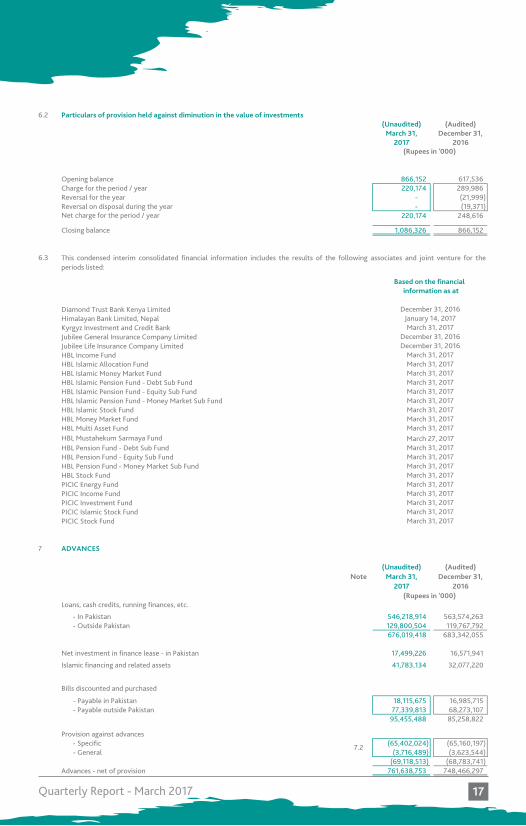
6.2 Particulars of provision held against diminution in the value of investments(Unaudited) (Audited)
March 31, December 31,2017 2016
Opening balance 866,152 617,536 Charge for the period / year 220,174 289,986 Reversal for the year - (21,999) Reversal on disposal during the year - (19,371) Net charge for the period / year 220,174 248,616
Closing balance 1,086,326 866,152
6.3
Diamond Trust Bank Kenya LimitedHimalayan Bank Limited, NepalKyrgyz Investment and Credit Bank Jubilee General Insurance Company LimitedJubilee Life Insurance Company LimitedHBL Income FundHBL Islamic Allocation FundHBL Islamic Money Market FundHBL Islamic Pension Fund - Debt Sub FundHBL Islamic Pension Fund - Equity Sub FundHBL Islamic Pension Fund - Money Market Sub FundHBL Islamic Stock FundHBL Money Market FundHBL Multi Asset FundHBL Mustahekum Sarmaya FundHBL Pension Fund - Debt Sub FundHBL Pension Fund - Equity Sub FundHBL Pension Fund - Money Market Sub FundHBL Stock FundPICIC Energy FundPICIC Income FundPICIC Investment FundPICIC Islamic Stock FundPICIC Stock Fund
7 ADVANCES
(Unaudited) (Audited)Note March 31, December 31,
2017 2016
Loans, cash credits, running finances, etc.
- In Pakistan 546,218,914 563,574,263 - Outside Pakistan 129,800,504 119,767,792
676,019,418 683,342,055
Net investment in finance lease - in Pakistan 17,499,226 16,571,941
Islamic financing and related assets 41,783,134 32,077,220
Bills discounted and purchased
- Payable in Pakistan 18,115,675 16,985,715 - Payable outside Pakistan 77,339,813 68,273,107
95,455,488 85,258,822
Provision against advances- Specific (65,402,024) (65,160,197) - General (3,716,489) (3,623,544)
(69,118,513) (68,783,741) Advances - net of provision 761,638,753 748,466,297
March 31, 2017March 31, 2017March 31, 2017March 31, 2017March 31, 2017
March 27, 2017March 31, 2017March 31, 2017March 31, 2017March 31, 2017
March 31, 2017March 31, 2017March 31, 2017March 31, 2017March 31, 2017
(Rupees in '000)
This condensed interim consolidated financial information includes the results of the following associates and joint venture for theperiods listed:
7.2
(Rupees in '000)
Based on the financial information as at
December 31, 2016January 14, 2017March 31, 2017
December 31, 2016December 31, 2016
March 31, 2017March 31, 2017March 31, 2017March 31, 2017
17Quarterly Report - March 2017
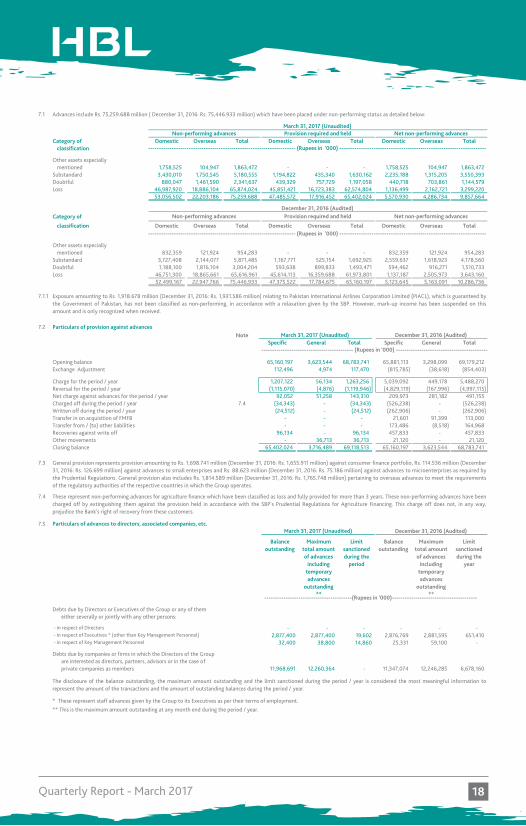
7.1 Advances include Rs. 75,259.688 million ( December 31, 2016: Rs. 75,446.933 million) which have been placed under non-performing status as detailed below:
Category of Domestic Overseas Total Domestic Overseas Total Domestic Overseas Totalclassification
Other assets especially mentioned 1,758,525 104,947 1,863,472 - - - 1,758,525 104,947 1,863,472
Substandard 3,430,010 1,750,545 5,180,555 1,194,822 435,340 1,630,162 2,235,188 1,315,205 3,550,393 Doubtful 880,047 1,461,590 2,341,637 439,329 757,729 1,197,058 440,718 703,861 1,144,579 Loss 46,987,920 18,886,104 65,874,024 45,851,421 16,723,383 62,574,804 1,136,499 2,162,721 3,299,220
53,056,502 22,203,186 75,259,688 47,485,572 17,916,452 65,402,024 5,570,930 4,286,734 9,857,664
Category of
classification Domestic Overseas Total Domestic Overseas Total Domestic Overseas Total
Other assets especially mentioned 832,359 121,924 954,283 - - - 832,359 121,924 954,283
Substandard 3,727,408 2,144,077 5,871,485 1,167,771 525,154 1,692,925 2,559,637 1,618,923 4,178,560 Doubtful 1,188,100 1,816,104 3,004,204 593,638 899,833 1,493,471 594,462 916,271 1,510,733 Loss 46,751,300 18,865,661 65,616,961 45,614,113 16,359,688 61,973,801 1,137,187 2,505,973 3,643,160
52,499,167 22,947,766 75,446,933 47,375,522 17,784,675 65,160,197 5,123,645 5,163,091 10,286,736
7.1.1
7.2 Particulars of provision against advancesNote
Specific General Total Specific General Total
Opening balance 65,160,197 3,623,544 68,783,741 65,881,113 3,298,099 69,179,212 Exchange Adjustment 112,496 4,974 117,470 (815,785) (38,618) (854,403)
Charge for the period / year 1,207,122 56,134 1,263,256 5,039,092 449,178 5,488,270 Reversal for the period / year (1,115,070) (4,876) (1,119,946) (4,829,119) (167,996) (4,997,115) Net charge against advances for the period / year 92,052 51,258 143,310 209,973 281,182 491,155 Charged off during the period / year 7.4 (34,343) - (34,343) (526,238) - (526,238) Written off during the period / year (24,512) - (24,512) (262,906) - (262,906) Transfer in on acquisition of FMFB - - - 21,601 91,399 113,000 Transfer from / (to) other liabilities - - - 173,486 (8,518) 164,968 Recoveries against write off 96,134 - 96,134 457,833 - 457,833 Other movements - 36,713 36,713 21,120 - 21,120 Closing balance 65,402,024 3,716,489 69,118,513 65,160,197 3,623,544 68,783,741
7.3
7.4
7.5 Particulars of advances to directors, associated companies, etc.
Balance outstanding
Maximum total amount of advances
including temporary advances
outstanding **
Limit sanctioned during the
period
Balance outstanding
Maximum total amount of advances
including temporary advances
outstanding **
Limit sanctioned during the
year
Debts due by Directors or Executives of the Group or any of them either severally or jointly with any other persons:
- in respect of Directors - - - - - - - in respect of Executives * (other than Key Management Personnel) 2,877,400 2,877,400 19,602 2,876,769 2,881,595 651,410 - in respect of Key Management Personnel 32,400 38,800 14,860 25,331 59,100 -
Debts due by companies or firms in which the Directors of the Group are interested as directors, partners, advisors or in the case ofprivate companies as members 11,968,691 12,260,364 - 11,347,074 12,246,285 6,678,160
* These represent staff advances given by the Group to its Executives as per their terms of employment.
** This is the maximum amount outstanding at any month end during the period / year.
March 31, 2017 (Unaudited)Non-performing advances Provision required and held Net non-performing advances
--------------------------------------------------------------------- (Rupees in '000) ---------------------------------------------------------------------
Exposure amounting to Rs. 1,918.678 million (December 31, 2016: Rs. 1,931.586 million) relating to Pakistan International Airlines Corporation Limited (PIACL), which is guaranteed bythe Government of Pakistan, has not been classified as non-performing, in accordance with a relaxation given by the SBP. However, mark-up income has been suspended on thisamount and is only recognized when received.
These represent non-performing advances for agriculture finance which have been classified as loss and fully provided for more than 3 years. These non-performing advances have beencharged off by extinguishing them against the provision held in accordance with the SBP's Prudential Regulations for Agriculture Financing. This charge off does not, in any way,prejudice the Bank's right of recovery from these customers.
December 31, 2016 (Audited)Non-performing advances Provision required and held Net non-performing advances
March 31, 2017 (Unaudited) December 31, 2016 (Audited)
------------------------------------------- (Rupees in '000) -------------------------------------------
General provision represents provision amounting to Rs. 1,698.741 million (December 31, 2016: Rs. 1,655.911 million) against consumer finance portfolio, Rs. 114.536 million (December31, 2016: Rs. 126.699 million) against advances to small enterprises and Rs. 88.623 million (December 31, 2016: Rs. 75.186 million) against advances to microenterprises as required bythe Prudential Regulations. General provision also includes Rs. 1,814.589 million (December 31, 2016: Rs. 1,765.748 million) pertaining to overseas advances to meet the requirementsof the regulatory authorities of the respective countries in which the Group operates.
The disclosure of the balance outstanding, the maximum amount outstanding and the limit sanctioned during the period / year is considered the most meaningful information torepresent the amount of the transactions and the amount of outstanding balances during the period / year.
March 31, 2017 (Unaudited) December 31, 2016 (Audited)
-----------------------------------------(Rupees in '000)----------------------------------------
--------------------------------------------------------------------- (Rupees in '000) ---------------------------------------------------------------------
18Quarterly Report - March 2017
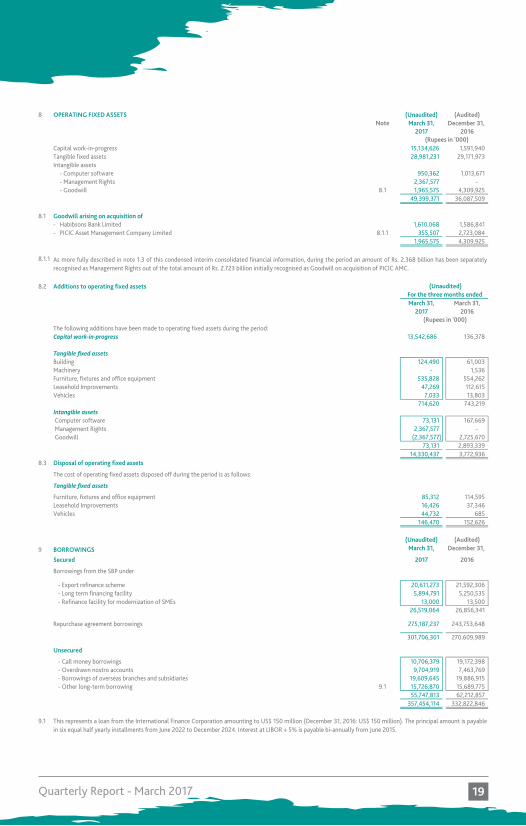
8 OPERATING FIXED ASSETS (Unaudited) (Audited)Note March 31, December 31,
2017 2016
Capital work-in-progress 15,134,626 1,591,940 Tangible fixed assets 28,981,231 29,171,973 Intangible assets
- Computer software 950,362 1,013,671 - Management Rights 2,367,577 - - Goodwill 8.1 1,965,575 4,309,925
49,399,371 36,087,509
8.1 Goodwill arising on acquisition of- Habibsons Bank Limited 1,610,068 1,586,841 - PICIC Asset Management Company Limited 8.1.1 355,507 2,723,084
1,965,575 4,309,925
8.1.1
8.2 Additions to operating fixed assets
March 31, March 31,2017 2016
The following additions have been made to operating fixed assets during the period:Capital work-in-progress 13,542,686 136,378
Tangible fixed assetsBuilding 124,490 61,003 Machinery - 1,536 Furniture, fixtures and office equipment 535,828 554,262 Leasehold Improvements 47,269 112,615 Vehicles 7,033 13,803
714,620 743,219 Intangible assets Computer software 73,131 167,669 Management Rights 2,367,577 - Goodwill (2,367,577) 2,725,670
73,131 2,893,339 14,330,437 3,772,936
8.3 Disposal of operating fixed assets
The cost of operating fixed assets disposed off during the period is as follows:
Tangible fixed assetsFurniture, fixtures and office equipment 85,312 114,595 Leasehold Improvements 16,426 37,346 Vehicles 44,732 685
146,470 152,626
(Unaudited) (Audited)
9 BORROWINGS March 31, December 31,
Secured 2017 2016
Borrowings from the SBP under
- Export refinance scheme 20,611,273 21,592,306 - Long term financing facility 5,894,791 5,250,535 - Refinance facility for modernization of SMEs 13,000 13,500
26,519,064 26,856,341
Repurchase agreement borrowings 275,187,237 243,753,648
301,706,301 270,609,989
Unsecured
- Call money borrowings 10,706,379 19,172,398 - Overdrawn nostro accounts 9,704,919 7,463,769 - Borrowings of overseas branches and subsidiaries 19,609,645 19,886,915 - Other long-term borrowing 9.1 15,726,870 15,689,775
55,747,813 62,212,857 357,454,114 332,822,846
9.1 This represents a loan from the International Finance Corporation amounting to US$ 150 million (December 31, 2016: US$ 150 million). The principal amount is payablein six equal half yearly installments from June 2022 to December 2024. Interest at LIBOR + 5% is payable bi-annually from June 2015.
(Rupees in '000)
For the three months ended
(Rupees in '000)
(Unaudited)
As more fully described in note 1.3 of this condensed interim consolidated financial information, during the period an amount of Rs. 2.368 billion has been separatelyrecognised as Management Rights out of the total amount of Rs. 2.723 billion initially recognised as Goodwill on acquisition of PICIC AMC.
19Quarterly Report - March 2017
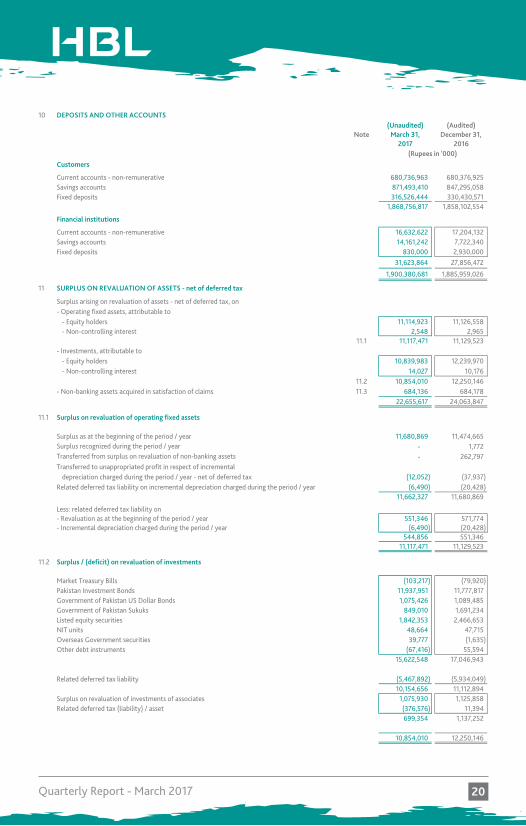
10 DEPOSITS AND OTHER ACCOUNTS(Unaudited) (Audited)
Note March 31, December 31,2017 2016
Customers
Current accounts - non-remunerative 680,736,963 680,376,925 Savings accounts 871,493,410 847,295,058 Fixed deposits 316,526,444 330,430,571
1,868,756,817 1,858,102,554
Financial institutions
Current accounts - non-remunerative 16,632,622 17,204,132 Savings accounts 14,161,242 7,722,340 Fixed deposits 830,000 2,930,000
31,623,864 27,856,472
1,900,380,681 1,885,959,026
11 SURPLUS ON REVALUATION OF ASSETS - net of deferred tax
Surplus arising on revaluation of assets - net of deferred tax, on- Operating fixed assets, attributable to
- Equity holders 11,114,923 11,126,558 - Non-controlling interest 2,548 2,965
11.1 11,117,471 11,129,523 - Investments, attributable to
- Equity holders 10,839,983 12,239,970 - Non-controlling interest 14,027 10,176
11.2 10,854,010 12,250,146 - Non-banking assets acquired in satisfaction of claims 11.3 684,136 684,178
22,655,617 24,063,847
11.1 Surplus on revaluation of operating fixed assets
Surplus as at the beginning of the period / year 11,680,869 11,474,665 - 1,772 - 262,797
Transferred to unappropriated profit in respect of incremental depreciation charged during the period / year - net of deferred tax (12,052) (37,937)
Related deferred tax liability on incremental depreciation charged during the period / year (6,490) (20,428) 11,662,327 11,680,869
Less: related deferred tax liability on- Revaluation as at the beginning of the period / year 551,346 571,774 - Incremental depreciation charged during the period / year (6,490) (20,428)
544,856 551,346 11,117,471 11,129,523
11.2 Surplus / (deficit) on revaluation of investments
Market Treasury Bills (103,217) (79,920) Pakistan Investment Bonds 11,937,951 11,777,817 Government of Pakistan US Dollar Bonds 1,075,426 1,089,485 Government of Pakistan Sukuks 849,010 1,691,234 Listed equity securities 1,842,353 2,466,653 NIT units 48,664 47,715 Overseas Government securities 39,777 (1,635) Other debt instruments (67,416) 55,594
15,622,548 17,046,943
Related deferred tax liability (5,467,892) (5,934,049) 10,154,656 11,112,894
Surplus on revaluation of investments of associates 1,075,930 1,125,858 Related deferred tax (liability) / asset (376,576) 11,394
699,354 1,137,252
10,854,010 12,250,146
Transferred from surplus on revaluation of non-banking assets
(Rupees in '000)
Surplus recognized during the period / year
20Quarterly Report - March 2017
(Unaudited) (Audited)March 31, December 31,
2017 2016
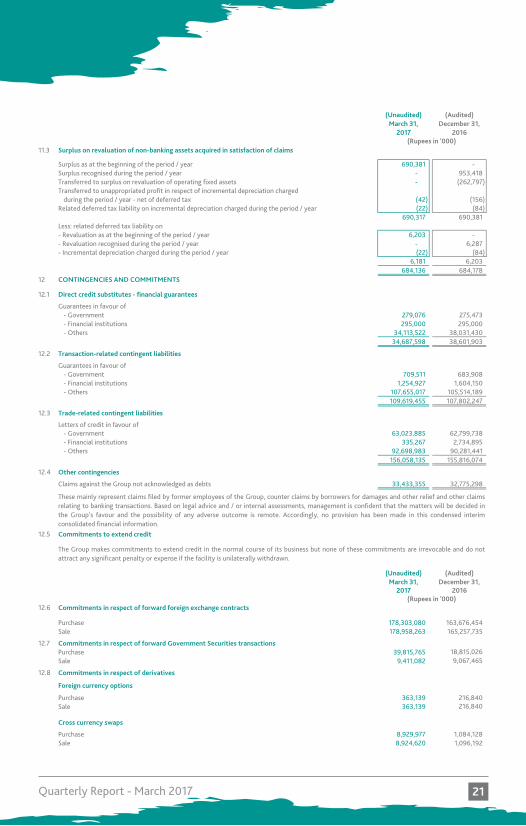
11.3 Surplus on revaluation of non-banking assets acquired in satisfaction of claims
Surplus as at the beginning of the period / year 690,381 - Surplus recognised during the period / year - 953,418 Transferred to surplus on revaluation of operating fixed assets - (262,797) Transferred to unappropriated profit in respect of incremental depreciation charged
during the period / year - net of deferred tax (42) (156) Related deferred tax liability on incremental depreciation charged during the period / year (22) (84)
690,317 690,381 Less: related deferred tax liability on- Revaluation as at the beginning of the period / year 6,203 - - Revaluation recognised during the period / year - 6,287 - Incremental depreciation charged during the period / year (22) (84)
6,181 6,203 684,136 684,178
12 CONTINGENCIES AND COMMITMENTS
12.1 Direct credit substitutes - financial guarantees
Guarantees in favour of- Government 279,076 275,473 - Financial institutions 295,000 295,000 - Others 34,113,522 38,031,430
34,687,598 38,601,903
12.2 Transaction-related contingent liabilities
Guarantees in favour of- Government 709,511 683,908 - Financial institutions 1,254,927 1,604,150 - Others 107,655,017 105,514,189
109,619,455 107,802,247
12.3 Trade-related contingent liabilities
Letters of credit in favour of- Government 63,023,885 62,799,738 - Financial institutions 335,267 2,734,895 - Others 92,698,983 90,281,441
156,058,135 155,816,074
12.4 Other contingencies
Claims against the Group not acknowledged as debts 33,433,355 32,775,298
12.5 Commitments to extend credit
(Unaudited) (Audited)March 31, December 31,
2017 2016
12.6 Commitments in respect of forward foreign exchange contracts
Purchase 178,303,080 163,676,454 Sale 178,958,263 165,257,735
12.7 Commitments in respect of forward Government Securities transactionsPurchase 39,815,765 18,815,026 Sale 9,411,082 9,067,465
12.8 Commitments in respect of derivatives
Foreign currency options
Purchase 363,139 216,840 Sale 363,139 216,840
Cross currency swaps
Purchase 8,929,977 1,084,128 Sale 8,924,620 1,096,192
(Rupees in '000)
(Rupees in '000)
The Group makes commitments to extend credit in the normal course of its business but none of these commitments are irrevocable and do notattract any significant penalty or expense if the facility is unilaterally withdrawn.
These mainly represent claims filed by former employees of the Group, counter claims by borrowers for damages and other relief and other claimsrelating to banking transactions. Based on legal advice and / or internal assessments, management is confident that the matters will be decided inthe Group’s favour and the possibility of any adverse outcome is remote. Accordingly, no provision has been made in this condensed interimconsolidated financial information.
21Quarterly Report - March 2017
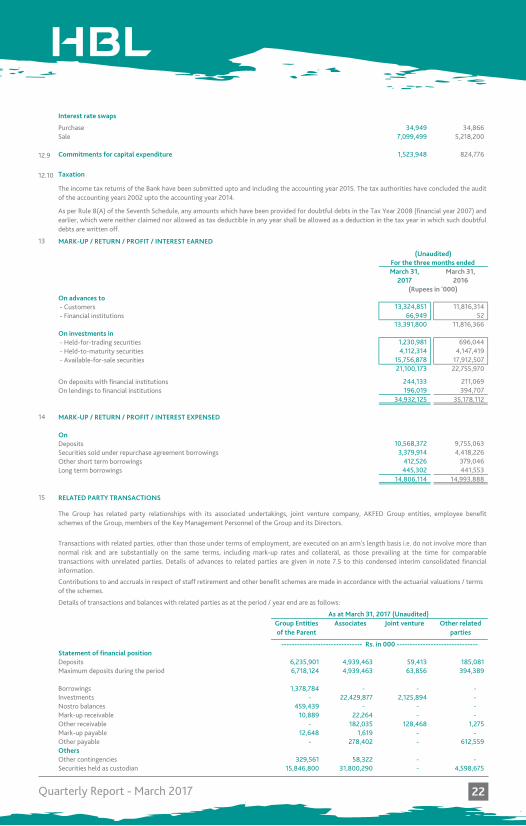
Interest rate swaps
Purchase 34,949 34,866 Sale 7,099,499 5,218,200
12.9 Commitments for capital expenditure 1,523,948 824,776
12.10 Taxation
13 MARK-UP / RETURN / PROFIT / INTEREST EARNED
March 31, March 31,2017 2016
On advances to - Customers 13,324,851 11,816,314 - Financial institutions 66,949 52
13,391,800 11,816,366 On investments in - Held-for-trading securities 1,230,981 696,044 - Held-to-maturity securities 4,112,314 4,147,419 - Available-for-sale securities 15,756,878 17,912,507
21,100,173 22,755,970
On deposits with financial institutions 244,133 211,069 On lendings to financial institutions 196,019 394,707
34,932,125 35,178,112
14 MARK-UP / RETURN / PROFIT / INTEREST EXPENSED
OnDeposits 10,568,372 9,755,063 Securities sold under repurchase agreement borrowings 3,379,914 4,418,226 Other short term borrowings 412,526 379,046 Long term borrowings 445,302 441,553
14,806,114 14,993,888
15 RELATED PARTY TRANSACTIONS
Group Entities of the Parent
Associates Joint venture Other related parties
Statement of financial positionDeposits 6,235,901 4,939,463 59,413 185,081 Maximum deposits during the period 6,718,124 4,939,463 63,856 394,389
Borrowings 1,378,784 - - - Investments - 22,429,877 2,125,894 - Nostro balances 459,439 - - - Mark-up receivable 10,889 22,264 - - Other receivable - 182,035 128,468 1,275 Mark-up payable 12,648 1,619 - - Other payable - 278,402 - 612,559 OthersOther contingencies 329,561 58,322 - - Securities held as custodian 15,846,800 31,800,290 - 4,598,675
(Unaudited)
(Rupees in '000)
Details of transactions and balances with related parties as at the period / year end are as follows:
As at March 31, 2017 (Unaudited)
------------------------------- Rs. in 000 -------------------------------
The income tax returns of the Bank have been submitted upto and including the accounting year 2015. The tax authorities have concluded the auditof the accounting years 2002 upto the accounting year 2014.
As per Rule 8(A) of the Seventh Schedule, any amounts which have been provided for doubtful debts in the Tax Year 2008 (financial year 2007) andearlier, which were neither claimed nor allowed as tax deductible in any year shall be allowed as a deduction in the tax year in which such doubtfuldebts are written off.
For the three months ended
The Group has related party relationships with its associated undertakings, joint venture company, AKFED Group entities, employee benefitschemes of the Group, members of the Key Management Personnel of the Group and its Directors.
Transactions with related parties, other than those under terms of employment, are executed on an arm's length basis i.e. do not involve more thannormal risk and are substantially on the same terms, including mark-up rates and collateral, as those prevailing at the time for comparabletransactions with unrelated parties. Details of advances to related parties are given in note 7.5 to this condensed interim consolidated financialinformation.
Contributions to and accruals in respect of staff retirement and other benefit schemes are made in accordance with the actuarial valuations / terms of the schemes.
22Quarterly Report - March 2017
Group Entities of the Parent
Associates Joint venture Other related parties
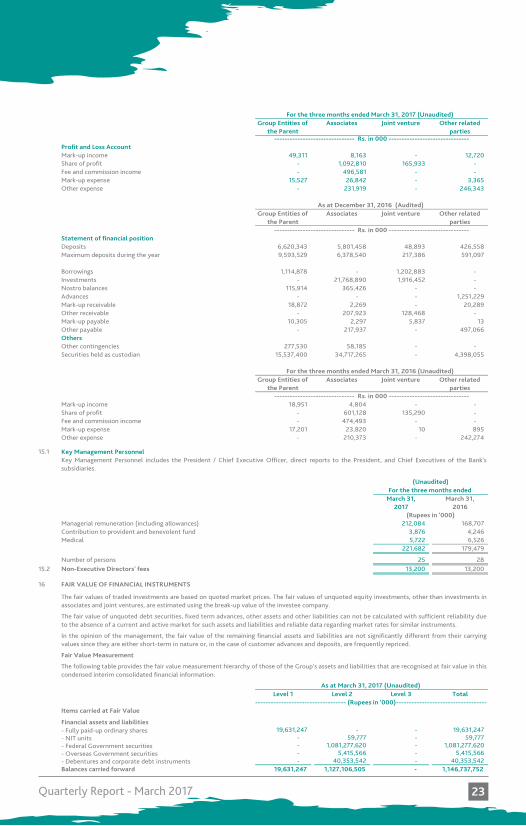
Profit and Loss AccountMark-up income 49,311 8,163 - 12,720 Share of profit - 1,092,810 165,933 - Fee and commission income - 496,581 - - Mark-up expense 15,527 26,842 - 3,365 Other expense - 231,919 - 246,343
Group Entities of the Parent
Associates Joint venture Other related parties
Statement of financial positionDeposits 6,620,343 5,801,458 48,893 426,558 Maximum deposits during the year 9,593,529 6,378,540 217,386 591,097
Borrowings 1,114,878 - 1,202,883 - Investments - 21,768,890 1,916,452 - Nostro balances 115,914 365,426 - - Advances - - - 1,251,229 Mark-up receivable 18,872 2,269 - 20,289 Other receivable - 207,923 128,468 - Mark-up payable 10,305 2,297 5,837 13 Other payable - 217,937 - 497,066 OthersOther contingencies 277,530 58,185 - - Securities held as custodian 15,537,400 34,717,265 - 4,398,055
Group Entities of the Parent
Associates Joint venture Other related parties
Mark-up income 18,951 4,804 - - Share of profit - 601,128 135,290 - Fee and commission income - 474,493 - - Mark-up expense 17,201 23,820 10 895 Other expense - 210,373 - 242,274
15.1 Key Management Personnel
March 31, March 31,2017 2016
Managerial remuneration (including allowances) 212,084 168,707 Contribution to provident and benevolent fund 3,876 4,246 Medical 5,722 6,526
221,682 179,479
Number of persons 25 28 15.2 Non-Executive Directors' fees 13,200 13,200
16 FAIR VALUE OF FINANCIAL INSTRUMENTS
Fair Value Measurement
Level 1 Level 2 Level 3 Total
Items carried at Fair Value
Financial assets and liabilities- Fully paid-up ordinary shares 19,631,247 - - 19,631,247 - NIT units - 59,777 - 59,777 - Federal Government securities - 1,081,277,620 - 1,081,277,620 - Overseas Government securities - 5,415,566 - 5,415,566 - Debentures and corporate debt instruments - 40,353,542 - 40,353,542 Balances carried forward 19,631,247 1,127,106,505 - 1,146,737,752
For the three months ended
------------------------------- Rs. in 000 -------------------------------
The fair values of traded investments are based on quoted market prices. The fair values of unquoted equity investments, other than investments inassociates and joint ventures, are estimated using the break-up value of the investee company.
The fair value of unquoted debt securities, fixed term advances, other assets and other liabilities can not be calculated with sufficient reliability dueto the absence of a current and active market for such assets and liabilities and reliable data regarding market rates for similar instruments.
In the opinion of the management, the fair value of the remaining financial assets and liabilities are not significantly different from their carryingvalues since they are either short-term in nature or, in the case of customer advances and deposits, are frequently repriced.
(Rupees in '000)
(Unaudited)
Key Management Personnel includes the President / Chief Executive Officer, direct reports to the President, and Chief Executives of the Bank'ssubsidiaries.
------------------------------- Rs. in 000 -------------------------------
For the three months ended March 31, 2017 (Unaudited)
For the three months ended March 31, 2016 (Unaudited)
------------------------------- Rs. in 000 -------------------------------
As at December 31, 2016 (Audited)
The following table provides the fair value measurement hierarchy of those of the Group’s assets and liabilities that are recognised at fair value in thiscondensed interim consolidated financial information:
As at March 31, 2017 (Unaudited)
----------------------------------- (Rupees in '000)-----------------------------------
23Quarterly Report - March 2017
Level 1 Level 2 Level 3 Total
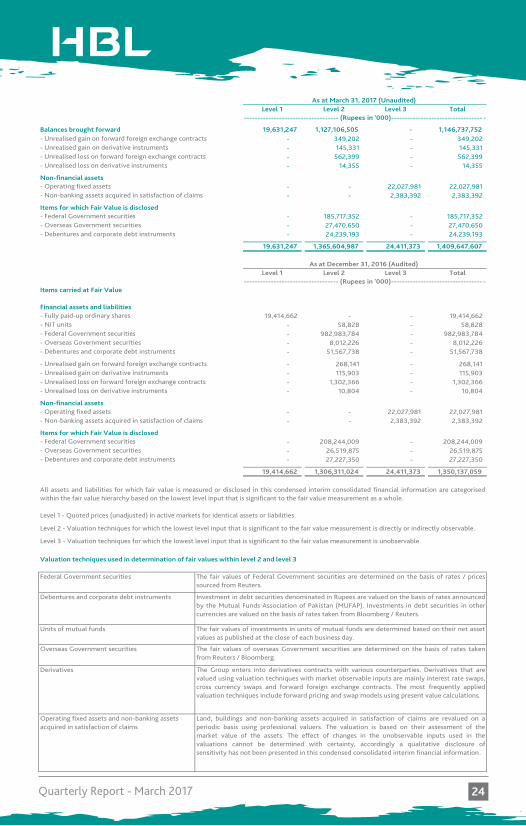
Balances brought forward 19,631,247 1,127,106,505 - 1,146,737,752 - Unrealised gain on forward foreign exchange contracts - 349,202 - 349,202 - Unrealised gain on derivative instruments - 145,331 - 145,331 - Unrealised loss on forward foreign exchange contracts - 562,399 - 562,399 - Unrealised loss on derivative instruments - 14,355 - 14,355
Non-financial assets- Operating fixed assets - - 22,027,981 22,027,981 - Non-banking assets acquired in satisfaction of claims - - 2,383,392 2,383,392
Items for which Fair Value is disclosed- Federal Government securities - 185,717,352 - 185,717,352 - Overseas Government securities - 27,470,650 - 27,470,650 - Debentures and corporate debt instruments - 24,239,193 - 24,239,193
19,631,247 1,365,604,987 24,411,373 1,409,647,607
Level 1 Level 2 Level 3 Total
Items carried at Fair Value
Financial assets and liabilities- Fully paid-up ordinary shares 19,414,662 - - 19,414,662 - NIT units - 58,828 - 58,828 - Federal Government securities - 982,983,784 - 982,983,784 - Overseas Government securities - 8,012,226 - 8,012,226 - Debentures and corporate debt instruments - 51,567,738 - 51,567,738
- Unrealised gain on forward foreign exchange contracts - 268,141 - 268,141 - Unrealised gain on derivative instruments - 115,903 - 115,903 - Unrealised loss on forward foreign exchange contracts - 1,302,366 - 1,302,366 - Unrealised loss on derivative instruments - 10,804 - 10,804
Non-financial assets- Operating fixed assets - - 22,027,981 22,027,981 - Non-banking assets acquired in satisfaction of claims - - 2,383,392 2,383,392
Items for which Fair Value is disclosed- Federal Government securities - 208,244,009 - 208,244,009 - Overseas Government securities - 26,519,875 - 26,519,875 - Debentures and corporate debt instruments - 27,227,350 - 27,227,350
19,414,662 1,306,311,024 24,411,373 1,350,137,059
Level 2 - Valuation techniques for which the lowest level input that is significant to the fair value measurement is directly or indirectly observable.
Level 3 - Valuation techniques for which the lowest level input that is significant to the fair value measurement is unobservable.
Valuation techniques used in determination of fair values within level 2 and level 3
The fair values of overseas Government securities are determined on the basis of rates takenfrom Reuters / Bloomberg.
Overseas Government securities
Operating fixed assets and non-banking assets acquired in satisfaction of claims
Land, buildings and non-banking assets acquired in satisfaction of claims are revalued on aperiodic basis using professional valuers. The valuation is based on their assessment of themarket value of the assets. The effect of changes in the unobservable inputs used in thevaluations cannot be determined with certainty, accordingly a qualitative disclosure ofsensitivity has not been presented in this condensed consolidated interim financial information.
As at March 31, 2017 (Unaudited)
----------------------------------- (Rupees in '000)---------------------------------- -
The Group enters into derivatives contracts with various counterparties. Derivatives that arevalued using valuation techniques with market observable inputs are mainly interest rate swaps,cross currency swaps and forward foreign exchange contracts. The most frequently appliedvaluation techniques include forward pricing and swap models using present value calculations.
Derivatives
The fair values of Federal Government securities are determined on the basis of rates / pricessourced from Reuters.
Federal Government securities
As at December 31, 2016 (Audited)
----------------------------------- (Rupees in '000)---------------------------------- -
All assets and liabilities for which fair value is measured or disclosed in this condensed interim consolidated financial information are categorisedwithin the fair value hierarchy based on the lowest level input that is significant to the fair value measurement as a whole.
Level 1 - Quoted prices (unadjusted) in active markets for identical assets or liabilities.
Units of mutual funds The fair values of investments in units of mutual funds are determined based on their net assetvalues as published at the close of each business day.
Investment in debt securities denominated in Rupees are valued on the basis of rates announcedby the Mutual Funds Association of Pakistan (MUFAP). Investments in debt securities in othercurrencies are valued on the basis of rates taken from Bloomberg / Reuters.
Debentures and corporate debt instruments
24Quarterly Report - March 2017
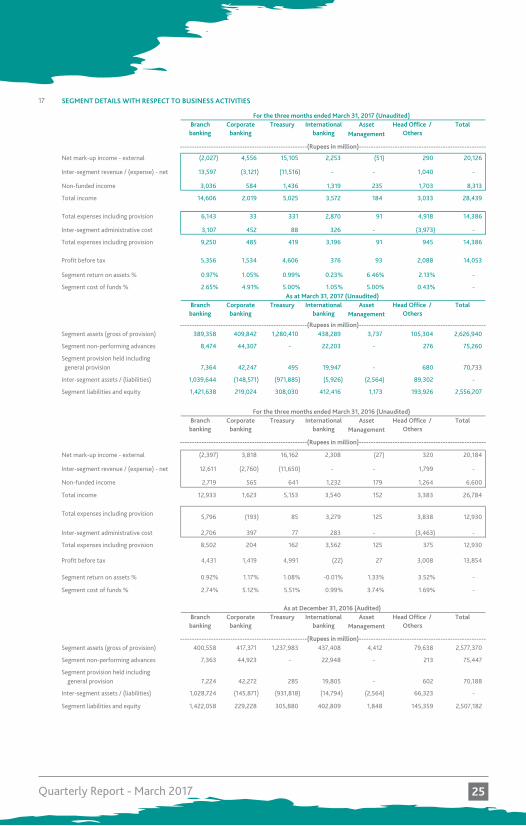
17 SEGMENT DETAILS WITH RESPECT TO BUSINESS ACTIVITIES
AssetManagement
Net mark-up income - external (2,027) 4,556 15,105 2,253 (51) 290 20,126
Inter-segment revenue / (expense) - net 13,597 (3,121) (11,516) - - 1,040 -
Non-funded income 3,036 584 1,436 1,319 235 1,703 8,313
Total income 14,606 2,019 5,025 3,572 184 3,033 28,439
6,143 33 331 2,870 91 4,918 14,386
Inter-segment administrative cost 3,107 452 88 326 - (3,973) -
Total expenses including provision 9,250 485 419 3,196 91 945 14,386
Profit before tax 5,356 1,534 4,606 376 93 2,088 14,053
Segment return on assets % 0.97% 1.05% 0.99% 0.23% 6.46% 2.13% -
Segment cost of funds % 2.65% 4.91% 5.00% 1.05% 5.00% 0.43% -
AssetManagement
Segment assets (gross of provision) 389,358 409,842 1,280,410 438,289 3,737 105,304 2,626,940
Segment non-performing advances 8,474 44,307 - 22,203 - 276 75,260
Segment provision held including general provision 7,364 42,247 495 19,947 - 680 70,733
Inter-segment assets / (liabilities) 1,039,644 (148,571) (971,885) (5,926) (2,564) 89,302 -
Segment liabilities and equity 1,421,638 219,024 308,030 412,416 1,173 193,926 2,556,207
AssetManagement
Net mark-up income - external (2,397) 3,818 16,162 2,308 (27) 320 20,184
Inter-segment revenue / (expense) - net 12,611 (2,760) (11,650) - - 1,799 -
Non-funded income 2,719 565 641 1,232 179 1,264 6,600
Total income 12,933 1,623 5,153 3,540 152 3,383 26,784
5,796 (193) 85 3,279 125 3,838 12,930
Inter-segment administrative cost 2,706 397 77 283 - (3,463) -
Total expenses including provision 8,502 204 162 3,562 125 375 12,930
Profit before tax 4,431 1,419 4,991 (22) 27 3,008 13,854
Segment return on assets % 0.92% 1.17% 1.08% -0.01% 1.33% 3.52% -
Segment cost of funds % 2.74% 5.12% 5.51% 0.99% 3.74% 1.69% -
AssetManagement
Segment assets (gross of provision) 400,558 417,371 1,237,983 437,408 4,412 79,638 2,577,370
Segment non-performing advances 7,363 44,923 - 22,948 - 213 75,447
Segment provision held including general provision 7,224 42,272 285 19,805 - 602 70,188
Inter-segment assets / (liabilities) 1,028,724 (145,871) (931,818) (14,794) (2,564) 66,323 -
Segment liabilities and equity 1,422,058 229,228 305,880 402,809 1,848 145,359 2,507,182
As at March 31, 2017 (Unaudited)Branch banking
Corporate banking
Treasury International banking
Total expenses including provision
-----------------------------------------------------(Rupees in million)-----------------------------------------------------
Total expenses including provision
As at December 31, 2016 (Audited)Branch banking
Total
For the three months ended March 31, 2017 (Unaudited)Branch banking
Corporate banking
TotalHead Office / Others
Treasury International banking
Treasury International banking
Corporate banking
Head Office / Others
Head Office / Others
Total
International banking
Branch banking
Corporate banking
Head Office / Others
TotalFor the three months ended March 31, 2016 (Unaudited)
Treasury
-----------------------------------------------------(Rupees in million)-----------------------------------------------------
-----------------------------------------------------(Rupees in million)-----------------------------------------------------
-----------------------------------------------------(Rupees in million)-----------------------------------------------------
25Quarterly Report - March 2017
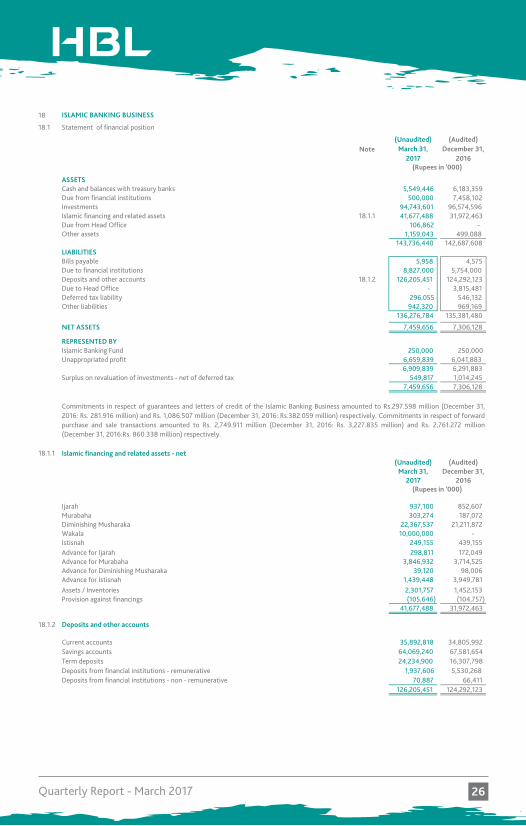
18 ISLAMIC BANKING BUSINESS
18.1 Statement of financial position
(Unaudited) (Audited)Note March 31, December 31,
2017 2016
ASSETSCash and balances with treasury banks 5,549,446 6,183,359 Due from financial institutions 500,000 7,458,102 Investments 94,743,601 96,574,596 Islamic financing and related assets 18.1.1 41,677,488 31,972,463 Due from Head Office 106,862 - Other assets 1,159,043 499,088
143,736,440 142,687,608 LIABILITIESBills payable 5,958 4,575 Due to financial institutions 8,827,000 5,754,000 Deposits and other accounts 18.1.2 126,205,451 124,292,123 Due to Head Office - 3,815,481 Deferred tax liability 296,055 546,132 Other liabilities 942,320 969,169
136,276,784 135,381,480
NET ASSETS 7,459,656 7,306,128
REPRESENTED BYIslamic Banking Fund 250,000 250,000 Unappropriated profit 6,659,839 6,041,883
6,909,839 6,291,883 Surplus on revaluation of investments - net of deferred tax 549,817 1,014,245
7,459,656 7,306,128
18.1.1 Islamic financing and related assets - net(Unaudited) (Audited)
March 31, December 31,2017 2016
Ijarah 937,100 852,607 Murabaha 303,274 187,072 Diminishing Musharaka 22,367,537 21,211,872 Wakala 10,000,000 - Istisnah 249,155 439,155 Advance for Ijarah 298,811 172,049 Advance for Murabaha 3,846,932 3,714,525 Advance for Diminishing Musharaka 39,120 98,006 Advance for Istisnah 1,439,448 3,949,781 Assets / Inventories 2,301,757 1,452,153 Provision against financings (105,646) (104,757)
41,677,488 31,972,463
18.1.2 Deposits and other accounts
Current accounts 35,892,818 34,805,992 Savings accounts 64,069,240 67,581,654 Term deposits 24,234,900 16,307,798 Deposits from financial institutions - remunerative 1,937,606 5,530,268 Deposits from financial institutions - non - remunerative 70,887 66,411
126,205,451 124,292,123
(Rupees in '000)
Commitments in respect of guarantees and letters of credit of the Islamic Banking Business amounted to Rs.297.598 million (December 31,2016: Rs. 281.916 million) and Rs. 1,086.507 million (December 31, 2016: Rs.382.059 million) respectively. Commitments in respect of forwardpurchase and sale transactions amounted to Rs. 2,749.911 million (December 31, 2016: Rs. 3,227.835 million) and Rs. 2,761.272 million(December 31, 2016:Rs. 860.338 million) respectively.
(Rupees in '000)
26Quarterly Report - March 2017
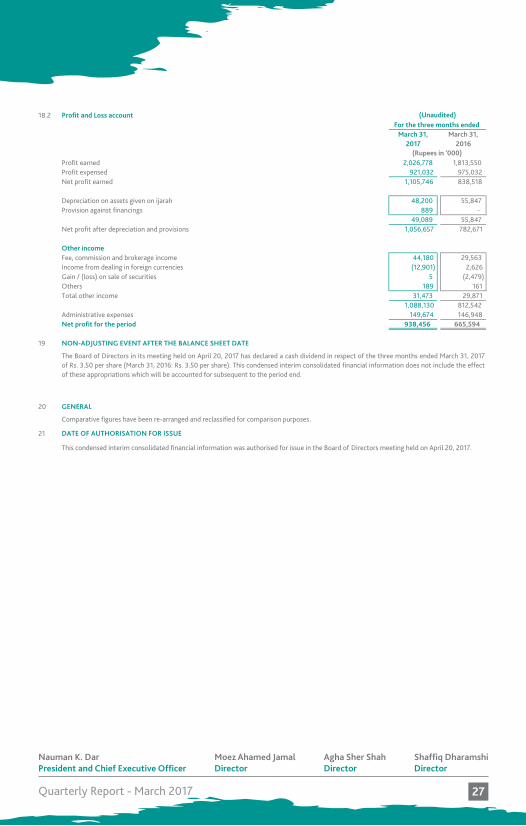
18.2 Profit and Loss account
March 31, March 31,2017 2016
Profit earned 2,026,778 1,813,550 Profit expensed 921,032 975,032 Net profit earned 1,105,746 838,518
Depreciation on assets given on ijarah 48,200 55,847 Provision against financings 889 -
49,089 55,847 Net profit after depreciation and provisions 1,056,657 782,671
Other incomeFee, commission and brokerage income 44,180 29,563 Income from dealing in foreign currencies (12,901) 2,626 Gain / (loss) on sale of securities 5 (2,479)Others 189 161 Total other income 31,473 29,871
1,088,130 812,542 Administrative expenses 149,674 146,948 Net profit for the period 938,456 665,594
19 NON-ADJUSTING EVENT AFTER THE BALANCE SHEET DATE
20 GENERAL
21 DATE OF AUTHORISATION FOR ISSUE
President and Chief Executive Officer Director Director Director
This condensed interim consolidated financial information was authorised for issue in the Board of Directors meeting held on April 20, 2017.
Comparative figures have been re-arranged and reclassified for comparison purposes.
(Rupees in '000)
The Board of Directors in its meeting held on April 20, 2017 has declared a cash dividend in respect of the three months ended March 31, 2017of Rs. 3.50 per share (March 31, 2016: Rs. 3.50 per share). This condensed interim consolidated financial information does not include the effectof these appropriations which will be accounted for subsequent to the period end.
(Unaudited)For the three months ended
Nauman K. DarPresident and Chief Executive Officer
Agha Sher ShahDirector
Shaffiq DharamshiDirector
Moez Ahamed JamalDirector
27Quarterly Report - March 2017

28Quarterly Report - March 2017
Condensed Interim UnconsolidatedFinancialInformation

On behalf of the Board of Directors, I am pleased to present the condensed interim unconsolidated financial information for the quarter ended March 31, 2017.
Domestic Economy
Pakistan’s economy is expected to grow at 5% during the current fiscal year, supported by an accommodative monetary policy, higher agricultural output and increase in domestic demand with the Large Scale Manufacturing index having grown at 4.1% during 8M FY17. Headline inflation has increased sharply since the 3.7% recorded in January, increasing to 4.9% in March, mainly due to rising food prices, although the average for 9M FY17 at 4.0% is within the SBP’s revised target range of 4-5%.
The trade deficit has widened substantially during 8M FY17, increasing by 27% over the corresponding period of last year, to US$ 15 billion. Exports have declined by 2% over 8M FY16, mainly due to slowdown in external demand while imports have risen by 11% during the same period, primarily resulting from a surge in machinery imports for the power sector. Remittances have remained subdued, declining by 2% during 8M FY17, with lower flows from the Middle East. As a result, the current account deficit for 8M FY17 has more than doubled over the same period of FY16, to US$ 5.5 billion. Net financial flows, while higher than in 8M FY16, have not been sufficient to offset the current account pressures, as a result of external debt repayments and delays in receipts from the Coalition Support Fund. Consequently, foreign exchange reserves have declined by 9% from their all-time high of US$ 23.6 billion in September 2016. However, despite the pressure on the external account, the Rupee has continued its stability.
The equity market performance during Q1 17 has remained lackluster despite the strategic sale of the Pakistan Stock Exchange and the inclusion of 6 Pakistani stocks in the FTSE Global Index Series. After crossing the 50,000 mark in January, the PSX 100 index has remained almost flat to December levels as concerns over domestic politics have overshadowed market positives.
The SBP maintained the discount rate at 6.25% in its monetary policy meeting in March, highlighting the pickup in domestic demand and improving consumer confidence. Private sector credit increased by Rs 463 billion during 9M FY17, a growth of 10%, with fixed asset investment being the primary driver and consumer financing continuing its upward trend. However, banking spreads have reduced further, compressing by 17bps during the first two months of 2017. Total advances of the banking sector increased by 2% over 2016 to an all-time high of PKR 5.69 trillion, while deposits reduced marginally from December 2016 levels to Rs 11.17 trillion.
Performance
HBL has delivered an unconsolidated profit after tax of Rs 8.1 billion for the first quarter of 2017 compared to Rs 8.5 billion achieved for the first three months of 2016. Earnings per share for Q1 17 were Rs 5.54 compared to Rs 5.81 in the first quarter of 2016. Pre-tax profit for the first three months of 2017 is Rs 12.5 billion, 5% lower than for Q1 16.
HBL’s balance sheet has grown by 2% over December 2016 to Rs 2.4 trillion. Total deposits increased by 1%, crossing Rs 1.8 trillion, despite an overall decline in the market, with HBL’s market share increasing to 14.2%. The domestic deposit mix continued to improve, as current accounts also increased slightly, defying seasonal trends. The ratio of domestic current accounts rose from 34.8% in December 2016 to 35.1% in March 2017, and domestic CASA improved from 85.5% to 87.1% over the same period. Average domestic loans grew by 24% with all business segments registering significant increases, while average domestic current accounts for the first quarter of 2017 increased by 16% over Q1 16. However, spreads continued to decline as a result of competition driven pricing reductions and falling investment yields. This was mostly offset by a 7.0% growth in the average balance sheet, as a result of which net interest income for the quarter ended March 31, 2017 has decreased by 3% to Rs 19.2 billion.
Non mark-up income increased by 21% compared to the first quarter of 2016. Income from treasury related activities nearly doubled, to Rs 2.1 billion. Fees and commissions increased by 6% to Rs 4.3 billion, primarily due to growth in the Bancassurance, consumer financing businesses and account and card operations related fees.
Administrative expenses rose by 11% over Q1 16, but declined by 12% over the previous quarter. Total provisions for the quarter reduced by 30% compared to Q1 16. Consequently the coverage ratio has strengthened further, to 93.2% as at March 31, 2017.
Directors’ Review
30Quarterly Report - March 2017
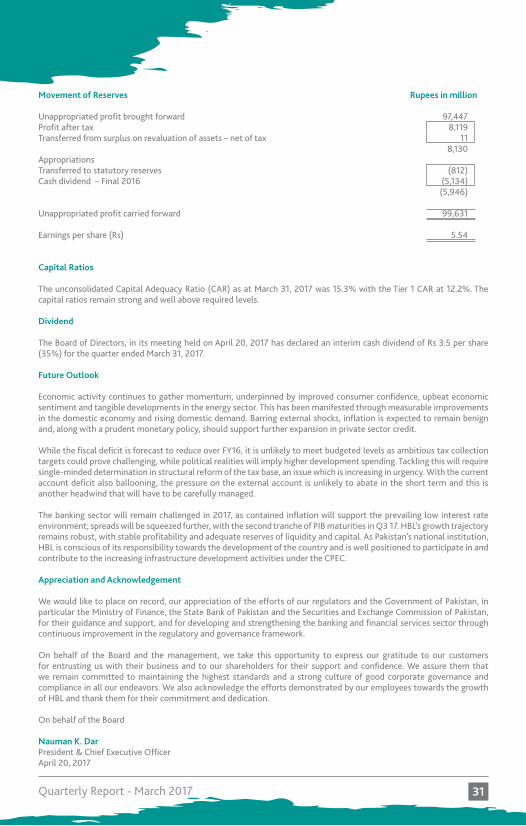
Movement of Reserves Rupees in million
Unappropriated profit brought forward 97,447Profit after tax 8,119Transferred from surplus on revaluation of assets – net of tax 11 8,130Appropriations Transferred to statutory reserves (812)Cash dividend – Final 2016 (5,134) (5,946) Unappropriated profit carried forward 99,631
Earnings per share (Rs) 5.54
Capital Ratios
The unconsolidated Capital Adequacy Ratio (CAR) as at March 31, 2017 was 15.3% with the Tier 1 CAR at 12.2%. The capital ratios remain strong and well above required levels.
Dividend
The Board of Directors, in its meeting held on April 20, 2017 has declared an interim cash dividend of Rs 3.5 per share (35%) for the quarter ended March 31, 2017.
Future Outlook
Economic activity continues to gather momentum, underpinned by improved consumer confidence, upbeat economic sentiment and tangible developments in the energy sector. This has been manifested through measurable improvements in the domestic economy and rising domestic demand. Barring external shocks, inflation is expected to remain benign and, along with a prudent monetary policy, should support further expansion in private sector credit.
While the fiscal deficit is forecast to reduce over FY16, it is unlikely to meet budgeted levels as ambitious tax collection targets could prove challenging, while political realities will imply higher development spending. Tackling this will require single-minded determination in structural reform of the tax base, an issue which is increasing in urgency. With the current account deficit also ballooning, the pressure on the external account is unlikely to abate in the short term and this is another headwind that will have to be carefully managed.
The banking sector will remain challenged in 2017, as contained inflation will support the prevailing low interest rate environment; spreads will be squeezed further, with the second tranche of PIB maturities in Q3 17. HBL’s growth trajectory remains robust, with stable profitability and adequate reserves of liquidity and capital. As Pakistan’s national institution, HBL is conscious of its responsibility towards the development of the country and is well positioned to participate in and contribute to the increasing infrastructure development activities under the CPEC.
Appreciation and Acknowledgement
We would like to place on record, our appreciation of the efforts of our regulators and the Government of Pakistan, in particular the Ministry of Finance, the State Bank of Pakistan and the Securities and Exchange Commission of Pakistan, for their guidance and support, and for developing and strengthening the banking and financial services sector through continuous improvement in the regulatory and governance framework.
On behalf of the Board and the management, we take this opportunity to express our gratitude to our customers for entrusting us with their business and to our shareholders for their support and confidence. We assure them that we remain committed to maintaining the highest standards and a strong culture of good corporate governance and compliance in all our endeavors. We also acknowledge the efforts demonstrated by our employees towards the growth of HBL and thank them for their commitment and dedication.
On behalf of the Board
Nauman K. DarPresident & Chief Executive OfficerApril 20, 2017
31Quarterly Report - March 2017
32Quarterly Report - March 2017 33
33Quarterly Report - March 2017 32
34Quarterly Report - March 2017 35 35
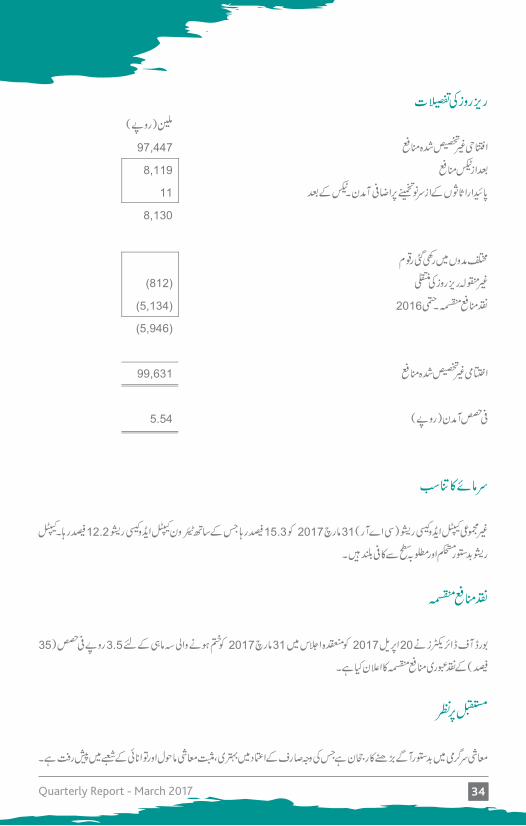
35Quarterly Report - March 2017 34
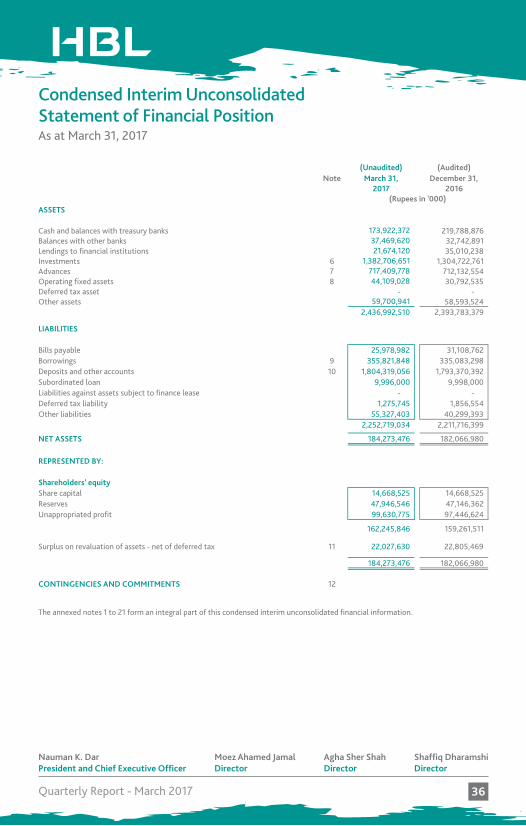
HABIB BANK LIMITEDCONDENSED INTERIM UNCONSOLIDATED STATEMENT OF FINANCIAL POSITIONAS AT MARCH 31, 2017
(Unaudited) (Audited)Note March 31, December 31,
2017 2016
ASSETS
Cash and balances with treasury banks 173,922,372 219,788,876 Balances with other banks 37,469,620 32,742,891 Lendings to financial institutions 21,674,120 35,010,238 Investments 6 1,382,706,651 1,304,722,761 Advances 7 717,409,778 712,132,554 Operating fixed assets 8 44,109,028 30,792,535 Deferred tax asset - - Other assets 59,700,941 58,593,524
2,436,992,510 2,393,783,379
LIABILITIES
Bills payable 25,978,982 31,108,762 Borrowings 9 355,821,848 335,083,298 Deposits and other accounts 10 1,804,319,056 1,793,370,392 Subordinated loan 9,996,000 9,998,000 Liabilities against assets subject to finance lease - - Deferred tax liability 1,275,745 1,856,554 Other liabilities 55,327,403 40,299,393
2,252,719,034 2,211,716,399
NET ASSETS 184,273,476 182,066,980
REPRESENTED BY:
Shareholders' equityShare capital 14,668,525 14,668,525 Reserves 47,946,546 47,146,362 Unappropriated profit 99,630,775 97,446,624
162,245,846 159,261,511
Surplus on revaluation of assets - net of deferred tax 11 22,027,630 22,805,469
184,273,476 182,066,980
CONTINGENCIES AND COMMITMENTS 12
The annexed notes 1 to 21 form an integral part of this condensed interim unconsolidated financial information.
President and Chief Executive Officer Director Director Director
(Rupees in '000)
Condensed Interim Unconsolidated Statement of Financial PositionAs at March 31, 2017
Nauman K. DarPresident and Chief Executive Officer
Agha Sher ShahDirector
Shaffiq DharamshiDirector
Moez Ahamed JamalDirector
36Quarterly Report - March 2017
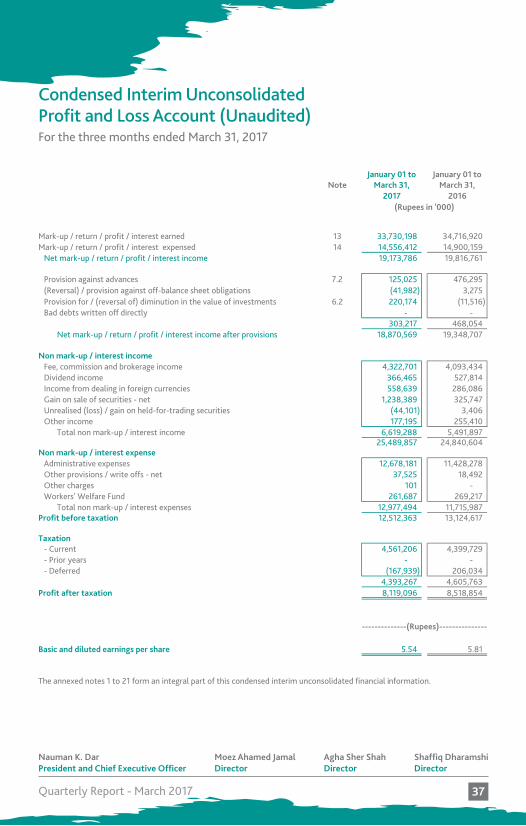
HABIB BANK LIMITEDCONDENSED INTERIM UNCONSOLIDATED PROFIT AND LOSS ACCOUNT (UNAUDITED)FOR THE THREE MONTHS ENDED MARCH 31, 2017
January 01 to January 01 toNote March 31, March 31,
2017 2016
Mark-up / return / profit / interest earned 13 33,730,198 34,716,920 Mark-up / return / profit / interest expensed 14 14,556,412 14,900,159
Net mark-up / return / profit / interest income 19,173,786 19,816,761
Provision against advances 7.2 125,025 476,295 (Reversal) / provision against off-balance sheet obligations (41,982) 3,275 Provision for / (reversal of) diminution in the value of investments 6.2 220,174 (11,516) Bad debts written off directly - -
303,217 468,054 Net mark-up / return / profit / interest income after provisions 18,870,569 19,348,707
Non mark-up / interest incomeFee, commission and brokerage income 4,322,701 4,093,434 Dividend income 366,465 527,814 Income from dealing in foreign currencies 558,639 286,086 Gain on sale of securities - net 1,238,389 325,747 Unrealised (loss) / gain on held-for-trading securities (44,101) 3,406 Other income 177,195 255,410
Total non mark-up / interest income 6,619,288 5,491,897 25,489,857 24,840,604
Non mark-up / interest expenseAdministrative expenses 12,678,181 11,428,278 Other provisions / write offs - net 37,525 18,492 Other charges 101 - Workers' Welfare Fund 261,687 269,217
Total non mark-up / interest expenses 12,977,494 11,715,987 Profit before taxation 12,512,363 13,124,617
Taxation- Current 4,561,206 4,399,729 - Prior years - - - Deferred (167,939) 206,034
4,393,267 4,605,763 Profit after taxation 8,119,096 8,518,854
Basic and diluted earnings per share 5.54 5.81
The annexed notes 1 to 21 form an integral part of this condensed interim unconsolidated financial information.
President and Chief Executive Officer Director Director Director
(Rupees in '000)
--------------(Rupees)---------------
Condensed Interim Unconsolidated Profit and Loss Account (Unaudited)For the three months ended March 31, 2017
Nauman K. DarPresident and Chief Executive Officer
Agha Sher ShahDirector
Shaffiq DharamshiDirector
Moez Ahamed JamalDirector
37Quarterly Report - March 2017
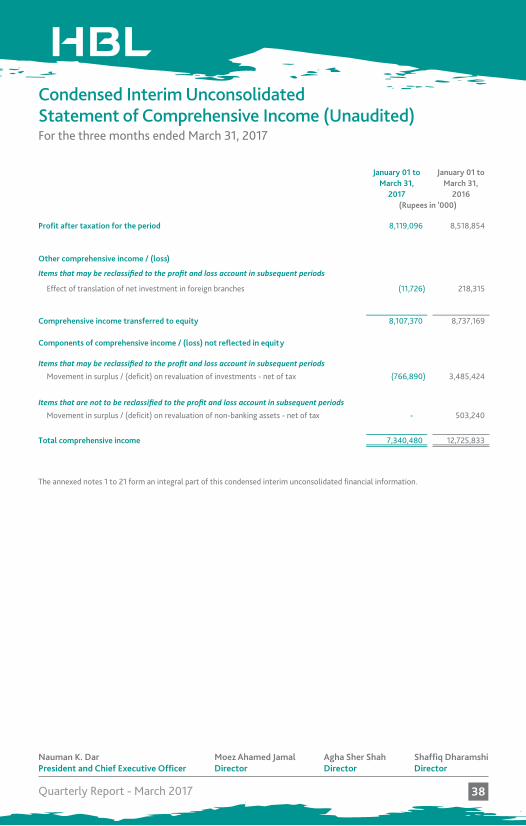
Condensed Interim Unconsolidated Statement of Comprehensive Income (Unaudited)For the three months ended March 31, 2017HABIB BANK LIMITEDCONDENSED INTERIM UNCONSOLIDATED STATEMENT OF COMPREHENSIVE INCOME (UNAUDITED)FOR THE THREE MONTHS ENDED MARCH 31, 2017
January 01 to January 01 toMarch 31, March 31,
2017 2016
Profit after taxation for the period 8,119,096 8,518,854
Other comprehensive income / (loss)
Items that may be reclassified to the profit and loss account in subsequent periods
Effect of translation of net investment in foreign branches (11,726) 218,315
Comprehensive income transferred to equity 8,107,370 8,737,169
Components of comprehensive income / (loss) not reflected in equity
Items that may be reclassified to the profit and loss account in subsequent periodsMovement in surplus / (deficit) on revaluation of investments - net of tax (766,890) 3,485,424
Items that are not to be reclassified to the profit and loss account in subsequent periodsMovement in surplus / (deficit) on revaluation of non-banking assets - net of tax - 503,240
Total comprehensive income 7,340,480 12,725,833
The annexed notes 1 to 21 form an integral part of this condensed interim unconsolidated financial information.
President and Chief Executive Officer Director Director Director
(Rupees in '000)
Nauman K. DarPresident and Chief Executive Officer
Agha Sher ShahDirector
Shaffiq DharamshiDirector
Moez Ahamed JamalDirector
38Quarterly Report - March 2017
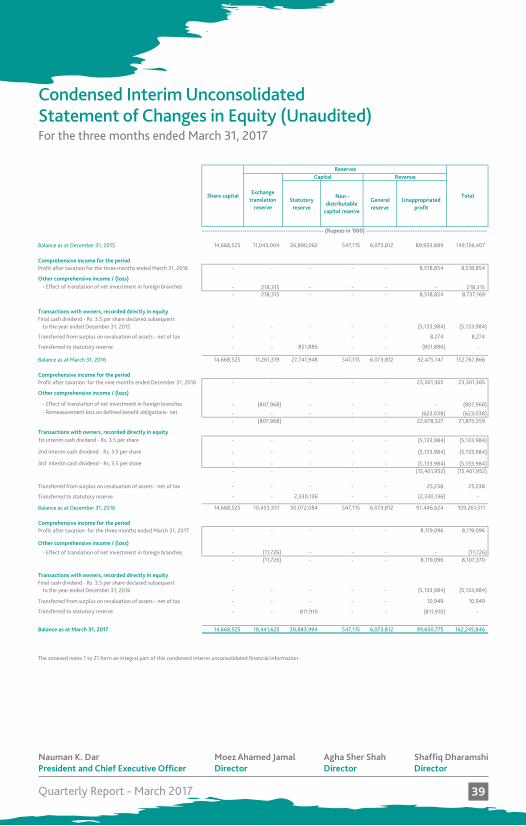
Condensed Interim Unconsolidated Statement of Changes in Equity (Unaudited)For the three months ended March 31, 2017HABIB BANK LIMITEDCONDENSED INTERIM UNCONSOLIDATED STATEMENT OF CHANGES IN EQUITY (UNAUDITED)FOR THE THREE MONTHS ENDED MARCH 31, 2017
Statutory reserve
Non - distributable
capital reserve
General reserve
Unappropriated profit
Balance as at December 31, 2015 14,668,525 11,043,004 26,890,062 547,115 6,073,812 89,933,889 149,156,407
Comprehensive income for the periodProfit after taxation for the three months ended March 31, 2016 - - - - - 8,518,854 8,518,854
Other comprehensive income / (loss)- Effect of translation of net investment in foreign branches - 218,315 - - - - 218,315
- 218,315 - - - 8,518,854 8,737,169
Transactions with owners, recorded directly in equityFinal cash dividend - Rs. 3.5 per share declared subsequent
to the year ended December 31, 2015 - - - - - (5,133,984) (5,133,984)
Transferred from surplus on revaluation of assets - net of tax - - - - - 8,274 8,274
Transferred to statutory reserve - - 851,886 - - (851,886) -
Balance as at March 31, 2016 14,668,525 11,261,319 27,741,948 547,115 6,073,812 92,475,147 152,767,866
Comprehensive income for the periodProfit after taxation for the nine months ended December 31, 2016 - - - - - 23,301,365 23,301,365
Other comprehensive income / (loss)
- Effect of translation of net investment in foreign branches - (807,968) - - - - (807,968) - Remeasurement loss on defined benefit obligations- net - - - - - (623,038) (623,038)
- (807,968) - - - 22,678,327 21,870,359
Transactions with owners, recorded directly in equity1st interim cash dividend - Rs. 3.5 per share - - - - - (5,133,984) (5,133,984)
2nd interim cash dividend - Rs. 3.5 per share - - - - - (5,133,984) (5,133,984)
3rd interim cash dividend - Rs. 3.5 per share - - - - - (5,133,984) (5,133,984) - - - - - (15,401,952) (15,401,952)
Transferred from surplus on revaluation of assets - net of tax - - - - - 25,238 25,238
Transferred to statutory reserve - - 2,330,136 - - (2,330,136) -
Balance as at December 31, 2016 14,668,525 10,453,351 30,072,084 547,115 6,073,812 97,446,624 159,261,511
Comprehensive income for the periodProfit after taxation for the three months ended March 31, 2017 - - - - - 8,119,096 8,119,096
Other comprehensive income / (loss)
- Effect of translation of net investment in foreign branches - (11,726) - - - - (11,726) - (11,726) - - - 8,119,096 8,107,370
Transactions with owners, recorded directly in equityFinal cash dividend - Rs. 3.5 per share declared subsequent
to the year ended December 31, 2016 - - - - - (5,133,984) (5,133,984)
Transferred from surplus on revaluation of assets - net of tax - - - - - 10,949 10,949
Transferred to statutory reserve - - 811,910 - - (811,910) -
Balance as at March 31, 2017 14,668,525 10,441,625 30,883,994 547,115 6,073,812 99,630,775 162,245,846
The annexed notes 1 to 21 form an integral part of this condensed interim unconsolidated financial information.
President and Chief Executive Officer Director Director Director
Total
--------------------------------------------------------- (Rupees in '000) ---------------------------------------------------------
Exchange translation
reserve
Share capital
Capital Revenue Reserves
Nauman K. DarPresident and Chief Executive Officer
Agha Sher ShahDirector
Shaffiq DharamshiDirector
Moez Ahamed JamalDirector
39Quarterly Report - March 2017
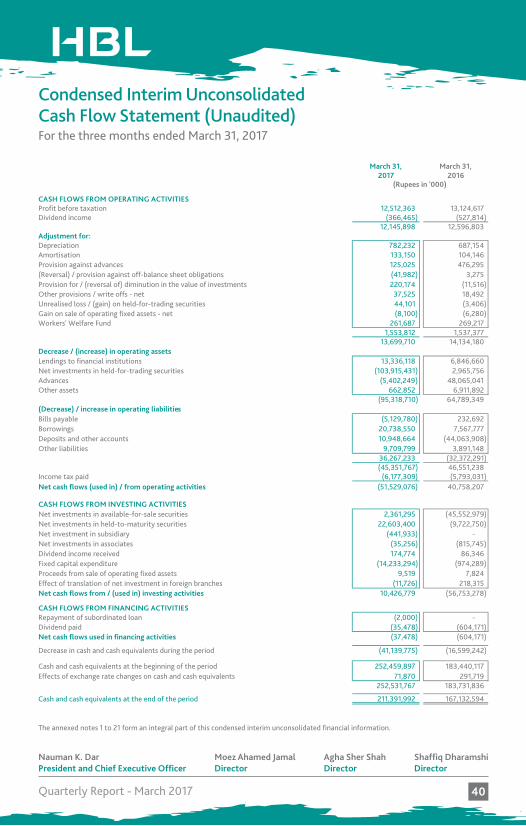
HABIB BANK LIMITEDCONDENSED INTERIM UNCONSOLIDATED CASH FLOW STATEMENT (UNAUDITED)FOR THE THREE MONTHS ENDED MARCH 31, 2017
March 31, March 31,2017 2016
CASH FLOWS FROM OPERATING ACTIVITIES Profit before taxation 12,512,363 13,124,617 Dividend income (366,465) (527,814)
12,145,898 12,596,803 Adjustment for:Depreciation 782,232 687,154 Amortisation 133,150 104,146 Provision against advances 125,025 476,295 (Reversal) / provision against off-balance sheet obligations (41,982) 3,275 Provision for / (reversal of) diminution in the value of investments 220,174 (11,516) Other provisions / write offs - net 37,525 18,492 Unrealised loss / (gain) on held-for-trading securities 44,101 (3,406) Gain on sale of operating fixed assets - net (8,100) (6,280) Workers' Welfare Fund 261,687 269,217
1,553,812 1,537,377 13,699,710 14,134,180
Decrease / (increase) in operating assets Lendings to financial institutions 13,336,118 6,846,660 Net investments in held-for-trading securities (103,915,431) 2,965,756 Advances (5,402,249) 48,065,041 Other assets 662,852 6,911,892
(95,318,710) 64,789,349 (Decrease) / increase in operating liabilitiesBills payable (5,129,780) 232,692 Borrowings 20,738,550 7,567,777 Deposits and other accounts 10,948,664 (44,063,908) Other liabilities 9,709,799 3,891,148
36,267,233 (32,372,291) (45,351,767) 46,551,238
Income tax paid (6,177,309) (5,793,031) Net cash flows (used in) / from operating activities (51,529,076) 40,758,207
CASH FLOWS FROM INVESTING ACTIVITIES Net investments in available-for-sale securities 2,361,295 (45,552,979) Net investments in held-to-maturity securities 22,603,400 (9,722,750) Net investment in subsidiary (441,933) - Net investments in associates (35,256) (815,745) Dividend income received 174,774 86,346 Fixed capital expenditure (14,233,294) (974,289) Proceeds from sale of operating fixed assets 9,519 7,824 Effect of translation of net investment in foreign branches (11,726) 218,315 Net cash flows from / (used in) investing activities 10,426,779 (56,753,278)
CASH FLOWS FROM FINANCING ACTIVITIESRepayment of subordinated loan (2,000) - Dividend paid (35,478) (604,171) Net cash flows used in financing activities (37,478) (604,171)
Decrease in cash and cash equivalents during the period (41,139,775) (16,599,242)
Cash and cash equivalents at the beginning of the period 252,459,897 183,440,117 Effects of exchange rate changes on cash and cash equivalents 71,870 291,719
252,531,767 183,731,836
Cash and cash equivalents at the end of the period 211,391,992 167,132,594
The annexed notes 1 to 21 form an integral part of this condensed interim unconsolidated financial information.
President and Chief Executive Officer Direct or Director Director
(Rupees in '000)
Condensed Interim Unconsolidated Cash Flow Statement (Unaudited)For the three months ended March 31, 2017
Nauman K. DarPresident and Chief Executive Officer
Agha Sher ShahDirector
Shaffiq DharamshiDirector
Moez Ahamed JamalDirector
40Quarterly Report - March 2017
Notes to the Condensed InterimUnconsolidated Financial Information (Unaudited)For the three months ended March 31, 2017
HABIB BANK LIMITEDNOTES TO THE CONDENSED INTERIM UNCONSOLIDATED FINANCIAL INFORMATION (UNAUDITED)FOR THE THREE MONTHS ENDED MARCH 31, 2017
1 STATUS AND NATURE OF BUSINESS
1.1
1.2
2 STATEMENT OF COMPLIANCE
3 ACCOUNTING POLICIES
4 ACCOUNTING ESTIMATES
5 FINANCIAL RISK MANAGEMENT
The accounting policies adopted in the preparation of this condensed interim unconsolidated financial information are consistentwith those followed in the preparation of the unconsolidated financial statements for the year ended December 31, 2016.
The basis for accounting estimates adopted in the preparation of this condensed interim unconsolidated financial information is the same as that applied in the preparation of the unconsolidated financial statements for the year ended December 31, 2016.
The financial risk management objectives and policies adopted by the Bank are consistent with those disclosed in theunconsolidated financial statements for the year ended December 31, 2016.
Habib Bank Limited (the Bank) is incorporated in Pakistan and is engaged in commercial banking related services in Pakistan andoverseas. The Bank’s registered office is at Habib Bank Tower, 9th Floor, Jinnah Avenue, Islamabad and its principal office is at HabibBank Plaza, I.I.Chundrigar Road, Karachi. The Bank's shares are listed on the Pakistan Stock Exchange. The Bank operates 1,678(December 31, 2016: 1,677) branches inside Pakistan including 45 (December 31, 2016: 45) Islamic Banking Branches and 55(December 31, 2016: 54) branches outside the country including in the Karachi Export Processing Zone (KEPZ). The Aga Khan Fundfor Economic Development (AKFED), S.A. is the parent company of the Bank and its registered office is in Geneva, Switzerland.
This condensed interim unconsolidated financial information has been prepared in accordance with the accounting framework asdisclosed in the annual unconsolidated financial statements for the year ended December 31, 2016. The disclosures made in thiscondensed interim unconsolidated financial information have been limited based on the format prescribed by the SBP vide BSDCircular Letter No. 2 dated May 12, 2004 and International Accounting Standard 34, Interim Financial Reporting. They do notinclude all the disclosures required for annual financial statements, and this condensed interim unconsolidated financialinformation should be read in conjunction with the unconsolidated financial statements for the year ended December 31, 2016.
During the period, the Bank has purchased 678,750 ordinary shares of Habib Allied Holding Limited (HAHL) from a minorityshareholder. Consequently, the shareholding of the Bank in HAHL has increased from 89.40% to 90.50%.
During the period, the Bank has entered into an agreement dated March 21, 2017 with Diamond Trust Bank Kenya Limited (DTBKL)to transfer / sell the business, assets and liabilities of the Bank's Kenya branches to DTBKL. In consideration, the Bank will receiveadditional shareholding in DTBKL. This transaction is subject to corporate and regulatory approvals.
41Quarterly Report - March 2017
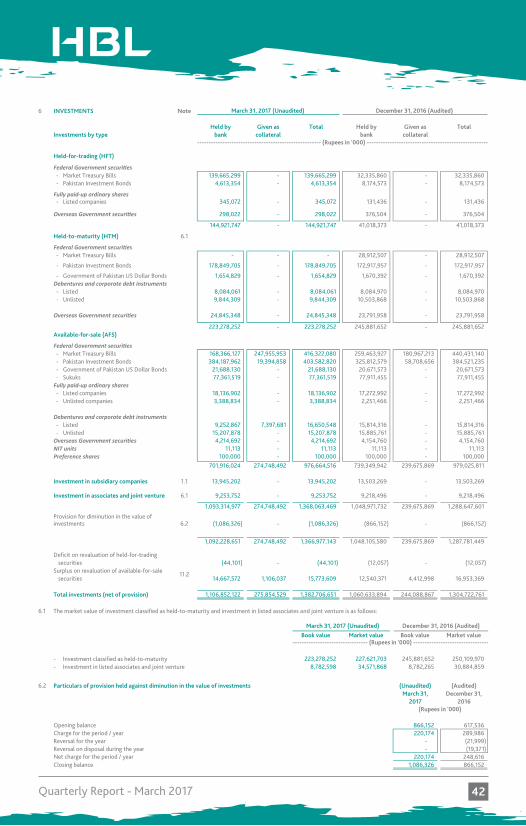
6 INVESTMENTS Note
Held by Given as Total Held by Given as TotalInvestments by type bank collateral bank collateral
Held-for-trading (HFT)
Federal Government securi�es- Market Treasury Bills 139,665,299 - 139,665,299 32,335,860 - 32,335,860 - Pakistan Investment Bonds 4,613,354 - 4,613,354 8,174,573 - 8,174,573
Fully paid-up ordinary shares- Listed companies 345,072 - 345,072 131,436 - 131,436
Overseas Government securi�es 298,022 - 298,022 376,504 - 376,504
144,921,747 - 144,921,747 41,018,373 - 41,018,373
Held-to-maturity (HTM) 6.1
Federal Government securi�es- Market Treasury Bills - - - 28,912,507 - 28,912,507
- Pakistan Investment Bonds 178,849,705 - 178,849,705 172,917,957 - 172,917,957
- Government of Pakistan US Dollar Bonds 1,654,829 - 1,654,829 1,670,392 - 1,670,392 Debentures and corporate debt instruments- Listed 8,084,061 - 8,084,061 8,084,970 - 8,084,970 - Unlisted 9,844,309 - 9,844,309 10,503,868 - 10,503,868
Overseas Government securi�es 24,845,348 - 24,845,348 23,791,958 - 23,791,958
223,278,252 - 223,278,252 245,881,652 - 245,881,652 Available-for-sale (AFS)
Federal Government securi�es- Market Treasury Bills 168,366,127 247,955,953 416,322,080 259,463,927 180,967,213 440,431,140 - Pakistan Investment Bonds 384,187,962 19,394,858 403,582,820 325,812,579 58,708,656 384,521,235 - Government of Pakistan US Dollar Bonds 21,688,130 - 21,688,130 20,671,573 - 20,671,573 - Sukuks 77,361,519 - 77,361,519 77,911,455 - 77,911,455
Fully paid-up ordinary shares- Listed companies 18,136,902 - 18,136,902 17,272,992 - 17,272,992 - Unlisted companies 3,388,834 - 3,388,834 2,251,466 - 2,251,466
Debentures and corporate debt instruments- Listed 9,252,867 7,397,681 16,650,548 15,814,316 - 15,814,316 - Unlisted 15,207,878 - 15,207,878 15,885,761 - 15,885,761
Overseas Government securi�es 4,214,692 - 4,214,692 4,154,760 - 4,154,760 NIT units 11,113 - 11,113 11,113 - 11,113 Preference shares 100,000 - 100,000 100,000 - 100,000
701,916,024 274,748,492 976,664,516 739,349,942 239,675,869 979,025,811
Investment in subsidiary companies 1.1 13,945,202 - 13,945,202 13,503,269 - 13,503,269
Investment in associates and joint venture 6.1 9,253,752 - 9,253,752 9,218,496 - 9,218,496
1,093,314,977 274,748,492 1,368,063,469 1,048,971,732 239,675,869 1,288,647,601
Provision for diminution in the value ofinvestments 6.2 (1,086,326) - (1,086,326) (866,152) - (866,152)
1,092,228,651 274,748,492 1,366,977,143 1,048,105,580 239,675,869 1,287,781,449
Deficit on revaluation of held-for-trading securities (44,101) - (44,101) (12,057) - (12,057)
Surplus on revaluation of available-for-salesecurities 14,667,572 1,106,037 15,773,609 12,540,371 4,412,998 16,953,369
Total investments (net of provision) 1,106,852,122 275,854,529 1,382,706,651 1,060,633,894 244,088,867 1,304,722,761
6.1 The market value of investment classified as held-to-maturity and investment in listed associates and joint venture is as follows:
Book value Market value Book value Market value
- Investment classified as held-to-maturity 223,278,252 227,621,703 245,881,652 250,109,970 - Investment in listed associates and joint venture 8,782,598 34,571,868 8,782,265 30,884,859
6.2 Particulars of provision held against diminution in the value of investments (Unaudited) (Audited)March 31, December 31,
2017 2016
Opening balance 866,152 617,536 Charge for the period / year 220,174 289,986 Reversal for the year - (21,999) Reversal on disposal during the year - (19,371) Net charge for the period / year 220,174 248,616 Closing balance 1,086,326 866,152
(Rupees in '000)
------------------------------------------------------ (Rupees in '000) -----------------------------------------------------
December 31, 2016 (Audited)March 31, 2017 (Unaudited)
11.2
March 31, 2017 (Unaudited) December 31, 2016 (Audited)
--------------------------------- (Rupees in '000) ---------------------------------
42Quarterly Report - March 2017
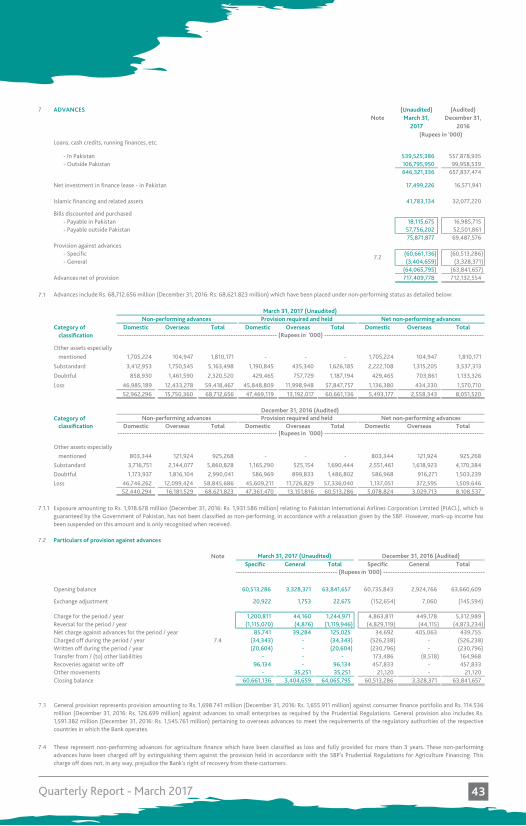
7 ADVANCES (Unaudited) (Audited)Note March 31, December 31,
2017 2016
Loans, cash credits, running finances, etc.
- In Pakistan 539,525,386 557,878,935 - Outside Pakistan 106,795,950 99,958,539
646,321,336 657,837,474
Net investment in finance lease - in Pakistan 17,499,226 16,571,941
Islamic financing and related assets 41,783,134 32,077,220
Bills discounted and purchased- Payable in Pakistan 18,115,675 16,985,715 - Payable outside Pakistan 57,756,202 52,501,861
75,871,877 69,487,576 Provision against advances
- Specific (60,661,136) (60,513,286) - General (3,404,659) (3,328,371)
(64,065,795) (63,841,657) Advances net of provision 717,409,778 712,132,554
7.1 Advances include Rs. 68,712.656 million (December 31, 2016: Rs. 68,621.823 million) which have been placed under non-performing status as detailed below:
Category of Domestic Overseas Total Domestic Overseas Total Domestic Overseas Totalclassification
Other assets especially mentioned 1,705,224 104,947 1,810,171 - - - 1,705,224 104,947 1,810,171
Substandard 3,412,953 1,750,545 5,163,498 1,190,845 435,340 1,626,185 2,222,108 1,315,205 3,537,313
Doubtful 858,930 1,461,590 2,320,520 429,465 757,729 1,187,194 429,465 703,861 1,133,326
Loss 46,985,189 12,433,278 59,418,467 45,848,809 11,998,948 57,847,757 1,136,380 434,330 1,570,710 52,962,296 15,750,360 68,712,656 47,469,119 13,192,017 60,661,136 5,493,177 2,558,343 8,051,520
Category of classification Domestic Overseas Total Domestic Overseas Total Domestic Overseas Total
Other assets especially mentioned 803,344 121,924 925,268 - - - 803,344 121,924 925,268
Substandard 3,716,751 2,144,077 5,860,828 1,165,290 525,154 1,690,444 2,551,461 1,618,923 4,170,384 Doubtful 1,173,937 1,816,104 2,990,041 586,969 899,833 1,486,802 586,968 916,271 1,503,239 Loss 46,746,262 12,099,424 58,845,686 45,609,211 11,726,829 57,336,040 1,137,051 372,595 1,509,646
52,440,294 16,181,529 68,621,823 47,361,470 13,151,816 60,513,286 5,078,824 3,029,713 8,108,537
7.1.1
7.2 Particulars of provision against advances
NoteSpecific General Total Specific General Total
Opening balance 60,513,286 3,328,371 63,841,657 60,735,843 2,924,766 63,660,609
Exchange adjustment 20,922 1,753 22,675 (152,654) 7,060 (145,594)
Charge for the period / year 1,200,811 44,160 1,244,971 4,863,811 449,178 5,312,989 Reversal for the period / year (1,115,070) (4,876) (1,119,946) (4,829,119) (44,115) (4,873,234) Net charge against advances for the period / year 85,741 39,284 125,025 34,692 405,063 439,755 Charged off during the period / year 7.4 (34,343) - (34,343) (526,238) - (526,238) Written off during the period / year (20,604) - (20,604) (230,796) - (230,796) Transfer from / (to) other liabilities - - - 173,486 (8,518) 164,968 Recoveries against write off 96,134 - 96,134 457,833 - 457,833 Other movements - 35,251 35,251 21,120 - 21,120 Closing balance 60,661,136 3,404,659 64,065,795 60,513,286 3,328,371 63,841,657
7.3
7.4
December 31, 2016 (Audited)
-------------------------------------------- (Rupees in '000) --------------------------------------------
These represent non-performing advances for agriculture finance which have been classified as loss and fully provided for more than 3 years. These non-performingadvances have been charged off by extinguishing them against the provision held in accordance with the SBP's Prudential Regulations for Agriculture Financing. Thischarge off does not, in any way, prejudice the Bank's right of recovery from these customers.
General provision represents provision amounting to Rs. 1,698.741 million (December 31, 2016: Rs. 1,655.911 million) against consumer finance portfolio and Rs. 114.536million (December 31, 2016: Rs. 126.699 million) against advances to small enterprises as required by the Prudential Regulations. General provision also includes Rs.1,591.382 million (December 31, 2016: Rs. 1,545.761 million) pertaining to overseas advances to meet the requirements of the regulatory authorities of the respectivecountries in which the Bank operates.
December 31, 2016 (Audited)Non-performing advances Provision required and held Net non-performing advances
--------------------------------------------------------------------- (Rupees in '000) ---------------------------------------------------------------------
March 31, 2017 (Unaudited)
Exposure amounting to Rs. 1,918.678 million (December 31, 2016: Rs. 1,931.586 million) relating to Pakistan International Airlines Corporation Limited (PIACL), which isguaranteed by the Government of Pakistan, has not been classified as non-performing, in accordance with a relaxation given by the SBP. However, mark-up income hasbeen suspended on this amount and is only recognised when received.
7.2
(Rupees in '000)
March 31, 2017 (Unaudited)Non-performing advances Provision required and held Net non-performing advances
--------------------------------------------------------------------- (Rupees in '000) ---------------------------------------------------------------------
43Quarterly Report - March 2017
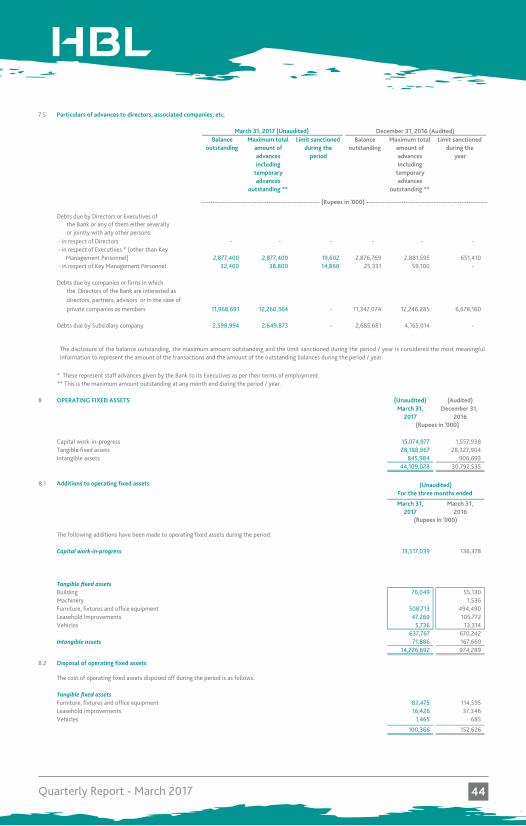
7.5 Particulars of advances to directors, associated companies, etc.
Balance outstanding
Maximum total amount of advances including
temporary advances
outstanding **
Limit sanctioned during the
period
Balance outstanding
Maximum total amount of advances including
temporary advances
outstanding **
Limit sanctioned during the
year
Debts due by Directors or Executives of the Bank or any of them either severallyor jointly with any other persons:
- in respect of Directors - - - - - - - in respect of Executives * (other than Key
Management Personnel) 2,877,400 2,877,400 19,602 2,876,769 2,881,595 651,410 - in respect of Key Management Personnel 32,400 38,800 14,860 25,331 59,100 -
Debts due by companies or firms in which the Directors of the Bank are interested asdirectors, partners, advisors or in the case ofprivate companies as members 11,968,691 12,260,364 - 11,347,074 12,246,285 6,678,160
Debts due by Subsidiary company 2,598,994 2,649,873 - 2,685,681 4,165,014 -
* These represent staff advances given by the Bank to its Executives as per their terms of employment.** This is the maximum amount outstanding at any month end during the period / year.
8 OPERATING FIXED ASSETS (Unaudited) (Audited)March 31, December 31,
2017 2016
Capital work-in-progress 15,074,977 1,557,938 Tangible fixed assets 28,188,067 28,327,904 Intangible assets 845,984 906,693
44,109,028 30,792,535
8.1 Additions to operating fixed assets
March 31, March 31,2017 2016
The following additions have been made to operating fixed assets during the period:
Capital work-in-progress 13,517,039 136,378
Tangible fixed assetsBuilding 76,049 55,130 Machinery - 1,536 Furniture, fixtures and office equipment 508,713 494,490 Leasehold Improvements 47,269 105,772 Vehicles 5,736 13,314
637,767 670,242 Intangible assets 71,886 167,669
14,226,692 974,289
8.2 Disposal of operating fixed assets
The cost of operating fixed assets disposed off during the period is as follows:
Tangible fixed assetsFurniture, fixtures and office equipment 82,475 114,595 Leasehold Improvements 16,426 37,346 Vehicles 1,465 685
100,366 152,626
(Rupees in '000)
March 31, 2017 (Unaudited) December 31, 2016 (Audited)
(Rupees in '000)
The disclosure of the balance outstanding, the maximum amount outstanding and the limit sanctioned during the period / year is considered the most meaningfulinformation to represent the amount of the transactions and the amount of the outstanding balances during the period / year.
--------------------------------------------------- (Rupees in '000) ----------------------------------------------------
(Unaudited) For the three months ended
44Quarterly Report - March 2017
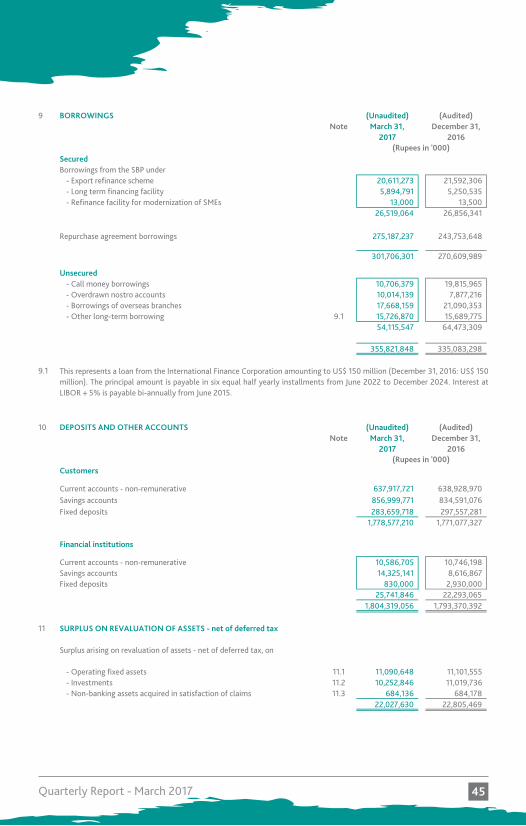
9 BORROWINGS (Unaudited) (Audited)Note March 31, December 31,
2017 2016
SecuredBorrowings from the SBP under
- Export refinance scheme 20,611,273 21,592,306 - Long term financing facility 5,894,791 5,250,535 - Refinance facility for modernization of SMEs 13,000 13,500
26,519,064 26,856,341
Repurchase agreement borrowings 275,187,237 243,753,648
301,706,301 270,609,989
Unsecured- Call money borrowings 10,706,379 19,815,965 - Overdrawn nostro accounts 10,014,139 7,877,216 - Borrowings of overseas branches 17,668,159 21,090,353 - Other long-term borrowing 9.1 15,726,870 15,689,775
54,115,547 64,473,309
355,821,848 335,083,298
9.1
10 DEPOSITS AND OTHER ACCOUNTS (Unaudited) (Audited)Note March 31, December 31,
2017 2016
Customers
Current accounts - non-remunerative 637,917,721 638,928,970 Savings accounts 856,999,771 834,591,076 Fixed deposits 283,659,718 297,557,281
1,778,577,210 1,771,077,327
Financial institutions
Current accounts - non-remunerative 10,586,705 10,746,198 Savings accounts 14,325,141 8,616,867 Fixed deposits 830,000 2,930,000
25,741,846 22,293,065 1,804,319,056 1,793,370,392
11 SURPLUS ON REVALUATION OF ASSETS - net of deferred tax
Surplus arising on revaluation of assets - net of deferred tax, on
- Operating fixed assets 11.1 11,090,648 11,101,555 - Investments 11.2 10,252,846 11,019,736 - Non-banking assets acquired in satisfaction of claims 11.3 684,136 684,178
22,027,630 22,805,469
(Rupees in '000)
This represents a loan from the International Finance Corporation amounting to US$ 150 million (December 31, 2016: US$ 150million). The principal amount is payable in six equal half yearly installments from June 2022 to December 2024. Interest atLIBOR + 5% is payable bi-annually from June 2015.
(Rupees in '000)
45Quarterly Report - March 2017
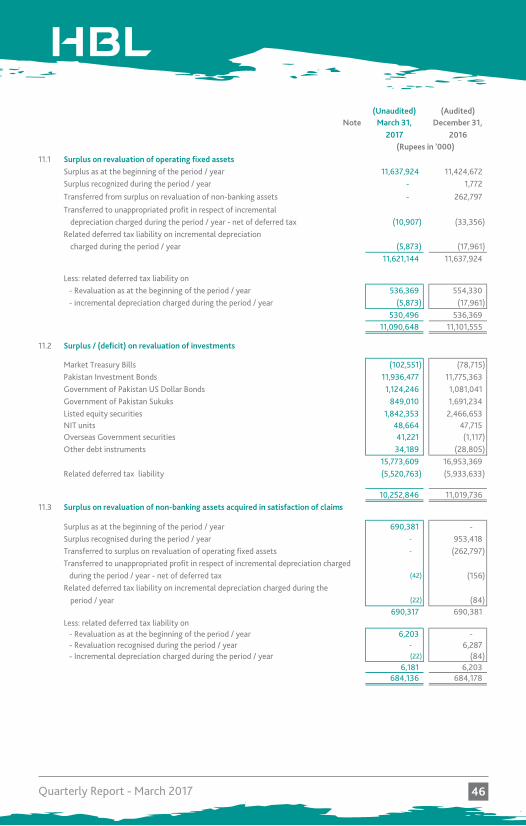
(Unaudited) (Audited)Note March 31, December 31,
2017 2016
11.1 Surplus on revaluation of operating fixed assets Surplus as at the beginning of the period / year 11,637,924 11,424,672 Surplus recognized during the period / year - 1,772
Transferred from surplus on revaluation of non-banking assets - 262,797
Transferred to unappropriated profit in respect of incremental depreciation charged during the period / year - net of deferred tax (10,907) (33,356)
Related deferred tax liability on incremental depreciation charged during the period / year (5,873) (17,961)
11,621,144 11,637,924
Less: related deferred tax liability on- Revaluation as at the beginning of the period / year 536,369 554,330 - incremental depreciation charged during the period / year (5,873) (17,961)
530,496 536,369 11,090,648 11,101,555
11.2 Surplus / (deficit) on revaluation of investments
Market Treasury Bills (102,551) (78,715) Pakistan Investment Bonds 11,936,477 11,775,363 Government of Pakistan US Dollar Bonds 1,124,246 1,081,041 Government of Pakistan Sukuks 849,010 1,691,234 Listed equity securities 1,842,353 2,466,653 NIT units 48,664 47,715 Overseas Government securities 41,221 (1,117) Other debt instruments 34,189 (28,805)
15,773,609 16,953,369 Related deferred tax liability (5,520,763) (5,933,633)
10,252,846 11,019,736 11.3 Surplus on revaluation of non-banking assets acquired in satisfaction of claims
Surplus as at the beginning of the period / year 690,381 - Surplus recognised during the period / year - 953,418 Transferred to surplus on revaluation of operating fixed assets - (262,797) Transferred to unappropriated profit in respect of incremental depreciation charged during the period / year - net of deferred tax (42) (156) Related deferred tax liability on incremental depreciation charged during the
period / year (22) (84) 690,317 690,381
Less: related deferred tax liability on- Revaluation as at the beginning of the period / year 6,203 - - Revaluation recognised during the period / year - 6,287 - Incremental depreciation charged during the period / year (22) (84)
6,181 6,203 684,136 684,178
(Rupees in '000)
46Quarterly Report - March 2017
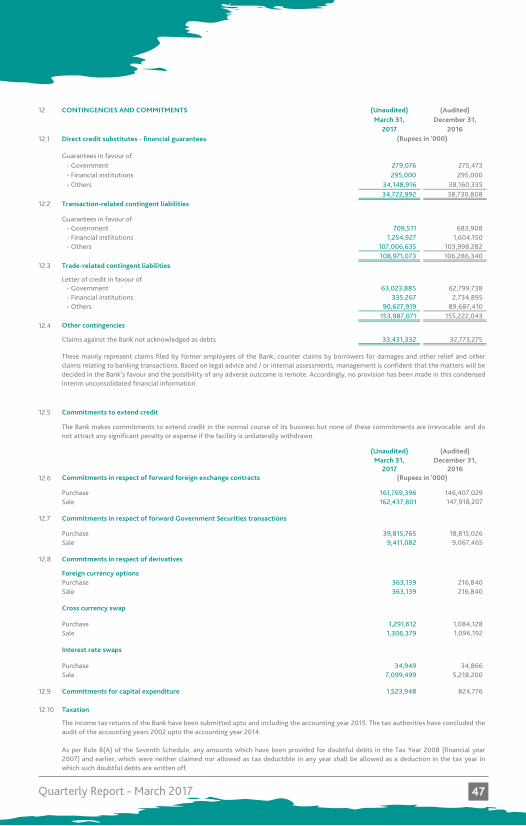
12 CONTINGENCIES AND COMMITMENTS (Unaudited) (Audited)March 31, December 31,
2017 201612.1 Direct credit substitutes - financial guarantees
Guarantees in favour of- Government 279,076 275,473 - Financial institutions 295,000 295,000 - Others 34,148,916 38,160,335
34,722,992 38,730,808 12.2 Transaction-related contingent liabilities
Guarantees in favour of- Government 709,511 683,908 - Financial institutions 1,254,927 1,604,150 - Others 107,006,635 103,998,282
108,971,073 106,286,340 12.3 Trade-related contingent liabilities
Letter of credit in favour of- Government 63,023,885 62,799,738 - Financial institutions 335,267 2,734,895 - Others 90,627,919 89,687,410
153,987,071 155,222,043 12.4 Other contingencies
Claims against the Bank not acknowledged as debts 33,431,332 32,773,275
12.5 Commitments to extend credit
(Unaudited) (Audited)March 31, December 31,
2017 201612.6 Commitments in respect of forward foreign exchange contracts
Purchase 161,769,396 146,407,029 Sale 162,437,801 147,918,207
12.7 Commitments in respect of forward Government Securities transactions
Purchase 39,815,765 18,815,026 Sale 9,411,082 9,067,465
12.8 Commitments in respect of derivatives
Foreign currency optionsPurchase 363,139 216,840 Sale 363,139 216,840
Cross currency swap
Purchase 1,291,612 1,084,128 Sale 1,306,379 1,096,192
Interest rate swaps
Purchase 34,949 34,866 Sale 7,099,499 5,218,200
12.9 Commitments for capital expenditure 1,523,948 824,776
12.10 Taxation
The income tax returns of the Bank have been submitted upto and including the accounting year 2015. The tax authorities have concluded theaudit of the accounting years 2002 upto the accounting year 2014. As per Rule 8(A) of the Seventh Schedule, any amounts which have been provided for doubtful debts in the Tax Year 2008 (financial year2007) and earlier, which were neither claimed nor allowed as tax deductible in any year shall be allowed as a deduction in the tax year inwhich such doubtful debts are written off.
(Rupees in '000)
These mainly represent claims filed by former employees of the Bank, counter claims by borrowers for damages and other relief and otherclaims relating to banking transactions. Based on legal advice and / or internal assessments, management is confident that the matters will bedecided in the Bank’s favour and the possibility of any adverse outcome is remote. Accordingly, no provision has been made in this condensedinterim unconsolidated financial information.
The Bank makes commitments to extend credit in the normal course of its business but none of these commitments are irrevocable and donot attract any significant penalty or expense if the facility is unilaterally withdrawn.
(Rupees in '000)
47Quarterly Report - March 2017
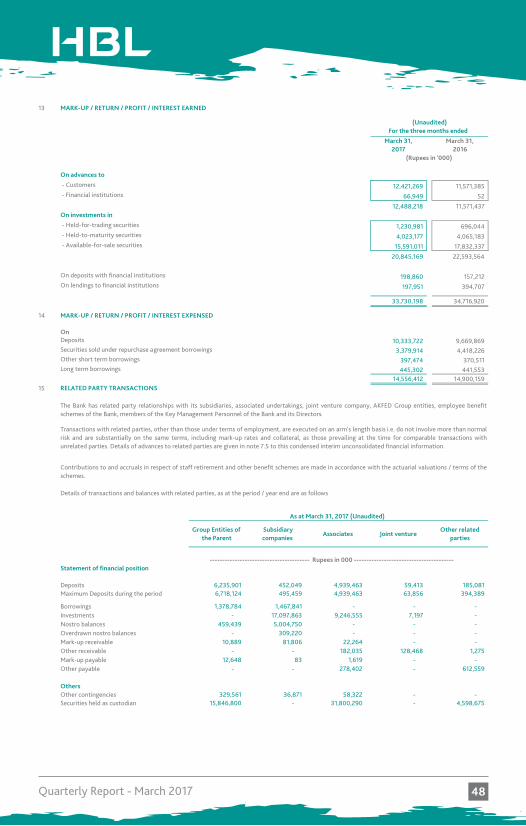
13 MARK-UP / RETURN / PROFIT / INTEREST EARNED
March 31, March 31,2017 2016
On advances to
- Customers 12,421,269 11,571,385 - Financial institutions 66,949 52
12,488,218 11,571,437 On investments in
- Held-for-trading securities 1,230,981 696,044 - Held-to-maturity securities 4,023,177 4,065,183 - Available-for-sale securities 15,591,011 17,832,337
20,845,169 22,593,564
On deposits with financial institutions 198,860 157,212 On lendings to financial institutions 197,951 394,707
33,730,198 34,716,920
14 MARK-UP / RETURN / PROFIT / INTEREST EXPENSED
OnDeposits 10,333,722 9,669,869 Securities sold under repurchase agreement borrowings 3,379,914 4,418,226 Other short term borrowings 397,474 370,511 Long term borrowings 445,302 441,553
14,556,412 14,900,159 15 RELATED PARTY TRANSACTIONS
Group Entities of the Parent
Subsidiary companies
Associates Joint ventureOther related
parties
Statement of financial position
Deposits 6,235,901 452,049 4,939,463 59,413 185,081 Maximum Deposits during the period 6,718,124 495,459 4,939,463 63,856 394,389
Borrowings 1,378,784 1,467,841 - - - Investments - 17,097,863 9,246,555 7,197 - Nostro balances 459,439 5,004,750 - - - Overdrawn nostro balances - 309,220 - - - Mark-up receivable 10,889 81,806 22,264 - - Other receivable - - 182,035 128,468 1,275 Mark-up payable 12,648 83 1,619 - - Other payable - - 278,402 - 612,559
OthersOther contingencies 329,561 36,871 58,322 - - Securities held as custodian 15,846,800 - 31,800,290 - 4,598,675
Details of transactions and balances with related parties, as at the period / year end are as follows
As at March 31, 2017 (Unaudited)
---------------------------------------- Rupees in 000 ----------------------------------------
The Bank has related party relationships with its subsidiaries, associated undertakings, joint venture company, AKFED Group entities, employee benefitschemes of the Bank, members of the Key Management Personnel of the Bank and its Directors.
Transactions with related parties, other than those under terms of employment, are executed on an arm's length basis i.e. do not involve more than normalrisk and are substantially on the same terms, including mark-up rates and collateral, as those prevailing at the time for comparable transactions withunrelated parties. Details of advances to related parties are given in note 7.5 to this condensed interim unconsolidated financial information.
Contributions to and accruals in respect of staff retirement and other benefit schemes are made in accordance with the actuarial valuations / terms of theschemes.
(Rupees in '000)
(Unaudited)For the three months ended
48Quarterly Report - March 2017
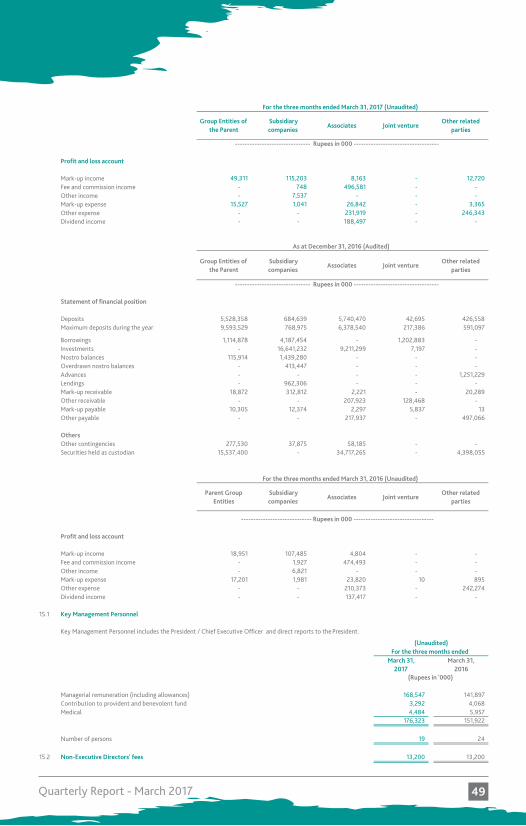
Group Entities of the Parent
Subsidiary companies
Associates Joint ventureOther related
parties
Profit and loss account
Mark-up income 49,311 115,203 8,163 - 12,720 Fee and commission income - 748 496,581 - - Other income - 7,537 - - - Mark-up expense 15,527 1,041 26,842 - 3,365 Other expense - - 231,919 - 246,343 Dividend income - - 188,497 - -
Group Entities of the Parent
Subsidiary companies
Associates Joint ventureOther related
parties
Statement of financial position
Deposits 5,528,358 684,639 5,740,470 42,695 426,558 Maximum deposits during the year 9,593,529 768,975 6,378,540 217,386 591,097
Borrowings 1,114,878 4,187,454 - 1,202,883 - Investments - 16,641,232 9,211,299 7,197 - Nostro balances 115,914 1,439,280 - - - Overdrawn nostro balances - 413,447 - - - Advances - - - - 1,251,229 Lendings - 962,306 - - - Mark-up receivable 18,872 312,812 2,221 - 20,289 Other receivable - - 207,923 128,468 - Mark-up payable 10,305 12,374 2,297 5,837 13 Other payable - - 217,937 - 497,066
OthersOther contingencies 277,530 37,875 58,185 - - Securities held as custodian 15,537,400 - 34,717,265 - 4,398,055
Parent Group Entities
Subsidiary companies
Associates Joint ventureOther related
parties
Profit and loss account
Mark-up income 18,951 107,485 4,804 - - Fee and commission income - 1,927 474,493 - - Other income - 6,821 - - - Mark-up expense 17,201 1,981 23,820 10 895 Other expense - - 210,373 - 242,274 Dividend income - - 137,417 - -
15.1 Key Management Personnel
Key Management Personnel includes the President / Chief Executive Officer and direct reports to the President.
March 31, March 31, 2017 2016
Managerial remuneration (including allowances) 168,547 141,897 Contribution to provident and benevolent fund 3,292 4,068 Medical 4,484 5,957
176,323 151,922
Number of persons 19 24
15.2 Non-Executive Directors' fees 13,200 13,200
------------------------------- Rupees in 000 -----------------------------------
------------------------------- Rupees in 000 -----------------------------------
As at December 31, 2016 (Audited)
For the three months ended March 31, 2016 (Unaudited)
For the three months ended March 31, 2017 (Unaudited)
(Rupees in '000)
(Unaudited)For the three months ended
----------------------------- Rupees in 000 ---------------------------------
49Quarterly Report - March 2017
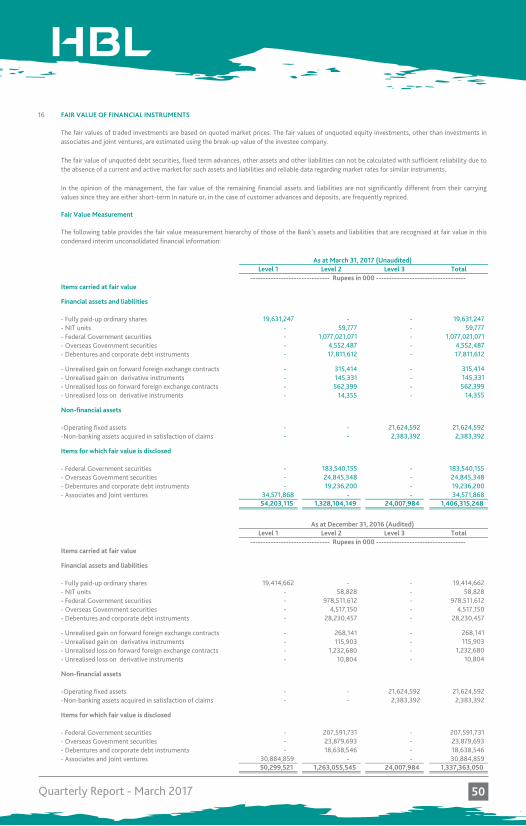
16 FAIR VALUE OF FINANCIAL INSTRUMENTS
Fair Value Measurement
Level 1 Level 2 Level 3 Total
Items carried at fair value
Financial assets and liabilities
- Fully paid-up ordinary shares 19,631,247 - - 19,631,247- NIT units - 59,777 - 59,777- Federal Government securities - 1,077,021,071 - 1,077,021,071- Overseas Government securities - 4,552,487 - 4,552,487- Debentures and corporate debt instruments - 17,811,612 - 17,811,612
- Unrealised gain on forward foreign exchange contracts - 315,414 - 315,414- Unrealised gain on derivative instruments - 145,331 - 145,331- Unrealised loss on forward foreign exchange contracts - 562,399 - 562,399- Unrealised loss on derivative instruments - 14,355 - 14,355
Non-financial assets
-Operating fixed assets - - 21,624,592 21,624,592-Non-banking assets acquired in satisfaction of claims - - 2,383,392 2,383,392
Items for which fair value is disclosed
- Federal Government securities - 183,540,155 - 183,540,155- Overseas Government securities - 24,845,348 - 24,845,348- Debentures and corporate debt instruments - 19,236,200 - 19,236,200- Associates and Joint ventures 34,571,868 - - 34,571,868
54,203,115 1,328,104,149 24,007,984 1,406,315,248
Level 1 Level 2 Level 3 Total
Items carried at fair value
Financial assets and liabilities
- Fully paid-up ordinary shares 19,414,662 - - 19,414,662- NIT units - 58,828 - 58,828- Federal Government securities - 978,511,612 - 978,511,612- Overseas Government securities - 4,517,150 - 4,517,150- Debentures and corporate debt instruments - 28,230,457 - 28,230,457
- Unrealised gain on forward foreign exchange contracts - 268,141 - 268,141- Unrealised gain on derivative instruments - 115,903 - 115,903- Unrealised loss on forward foreign exchange contracts - 1,232,680 - 1,232,680- Unrealised loss on derivative instruments - 10,804 - 10,804
Non-financial assets
-Operating fixed assets - - 21,624,592 21,624,592-Non-banking assets acquired in satisfaction of claims - - 2,383,392 2,383,392
Items for which fair value is disclosed
- Federal Government securities - 207,591,731 - 207,591,731- Overseas Government securities - 23,879,693 - 23,879,693- Debentures and corporate debt instruments - 18,638,546 - 18,638,546- Associates and Joint ventures 30,884,859 - - 30,884,859
50,299,521 1,263,055,545 24,007,984 1,337,363,050
As at March 31, 2017 (Unaudited)
------------------------------- Rupees in 000 -----------------------------------
As at December 31, 2016 (Audited)
------------------------------- Rupees in 000 -----------------------------------
The fair values of traded investments are based on quoted market prices. The fair values of unquoted equity investments, other than investments inassociates and joint ventures, are estimated using the break-up value of the investee company.
The fair value of unquoted debt securities, fixed term advances, other assets and other liabilities can not be calculated with sufficient reliability due tothe absence of a current and active market for such assets and liabilities and reliable data regarding market rates for similar instruments.
In the opinion of the management, the fair value of the remaining financial assets and liabilities are not significantly different from their carryingvalues since they are either short-term in nature or, in the case of customer advances and deposits, are frequently repriced.
The following table provides the fair value measurement hierarchy of those of the Bank’s assets and liabilities that are recognised at fair value in thiscondensed interim unconsolidated financial information:
50Quarterly Report - March 2017
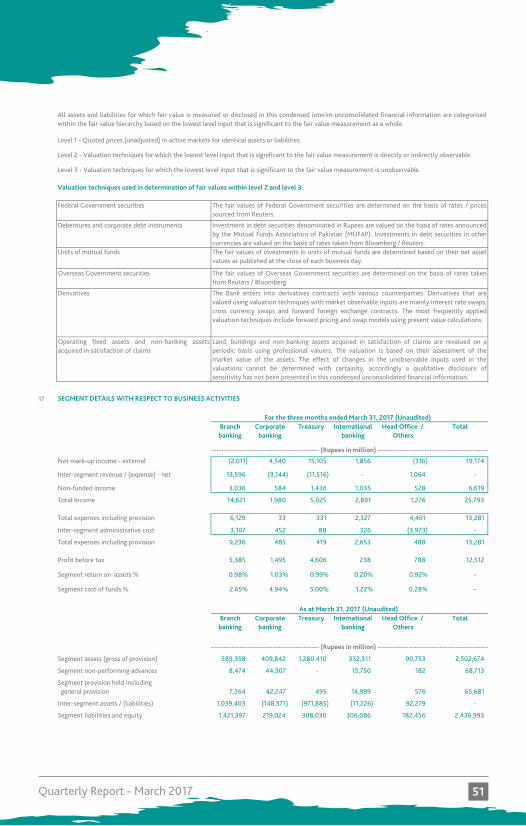
Level 1 - Quoted prices (unadjusted) in active markets for identical assets or liabilities.
Level 3 - Valuation techniques for which the lowest level input that is significant to the fair value measurement is unobservable.
Valuation techniques used in determination of fair values within level 2 and level 3.
17 SEGMENT DETAILS WITH RESPECT TO BUSINESS ACTIVITIES
Net mark-up income - external (2,011) 4,540 15,105 1,856 (316) 19,174
Inter-segment revenue / (expense) - net 13,596 (3,144) (11,516) - 1,064 -
Non-funded income 3,036 584 1,436 1,035 528 6,619
Total Income 14,621 1,980 5,025 2,891 1,276 25,793
6,129 33 331 2,327 4,461 13,281
Inter-segment administrative cost 3,107 452 88 326 (3,973) -
Total expenses including provision 9,236 485 419 2,653 488 13,281
Profit before tax 5,385 1,495 4,606 238 788 12,512
Segment return on assets % 0.98% 1.03% 0.99% 0.20% 0.92% -
Segment cost of funds % 2.65% 4.94% 5.00% 1.22% 0.28% -
Segment assets (gross of provision) 389,358 409,842 1,280,410 332,311 90,753 2,502,674
Segment non-performing advances 8,474 44,307 - 15,750 182 68,713
Segment provision held including general provision 7,364 42,247 495 14,999 576 65,681
Inter-segment assets / (liabilities) 1,039,403 (148,571) (971,885) (11,226) 92,279 -
Segment liabilities and equity 1,421,397 219,024 308,030 306,086 182,456 2,436,993
All assets and liabilities for which fair value is measured or disclosed in this condensed interim unconsolidated financial information are categorisedwithin the fair value hierarchy based on the lowest level input that is significant to the fair value measurement as a whole.
Total expenses including provision
For the three months ended March 31, 2017 (Unaudited)Branch
banking
Investment in debt securities denominated in Rupees are valued on the basis of rates announcedby the Mutual Funds Association of Pakistan (MUFAP). Investments in debt securities in othercurrencies are valued on the basis of rates taken from Bloomberg / Reuters.The fair values of investments in units of mutual funds are determined based on their net assetvalues as published at the close of each business day.
Treasury
Head Office / Others
International banking
Corporate banking
Total
Debentures and corporate debt instruments
Head Office / Others
Overseas Government securities
------------------------------------------ (Rupees in million) -------------------------------------------
Derivatives
Level 2 - Valuation techniques for which the lowest level input that is significant to the fair value measurement is directly or indirectly observable.
International banking
As at March 31, 2017 (Unaudited)
Federal Government securities The fair values of Federal Government securities are determined on the basis of rates / pricessourced from Reuters.
Units of mutual funds
Treasury
The Bank enters into derivatives contracts with various counterparties. Derivatives that arevalued using valuation techniques with market observable inputs are mainly interest rate swaps,cross currency swaps and forward foreign exchange contracts. The most frequently appliedvaluation techniques include forward pricing and swap models using present value calculations.
Branch banking
Operating fixed assets and non-banking assetsacquired in satisfaction of claims
The fair values of Overseas Government securities are determined on the basis of rates takenfrom Reuters / Bloomberg.
Total
Land, buildings and non-banking assets acquired in satisfaction of claims are revalued on aperiodic basis using professional valuers. The valuation is based on their assessment of themarket value of the assets. The effect of changes in the unobservable inputs used in thevaluations cannot be determined with certainity, accordingly a qualitative disclosure ofsensitivity has not been presented in this condensed unconsolidated financial information.
Corporate banking
------------------------------------------ (Rupees in million) -------------------------------------------
51Quarterly Report - March 2017
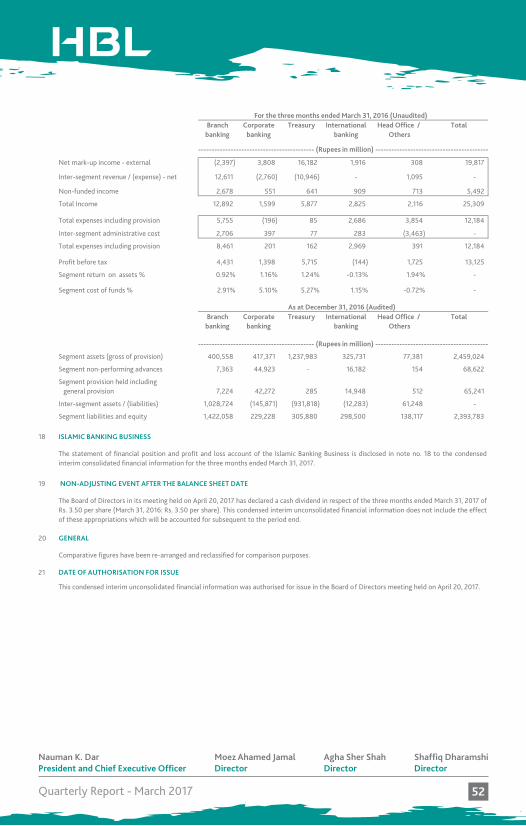
Net mark-up income - external (2,397) 3,808 16,182 1,916 308 19,817
Inter-segment revenue / (expense) - net 12,611 (2,760) (10,946) - 1,095 -
Non-funded income 2,678 551 641 909 713 5,492
Total Income 12,892 1,599 5,877 2,825 2,116 25,309
5,755 (196) 85 2,686 3,854 12,184
Inter-segment administrative cost 2,706 397 77 283 (3,463) -
Total expenses including provision 8,461 201 162 2,969 391 12,184
Profit before tax 4,431 1,398 5,715 (144) 1,725 13,125
Segment return on assets % 0.92% 1.16% 1.24% -0.13% 1.94% -
Segment cost of funds % 2.91% 5.10% 5.27% 1.15% -0.72% -
Segment assets (gross of provision) 400,558 417,371 1,237,983 325,731 77,381 2,459,024
Segment non-performing advances 7,363 44,923 - 16,182 154 68,622
Segment provision held including general provision 7,224 42,272 285 14,948 512 65,241
Inter-segment assets / (liabilities) 1,028,724 (145,871) (931,818) (12,283) 61,248 -
Segment liabilities and equity 1,422,058 229,228 305,880 298,500 138,117 2,393,783
18 ISLAMIC BANKING BUSINESS
19 NON-ADJUSTING EVENT AFTER THE BALANCE SHEET DATE
20 GENERAL
21 DATE OF AUTHORISATION FOR ISSUE
President and Chief Executive Officer Director Director Director
This condensed interim unconsolidated financial information was authorised for issue in the Board of Directors meeting held on April 20, 2017.
For the three months ended March 31, 2016 (Unaudited)Branch
banking
As at December 31, 2016 (Audited)
Total expenses including provision
The statement of financial position and profit and loss account of the Islamic Banking Business is disclosed in note no. 18 to the condensedinterim consolidated financial information for the three months ended March 31, 2017.
Comparative figures have been re-arranged and reclassified for comparison purposes.
The Board of Directors in its meeting held on April 20, 2017 has declared a cash dividend in respect of the three months ended March 31, 2017 ofRs. 3.50 per share (March 31, 2016: Rs. 3.50 per share). This condensed interim unconsolidated financial information does not include the effectof these appropriations which will be accounted for subsequent to the period end.
Treasury International banking
Head Office / Others
Total
------------------------------------------- (Rupees in million) ------------------------------------------
Corporate banking
Branch banking
Corporate banking
Treasury International banking
Head Office / Others
Total
------------------------------------------- (Rupees in million) ------------------------------------------
Nauman K. DarPresident and Chief Executive Officer
Agha Sher ShahDirector
Shaffiq DharamshiDirector
Moez Ahamed JamalDirector
52Quarterly Report - March 2017


THE
TIM
ES
PR
ES
S (P
VT
) LTD
. w
ww.timespresspk.com
Recommended