Fall 2013 Biological Systems Analysis
Cerebral Hemodynamics and Cerebrospinal Fluid Flow in the
Presence of Choroid Plexus Papilloma
Martin Strama* Ian Gould
Chih-Yang Hsu Andreas Linninger
Abstract Quantification of the cerebrospinal fluid (CSF) system may be useful for distinguishing relative treatments in the presence
of choroid plexus papillomas (CPPs). To study the CSF system, mathematical models and simulations detailing the
cerebral blood flow and CSF filtration were constructed to represent a normal brain, a brain with CPP located in the left
lateral ventricle, and a brain with CPP located in the fourth ventricle. Furthermore, analysis of treatments by implementing
a shunt for each experimental case were assessed. Flow distributions and intracranial pressures were obtained to assess
the severity of each condition and the effectiveness of the shunt treatments. The results show that when CPP grows in the
LLV or in the 4V, the ICP grows uncontrollably. When the shunt is applied to the LLV, the shunt is most effective after
about 40% CPP growth. When the shunt is applied to the 4V, the shunt is effective from the very onset of CPP growth.
Keywords
Choroid plexus papilloma Cerebrospinal fluid Cerebral hemodynamics Intracranial pressure Computational
flow rates Mathematical modeling
Martin Strama
Department of Bioengineering
College of Engineering, College of Medicine
University of Illinois at Chicago, Chicago, USA
Ian Gould Chih-Yang Hsu Andreas Linninger
Laboratory for Product and Process Design (LPPD)
Department of Bioengineering
College of Engineering, College of Medicine
University of Illinois at Chicago, Chicago, USA
Cerebral hemodynamics and cerebrospinal fluid flow in the presence of choroid plexus papilloma 2
Table of Contents
Section I: Introduction
Motivation ……………………………………………………………………………………………………………………… 3
Background
Cerebral Vasculature Circulation …………………………………………………………………………………........ 3
Cerebrospinal Fluid Production ………………………………………………………………………………………… 4
Cerebral Spinal Fluid Circulation ………………………………………………………………………………………. 4
Outline ………………………………………………………………………………………………………………………….. 5
Section II: Methods
Overview of Model Simulation ………………………………………………………………………………………………. 5
Assumptions ……………………………………………………………………………………………………………………. 5
Mathematical Basis ……………………………………………………………………………………………….................. 5
Boundary Conditions ……………………………………………………………………………………………................... 6
Optimizations …………………………………………………………………………………………………….................... 6
Sensitivity Analysis on Microvasculature Resistance ………………………………………………………………… 6
Establishing CSF Flow …………………………………………………………………………………………………… 7
ICP Determination ………………………………………………………………………………………………………… 7
Model Simulations ……………………………………………………………………………………………….................... 7
Section III: Results
ICP Profiles ………………………………………………………………………………………………………................... 9
Conservation of CSF Flow ………………………………………………………………………………………................. 9
Simulation Results
ICP Dynamics ……………………………………………………………………………………………………………… 11
CPP in the L LV without Shunt ………………………………………………………………………………………….. 13
CPP in the L LV with Shunt ………………………………………………………………………………….................. 13
CPP in the 4V without Shunt …………………………………………………………………………………................ 13
CPP in the 4V with Shunt …………………………………………………………………………………….................. 13
CSF Flow Distribution Schematics ……………………………………………………………………………………… 13
Section IV: Discussion ……………………………………………………………………………………………..... 13
Section V: Conclusion ………………………………………………………………………………………………. 17
References ……………………………………………………………………………………………………………. 17
Abbreviations
CPP Choroid Plexus Papilloma
Cerebrospinal Fluid System Cerebral Hemodynamic System
CSF Cerebrospinal Fluid LICA Left Internal Carotid Artery
LLV Left Lateral Ventricle RICA Right Internal Carotid Artery
RLV Right Lateral Ventricle BA Basilar Artery
3V Third Ventricle LJV Left Jugular Vein
4V Fourth Ventricle RJV Right Jugular Vein
AV Arachnoid Villi
ICP Intracranial Pressure
M. Strama et al. 3
1. Introduction
1.1 Motivation
Choroid plexus papillomas (CPPs) are benign neuroepithelial intraventricular tumors accounting for approximately 1%
of all verified intracranial neoplasms [1,2]. Approximately, 85% of all CPPs occur in children under the age of five, 2-6%
of all pediatric brain tumors, and 0.5% of adult brain tumors [1]. CPPs arise from the choroid plexus (CP), a richly
vascularized tissue situated in the roof of each of the four brain ventricles [3]. Frequent locations of CPPs are the lateral and
third ventricles (LV, 3V) in children and the fourth ventricle (4V) in adults [2]. CPPs invade nearby tissue and spread widely
via the cerebrospinal fluid (CSF) [4]. Although benign, CPPs obstruct CSF flow, which leads to increased CSF production
by the CP thus causing increased intracranial pressure (ICP) and hydrocephalus [4]. While the CPPs effect of compressing
brain tissue and increasing CSF production is well described clinically, the brain analysis as a system of cerebral
hemodynamics in the presence of CPPs are poorly understood. The following paper aims to: (i) analyze CSF flow patterns
inside the ventricular and subarachnoidal regions during CPP growth; and (ii) analyze the auto-regulation mechanisms of
the CSF system during treatment of CPP via insertion of a shunt.
1.2 Background
1.2.1 Cerebral Vasculature Circulation
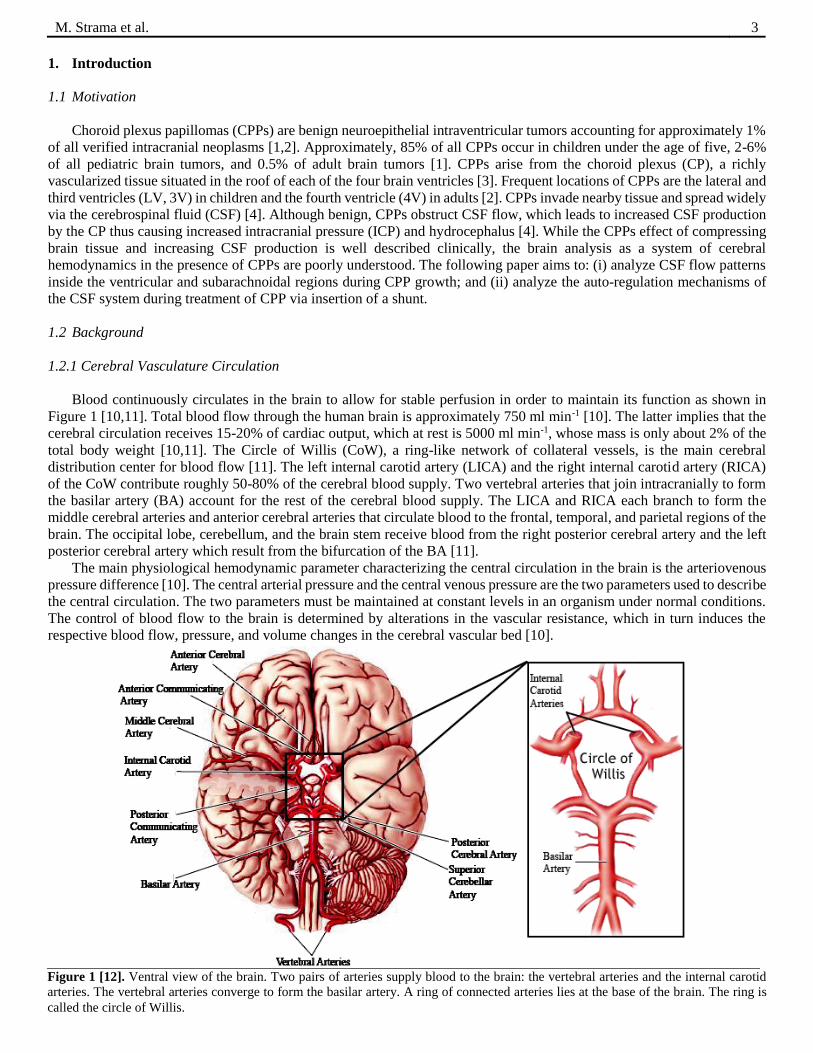
Blood continuously circulates in the brain to allow for stable perfusion in order to maintain its function as shown in
Figure 1 [10,11]. Total blood flow through the human brain is approximately 750 ml min-1 [10]. The latter implies that the
cerebral circulation receives 15-20% of cardiac output, which at rest is 5000 ml min-1, whose mass is only about 2% of the
total body weight [10,11]. The Circle of Willis (CoW), a ring-like network of collateral vessels, is the main cerebral
distribution center for blood flow [11]. The left internal carotid artery (LICA) and the right internal carotid artery (RICA)
of the CoW contribute roughly 50-80% of the cerebral blood supply. Two vertebral arteries that join intracranially to form
the basilar artery (BA) account for the rest of the cerebral blood supply. The LICA and RICA each branch to form the
middle cerebral arteries and anterior cerebral arteries that circulate blood to the frontal, temporal, and parietal regions of the
brain. The occipital lobe, cerebellum, and the brain stem receive blood from the right posterior cerebral artery and the left
posterior cerebral artery which result from the bifurcation of the BA [11].
The main physiological hemodynamic parameter characterizing the central circulation in the brain is the arteriovenous
pressure difference [10]. The central arterial pressure and the central venous pressure are the two parameters used to describe
the central circulation. The two parameters must be maintained at constant levels in an organism under normal conditions.
The control of blood flow to the brain is determined by alterations in the vascular resistance, which in turn induces the
respective blood flow, pressure, and volume changes in the cerebral vascular bed [10].
Figure 1 [12]. Ventral view of the brain. Two pairs of arteries supply blood to the brain: the vertebral arteries and the internal carotid
arteries. The vertebral arteries converge to form the basilar artery. A ring of connected arteries lies at the base of the brain. The ring is
called the circle of Willis.
Cerebral hemodynamics and cerebrospinal fluid flow in the presence of choroid plexus papilloma 4
1.2.2 Cerebrospinal Fluid Production
One of the main functions of the CP is to produce and secrete CSF from the epithelial cells. CSF fills the ventricles of
the brain and the spaces of the central nervous system. The CSF volume in humans is 140 mL and is replaced four times a
day for an overall volume of approximately 600 ml per day [5]. The production of CSF is dependent on the fluid transfer
between blood vessels and into the epithelial cells [3]. The rate of CSF secretion is constant at approximately 200 l min-1
per gram of CP tissue. In humans, the CP weigh approximately 2 grams total making the rate of CSF secretion to be between
320 to 400 l min-1 [5,6].
The CP also act to maintain homeostasis of the brain environment by acting as a barrier interface between blood and
CSF [3]. Composed of numerous villi that project into the ventricles of the brain, the CP forms the blood-CSF barrier
(BCSFB) by the epithelial cells, which are linked together by tight junctional complexes. Epithelial cells contain a large
surface area which means that the total surface are of the BCSFB is on the same order of magnitude as that of the blood-
brain barrier [5]. As a result of the BCSFB, the CP constantly regulates the composition of the CSF. An estimated of 10-
30% of total CSF production is generated by the convection (bulk flow) of interstitial fluid from the brain parenchyma to
the ventricles and subarachnoid space (SAS) [7]. Compared to other regions in the brain, blood flow to the CP is higher in
order to maintain a continuous CSF production at a relatively high rate [7]. The large surface area of the epithelium helps
support the high rate of CSF secretion by the CP.
The basal lamina, the layer of extracellular matrix secreted by the epithelial cells, acts as a barrier to the migration of
cells during normal development. The basal lamina also acts as a track for the migration of tumor cells [8]. In CCP, the
basal lamina extends linearly from its usual perivascular site along the bases of tumors cells. Several sheets of the basal
lamina secrete, more or less in parallel, forming masses 2-20 mm in size [9].
1.2.3 Cerebrospinal Fluid Circulation
During systole, contraction of the heart, arterial blood flows into the tissues of the CP causing the CP to expand and
secrete CSF at a constant rate. The CP behaves as a pump supplying the kinetic energy to drive CSF circulation [6]. CSF
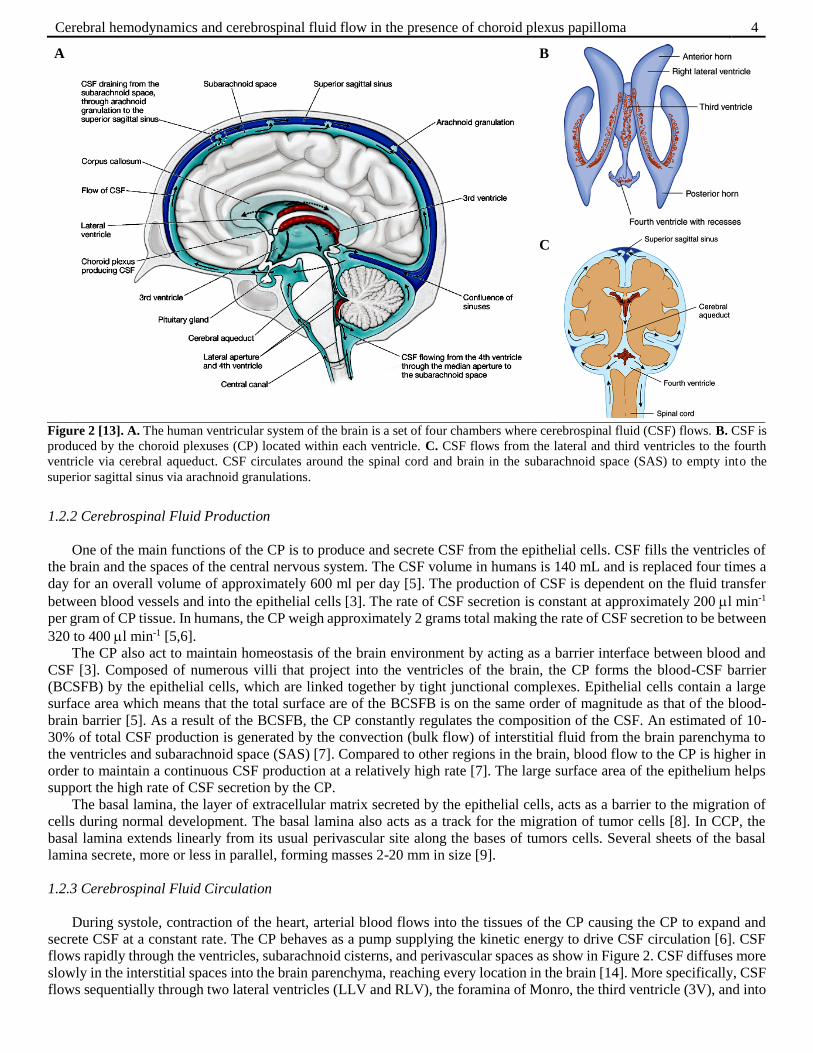
flows rapidly through the ventricles, subarachnoid cisterns, and perivascular spaces as show in Figure 2. CSF diffuses more
slowly in the interstitial spaces into the brain parenchyma, reaching every location in the brain [14]. More specifically, CSF
flows sequentially through two lateral ventricles (LLV and RLV), the foramina of Monro, the third ventricle (3V), and into
A
B
C
Figure 2 [13]. A. The human ventricular system of the brain is a set of four chambers where cerebrospinal fluid (CSF) flows. B. CSF is
produced by the choroid plexuses (CP) located within each ventricle. C. CSF flows from the lateral and third ventricles to the fourth
ventricle via cerebral aqueduct. CSF circulates around the spinal cord and brain in the subarachnoid space (SAS) to empty into the
superior sagittal sinus via arachnoid granulations.
M. Strama et al. 5
the fourth ventricle (4V) through the aqueduct of Sylvius [6]. CSF then reaches the SAS through the foramina of Luschke
and Magendie where it is reabsorbed through the arachnoid villi (AV) at the sagittal sinus (SS) into the venous system [6].
1.3 Outline
Section one helped develop the necessary physiological foundation needed to being addressing the following aims: (i)
analyze CSF flow patterns inside the ventricular and subarachnoidal regions during CPP growth; and (ii) analyze the auto-
regulation mechanisms of the CSF system during treatment of CPP via insertion of a shunt. Section two introduces the
mathematical basis and equations describing the blood and CSF flow in the model. The development of the model being
utilized is presented along with the specific simulations being conducted. Results are presented in section three for ICP
values and CSF flow rates for each simulation performed. Section four discusses the validity of the results with clinical
observations. Section five highlights the overall gain from these simulations for use in future clinical applications of shunts
for CPP treatment.
2. Methods
2.1 Overview of Model Simulation
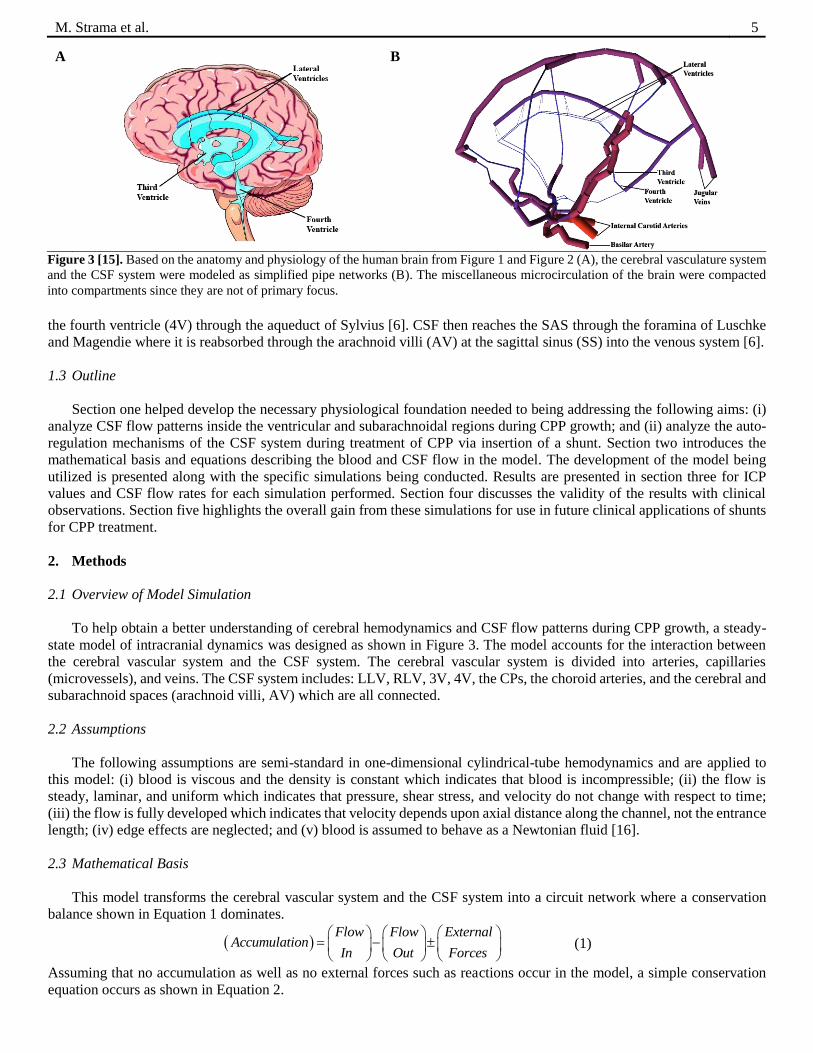
To help obtain a better understanding of cerebral hemodynamics and CSF flow patterns during CPP growth, a steady-
state model of intracranial dynamics was designed as shown in Figure 3. The model accounts for the interaction between
the cerebral vascular system and the CSF system. The cerebral vascular system is divided into arteries, capillaries
(microvessels), and veins. The CSF system includes: LLV, RLV, 3V, 4V, the CPs, the choroid arteries, and the cerebral and
subarachnoid spaces (arachnoid villi, AV) which are all connected.
2.2 Assumptions
The following assumptions are semi-standard in one-dimensional cylindrical-tube hemodynamics and are applied to
this model: (i) blood is viscous and the density is constant which indicates that blood is incompressible; (ii) the flow is
steady, laminar, and uniform which indicates that pressure, shear stress, and velocity do not change with respect to time;
(iii) the flow is fully developed which indicates that velocity depends upon axial distance along the channel, not the entrance
length; (iv) edge effects are neglected; and (v) blood is assumed to behave as a Newtonian fluid [16].
2.3 Mathematical Basis
This model transforms the cerebral vascular system and the CSF system into a circuit network where a conservation
balance shown in Equation 1 dominates.
Flow Flow External
AccumulationIn Out Forces
(1)
Assuming that no accumulation as well as no external forces such as reactions occur in the model, a simple conservation
equation occurs as shown in Equation 2.
A
B
Figure 3 [15]. Based on the anatomy and physiology of the human brain from Figure 1 and Figure 2 (A), the cerebral vasculature system
and the CSF system were modeled as simplified pipe networks (B). The miscellaneous microcirculation of the brain were compacted
into compartments since they are not of primary focus.
Cerebral hemodynamics and cerebrospinal fluid flow in the presence of choroid plexus papilloma 6
, ,
n n
i in i out
i i
f f
(2)
Equation 4 emphasizes that the sum of the inlet
flows into the model equals the sum of the outlet
flows from the model, and the net flow to a node
is zero.
To solve for pressures, the constitutive
Hagen-Poiseuille equation will be utilized to
complement each conservation of flow
equation. The Hagen-Poiseuille Law gives the
pressure drop P in a fluid f flowing through a
long cylindrical pipe with resistance α as shown
in Equation 3 and Equation 4:
P f (3)
where
with being the viscosity of the fluid, L being the length of the cylindrical tube, and D being the diameter of the of the
cylindrical tube.
Fluid flow in the model flows from areas of high pressure to areas of low pressure between the three inlet pressures of
the RICA, LICA, and BA to the two outlet pressures of the jugular veins (LJV, RJV). As a result, there is a pressure gradient
from the arterial pressures to the venous pressures where pressures decrease from arterial to venous.
2.4 Boundary Conditions
The model contains three main artery inputs: RICA, LICA, and BA. Cerebral perfusion pressure is the difference
between intra-arterial pressure and pressure in the veins. Cerebral perfusion pressure ranges from 60-160 mmHg. A cerebral
perfusion pressure of 100 mmHg has been used in research and literature for models of this type and will be utilized as the
input pressure for the RICA, LICA and BA [10,17,18]. Venous pressure is normally low with values between 2-5 mmHg
and is influenced directly by intracranial pressure (ICP). ICP quantifies the pressure in the skull and thus in the brain tissue
and CSF. ICP is normally between 7-15 mmHg [19]. Venous pressures of 3 mmHg have been used as well in prior models
and will be utilized as the output pressure for the LJV and RJV [17,18]. Actual values of pressures may fluctuate from one
artery to another and from one vein to another in the brain. Table 1 summarizes the given initial conditions as well as
additional information used for the simulation of the model.
2.5 Optimizations
The complexity of the brain cannot be stressed enough. The network model for the cerebral vasculature system and CSF
system shown in Figure 3 is a well-structured, simplified assumption of the actual human brain. When preliminary
simulations on the normal brain state with no CPP were conducted, inaccurate cerebral blood flow rates resulted in the
RICA, LICA, and BA as compared to measured physiological data [10,20].
2.5.1 Sensitivity Analysis on Microvasculature Resistance
The original network model was insufficient in accurately analyzing the hemodynamics of the cerebral vasculature.
After further analysis of the network model, the simulation data showed that the resistance in the microvasculature directly
affected the total cerebral blood flow. Numerous vessels containing very small diameters, the microvasculature has a
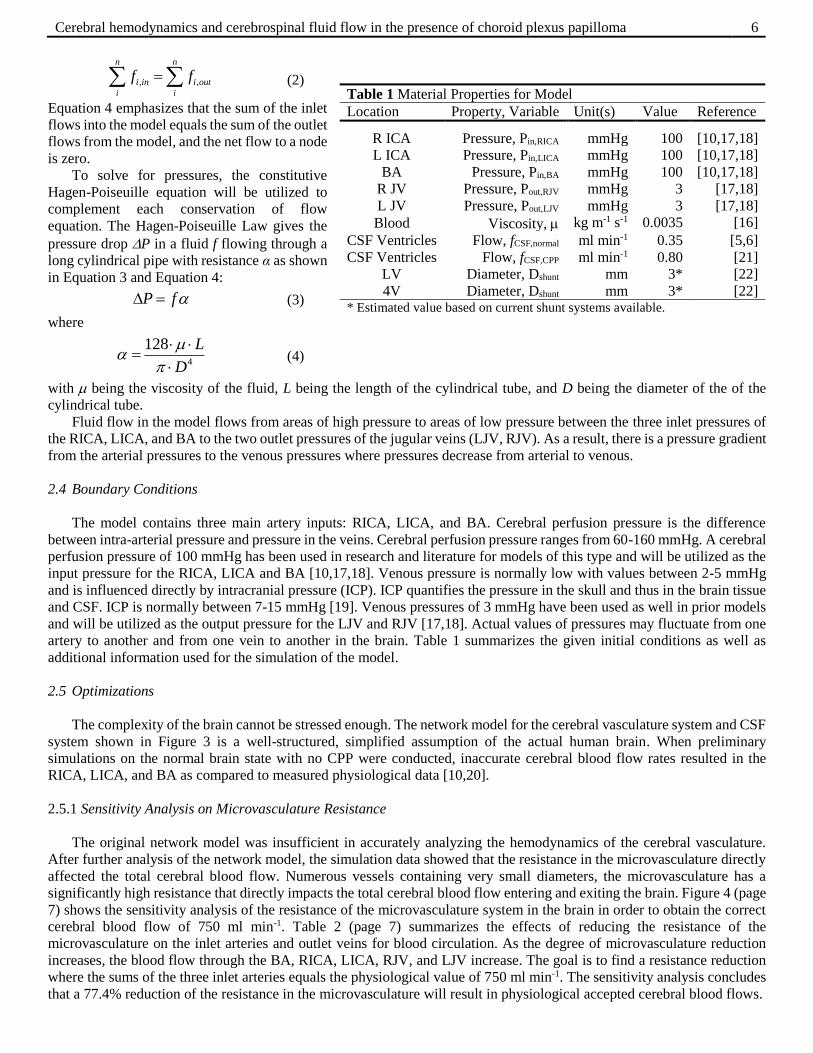
significantly high resistance that directly impacts the total cerebral blood flow entering and exiting the brain. Figure 4 (page
7) shows the sensitivity analysis of the resistance of the microvasculature system in the brain in order to obtain the correct
cerebral blood flow of 750 ml min-1. Table 2 (page 7) summarizes the effects of reducing the resistance of the
microvasculature on the inlet arteries and outlet veins for blood circulation. As the degree of microvasculature reduction
increases, the blood flow through the BA, RICA, LICA, RJV, and LJV increase. The goal is to find a resistance reduction
where the sums of the three inlet arteries equals the physiological value of 750 ml min-1. The sensitivity analysis concludes
that a 77.4% reduction of the resistance in the microvasculature will result in physiological accepted cerebral blood flows.
4
128 L
D
(4)
Table 1 Material Properties for Model
Location Property, Variable Unit(s) Value Reference
R ICA Pressure, Pin,RICA mmHg 100 [10,17,18]
L ICA Pressure, Pin,LICA mmHg 100 [10,17,18]
BA Pressure, Pin,BA mmHg 100 [10,17,18]
R JV Pressure, Pout,RJV mmHg 3 [17,18]
L JV Pressure, Pout,LJV mmHg 3 [17,18]
Blood Viscosity, kg m-1 s-1 0.0035 [16]
CSF Ventricles Flow, fCSF,normal ml min-1 0.35 [5,6]
CSF Ventricles Flow, fCSF,CPP ml min-1 0.80 [21]
LV Diameter, Dshunt mm 3* [22]
4V Diameter, Dshunt mm 3* [22] * Estimated value based on current shunt systems available.
M. Strama et al. 7
Figure 4. Sensitivity analysis of microvasculature resistances in
order to obtain physiological accurate cerebral blood flows. 77.4%
reduction of the resistance in microvasculature will result in
physiological accepted cerebral blood flows.
Table 2 Cerebral Microvasculature Sensitivity Analysis on Cerebral Blood Flow
Flow Rates (ml min-1)
MVR R
ICA
L
ICA BA RJV LJV
Inflow
* Residual
90.0 280 227 796 651 651 1303 553 80.0 188 152 482 411 411 822 72
78.0 176 142 448 383 383 766 16
77.5 173 140 440 376 376 753 3
77.4 173 140 438 375 375 750 0
77.3 172 139 437 374 374 748 2
77.0 170 138 432 370 370 740 10 75.0 161 130 404 347 347 695 55
70.0 140 114 348 301 301 602 148
MVR = Degree of microvasculature reduction.
Gray rows represent omitted data from Figure 4. * Ideal cerebral blood inflow rate is 750 ml min-1 as determined from
[10,20].
2.5.2 Establishing CSF Flow
To accurately account for CSF production, the flows in the CP are set to a value of 350 l min-1. The resistances are
found by utilizing the representative lengths and diameters of each flow connection within the network. The assumption of
using these characteristic lengths takes into account that the flow networks in the brain are complex and non-linear resulting
in a scaling of lengths and diameters.
2.5.3 ICP Determination
The pressure in the model is not exactly ICP, but is directly related because since the ventricles do not expand, the
pressure created in the CSF system is the driving force. A rough estimate of the ICP will be calculated by taking the average
of the pressures over the ventricles in the CSF system.
2.6 Model Simulations
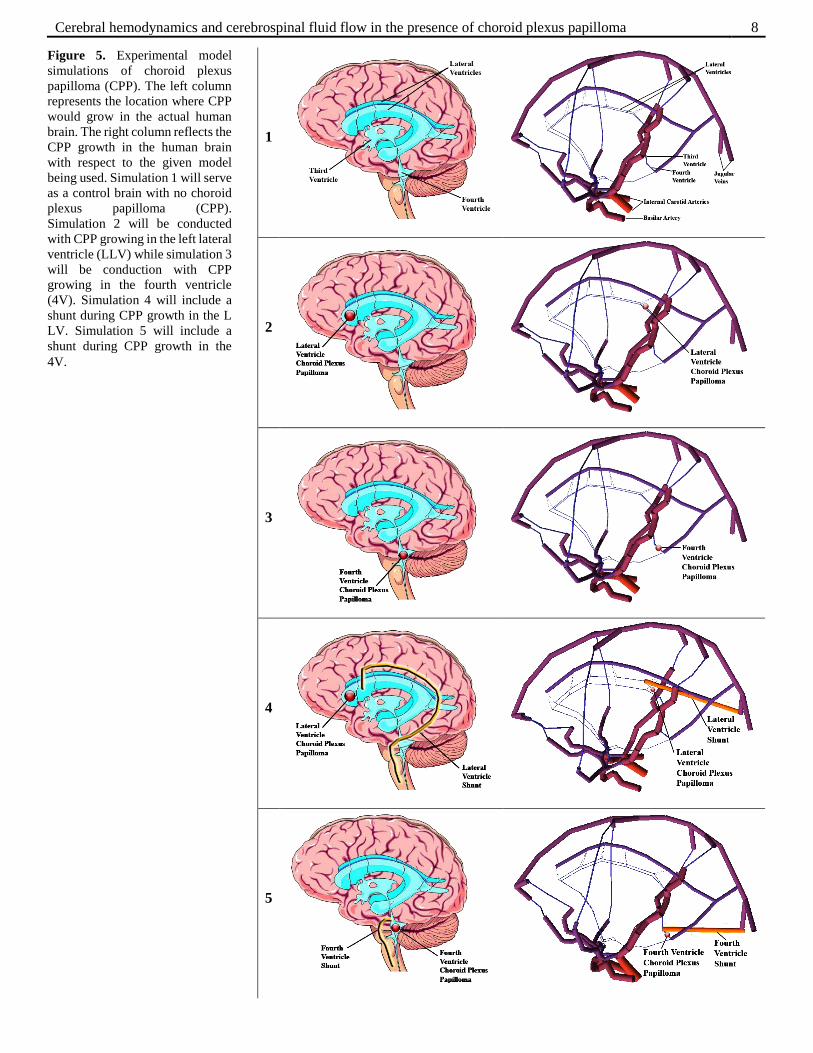
Five simulations will be conducted as shown in Figure 5 (page 8) to retrieve flow rates and pressure values: (1) a normal
state with no CPP, (2) CPP induced in the LLV, (3) CPP induced in the 4V, (4) treatment of CPP induced in the LLV with
a shunt, and (5) treatment of CPP induced in the 4V with a shunt. The simulation for the normal state with no CPP serves
as the control. When CPP is simulated in the LLV and 4V the CSF production by the CP goes up from 350 l min-1 to 2.08
ml min-1 as shown in clinical case studies [21]. CSF production of 800 l min-1 was used because the value is double the
normal production value and falls comfortably in the range of observed CSF production values. Incorporating a shunt with
the increased CSF production rate during CPP growth will help determine effective treatments by examining the pressures
and flows.
Cerebral hemodynamics and cerebrospinal fluid flow in the presence of choroid plexus papilloma 8
1
2
3
4
5
Figure 5. Experimental model
simulations of choroid plexus
papilloma (CPP). The left column
represents the location where CPP
would grow in the actual human
brain. The right column reflects the
CPP growth in the human brain
with respect to the given model
being used. Simulation 1 will serve
as a control brain with no choroid
plexus papilloma (CPP).
Simulation 2 will be conducted
with CPP growing in the left lateral
ventricle (LLV) while simulation 3
will be conduction with CPP
growing in the fourth ventricle
(4V). Simulation 4 will include a
shunt during CPP growth in the L
LV. Simulation 5 will include a
shunt during CPP growth in the
4V.
M. Strama et al. 9
3. Results
While the microvasculature of the cerebral blood flow is modified, the CSF system will remain unaffected by these
modifications. CSF circulates independently of the cerebral blood flow and its secretion is governed by the CP. Thus, when
the CSF system is modified, the cerebral vasculature system remains unaffected. The latter justifies why making the flow a
constant value of 350 l min-1 for normal CSF production will not impact the flows through the rest of the network.
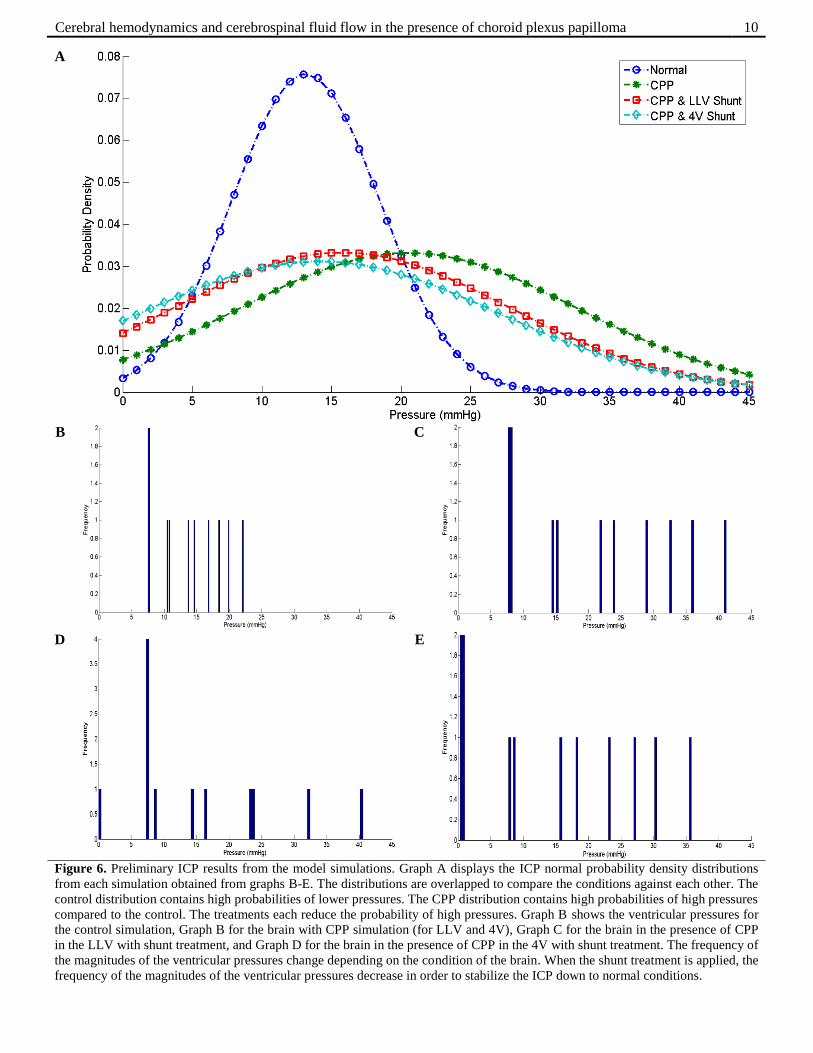
3.1 ICP Profiles
Figure 6 (page 10) shows the ICP pressure profiles obtained for the control brain with no CPP, the experimental brains
with CPP, and the experimental brains with CPP in the presence of the shunt treatment from the model. The overall flow
profiles remain relatively unchanged and are omitted while the ventricular pressure profiles show a significant change
between the simulation conditions. With CPP, the pressures in the brain increase in magnitude and frequency compared to
the brain without CPP and decrease when a shunt is applied.
Table 3 analyzes the ventricular pressure profiles between the conditions by showing the ICP pressure for each
ventricular pressure profile. In the normal brain, the model estimated an ICP value of 13.15 mmHg which falls into the
normal range of ICP values for a healthy brain without external conditions. In the CPP inflicted brain, the model estimated
an ICP value of 20.53 mmHg which falls above the normal range of ICP values. When the shunt treatment is applied to the
CPP growth area in the LLV, the ICP value falls from the unhealthy value of 20.53 mmHg to a relatively normal value of
15.75 mmHg and to 14.13 mmHg when the shunt is applied to the CPP growth area in the 4V.
3.2 Conservation of CSF Flow
The preliminary results of the model suggest that the simulations may physiologically model actual cerebral
hemodynamics and onset stages of CPP based on overviews of the cerebral vasculature system and CSF system. Further
analysis of the CSF system is undertaken to acquire more insight of CSF dynamics.
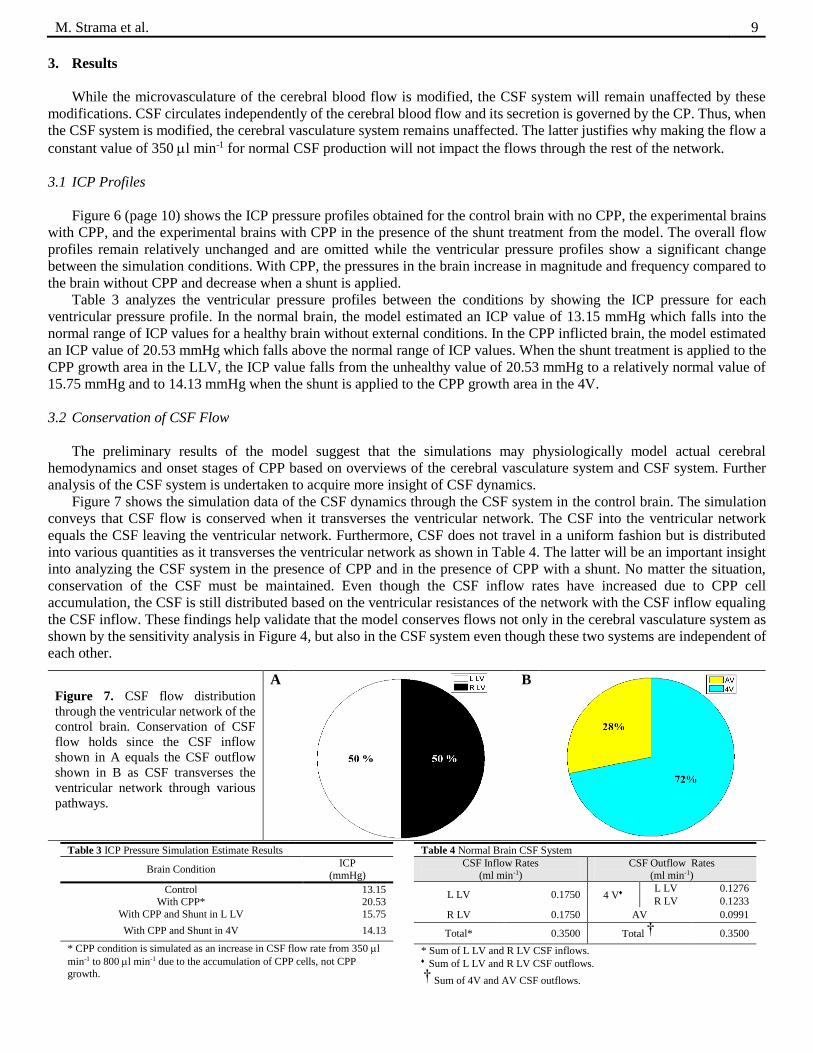
Figure 7 shows the simulation data of the CSF dynamics through the CSF system in the control brain. The simulation
conveys that CSF flow is conserved when it transverses the ventricular network. The CSF into the ventricular network
equals the CSF leaving the ventricular network. Furthermore, CSF does not travel in a uniform fashion but is distributed
into various quantities as it transverses the ventricular network as shown in Table 4. The latter will be an important insight
into analyzing the CSF system in the presence of CPP and in the presence of CPP with a shunt. No matter the situation,
conservation of the CSF must be maintained. Even though the CSF inflow rates have increased due to CPP cell
accumulation, the CSF is still distributed based on the ventricular resistances of the network with the CSF inflow equaling
the CSF inflow. These findings help validate that the model conserves flows not only in the cerebral vasculature system as
shown by the sensitivity analysis in Figure 4, but also in the CSF system even though these two systems are independent of
each other.
Figure 7. CSF flow distribution
through the ventricular network of the
control brain. Conservation of CSF
flow holds since the CSF inflow
shown in A equals the CSF outflow
shown in B as CSF transverses the
ventricular network through various
pathways.
A
B
Table 3 ICP Pressure Simulation Estimate Results
Brain Condition ICP
(mmHg)
Control 13.15
With CPP* 20.53
With CPP and Shunt in L LV 15.75
With CPP and Shunt in 4V 14.13
* CPP condition is simulated as an increase in CSF flow rate from 350 l
min-1 to 800 l min-1 due to the accumulation of CPP cells, not CPP
growth.
Table 4 Normal Brain CSF System
CSF Inflow Rates
(ml min-1)
CSF Outflow Rates
(ml min-1)
L LV 0.1750 4 V L LV 0.1276
R LV 0.1233
R LV 0.1750 AV 0.0991
Total* 0.3500 Total † 0.3500
* Sum of L LV and R LV CSF inflows. Sum of L LV and R LV CSF outflows.
† Sum of 4V and AV CSF outflows.
Cerebral hemodynamics and cerebrospinal fluid flow in the presence of choroid plexus papilloma 10
A
B
C
D
E
Figure 6. Preliminary ICP results from the model simulations. Graph A displays the ICP normal probability density distributions
from each simulation obtained from graphs B-E. The distributions are overlapped to compare the conditions against each other. The
control distribution contains high probabilities of lower pressures. The CPP distribution contains high probabilities of high pressures
compared to the control. The treatments each reduce the probability of high pressures. Graph B shows the ventricular pressures for
the control simulation, Graph B for the brain with CPP simulation (for LLV and 4V), Graph C for the brain in the presence of CPP
in the LLV with shunt treatment, and Graph D for the brain in the presence of CPP in the 4V with shunt treatment. The frequency of
the magnitudes of the ventricular pressures change depending on the condition of the brain. When the shunt treatment is applied, the
frequency of the magnitudes of the ventricular pressures decrease in order to stabilize the ICP down to normal conditions.
M. Strama et al. 11
3.3 Simulation Results
Since the preliminary data validates that the model conserves flows in both the cerebral vasculature system as well as
the CSF system, further investigation into the CSF system may be explored. As described previously, the CPP growth will
be analyzed in the LLV and the 4V along with shunt treatments in each respective CPP growth area.
3.3.1 ICP Dynamics
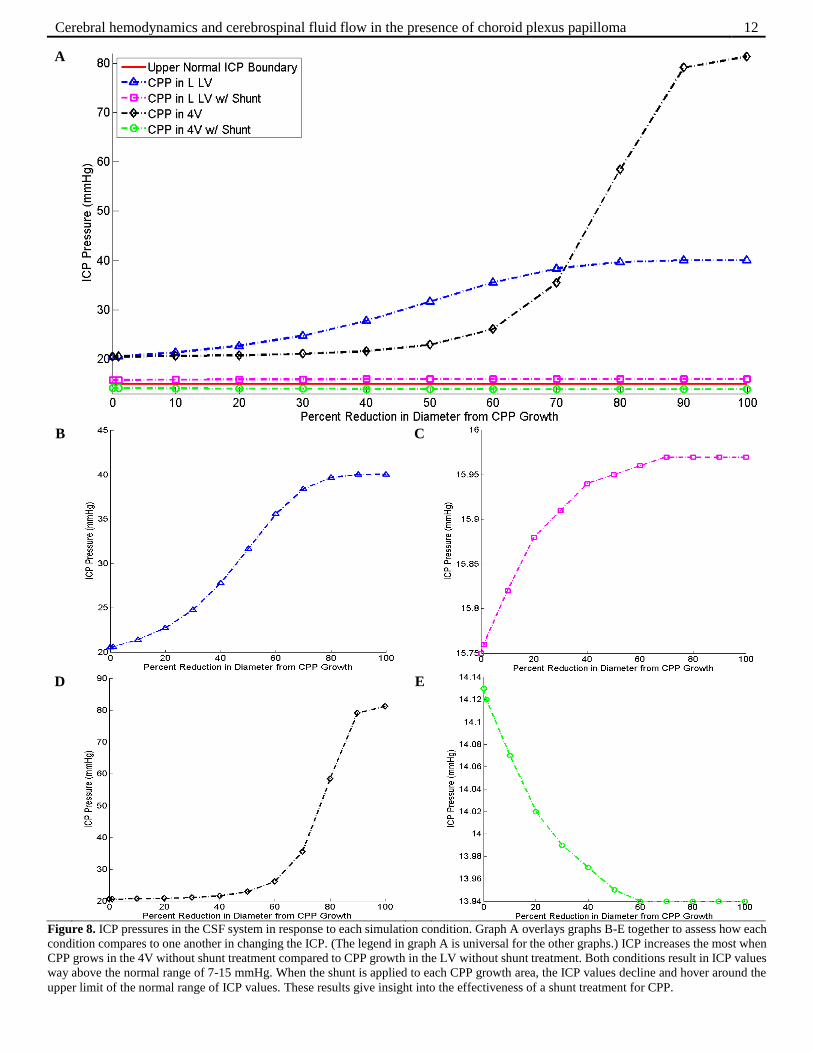
Figure 8 (page 12) displays the ICP pressures in the CSF system in response to each simulation condition. When CPP
grows in the LLV and the 4V, the ICP increases. When the shunt is applied to the area of CPP growth, the ICP decreases to
values around the normal ICP range for humans (7-15 mmHg). These results give insight that shunt treatments may be
effective in stabilizing the CSF system in the presence of CPP growth. To gain further insight into the effectiveness of
shunts during CPP growth, analysis of the CSF flows for each condition must be undertaken.
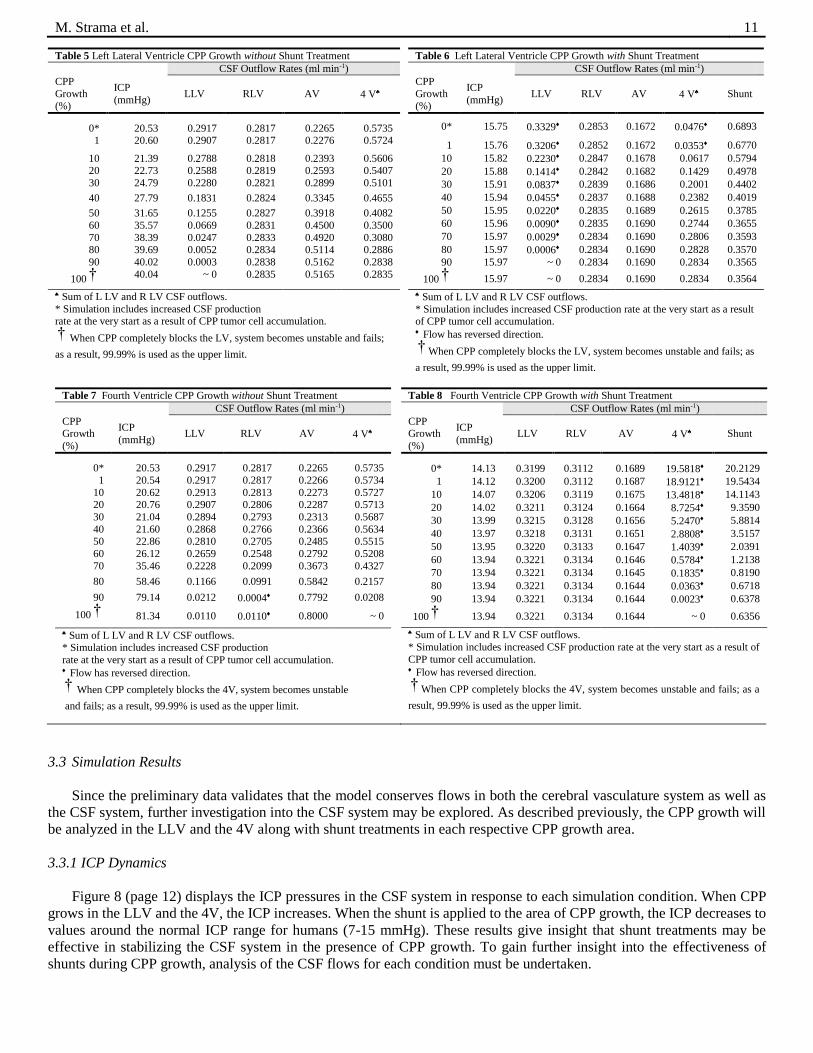
Table 5 Left Lateral Ventricle CPP Growth without Shunt Treatment
CSF Outflow Rates (ml min-1)
CPP
Growth (%)
ICP
(mmHg) LLV RLV AV 4 V
0* 20.53 0.2917 0.2817 0.2265 0.5735 1 20.60 0.2907 0.2817 0.2276 0.5724
10 21.39 0.2788 0.2818 0.2393 0.5606 20 22.73 0.2588 0.2819 0.2593 0.5407
30 24.79 0.2280 0.2821 0.2899 0.5101
40 27.79 0.1831 0.2824 0.3345 0.4655
50 31.65 0.1255 0.2827 0.3918 0.4082
60 35.57 0.0669 0.2831 0.4500 0.3500
70 38.39 0.0247 0.2833 0.4920 0.3080 80 39.69 0.0052 0.2834 0.5114 0.2886
90 40.02 0.0003 0.2838 0.5162 0.2838
100 † 40.04 ~ 0 0.2835 0.5165 0.2835
Sum of L LV and R LV CSF outflows.
* Simulation includes increased CSF production rate at the very start as a result of CPP tumor cell accumulation.
† When CPP completely blocks the LV, system becomes unstable and fails;
as a result, 99.99% is used as the upper limit.
Table 6 Left Lateral Ventricle CPP Growth with Shunt Treatment
CSF Outflow Rates (ml min-1)
CPP
Growth (%)
ICP
(mmHg) LLV RLV AV 4 V Shunt
0* 15.75 0.3329 0.2853 0.1672 0.0476 0.6893
1 15.76 0.3206 0.2852 0.1672 0.0353 0.6770
10 15.82 0.2230 0.2847 0.1678 0.0617 0.5794
20 15.88 0.1414 0.2842 0.1682 0.1429 0.4978
30 15.91 0.0837 0.2839 0.1686 0.2001 0.4402
40 15.94 0.0455 0.2837 0.1688 0.2382 0.4019
50 15.95 0.0220 0.2835 0.1689 0.2615 0.3785
60 15.96 0.0090 0.2835 0.1690 0.2744 0.3655
70 15.97 0.0029 0.2834 0.1690 0.2806 0.3593
80 15.97 0.0006 0.2834 0.1690 0.2828 0.3570
90 15.97 ~ 0 0.2834 0.1690 0.2834 0.3565
100 † 15.97 ~ 0 0.2834 0.1690 0.2834 0.3564
Sum of L LV and R LV CSF outflows.
* Simulation includes increased CSF production rate at the very start as a result of CPP tumor cell accumulation. Flow has reversed direction.
† When CPP completely blocks the LV, system becomes unstable and fails; as
a result, 99.99% is used as the upper limit.
Table 7 Fourth Ventricle CPP Growth without Shunt Treatment
CSF Outflow Rates (ml min-1)
CPP Growth
(%)
ICP
(mmHg) LLV RLV AV 4 V
0* 20.53 0.2917 0.2817 0.2265 0.5735
1 20.54 0.2917 0.2817 0.2266 0.5734
10 20.62 0.2913 0.2813 0.2273 0.5727 20 20.76 0.2907 0.2806 0.2287 0.5713
30 21.04 0.2894 0.2793 0.2313 0.5687
40 21.60 0.2868 0.2766 0.2366 0.5634 50 22.86 0.2810 0.2705 0.2485 0.5515
60 26.12 0.2659 0.2548 0.2792 0.5208
70 35.46 0.2228 0.2099 0.3673 0.4327
80 58.46 0.1166 0.0991 0.5842 0.2157
90 79.14 0.0212 0.0004 0.7792 0.0208
100 † 81.34 0.0110 0.0110 0.8000 ~ 0
Sum of L LV and R LV CSF outflows. * Simulation includes increased CSF production
rate at the very start as a result of CPP tumor cell accumulation. Flow has reversed direction.
† When CPP completely blocks the 4V, system becomes unstable
and fails; as a result, 99.99% is used as the upper limit.
Table 8 Fourth Ventricle CPP Growth with Shunt Treatment
CSF Outflow Rates (ml min-1)
CPP Growth
(%)
ICP
(mmHg) LLV RLV AV 4 V Shunt
0* 14.13 0.3199 0.3112 0.1689 19.5818 20.2129
1 14.12 0.3200 0.3112 0.1687 18.9121 19.5434
10 14.07 0.3206 0.3119 0.1675 13.4818 14.1143
20 14.02 0.3211 0.3124 0.1664 8.7254 9.3590
30 13.99 0.3215 0.3128 0.1656 5.2470 5.8814
40 13.97 0.3218 0.3131 0.1651 2.8808 3.5157
50 13.95 0.3220 0.3133 0.1647 1.4039 2.0391
60 13.94 0.3221 0.3134 0.1646 0.5784 1.2138
70 13.94 0.3221 0.3134 0.1645 0.1835 0.8190
80 13.94 0.3221 0.3134 0.1644 0.0363 0.6718
90 13.94 0.3221 0.3134 0.1644 0.0023 0.6378
100 † 13.94 0.3221 0.3134 0.1644 ~ 0 0.6356
Sum of L LV and R LV CSF outflows.
* Simulation includes increased CSF production rate at the very start as a result of
CPP tumor cell accumulation. Flow has reversed direction.
† When CPP completely blocks the 4V, system becomes unstable and fails; as a
result, 99.99% is used as the upper limit.
Cerebral hemodynamics and cerebrospinal fluid flow in the presence of choroid plexus papilloma 12
A
B
C
D
E
Figure 8. ICP pressures in the CSF system in response to each simulation condition. Graph A overlays graphs B-E together to assess how each
condition compares to one another in changing the ICP. (The legend in graph A is universal for the other graphs.) ICP increases the most when
CPP grows in the 4V without shunt treatment compared to CPP growth in the LV without shunt treatment. Both conditions result in ICP values
way above the normal range of 7-15 mmHg. When the shunt is applied to each CPP growth area, the ICP values decline and hover around the
upper limit of the normal range of ICP values. These results give insight into the effectiveness of a shunt treatment for CPP.
M. Strama et al. 13
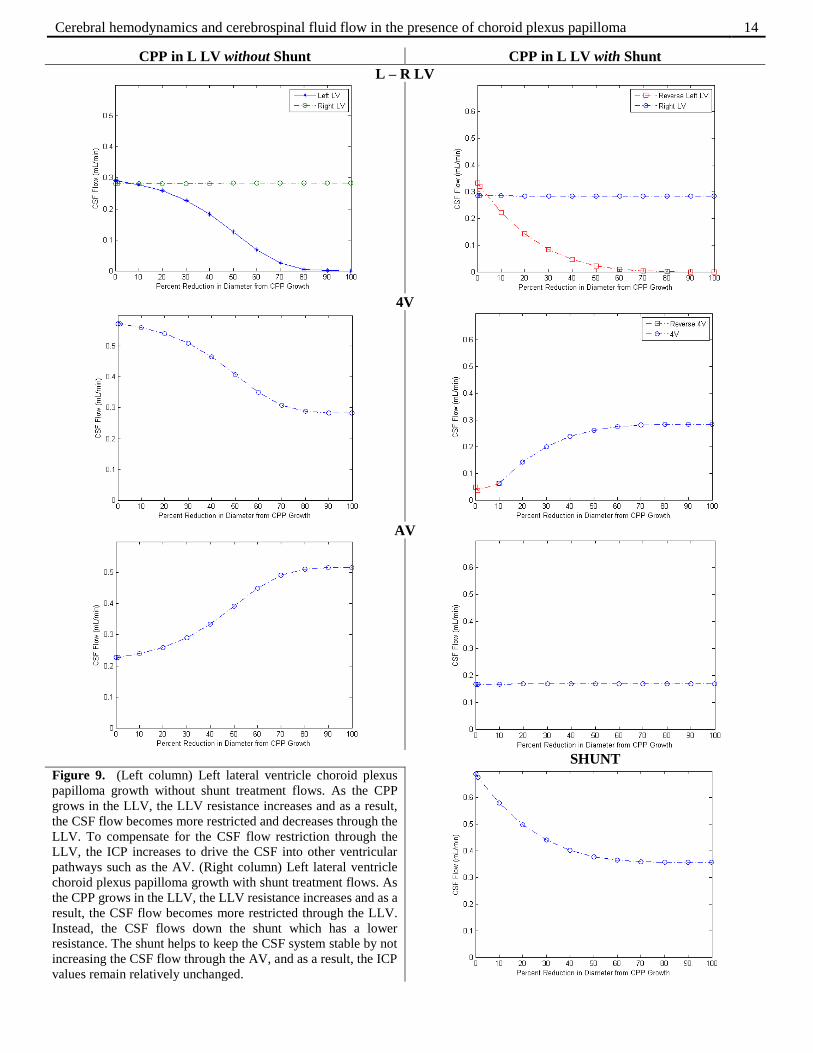
3.3.2 CPP in the LLV without Shunt
Figure 9 (page 14) provides quantitative results of the CSF system in the presence of CPP growth in the LLV. As the
CPP grows in the LLV, the ICP increases to accommodate the decrease in flow through the LLV. Since less CSF is flowing
through the LLV, the CSF flowing through the 4V decreases too. To compensate for this decrease, the CSF flow in the AV
increases. The RLV remains relatively unaffected. Table 5 displays that at any given percent reduction in diameter from
CPP growth, the sum of CSF in the 4V and in the AV equals the CSF inflow of 800 l min-1.
3.3.3 CPP in the LLV with Shunt
Figure 9 also provides quantitative results of the CSF system in the presence of CPP growth in the LV and in response
to the shunt treatment. As the CPP grows in the LLV, the ICP increases at a slower rate due to the presence of the shunt.
The CSF is being restricted from flowing through the LLV due to the LLV’s increasing resistance. The shunt exhibits lower
resistance, so CSF will flow down the shunt instead of down the LLV. Due to the shunt, the CSF system remains stable
with relatively no increase in AV CSF flow. Table 6 displays that the ICP values remain slightly above the normal range of
ICP values.
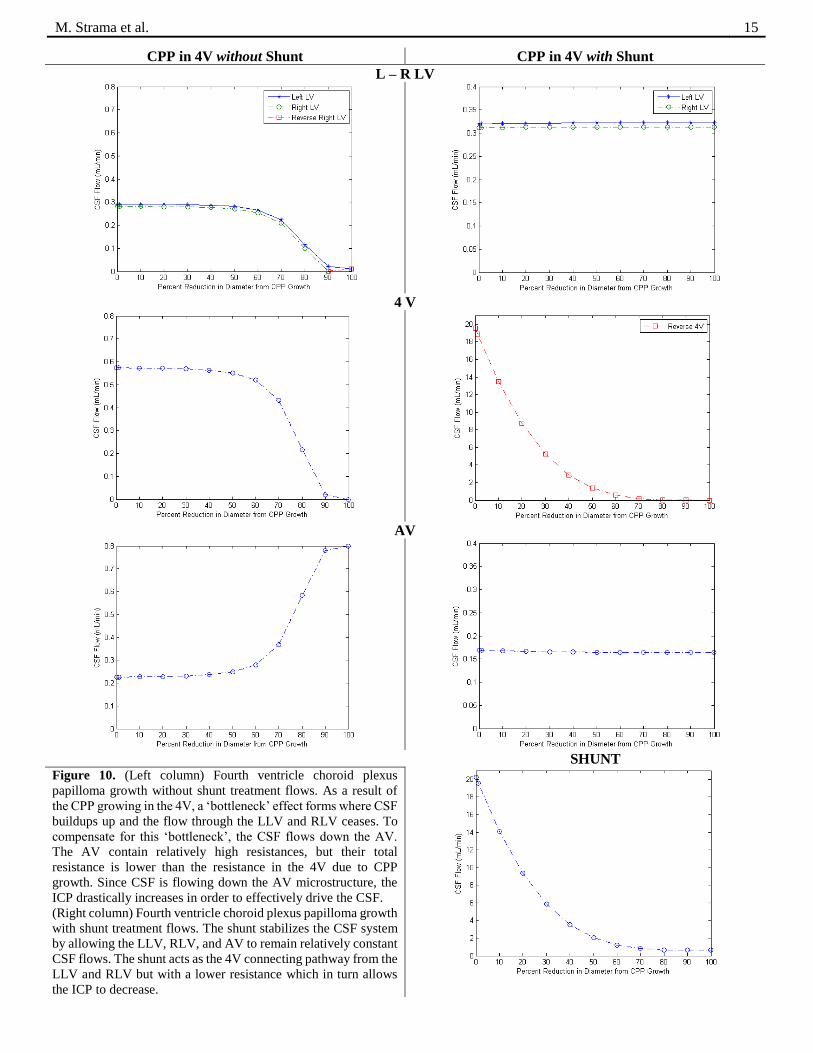
3.3.4 CPP in the 4V without Shunt
Figure 10 (page 15) provides quantitative results of the CSF system in the presence of CPP growth in the 4V. As the
CPP grows in the 4V, the ICP increases rapidly to accommodate the decrease in flow through the 4V. The 4V is essentially
the only exit for the CSF from the LLV and RLV. Since the 4V is increasing in resistance, the CSF will not flow through
it. Instead, the CSF will flow through the AV, which also contain high resistances. However, the AV has a lower total
resistance so the CSF will flow down these pathways to accommodate the blockage of the 4V by CPP. Since the RLV and
LLV drain into the 4V, CSF will similarly stop flowing through these pathways until all the CSF will flow through the AV.
As the AV in increasing in CSF flow, the ICP is drastically increasing to keep the CSF flowing through this relatively high
resistance pathways as shown in Table 7.
3.3.5 CPP in the 4V with Shunt
Figure 10 also provides quantitative results of the CSF system in the presence of CPP growth in the 4V and in response
to the shunt treatment. The shunt again helps stabilize the CSF system by keeping the CSF flow through the LLV, RLV,
and AV relatively constant. Due to this increased stability, the ICP decreases because the shunt effectively acts as the 4V
but with a lower resistance with reversal flows noted in Table 8.
3.3.6 CSF Flow Distribution Schematics
To further analyze the CSF flows through the CSF network, flow schematics for each simulation were constructed to
help visualize the CSF auto-regulation mechanisms as shown in Figure 11 (page 16).
4. Discussion
Once the microvasculature sensitivity analysis was performed and applied to the network, values obtained were close
to measured physiological values. For the control brain, the total cerebral vasculature blood inflow and outflow was 750.35
ml min-1, which compared well to the ideal cerebral vasculature volumetric blood flow rate of 750 ml min-1 [10, 20]. This
result validates the cerebral vasculature system model as accurate when accounting that the inflows need to equal the
outflows as can be seen in the Table 2 where the outflow though the RJV and LJV sum together to equal the sum of the
inflows from the RICA, LICA, and BA. The conservation holds for the CSF system as well. Furthermore, when the model
was applied to the CSF system, the simulation yielded an ICP of 13.15 mmHg, which falls comfortably in the ICP range for
a normal brain of 7-15 mmHg [19]. Since the validity of the model is established, the results obtained from the experimental
groups can be analyzed with more certainty.
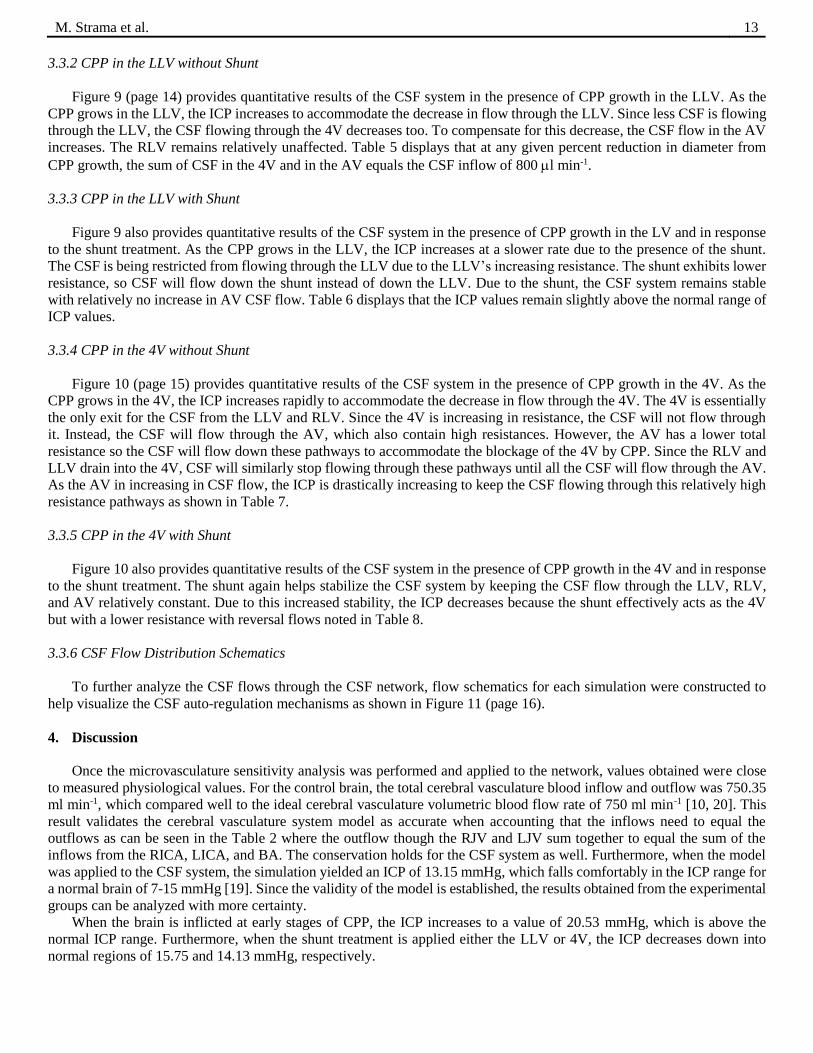
When the brain is inflicted at early stages of CPP, the ICP increases to a value of 20.53 mmHg, which is above the
normal ICP range. Furthermore, when the shunt treatment is applied either the LLV or 4V, the ICP decreases down into
normal regions of 15.75 and 14.13 mmHg, respectively.
Cerebral hemodynamics and cerebrospinal fluid flow in the presence of choroid plexus papilloma 14
CPP in L LV without Shunt CPP in L LV with Shunt
L – R LV
4V
AV
SHUNT
Figure 9. (Left column) Left lateral ventricle choroid plexus
papilloma growth without shunt treatment flows. As the CPP
grows in the LLV, the LLV resistance increases and as a result,
the CSF flow becomes more restricted and decreases through the
LLV. To compensate for the CSF flow restriction through the
LLV, the ICP increases to drive the CSF into other ventricular
pathways such as the AV. (Right column) Left lateral ventricle
choroid plexus papilloma growth with shunt treatment flows. As
the CPP grows in the LLV, the LLV resistance increases and as a
result, the CSF flow becomes more restricted through the LLV.
Instead, the CSF flows down the shunt which has a lower
resistance. The shunt helps to keep the CSF system stable by not
increasing the CSF flow through the AV, and as a result, the ICP
values remain relatively unchanged.
M. Strama et al. 15
CPP in 4V without Shunt CPP in 4V with Shunt
L – R LV
4 V
AV
SHUNT
Figure 10. (Left column) Fourth ventricle choroid plexus
papilloma growth without shunt treatment flows. As a result of
the CPP growing in the 4V, a ‘bottleneck’ effect forms where CSF
buildups up and the flow through the LLV and RLV ceases. To
compensate for this ‘bottleneck’, the CSF flows down the AV.
The AV contain relatively high resistances, but their total
resistance is lower than the resistance in the 4V due to CPP
growth. Since CSF is flowing down the AV microstructure, the
ICP drastically increases in order to effectively drive the CSF.
(Right column) Fourth ventricle choroid plexus papilloma growth
with shunt treatment flows. The shunt stabilizes the CSF system
by allowing the LLV, RLV, and AV to remain relatively constant
CSF flows. The shunt acts as the 4V connecting pathway from the
LLV and RLV but with a lower resistance which in turn allows
the ICP to decrease.
Cerebral hemodynamics and cerebrospinal fluid flow in the presence of choroid plexus papilloma 16
Normal Brain
CPP in LLV without Shunt
CPP in LLV with Shunt
CPP in 4V without Shunt
CPP in 4V with Shunt
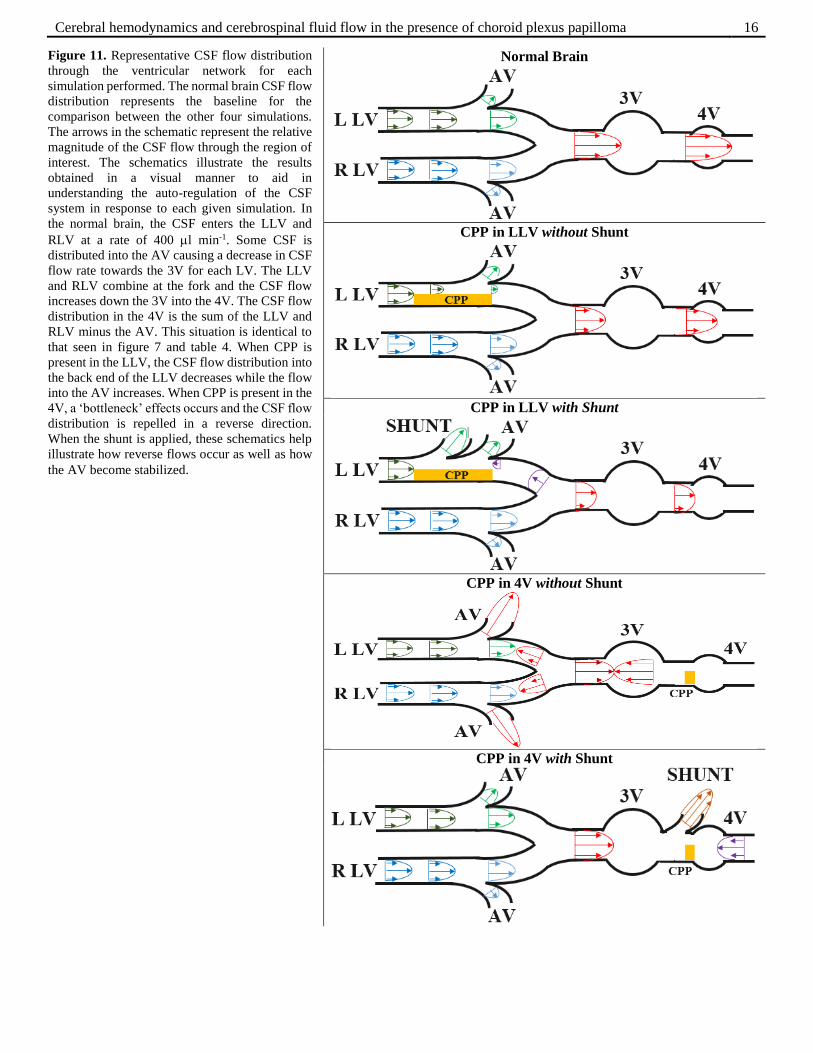
Figure 11. Representative CSF flow distribution
through the ventricular network for each
simulation performed. The normal brain CSF flow
distribution represents the baseline for the
comparison between the other four simulations.
The arrows in the schematic represent the relative
magnitude of the CSF flow through the region of
interest. The schematics illustrate the results
obtained in a visual manner to aid in
understanding the auto-regulation of the CSF
system in response to each given simulation. In
the normal brain, the CSF enters the LLV and
RLV at a rate of 400 l min-1. Some CSF is
distributed into the AV causing a decrease in CSF
flow rate towards the 3V for each LV. The LLV
and RLV combine at the fork and the CSF flow
increases down the 3V into the 4V. The CSF flow
distribution in the 4V is the sum of the LLV and
RLV minus the AV. This situation is identical to
that seen in figure 7 and table 4. When CPP is
present in the LLV, the CSF flow distribution into
the back end of the LLV decreases while the flow
into the AV increases. When CPP is present in the
4V, a ‘bottleneck’ effects occurs and the CSF flow
distribution is repelled in a reverse direction.
When the shunt is applied, these schematics help
illustrate how reverse flows occur as well as how
the AV become stabilized.
M. Strama et al. 17
When further analysis into the CSF system as CPP develops is explored along with the shunt treatment, reverse flows
occur. Flows are controlled by pressure gradients where positive flows are defined as a flow going from an area of high
pressure to an area of low pressure. The flow connections were predetermined based on the construction of the brain model.
Reverse flows are more prevalent in the shunt treatment systems due to the fact that the pressure at the outlet of the shunt is
set to zero. The pressure at the outlet is set to zero to take into account that the shunt length is not realistic in this model.
Shunt extend all the way down to the abdomen or heart given the type of shunt [22]. Thus in the conservation balance
equations, these reverse flows will be negative. An example is in Figure 17 where the shunt flow plus the AV flow minus
the reversal 4V flow equals the total CSF inflow of 800 l min-1.
When CPP grows in the LLV or in the 4V, the ICP grows uncontrollably. The ICP increases since one of the CSF flow
pathways is being occluded. The increase in ICP generates a driving force for the CSF to flow through the AV. The AV is
part of the SAS which contains high resistance so flow through these structures is low. The fact that the flow is increasing
through these structures highlights the CSF system’s auto-regulation ability to accommodate the increase in ICP. To have
more flow occurring in the AV causes the SAS structure to expand and will lead to major health problems or death [23].
When the shunt is applied to the LLV, the shunt is most effective after about 40% CPP growth. Under 40% CPP growth,
CSF flow through the 4V is limited while the AV and RLV flows are maintained. The ICP also begins to climax and settles
at a constant value with relatively no change. When the shunt is applied to the 4V, the shunt is effective from the very onset
of CPP growth. The LLV, RLV, and AV flows remain constant and the ICP decreases to a constant value. The reason why
the shunt is immediately effective is due to the ‘bottleneck’ effect that the CPP creates in the 4V.
5. Conclusion
As a result of this simulation, the CSF flow patterns inside the ventricular and subarachnoidal regions during CPP
growth were analyzed as well as the auto-regulation of the CSF system during treatment of CPP via insertion of a shunt. By
reducing the diameter of the area affected in the CSF system due to CPP growth, the details of how the CSF flows respond
became clear. ICP increases with increasing CPP growth until a point where human health is severely deteriorated by the
flow distribution within the CSF system as a result of the CSF auto-regulation mechanisms.
6. References
[1]. Kornieko VN, Pronin IN (2009) Diagnostic neuroradiology. Springer Verlag. ISNB: 3540756523
[2]. Razzaq AA, Chishti KN (2003) Giant Choroid Plexus Papilloma of the Third Ventricle. J Pak Med Assoc 573:575
[3]. Ek CJ, Dziegielewska KM, Saunders NR (2005) Development of the blood-cerebrospinal fluid barrier. In W Zheng &
A Chodobski (Eds.), The blood-cerebrospinal fluid barrier (pp. 3-23). Boca Raton, FL: T&F informa
[4]. Adunka O, Buchman C (2010) Otology, neurotology, and lateral skull base surgery: an illustrated handbook. Thieme.
ISBN: 9783131496218
[5]. Brown PD, Speake T, Davies SL, Millar ID (2005) Ion transporters and channels involved in csf formation. In W
Zheng & A Chodobski (Eds.), The blood-cerebrospinal fluid barrier (pp. 119-145). Boca Raton, FL: T&F informa
[6]. Linninger AA, Tsakiris C, Zhu DC, Xenos M, Roycewicz P, Danziger Z, Penn R (2005) Pulsatile cerebrospinal fluid
dynamics in the human brain. IEEE Trans Biomed Imaging 52(4):557-565
[7]. Szmydynger-Chodobska J, Chodobski A (2005) Peptide-mediated regulation of csf formation and blood flow to the
choroid plexus. In W Zheng & A Chodobski (Eds.), The blood-cerebrospinal fluid barrier (pp. 119-145). Boca
Raton, FL: T&F informa
[8]. Prescott L, Brightman MW (2005) Normal and pathologically altered structures of the choroid plexus. In W Zheng &
A Chodobski (Eds.), The blood-cerebrospinal fluid barrier (pp. 119-145). Boca Raton, FL: T&F informa
[9]. Twinning P, Zuccolllo J, Clewes J, Swallow J (1991) Fetal choroid plexus cysts: a prospective study and review of
the literature. Br J Radiol 64:98-102
[10]. Mchedlishvili G (1986) Arterial behavior and blood circulation in the brain. Bevan JA (ED). New York, NY:
Plenum Press
[11]. Devault K, Gremaud PA, Novak V, Olufsen MS, Vernieres G, Zhao P (2008) Blood flow in the circle of willis:
modeling and calibration. Multiscale Model Simul 7(2):888-909
[12]. Bear MF, Connors BW, Paradiso MA (2007) Neuroscience exploring the brain (3rd ed). Baltimore, MD: Williams
& Wilkins
[13]. Waxman S.G. (2010). Chapter 11. Ventricles and Coverings of the Brain. In S.G. Waxman (Ed), Clinical
Neuroanatomy, 26e. Retrieved October 19, 2013 from
Cerebral hemodynamics and cerebrospinal fluid flow in the presence of choroid plexus papilloma 18
http://www.accessmedicine.com.proxy.cc.uic.edu/content.aspx?aID=5273544.
[14]. Herkenham M (2005) Involvement of the choroid plexus and the cerebrospinal fluid in immune molecule signaling
in the central nervous system. In W Zheng & A Chodobski (Eds.), The blood-cerebrospinal fluid barrier (pp. 119-
145). Boca Raton, FL: T&F informa
[15]. LifeART Collection Images (2001) Lateral view of the brain and brainstem illustrating the ventricular system of
these structures. Baltimore, MD: Williams & Wilkins
[16]. Truskey GA, Yuan F, Katz DF (2009) Transport phenomena in biological systems (2nd ed). Upper Saddle River, NJ:
Pearson Prentice Hall
[17]. Cipolla MJ (2009) The cerebral circulation. San Rafael (CA): Morgan & Claypool Life Sciences
[18]. Linninger AA, Xenos M, Sweetman B, Ponkshe S, Guo X, Penn R (2009) A mathematical model of blood,
cerebrospinal fluid and brain dynamics. J Math Biol 59:729-759
[19]. Ghajar J (2000) Traumatic brain injury. Lancet 356 (9233): 923–9
[20]. Zhao M, Amin-Hanjani S, Ruland S, Curcio AP, Ostergren L, Charbel FT (2007) Regional cerebral blood flow using
quantitative mr angiography. Amer J Neuroradio 28:1470-1473
[21]. Nimjee SM, Powers CJ, McLendon RE, Grant GA, Fuchs HE (2010) Single-stage bilateral choroid plexectomy for
choroid plexus pipilloma in a patient presenting with high cerebrospinal fluid output. J Neurosurg Pediatrics
5:342-345
[22]. Hakim S (1975) Ventricular shunt having a variable pressure valve. Patent 3,886,948. 3 June 1975
[23]. Dunn LT (2002) Raised intracranial pressure. J Neurol Neurosurg Psychiatry 73:i23-i27
Recommended