Esa Kurkela
VTT Technical Research Centre of Finland LtdCOMSYN workshop on 2nd generation biofuelsStuttgart 18.4.2018
Challenges and opportunitiesof biofuel production in Finland
223/04/2018 2
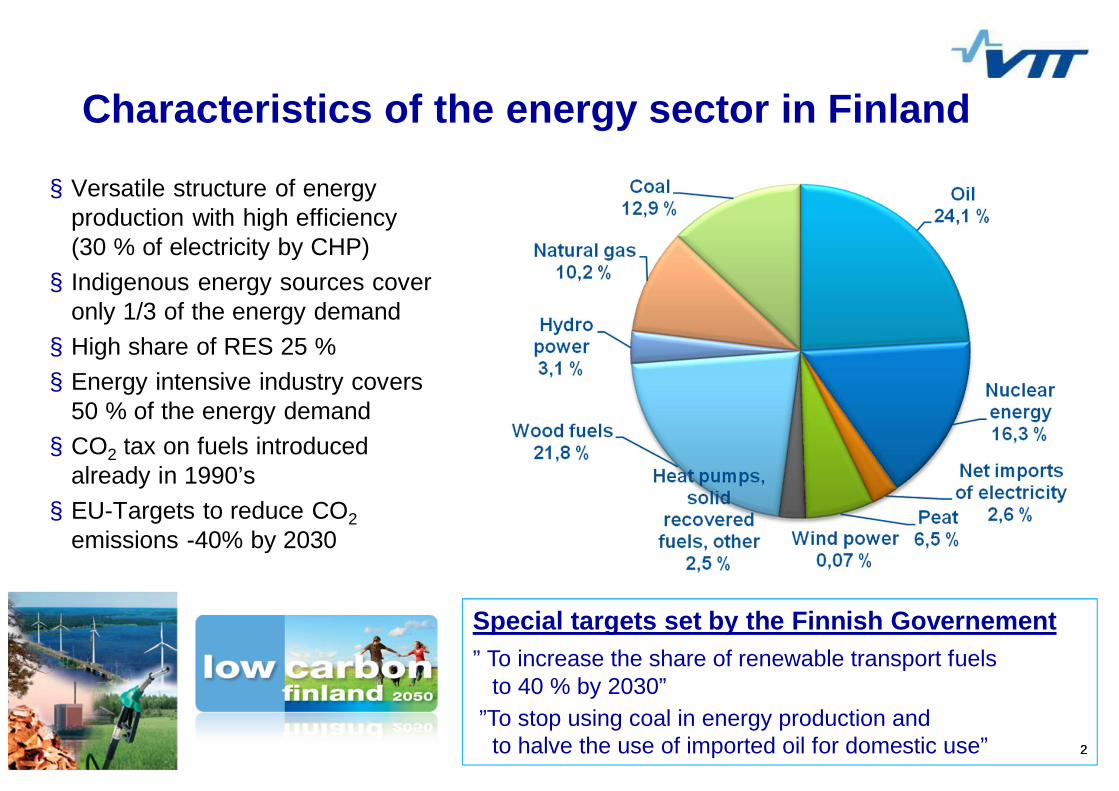
Characteristics of the energy sector in Finland
§ Versatile structure of energyproduction with high efficiency(30 % of electricity by CHP)§ Indigenous energy sources cover
only 1/3 of the energy demand§ High share of RES 25 %§ Energy intensive industry covers
50 % of the energy demand§ CO2 tax on fuels introduced
already in 1990’s§ EU-Targets to reduce CO2
emissions -40% by 2030
Special targets set by the Finnish Governement” To increase the share of renewable transport fuels
to 40 % by 2030””To stop using coal in energy production and
to halve the use of imported oil for domestic use”
3
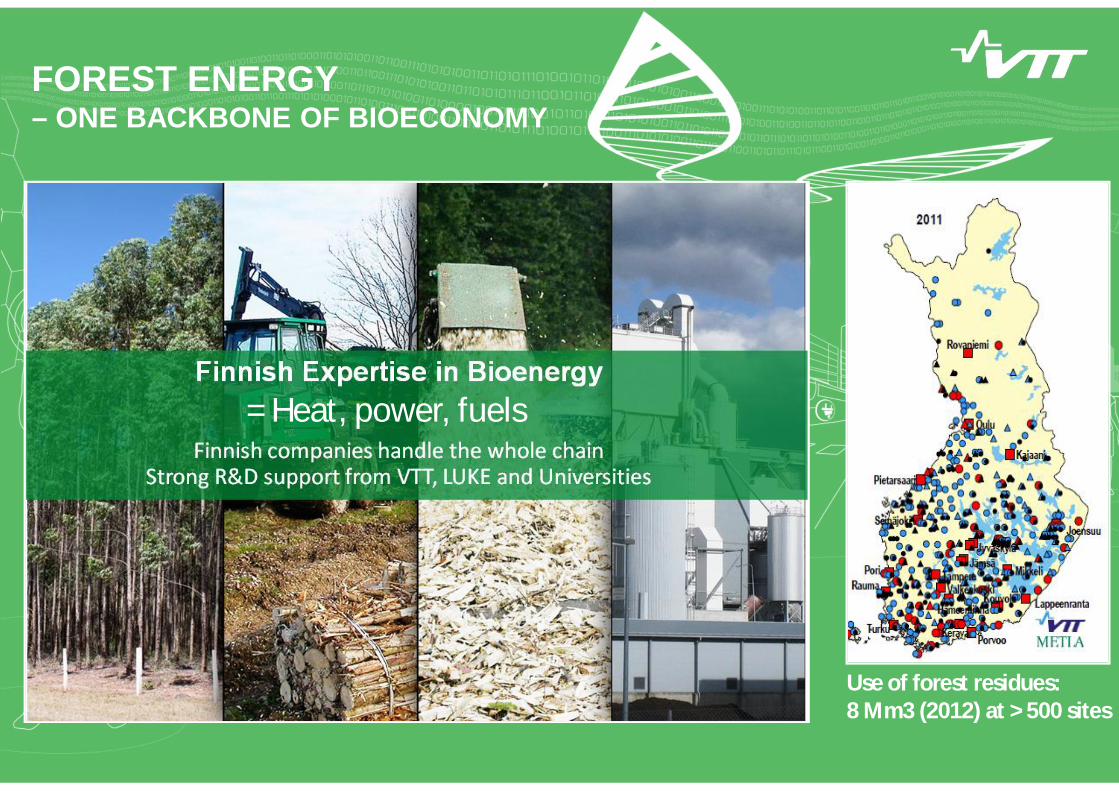
Use of forest residues:8 Mm3 (2012) at > 500 sites
FOREST ENERGY– ONE BACKBONE OF BIOECONOMY
= Heat, power, fuels
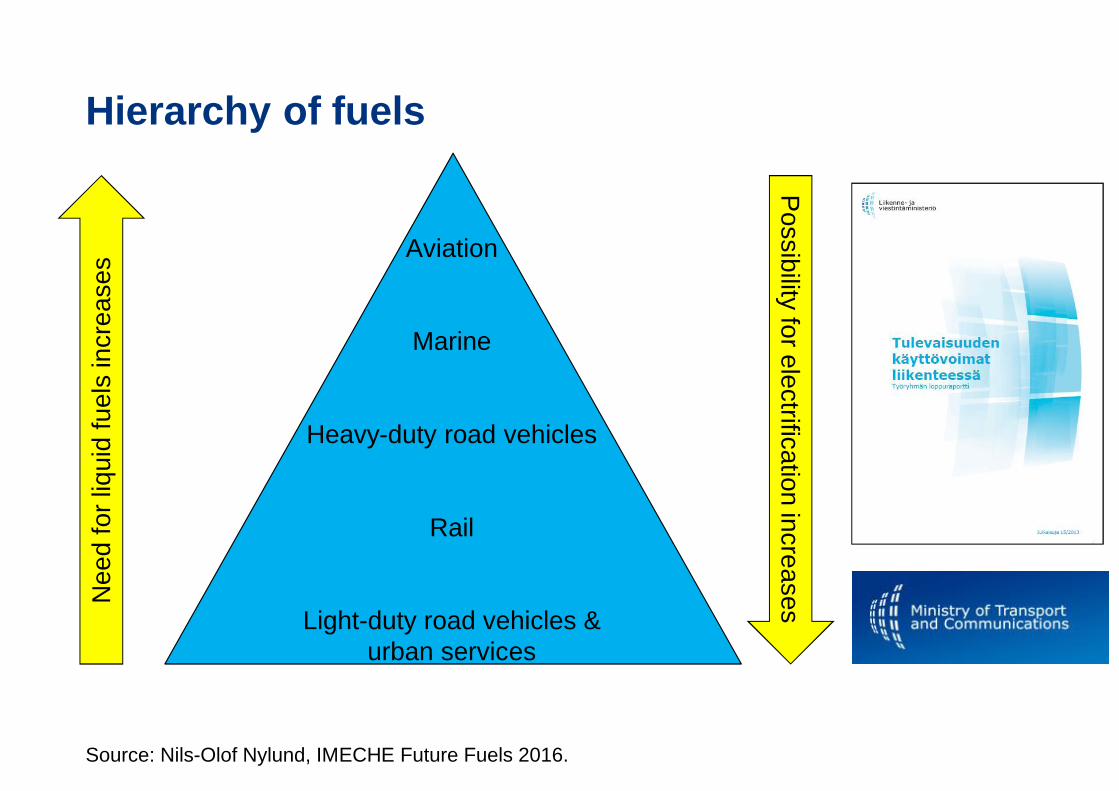
Hierarchy of fuels
Aviation
Marine
Heavy-duty road vehicles
Rail
Light-duty road vehicles &urban services
Nee
dfo
rliq
uid
fuel
sin
crea
ses
Possibility
forelectrificationincreases
Source: Nils-Olof Nylund, IMECHE Future Fuels 2016.
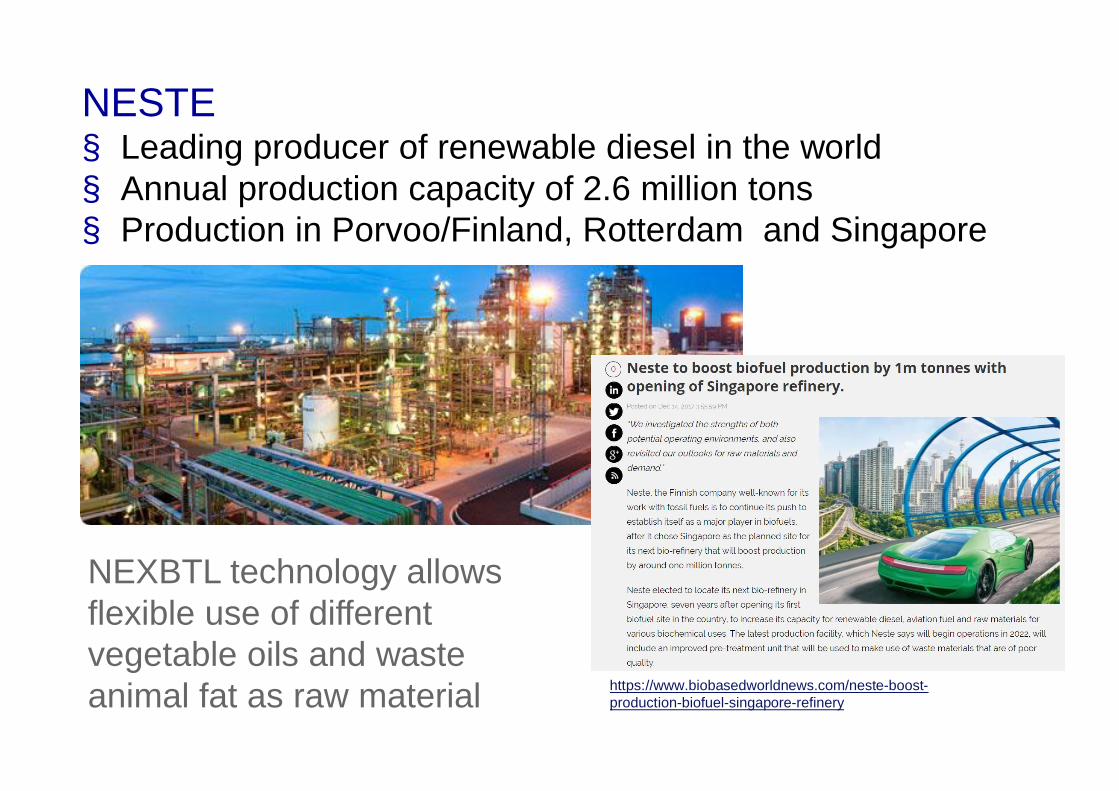
https://www.biobasedworldnews.com/neste-boost-production-biofuel-singapore-refinery
NESTE§ Leading producer of renewable diesel in the world§ Annual production capacity of 2.6 million tons§ Production in Porvoo/Finland, Rotterdam and Singapore
NEXBTL technology allowsflexible use of differentvegetable oils and wasteanimal fat as raw material
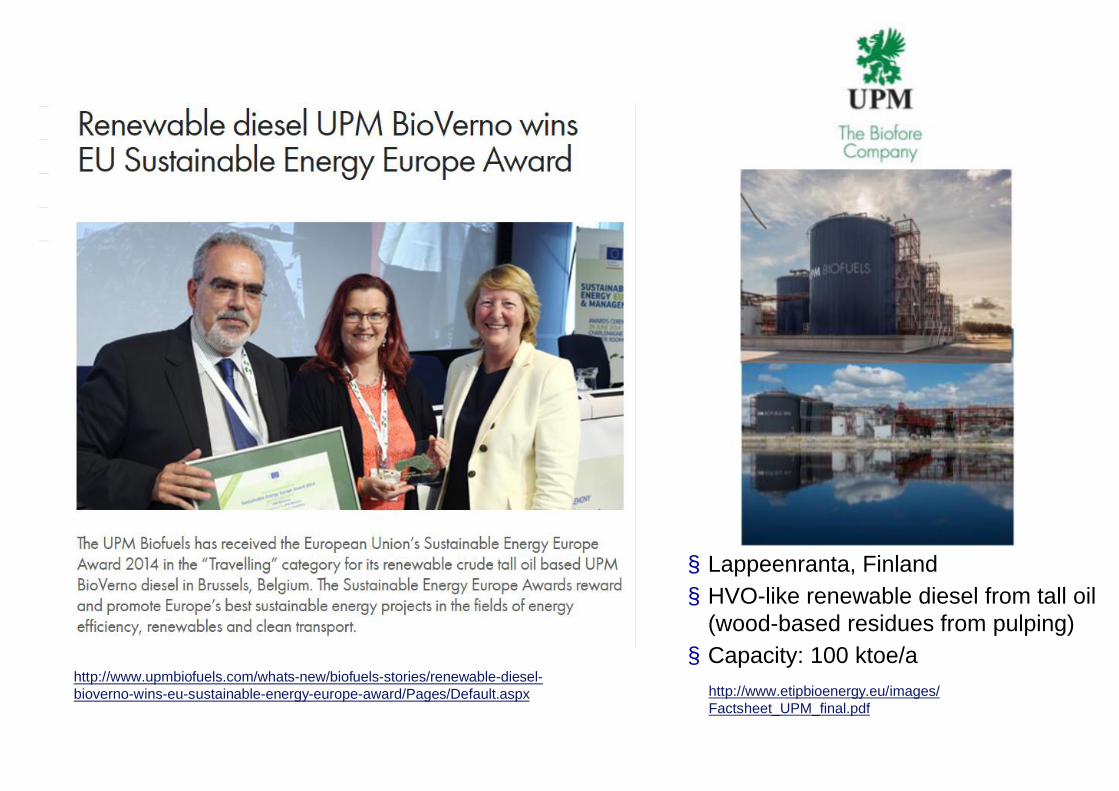
http://www.upmbiofuels.com/whats-new/biofuels-stories/renewable-diesel-bioverno-wins-eu-sustainable-energy-europe-award/Pages/Default.aspx
§ Lappeenranta, Finland§ HVO-like renewable diesel from tall oil
(wood-based residues from pulping)§ Capacity: 100 ktoe/a
http://www.etipbioenergy.eu/images/Factsheet_UPM_final.pdf
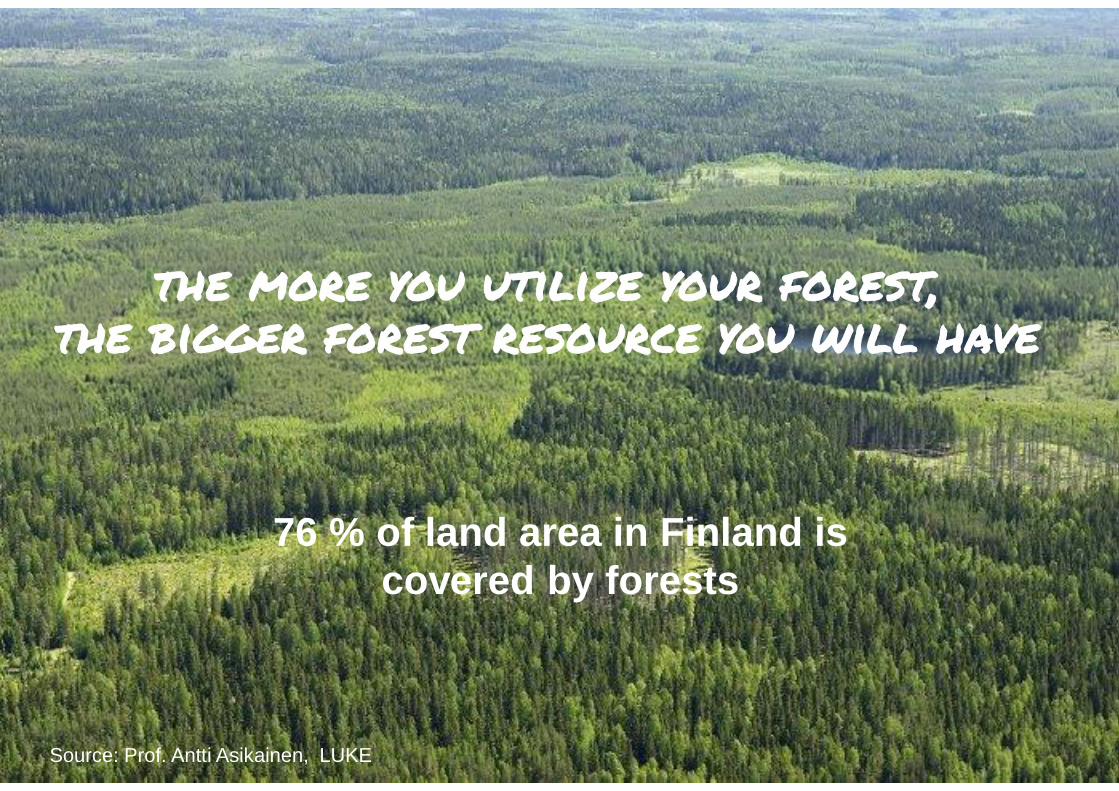
23/04/2018 7Source: Prof. Antti Asikainen, LUKE
76 % of land area in Finland iscovered by forests
23/04/2018 8
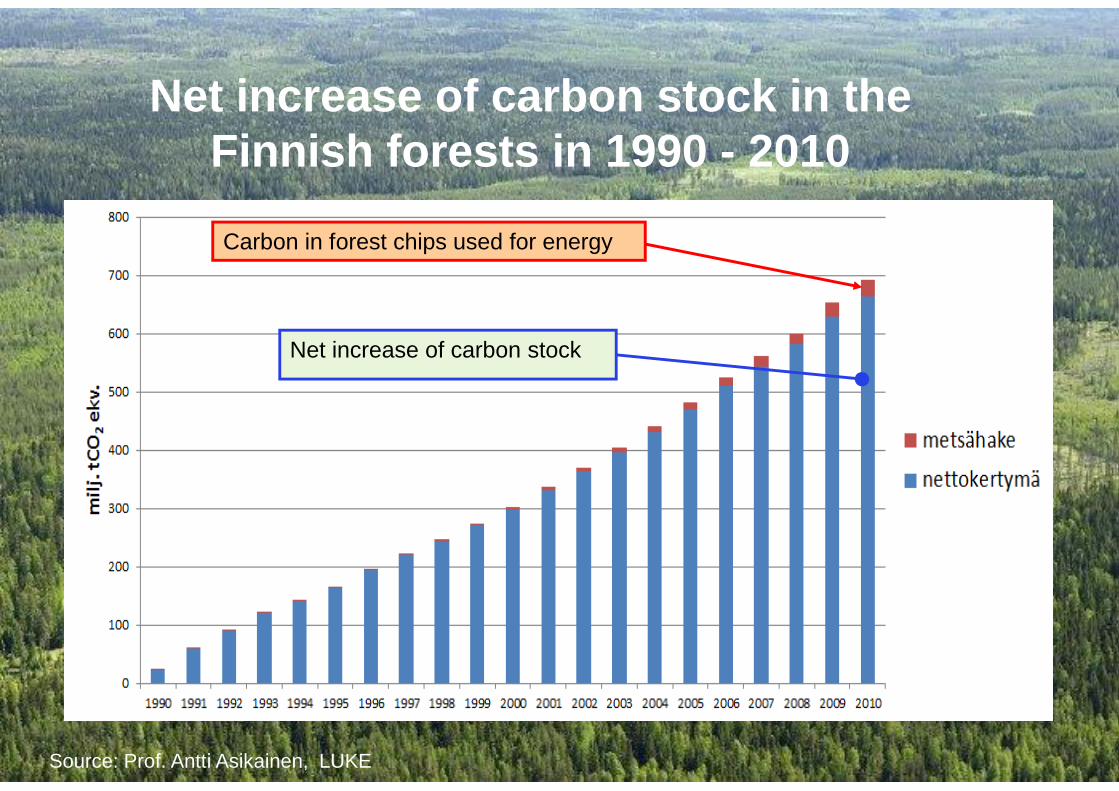
Net increase of carbon stock in the Finnishforests in 1990 - 2010
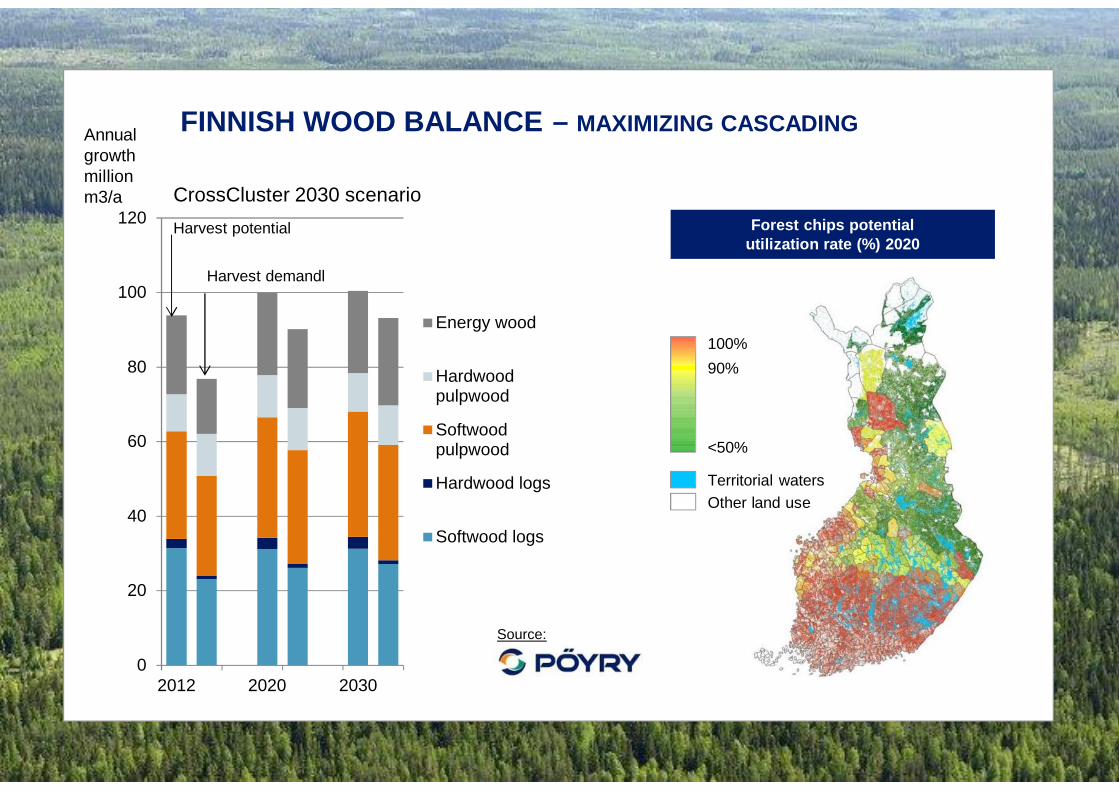
FINNISH WOOD BALANCE – MAXIMIZING CASCADING
0
20
40
60
80
100
120
2012 2020 2030
Energy wood
Hardwoodpulpwood
Softwoodpulpwood
Hardwood logs
Softwood logs
Harvest potential
Harvest demandl
CrossCluster 2030 scenario
100%90%
<50%
Territorial watersOther land use
Forest chips potentialutilization rate (%) 2020
Source:
Annualgrowthmillionm3/a
23/04/2018 9
Net increase of carbon stock in theFinnish forests in 1990 - 2010
Carbon in forest chips used for energy
Net increase of carbon stock
Source: Prof. Antti Asikainen, LUKE
10
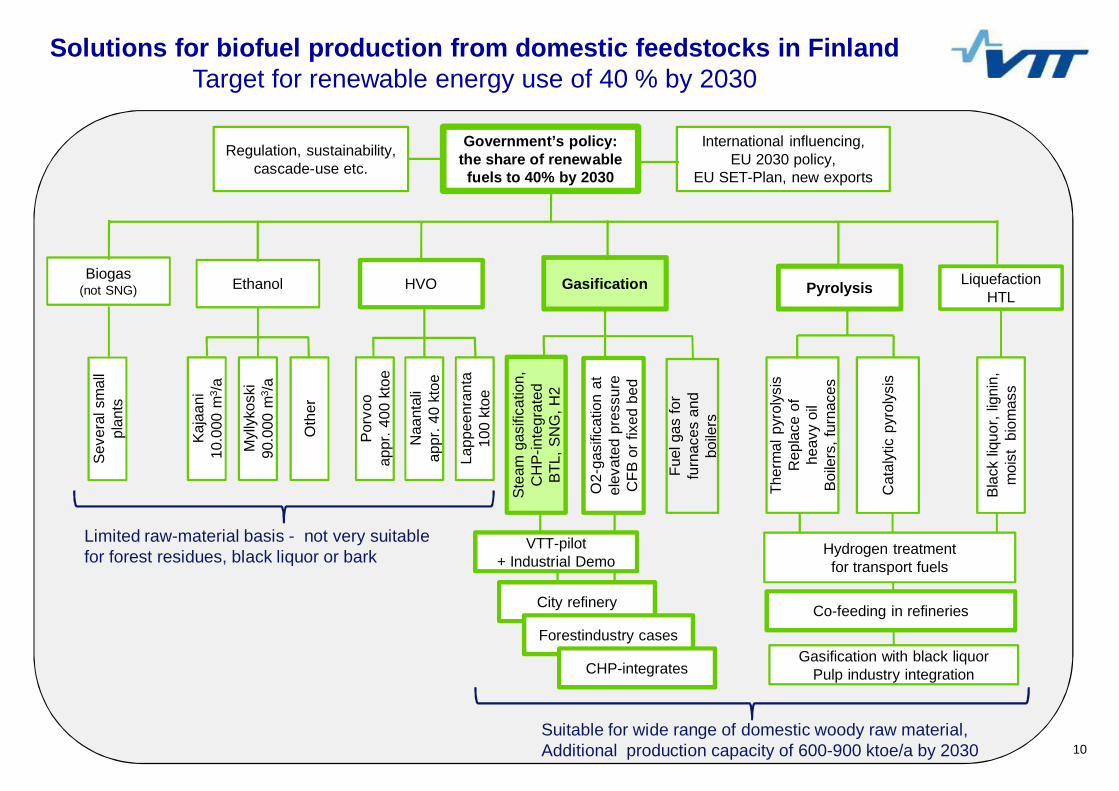
Solutions for biofuel production from domestic feedstocks in FinlandTarget for renewable energy use of 40 % by 2030
City refinery
Regulation, sustainability,cascade-use etc.
Ethanol
International influencing,EU 2030 policy,
EU SET-Plan, new exports
Government’s policy:the share of renewablefuels to 40% by 2030
Myl
lyko
ski
90.0
00m
3 /aHVO
Kaja
ani
10.0
00m
3 /a
Oth
er
Naa
ntal
iap
pr.4
0kt
oe
Porv
ooap
pr.4
00kt
oe
Lapp
eenr
anta
100
ktoe
Pyrolysis
Ther
mal
pyro
lysi
sR
epla
ceof
heav
yoi
lBo
ilers
,fur
nace
s
Cat
alyt
icpy
roly
sis
Blac
kliq
uor,
ligni
n,m
oist
biom
ass
Gasification
Stea
mga
sific
atio
n,C
HP-
inte
grat
edBT
L,SN
G,H
2
O2-
gasi
ficat
ion
atel
evat
edpr
essu
reC
FBor
fixed
bed
Biogas(not SNG)
Fuel
gas
for
furn
aces
and
boile
rs
VTT-pilot+ Industrial Demo
Forestindustry cases
CHP-integrates
Seve
rals
mal
lpl
ants
Limited raw-material basis - not very suitablefor forest residues, black liquor or bark
LiquefactionHTL
Hydrogen treatmentfor transport fuels
Co-feeding in refineries
Gasification with black liquorPulp industry integration
Suitable for wide range of domestic woody raw material,Additional production capacity of 600-900 ktoe/a by 2030
1123/04/2018 11
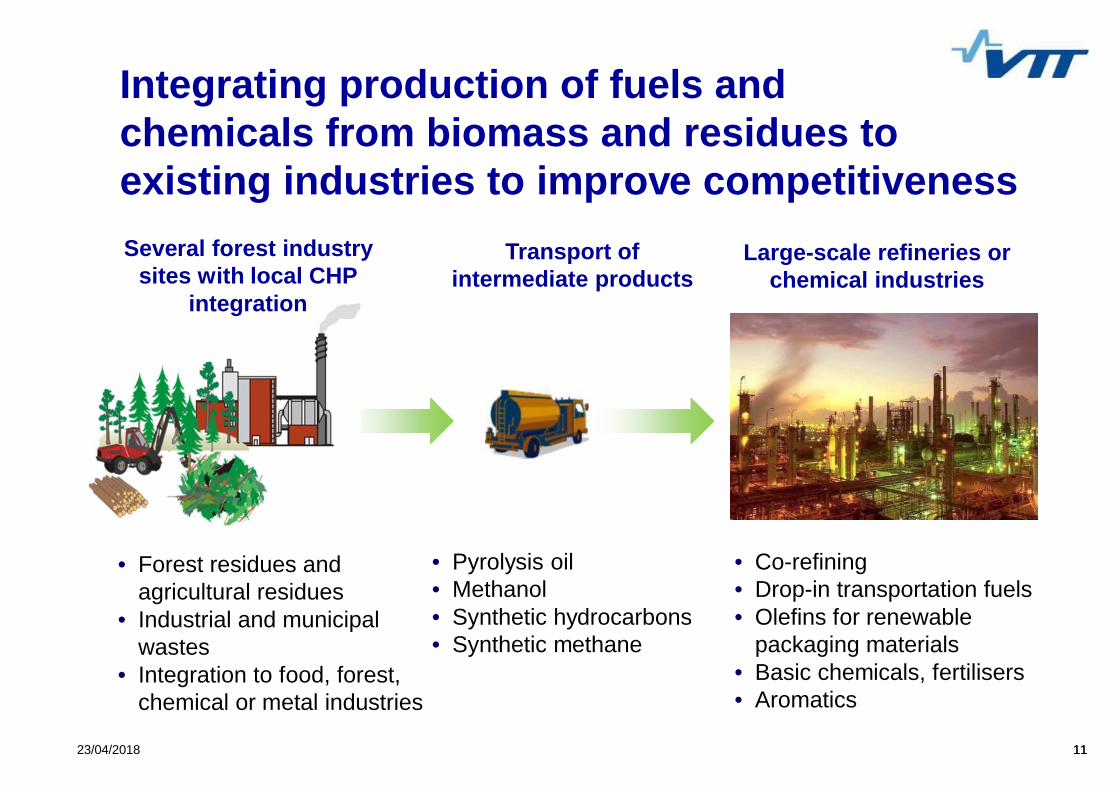
• Pyrolysis oil• Methanol• Synthetic hydrocarbons• Synthetic methane
• Co-refining• Drop-in transportation fuels• Olefins for renewable
packaging materials• Basic chemicals, fertilisers• Aromatics
• Forest residues andagricultural residues
• Industrial and municipalwastes
• Integration to food, forest,chemical or metal industries
Integrating production of fuels andchemicals from biomass and residues toexisting industries to improve competitiveness
Transport ofintermediate products
Large-scale refineries orchemical industries
Several forest industrysites with local CHP
integration
1223/04/2018 12
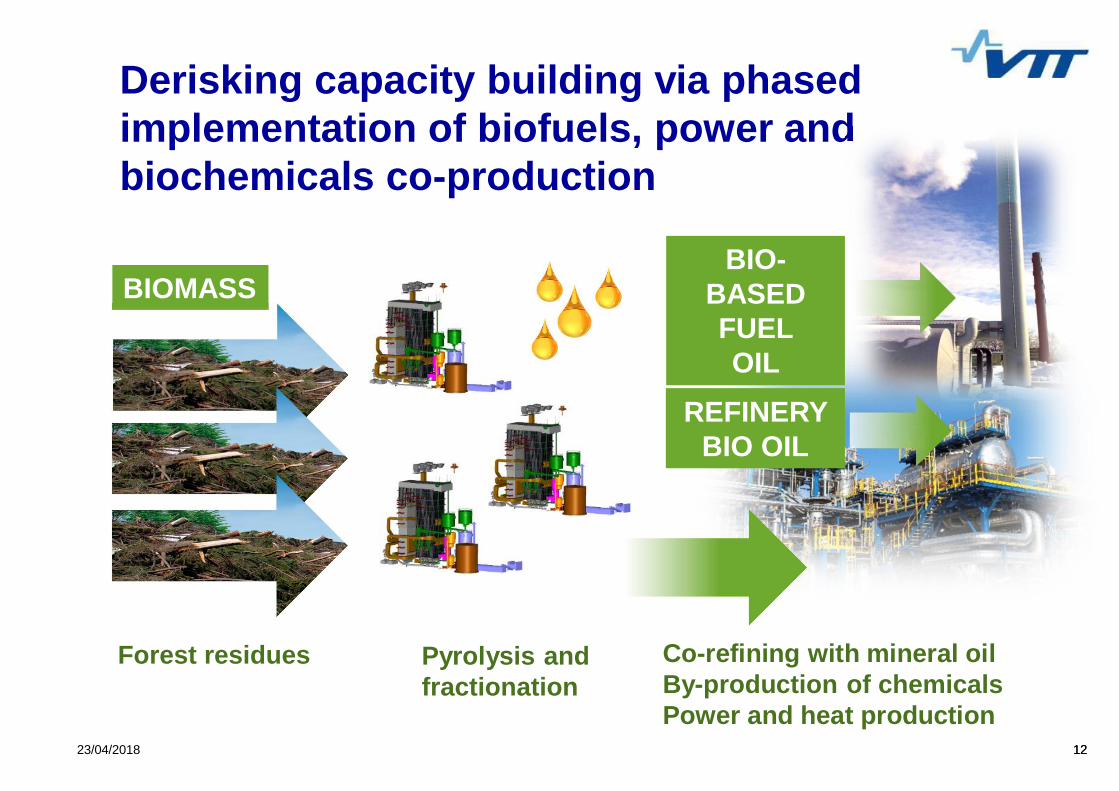
Derisking capacity building via phasedimplementation of biofuels, power andbiochemicals co-production
BIOMASS
Forest residues Pyrolysis andfractionation
Co-refining with mineral oilBy-production of chemicalsPower and heat production
BIO-BASEDFUELOIL
REFINERYBIO OIL
13
1995 2000 2005 2010 2015 20201985 2025 2030
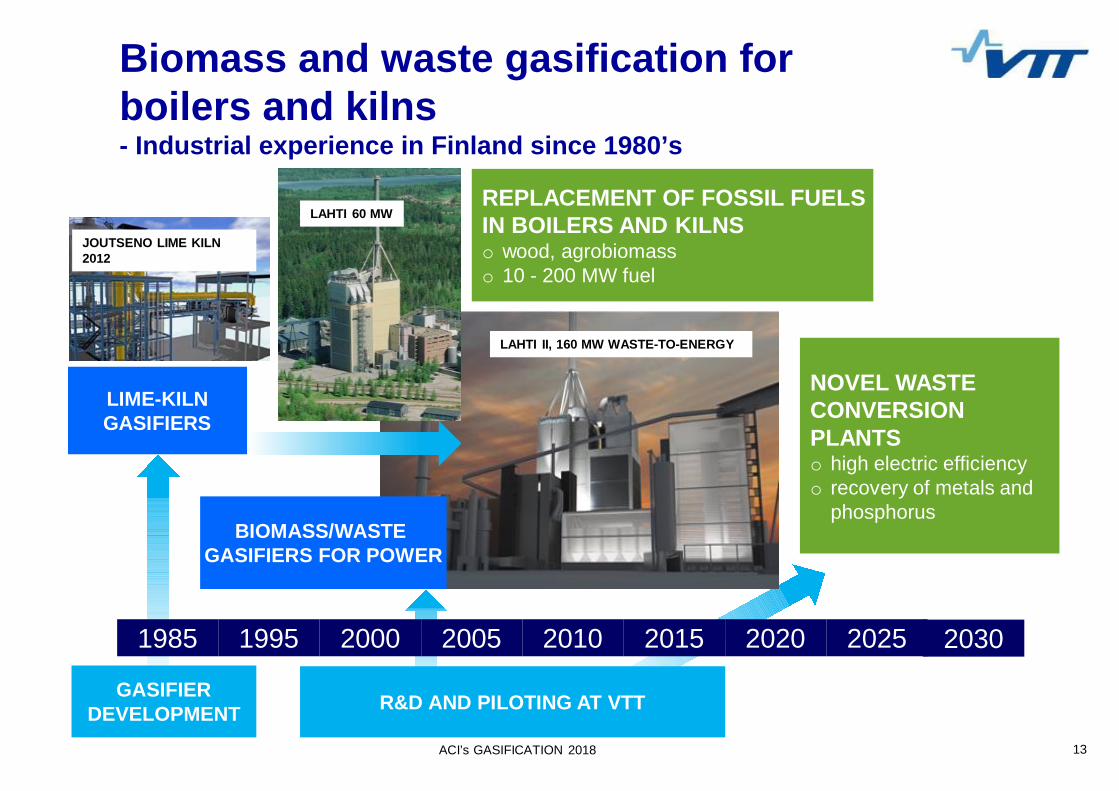
LAHTI II, 160 MW WASTE-TO-ENERGY
NOVEL WASTECONVERSIONPLANTSo high electric efficiencyo recovery of metals and
phosphorus
LIME-KILNGASIFIERS
REPLACEMENT OF FOSSIL FUELSIN BOILERS AND KILNSo wood, agrobiomasso 10 - 200 MW fuel
BIOMASS/WASTEGASIFIERS FOR POWER
GASIFIERDEVELOPMENT R&D AND PILOTING AT VTT
JOUTSENO LIME KILN2012
LAHTI 60 MW
Biomass and waste gasification forboilers and kilns- Industrial experience in Finland since 1980’s
ACI’s GASIFICATION 2018
1423/04/2018 14
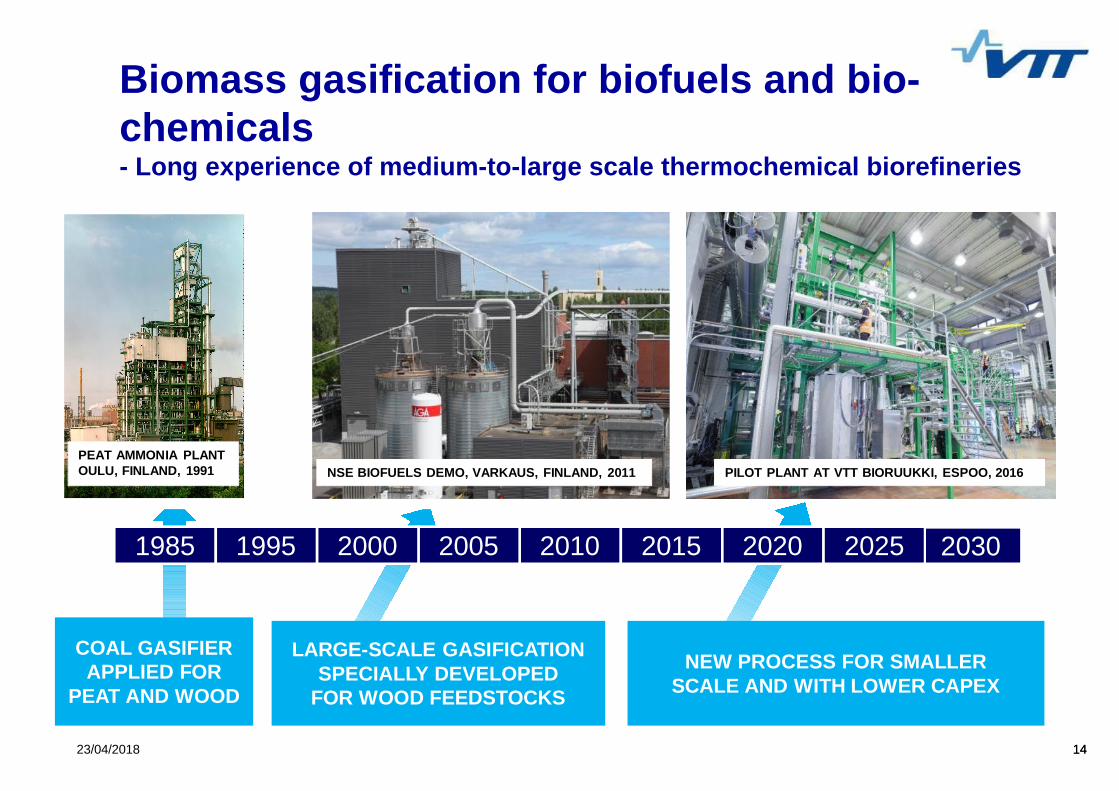
PEAT AMMONIA PLANTOULU, FINLAND, 1991
LARGE-SCALE GASIFICATIONSPECIALLY DEVELOPED
FOR WOOD FEEDSTOCKS
COAL GASIFIERAPPLIED FOR
PEAT AND WOOD
NSE BIOFUELS DEMO, VARKAUS, FINLAND, 2011
NEW PROCESS FOR SMALLERSCALE AND WITH LOWER CAPEX
PILOT PLANT AT VTT BIORUUKKI, ESPOO, 2016
2010 2015 20201985 2005 203020001995 2025
Biomass gasification for biofuels and bio-chemicals- Long experience of medium-to-large scale thermochemical biorefineries
15
1616
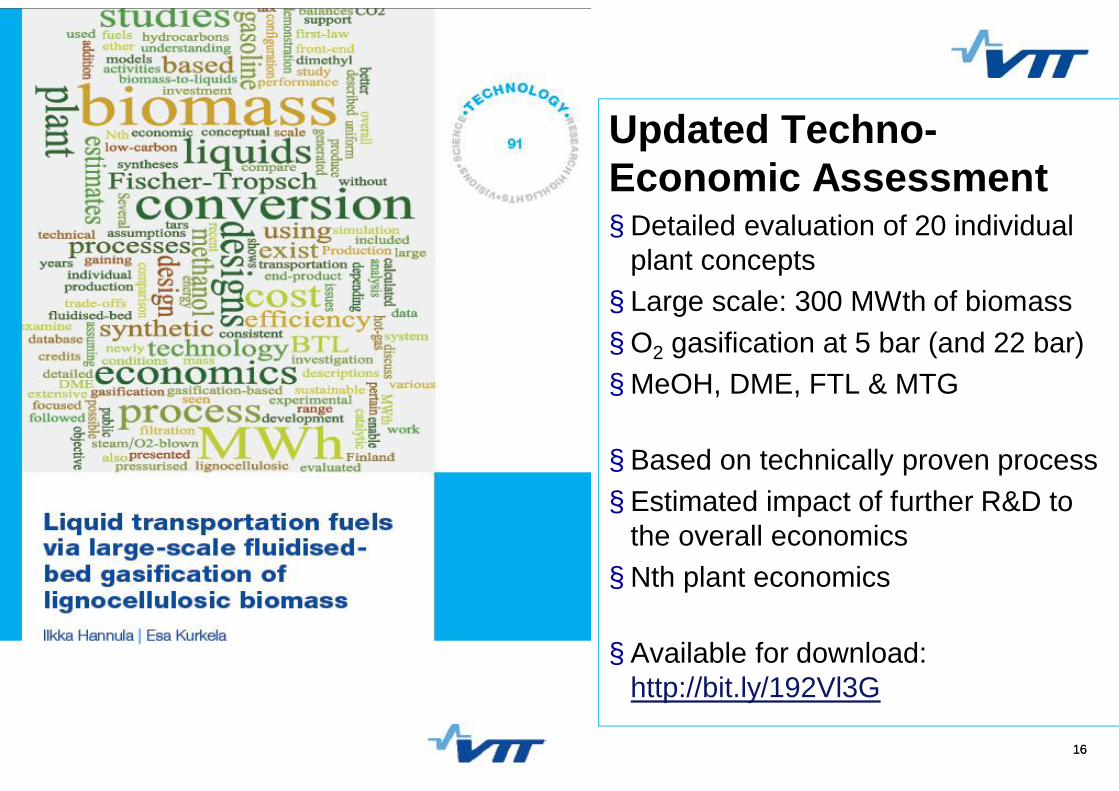
Updated Techno-Economic Assessment§ Detailed evaluation of 20 individual
plant concepts§ Large scale: 300 MWth of biomass§ O2 gasification at 5 bar (and 22 bar)§ MeOH, DME, FTL & MTG
§ Based on technically proven process§ Estimated impact of further R&D to
the overall economics§ Nth plant economics
§ Available for download:http://bit.ly/192Vl3G
17
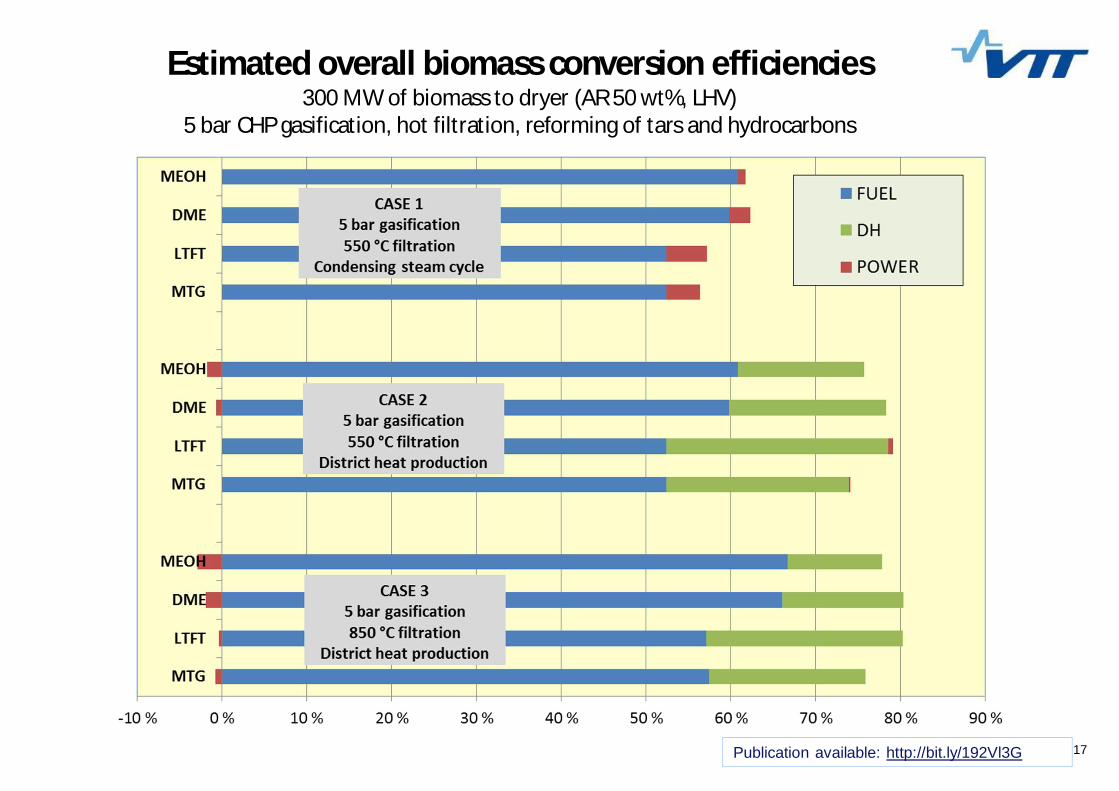
Estimated overall biomass conversion efficiencies300 MW of biomass to dryer (AR 50 wt%, LHV)
5 bar CHP gasification, hot filtration, reforming of tars and hydrocarbons
Publication available: http://bit.ly/192Vl3G
18
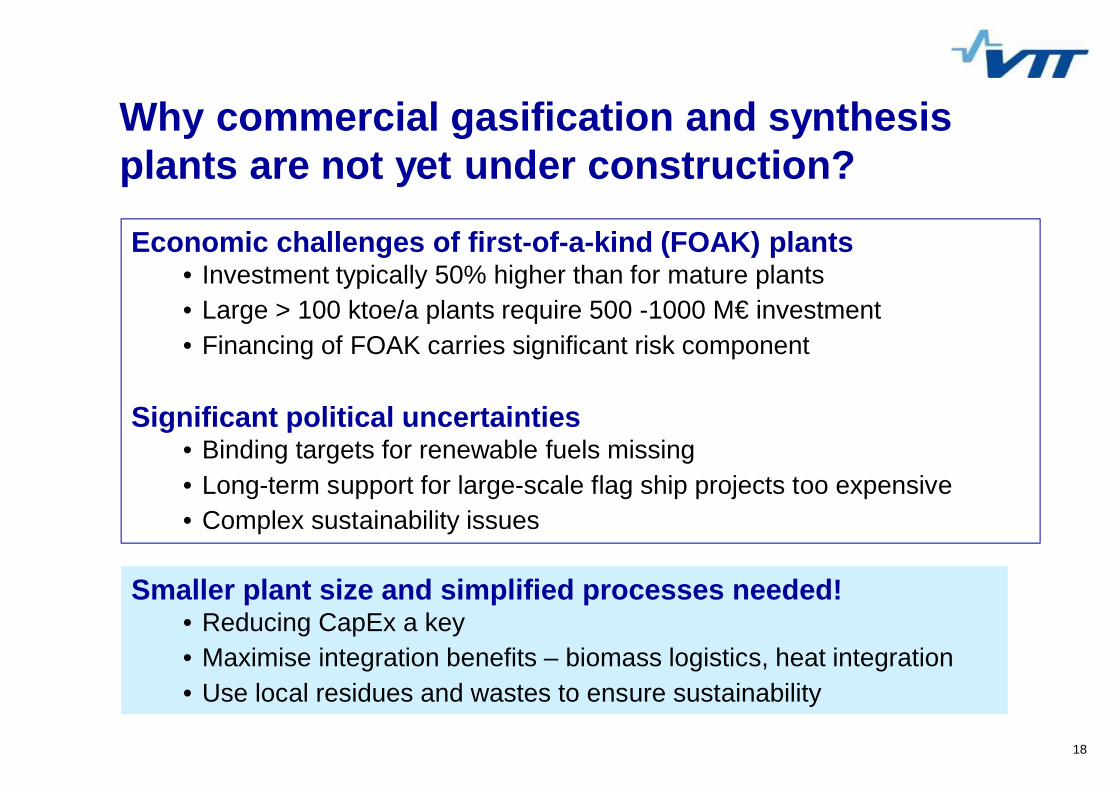
Economic challenges of first-of-a-kind (FOAK) plants• Investment typically 50% higher than for mature plants• Large > 100 ktoe/a plants require 500 -1000 M€ investment• Financing of FOAK carries significant risk component
Significant political uncertainties• Binding targets for renewable fuels missing• Long-term support for large-scale flag ship projects too expensive• Complex sustainability issues
Smaller plant size and simplified processes needed!• Reducing CapEx a key• Maximise integration benefits – biomass logistics, heat integration• Use local residues and wastes to ensure sustainability
Why commercial gasification and synthesisplants are not yet under construction?
Click to edit Master title style
§ Click to edit Master text styles§ Second level
§ Third level§ Fourth level
§ Fifth level
1918/04/2018 19
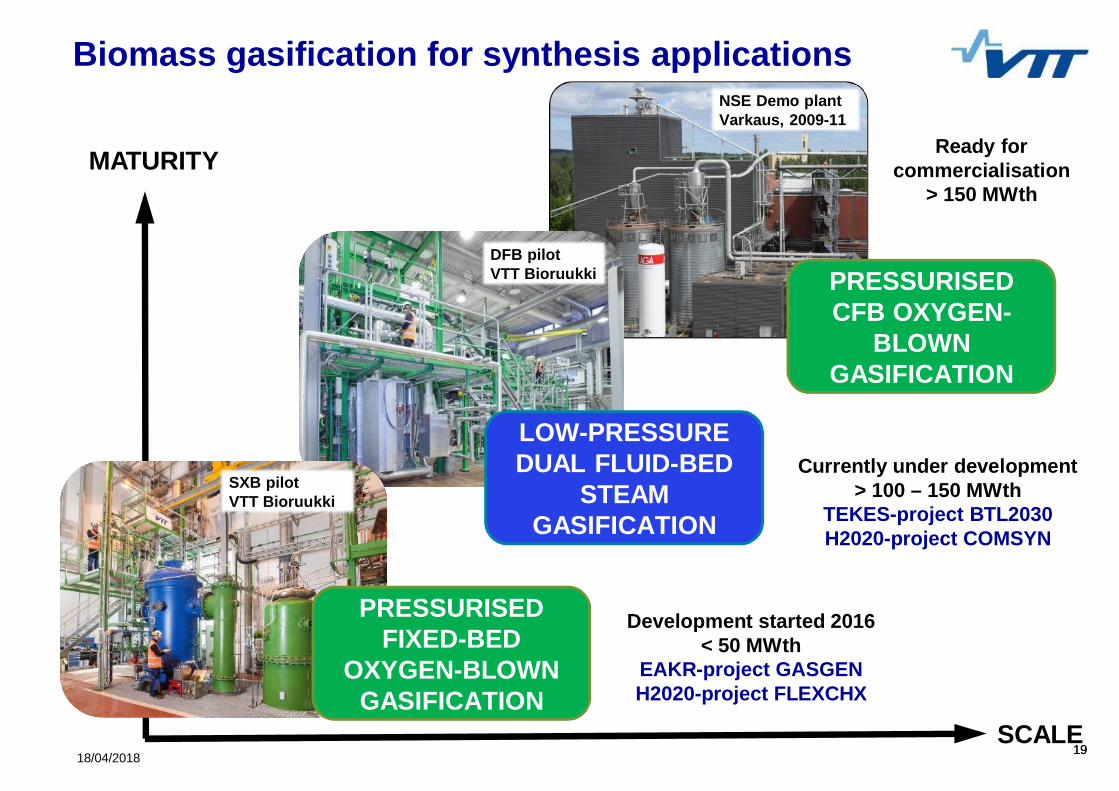
MATURITY
SCALE
Ready forcommercialisation
> 150 MWth
Currently under development> 100 – 150 MWth
TEKES-project BTL2030H2020-project COMSYN
Development started 2016< 50 MWth
EAKR-project GASGENH2020-project FLEXCHX
Biomass gasification for synthesis applications
PRESSURISEDCFB OXYGEN-
BLOWNGASIFICATION
NSE Demo plantVarkaus, 2009-11
DFB pilotVTT Bioruukki
SXB pilotVTT Bioruukki
LOW-PRESSUREDUAL FLUID-BED
STEAMGASIFICATION
PRESSURISEDFIXED-BED
OXYGEN-BLOWNGASIFICATION
20
Hydrocarbonliquids
OXYGENGASIFIER
BELTDRYER
ASU
AUXILIARYBOILER
Air N2
O2
H2S
Steam Steam
Filter ash
Purge
Steam
Unconverted gas
Bypass
HOT-GASFILTER
ATR POXREFORMER SOUR SHIFT SCRUBBER
COOLERCENTRIFUG.
COMPR.
WET CO2REMOVAL
RECYCLEF-T
SYNTHESIS
RECOVERY&
UPGRADE
CO2
Flue gas
Forestresidues
POWERGENERATIONEQUIPMENT
WSAH2SO4
WET SULPHURREMOVAL
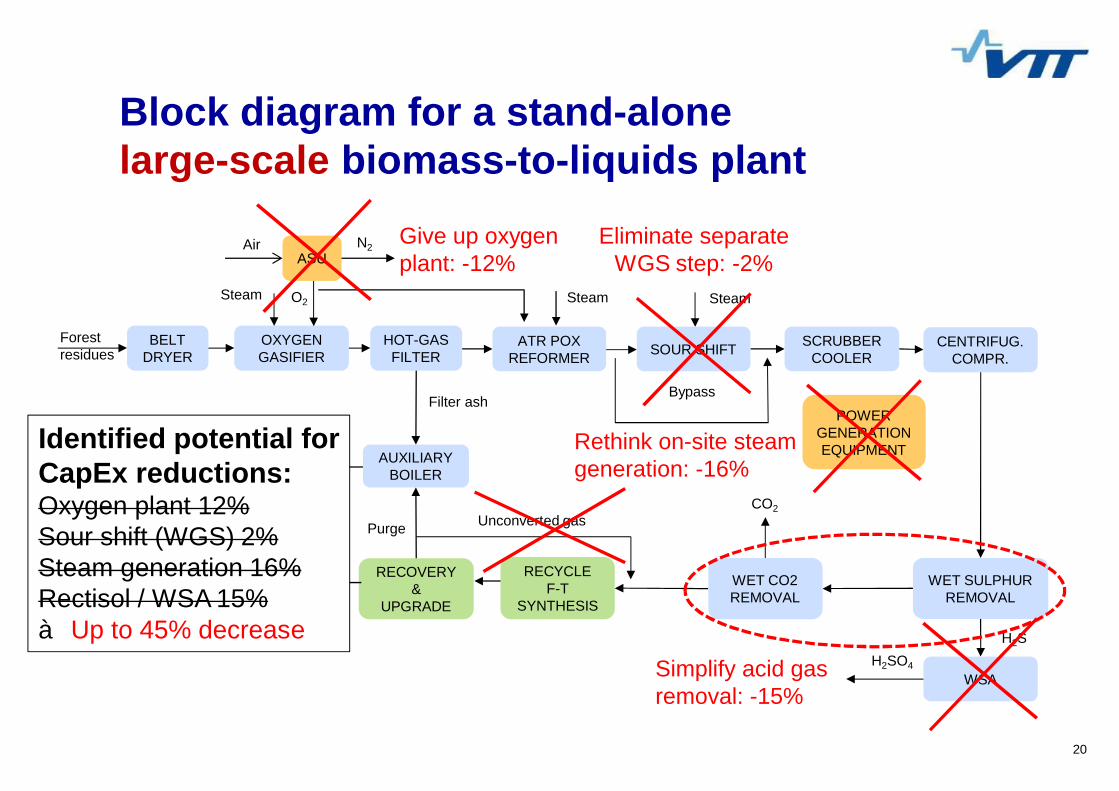
Block diagram for a stand-alonelarge-scale biomass-to-liquids plant
Give up oxygenplant: -12%
Eliminate separateWGS step: -2%
Simplify acid gasremoval: -15%
Rethink on-site steamgeneration: -16%
Identified potential forCapEx reductions:Oxygen plant 12%Sour shift (WGS) 2%Steam generation 16%Rectisol / WSA 15%à Up to 45% decrease
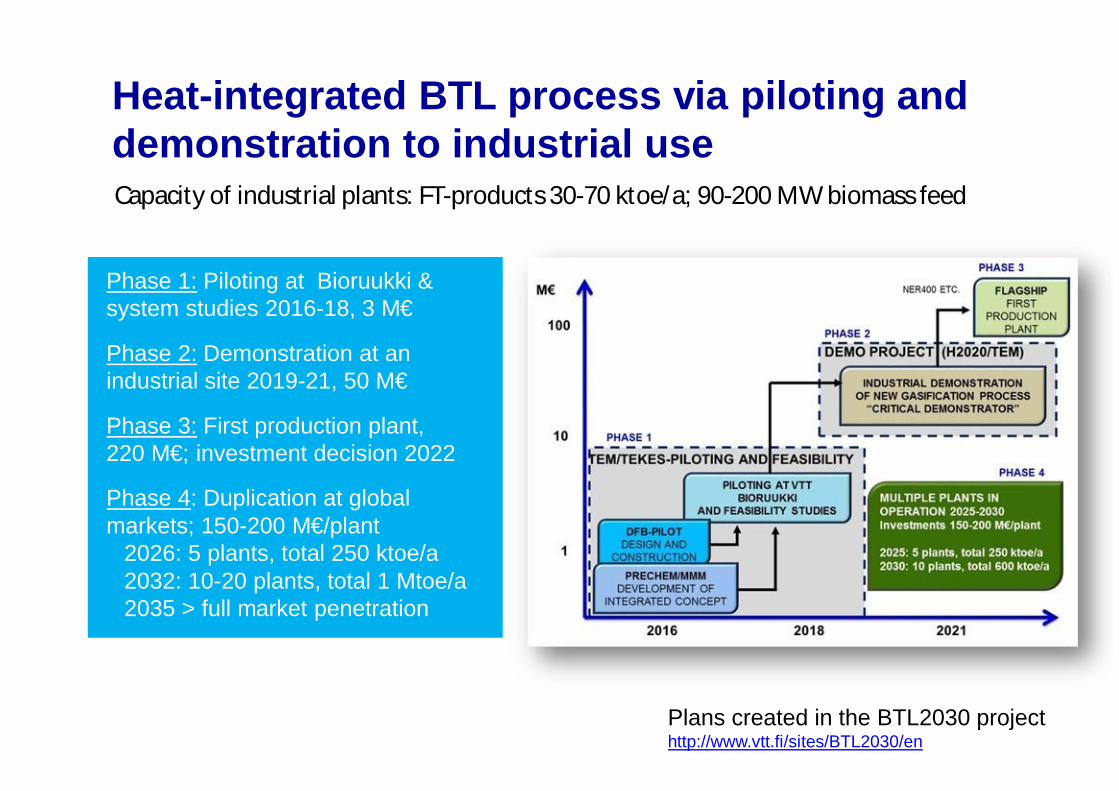
Heat-integrated BTL process via piloting anddemonstration to industrial use
Phase 1: Piloting at Bioruukki &system studies 2016-18, 3 M€
Phase 2: Demonstration at anindustrial site 2019-21, 50 M€
Phase 3: First production plant,220 M€; investment decision 2022
Phase 4: Duplication at globalmarkets; 150-200 M€/plant
2026: 5 plants, total 250 ktoe/a2032: 10-20 plants, total 1 Mtoe/a2035 > full market penetration
Capacity of industrial plants: FT-products 30-70 ktoe/a; 90-200 MW biomass feed
Plans created in the BTL2030 projecthttp://www.vtt.fi/sites/BTL2030/en
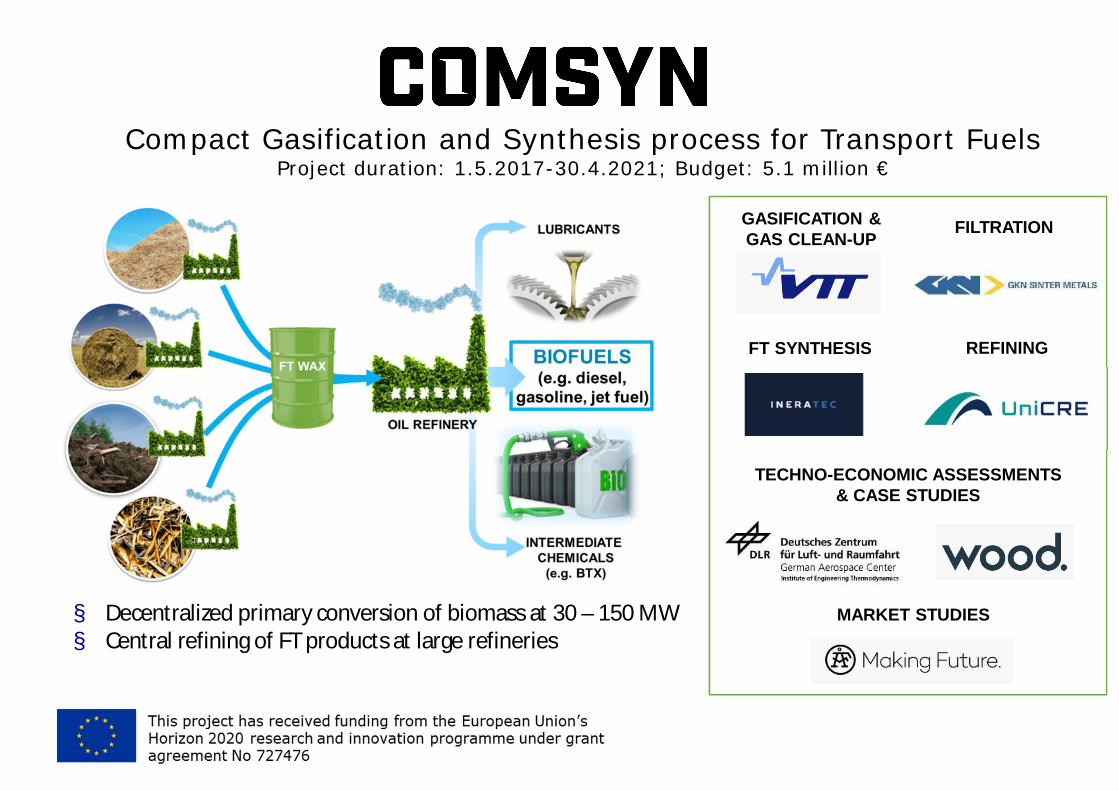
Compact Gasification and Synthesis process for Transport FuelsProject duration: 1.5.2017-30.4.2021; Budget: 5.1 million €
GASIFICATION &GAS CLEAN-UP
FT SYNTHESIS REFINING
MARKET STUDIES
TECHNO-ECONOMIC ASSESSMENTS& CASE STUDIES
FILTRATION
§ Decentralized primary conversion of biomass at 30 – 150 MW§ Central refining of FT products at large refineries
www.comsynproject.eu
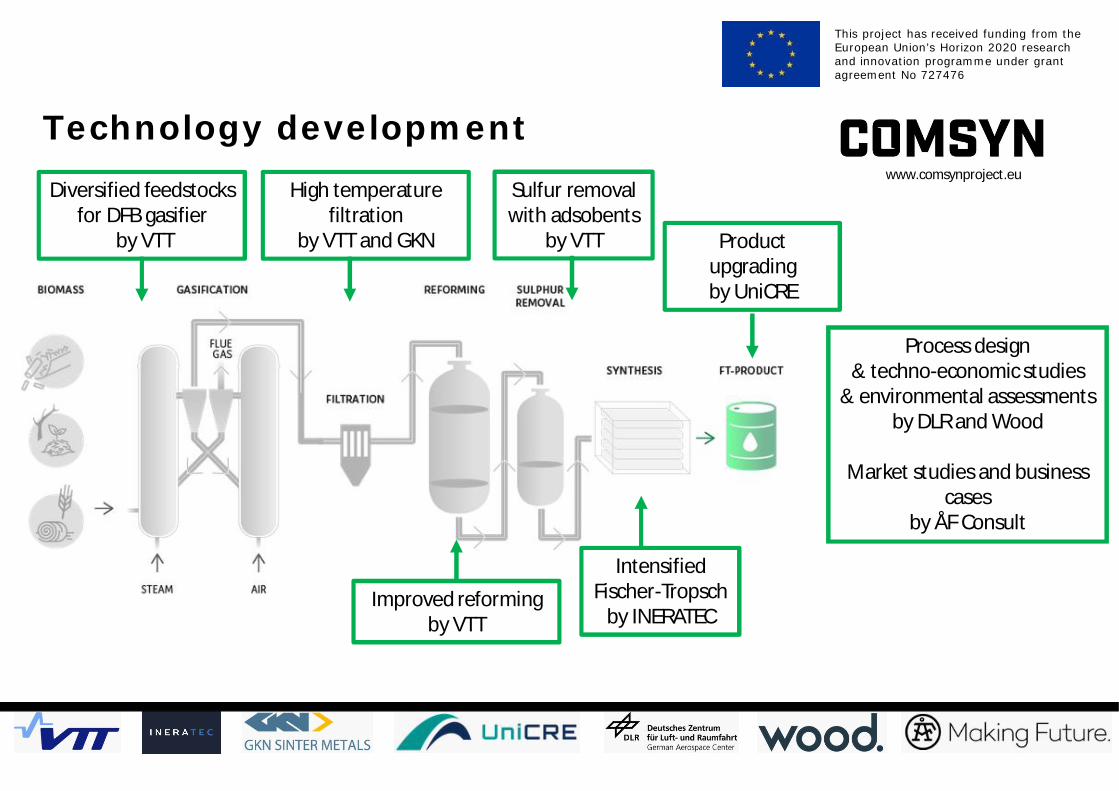
Technology developmentDiversified feedstocks
for DFB gasifierby VTT
High temperaturefiltration
by VTT and GKN
Sulfur removalwith adsobents
by VTT
IntensifiedFischer-Tropsch
by INERATEC
Productupgradingby UniCRE
Improved reformingby VTT
Process design& techno-economic studies
& environmental assessmentsby DLR and Wood
Market studies and businesscases
by ÅF Consult
This project has received funding from theEuropean Union’s Horizon 2020 researchand innovation programme under grantagreement No 727476
2423/04/2018 24
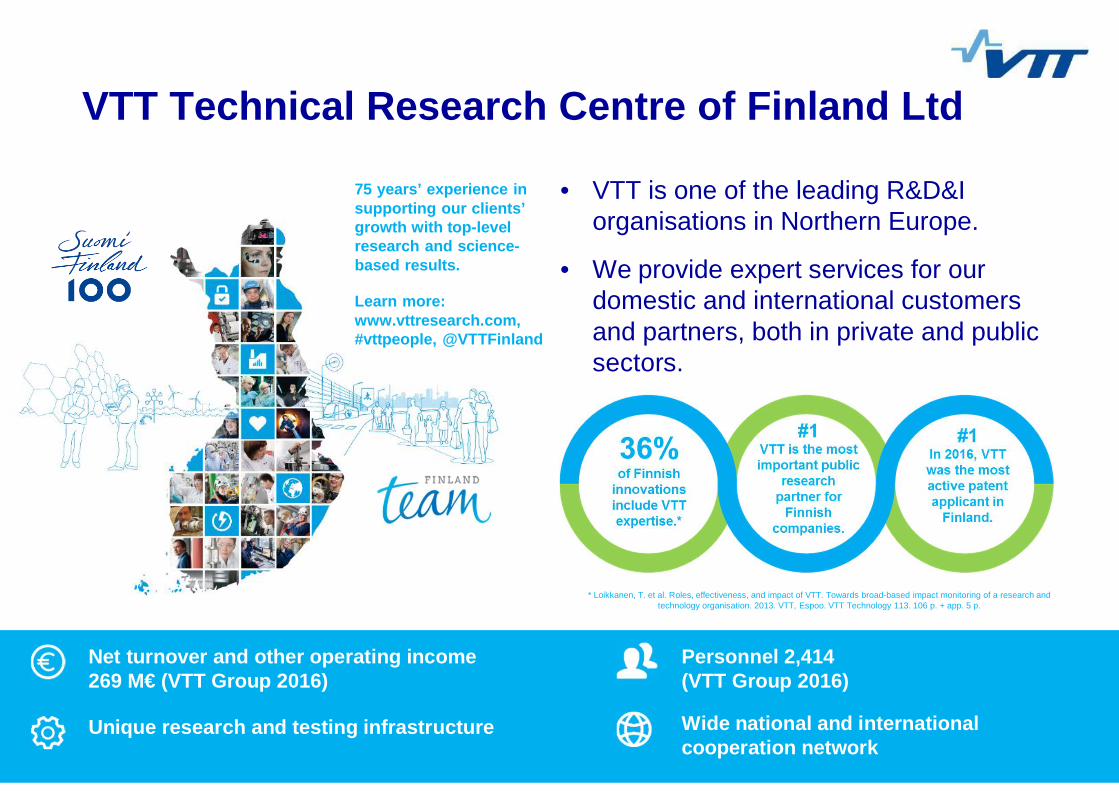
VTT Technical Research Centre of Finland Ltd
• VTT is one of the leading R&D&Iorganisations in Northern Europe.
• We provide expert services for ourdomestic and international customersand partners, both in private and publicsectors.
75 years’ experience insupporting our clients’growth with top-levelresearch and science-based results.
Learn more:www.vttresearch.com,#vttpeople, @VTTFinland
Net turnover and other operating income269 M€ (VTT Group 2016)
Personnel 2,414(VTT Group 2016)
Unique research and testing infrastructure Wide national and internationalcooperation network
* Loikkanen, T. et al. Roles, effectiveness, and impact of VTT. Towards broad-based impact monitoring of a research andtechnology organisation. 2013. VTT, Espoo. VTT Technology 113. 106 p. + app. 5 p.
Recommended