Challenges and Perspectives Challenges and Perspectives for R,D&I for Brazilian for R,D&I for Brazilian
AgroenergyAgroenergy
Kepler Euclides FilhoKepler Euclides Filho
Executive DirectorExecutive Director -- EmbrapaEmbrapa
Energy security
Climate change mitigation
Lower emissions of pollutants
Liquid – use of existing infrastructure
Why are biofuels attractive?
Fonte: Esmap, 2005
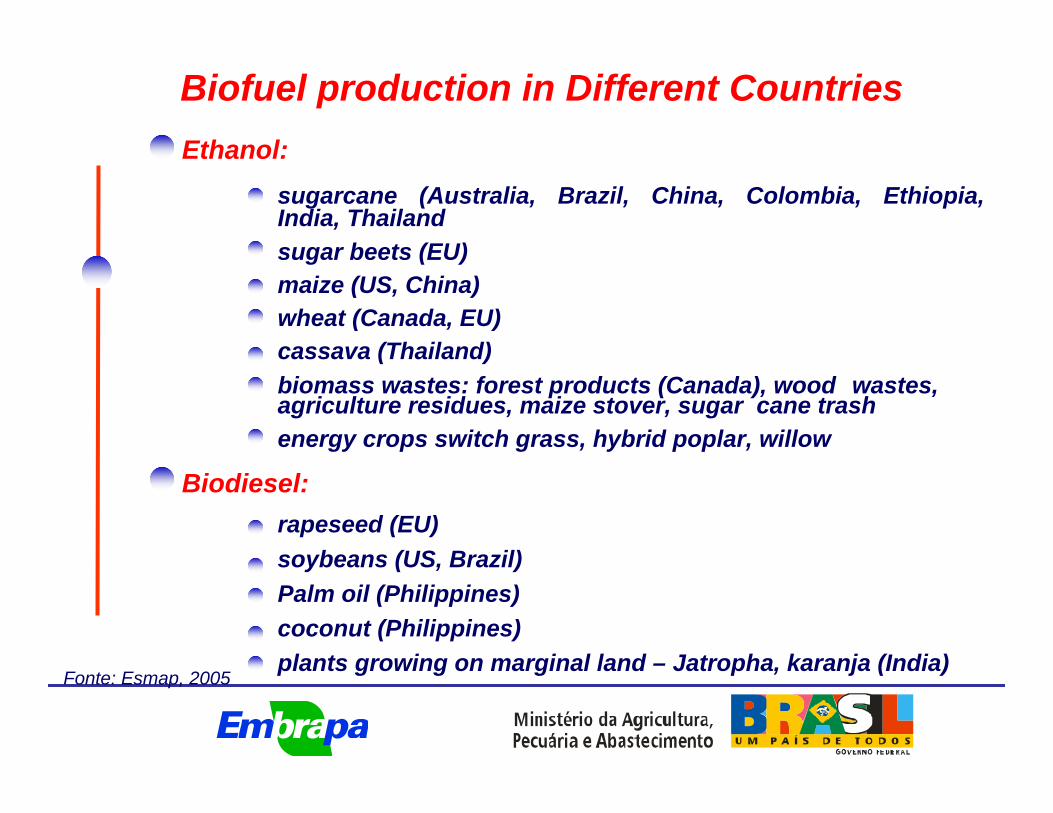
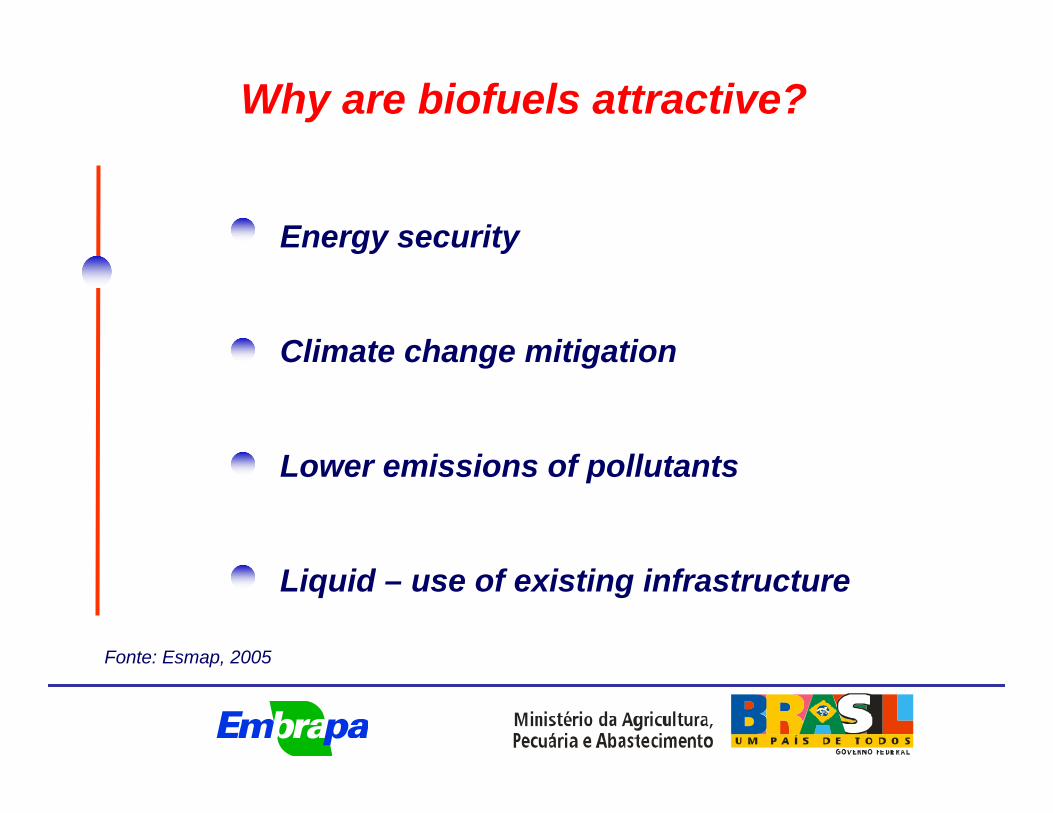
Ethanol:sugarcane (Australia, Brazil, China, Colombia, Ethiopia, India, Thailandsugar beets (EU)maize (US, China)wheat (Canada, EU)cassava (Thailand)biomass wastes: forest products (Canada), wood wastes, agriculture residues, maize stover, sugar cane trashenergy crops switch grass, hybrid poplar, willow
Biodiesel:rapeseed (EU)soybeans (US, Brazil)Palm oil (Philippines)coconut (Philippines)plants growing on marginal land – Jatropha, karanja (India)
Biofuel production in Different Countries
Fonte: Esmap, 2005
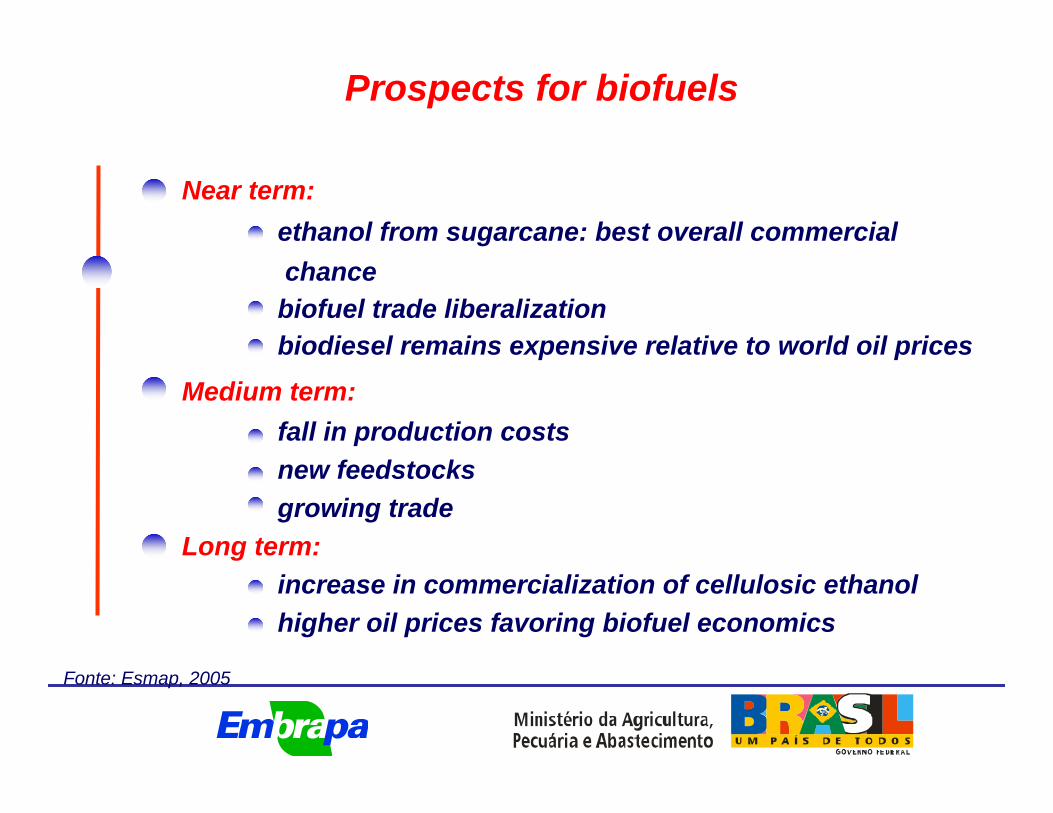
Near term:ethanol from sugarcane: best overall commercialchance
biofuel trade liberalizationbiodiesel remains expensive relative to world oil prices
Medium term:fall in production costsnew feedstocksgrowing trade
Long term:increase in commercialization of cellulosic ethanolhigher oil prices favoring biofuel economics
Prospects for biofuels
Fonte: Esmap, 2005
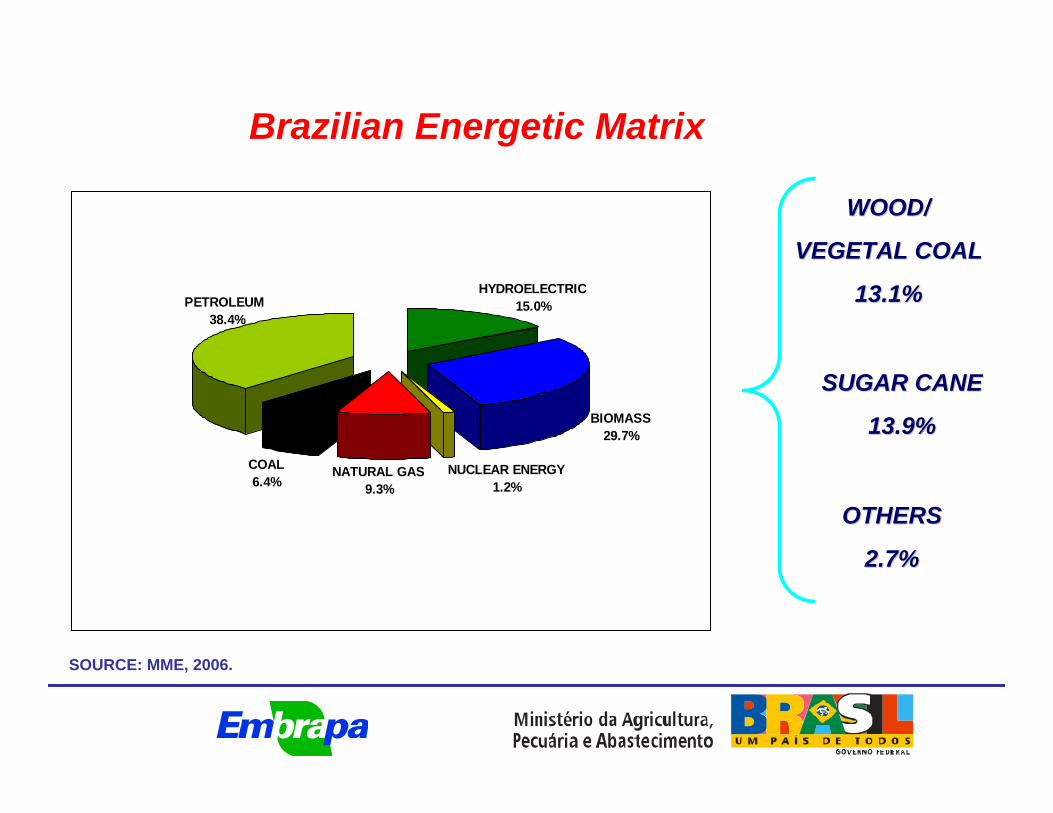
SOURCE: MME, 2006.
WOOD/WOOD/
VEGETAL COALVEGETAL COAL
13.1%13.1%
SUGAR CANESUGAR CANE
13.9%13.9%
OTHERSOTHERS
2.7%2.7%
BIOMASS29.7%
NUCLEAR ENERGY1.2%
HYDROELECTRIC15.0%PETROLEUM
38.4%
COAL6.4%
NATURAL GAS 9.3%
Brazilian Energetic Matrix
Its an instrument, which orients actions of Its an instrument, which orients actions of Ministry of Agriculture and the Ministry of Agriculture and the agroenergyagroenergysupply chains according to the supply chains according to the AgroenergyAgroenergy
policy of Federal Government.policy of Federal Government.
It is It is based on five dimensionsbased on five dimensions::
BRAZILIAN AGROENERGY PLANBRAZILIAN AGROENERGY PLAN
Economics, Social, Environmental,
Regional differences, International insertion
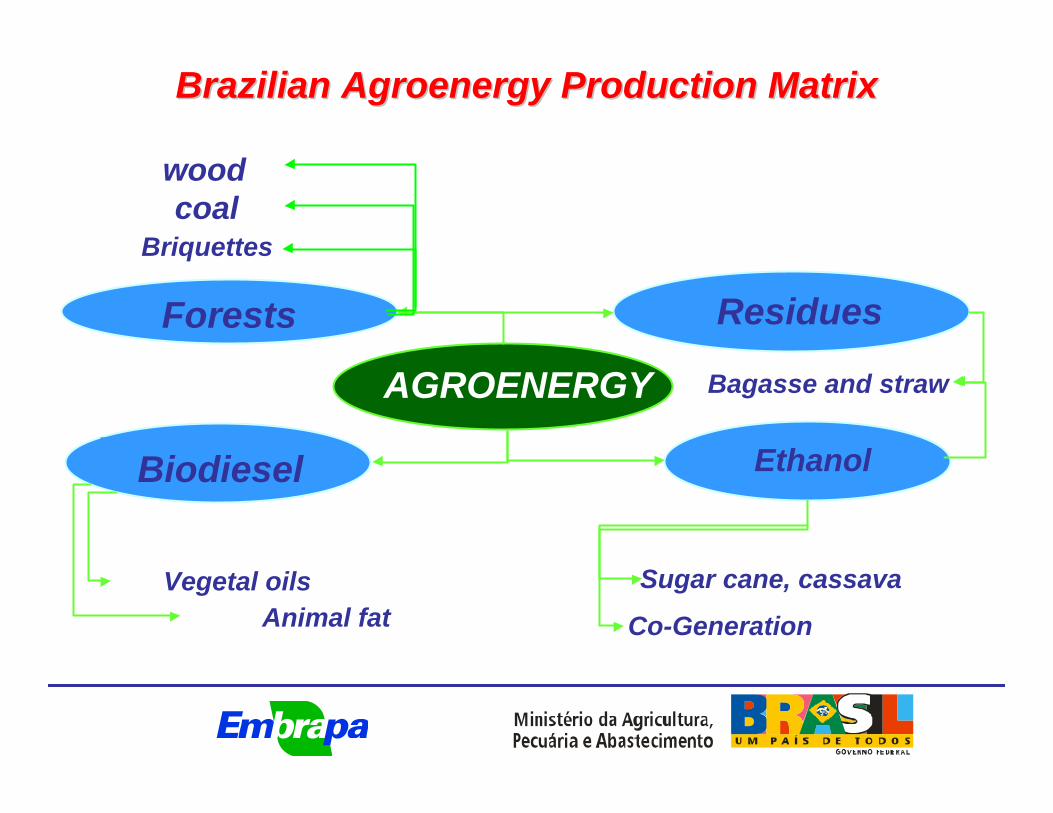
AGROENERGY
Vegetal oilsAnimal fat
Sugar cane, cassava
Ethanol
ResiduesForests
Briquettes
woodcoal
Biodiesel
Bagasse and straw
Co-Generation
Brazilian Brazilian AgroenergyAgroenergy Production MatrixProduction Matrix

1912: First Experiences with alcohol-fueled automobiles
1931: Anhydrous-gasoline mixture (up to 5%)
1938: Mixing compulsory
1966: Mixture gap increases to 5-10% (voluntary)
1975: Government launches the National Alcohol Program (Proalcool), based on two pillars:
increasing anhydrous-alcohol mixture in gasoline
launching the hydrated-alcohol-fueled car
1979 – 2002: Mixture increases from 15 to 25%
Ethanol in Brazil
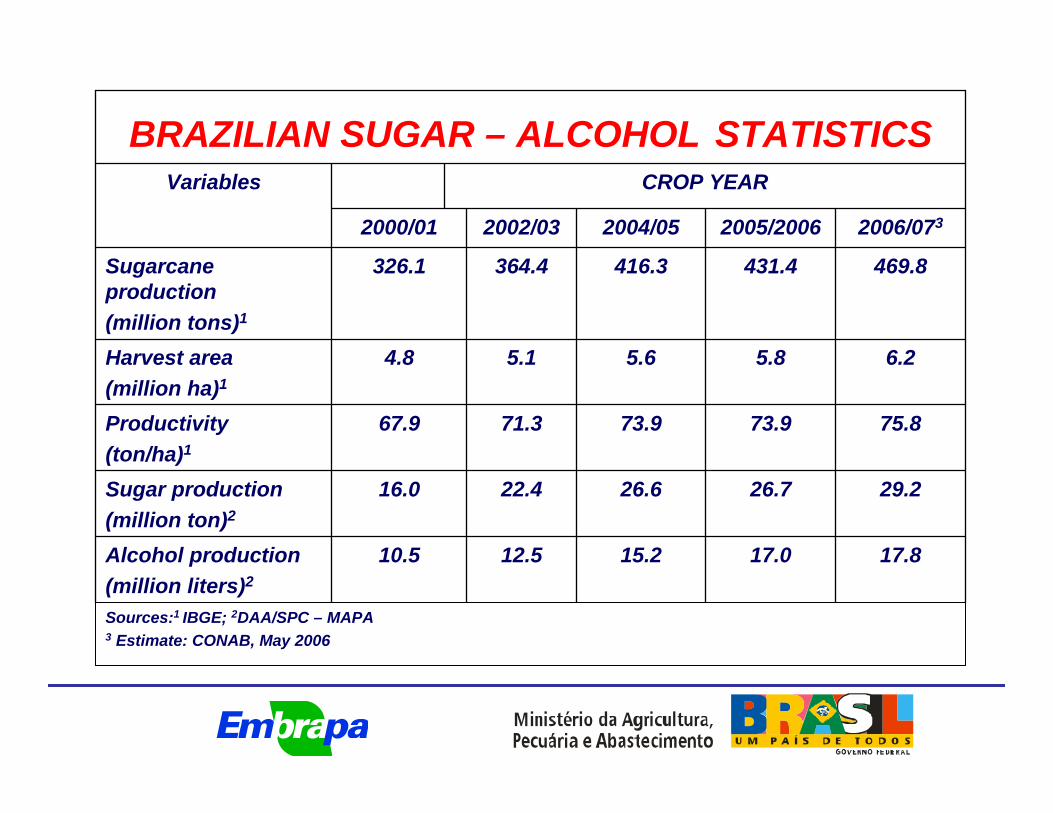
Sources:1 IBGE; 2DAA/SPC – MAPA3 Estimate: CONAB, May 2006
17.817.015.212.510.5Alcohol production(million liters)2
29.226.726.622.416.0Sugar production(million ton)2
75.873.973.971.367.9Productivity(ton/ha)1
6.25.85.65.14.8Harvest area(million ha)1
469.8431.4416.3364.4326.1Sugarcane production(million tons)1
2006/0732005/20062004/052002/032000/01
CROP YEARVariables
BRAZILIAN SUGAR – ALCOHOL STATISTICS

Sugarcane = 430 millions of ton (2006)
Sugar (49%) =29 million tonEthanol (51%) 17 billion liters
ExternalMarket
2/3
DomesticMarket
1/3
External market15%
Domestic market(85%)
Fuel(50%)
Other Uses(50%)
Fuel(90%)
OtherUses(10%)
Source: Unica 2006
PerspectivesPerspectives
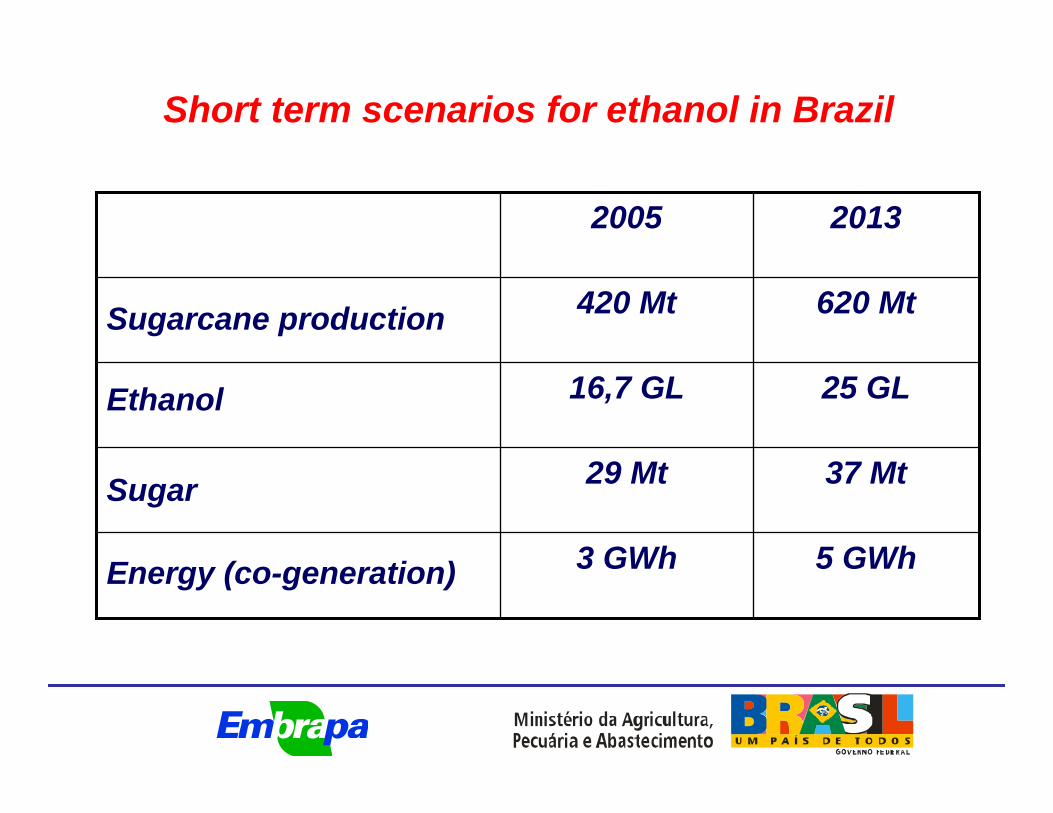
Short term scenarios for ethanol in Brazil
5 GWh3 GWhEnergy (co-generation)
37 Mt29 MtSugar
25 GL16,7 GLEthanol
620 Mt420 MtSugarcane production
20132005
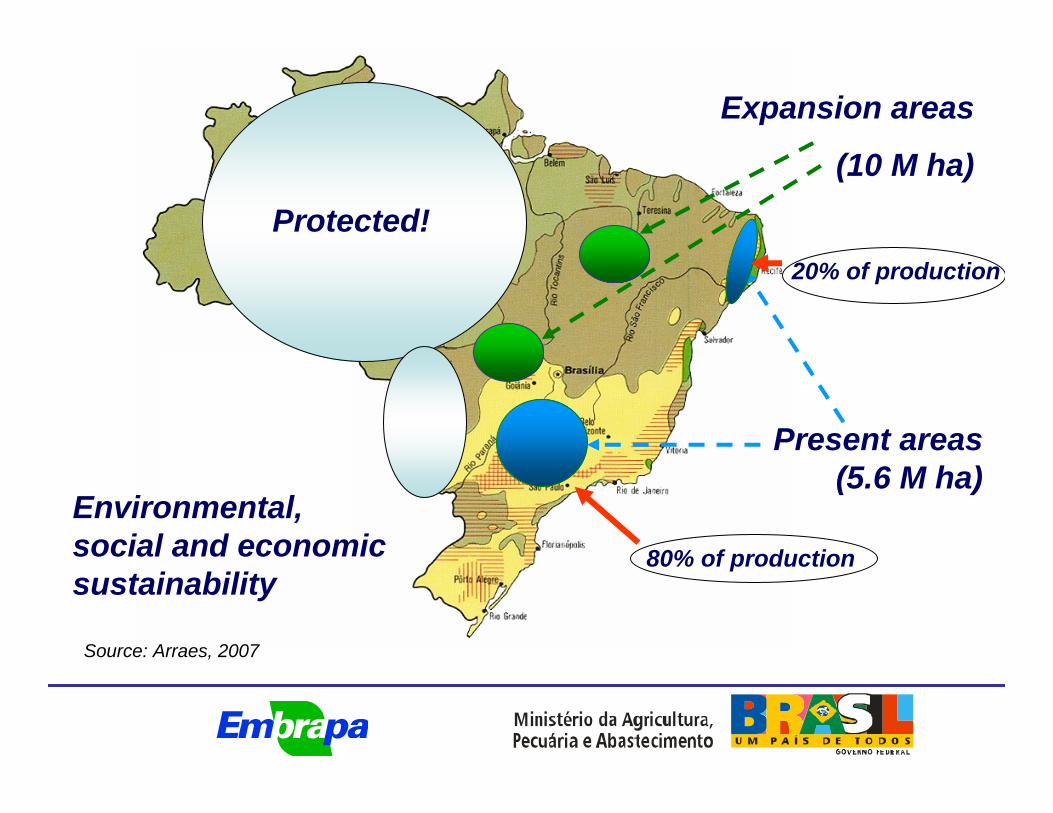
Expansion areas
(10 M ha)
Present areas (5.6 M ha)
Environmental, social and economic sustainability
Protected!
80% of production
20% of production
Source: Arraes, 2007
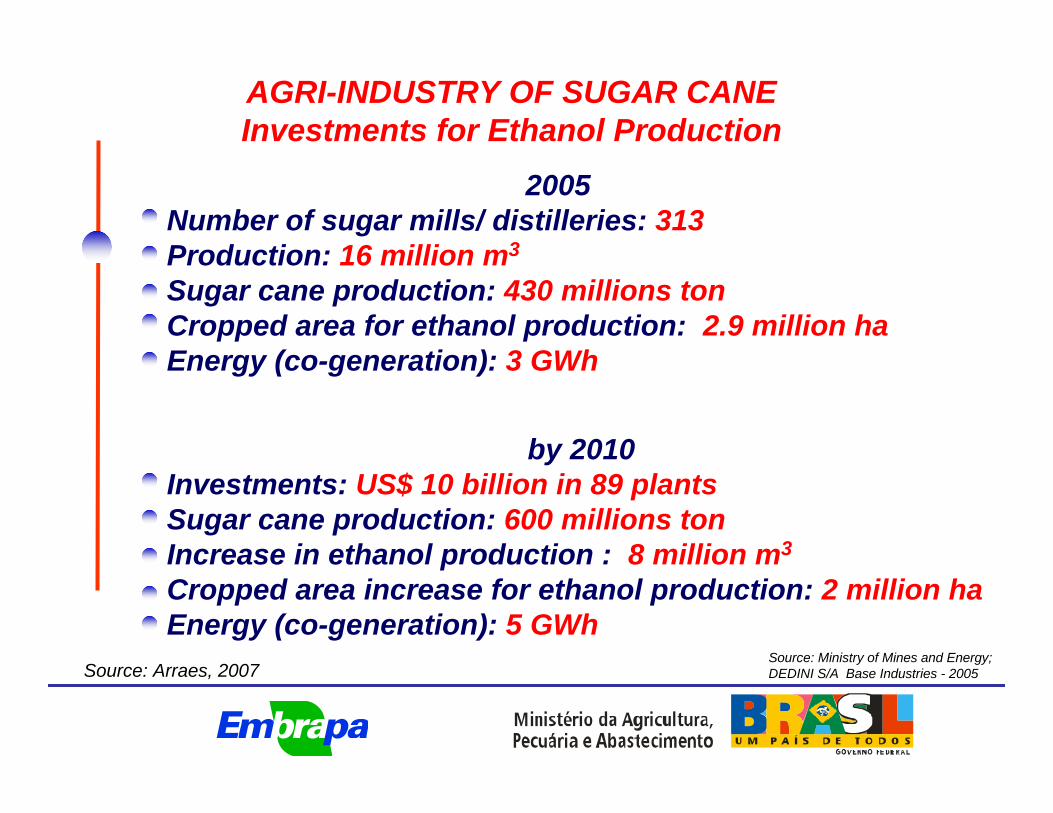
AGRI-INDUSTRY OF SUGAR CANEInvestments for Ethanol Production
2005Number of sugar mills/ distilleries: 313Production: 16 million m3
Sugar cane production: 430 millions ton Cropped area for ethanol production: 2.9 million haEnergy (co-generation): 3 GWh
by 2010Investments: US$ 10 billion in 89 plantsSugar cane production: 600 millions tonIncrease in ethanol production : 8 million m3
Cropped area increase for ethanol production: 2 million haEnergy (co-generation): 5 GWh
Source: Ministry of Mines and Energy;DEDINI S/A Base Industries - 2005Source: Arraes, 2007
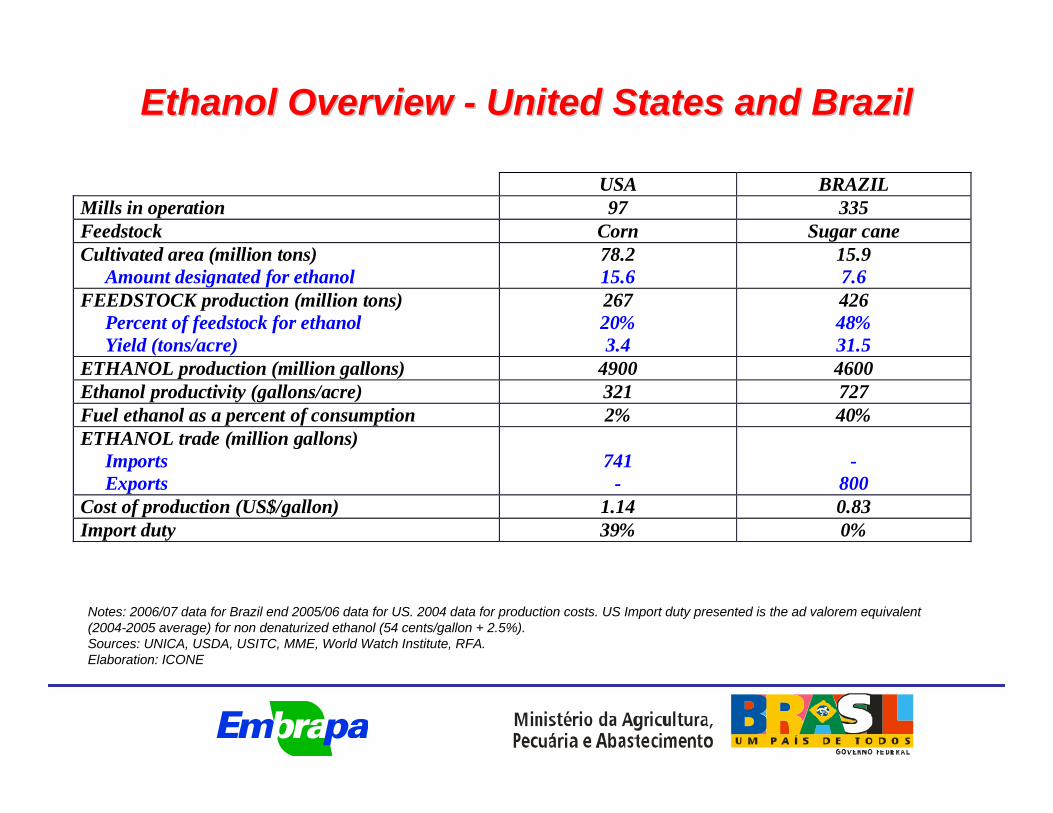
Ethanol Overview Ethanol Overview -- United States and BrazilUnited States and Brazil
Notes: 2006/07 data for Brazil end 2005/06 data for US. 2004 data for production costs. US Import duty presented is the ad valorem equivalent (2004-2005 average) for non denaturized ethanol (54 cents/gallon + 2.5%).Sources: UNICA, USDA, USITC, MME, World Watch Institute, RFA. Elaboration: ICONE
USA BRAZIL Mills in operation 97 335 Feedstock Corn Sugar cane Cultivated area (million tons) Amount designated for ethanol
78.2 15.6
15.9 7.6
FEEDSTOCK production (million tons) Percent of feedstock for ethanol Yield (tons/acre)
267 20% 3.4
426 48% 31.5
ETHANOL production (million gallons) 4900 4600 Ethanol productivity (gallons/acre) 321 727 Fuel ethanol as a percent of consumption 2% 40% ETHANOL trade (million gallons) Imports Exports
741
-
-
800 Cost of production (US$/gallon) 1.14 0.83 Import duty 39% 0%

Biodiesel in Brazil
1970: First experiences (high vegetable oil prices)
1980: First biodiesel patent in the world
2003: Federal Government Working Group
Dec/2003: Inter-ministerial Executive Committee
Dec/2004: Program launching
2005: Started organization of research nets
May/2006: Creation of Embrapa Agroenergia

Biodiesel versus Alcohol: different reasons
Alcohol (1975): basically economics.
Reasons for biodiesel (today):
economic: high crude oil prices again, but Brazilian dependence is now very low
social: needs for jobs and permanent settlement of families in countryside
environmental: to introduce another renewable and friendly fuel
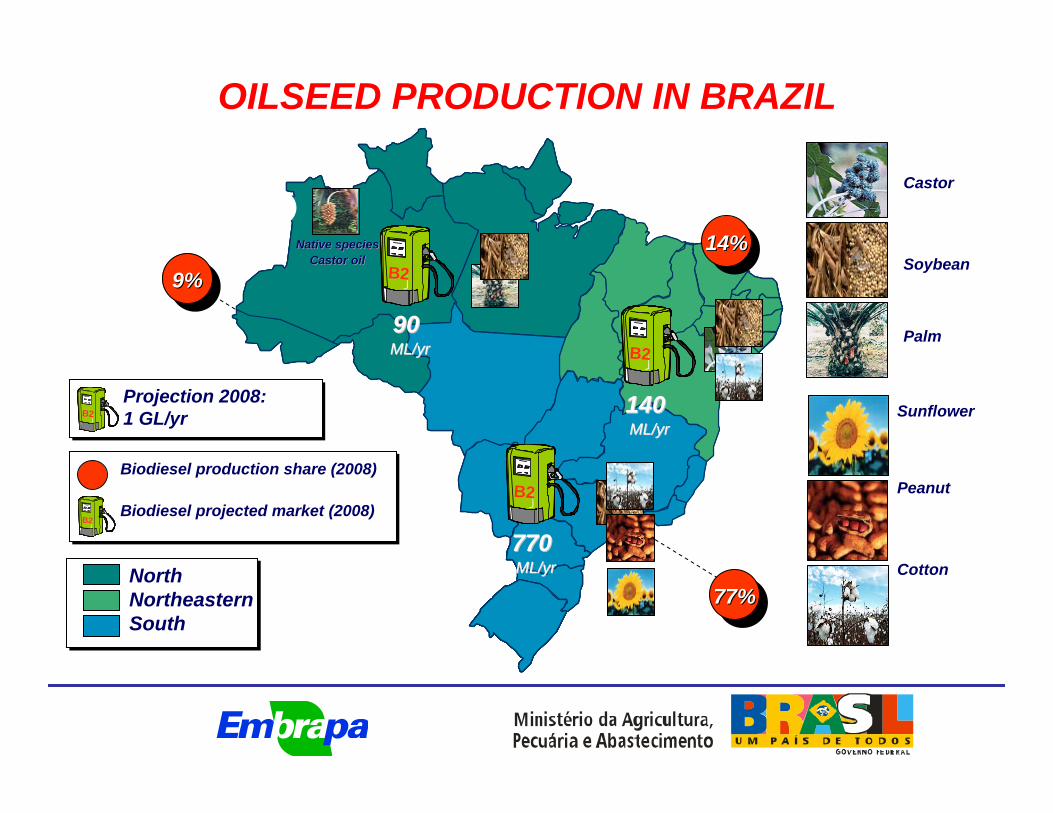
B2B2B2B2
140140ML/ML/yryr
B2B2B2B2
ML/ML/yryr9090
B2B2B2B2
ML/ML/yryr770770
NorthNortheasternSouth
B2B2B2B2
Biodiesel production share (2008)
Biodiesel projected market (2008)
Castor
Soybean
Palm
OILSEED PRODUCTION IN BRAZIL
Sunflower
Peanut
Cotton
NativeNative speciesspeciesCastor Castor oiloil
77%77%77%
9%9%9%14%14%14%
B2B2B2B2Projection 2008: 1 GL/yr
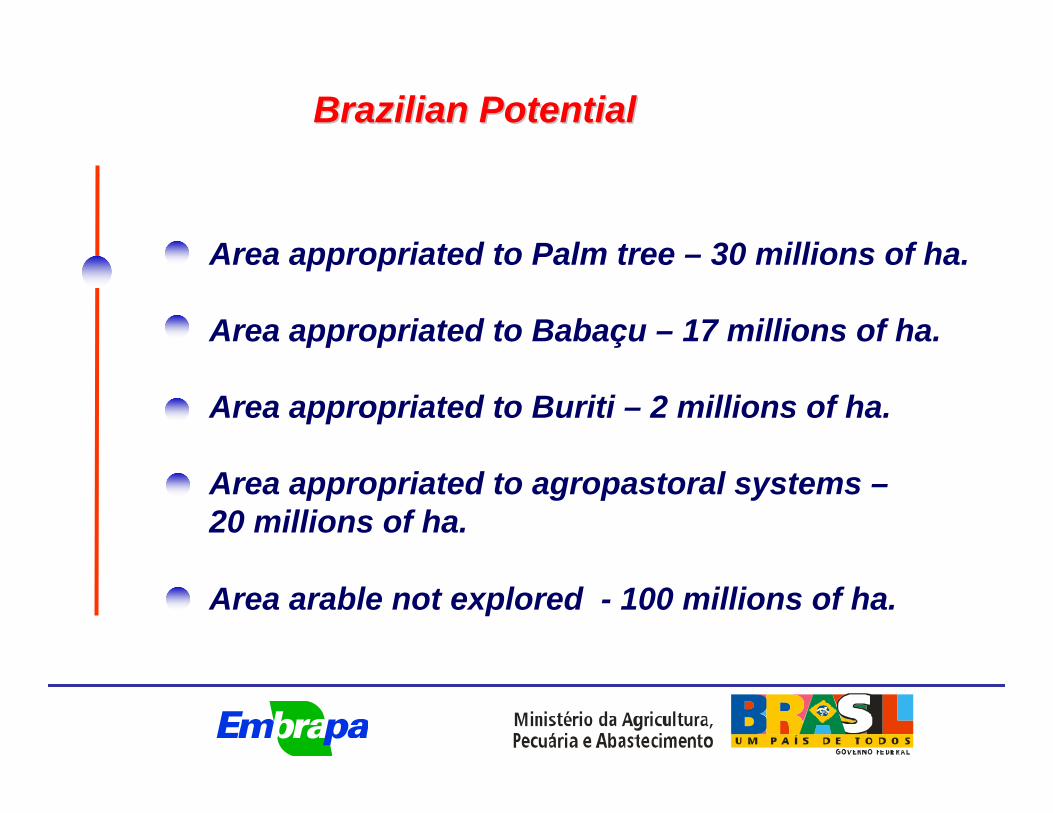
Brazilian PotentialBrazilian Potential
Area appropriated to Palm tree – 30 millions of ha.
Area appropriated to Babaçu – 17 millions of ha.
Area appropriated to Buriti – 2 millions of ha.
Area appropriated to agropastoral systems –20 millions of ha.
Area arable not explored - 100 millions of ha.
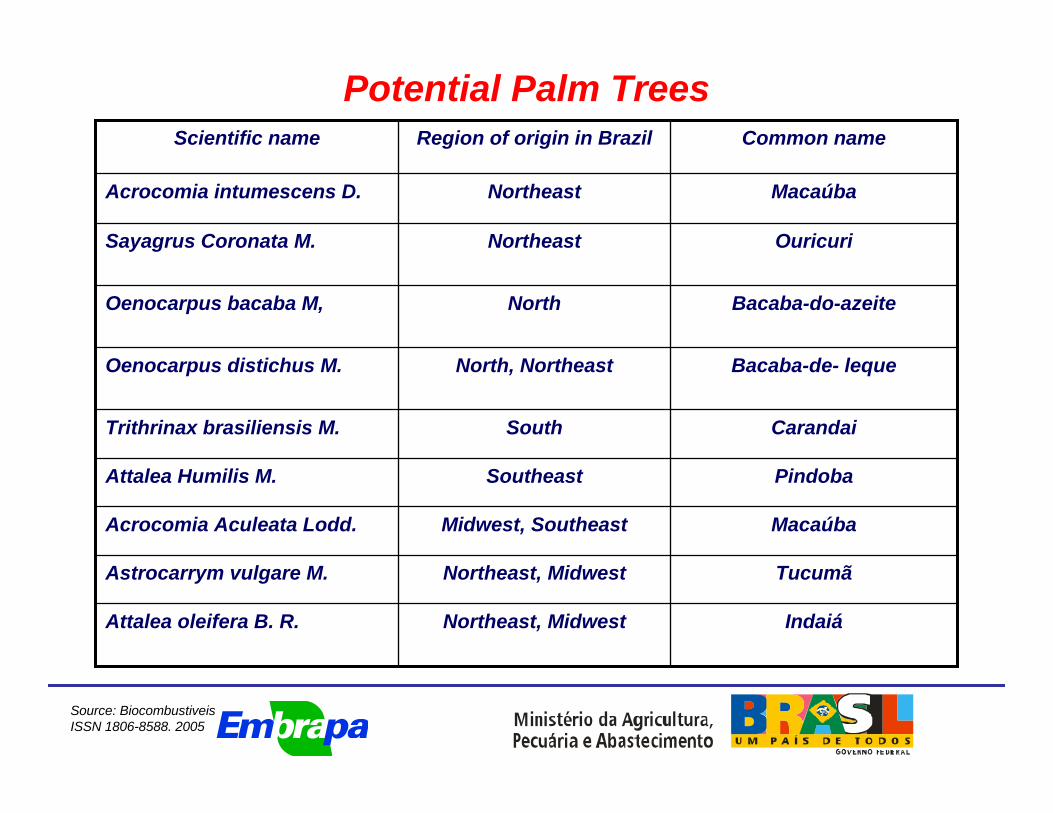
Potential Palm Trees
IndaiáNortheast, MidwestAttalea oleifera B. R.
TucumãNortheast, MidwestAstrocarrym vulgare M.
MacaúbaMidwest, SoutheastAcrocomia Aculeata Lodd.
PindobaSoutheastAttalea Humilis M.
CarandaiSouthTrithrinax brasiliensis M.
Bacaba-de- lequeNorth, NortheastOenocarpus distichus M.
Bacaba-do-azeiteNorthOenocarpus bacaba M,
OuricuriNortheastSayagrus Coronata M.
MacaúbaNortheastAcrocomia intumescens D.
Common nameRegion of origin in BrazilScientific name
Source: BiocombustiveisISSN 1806-8588. 2005
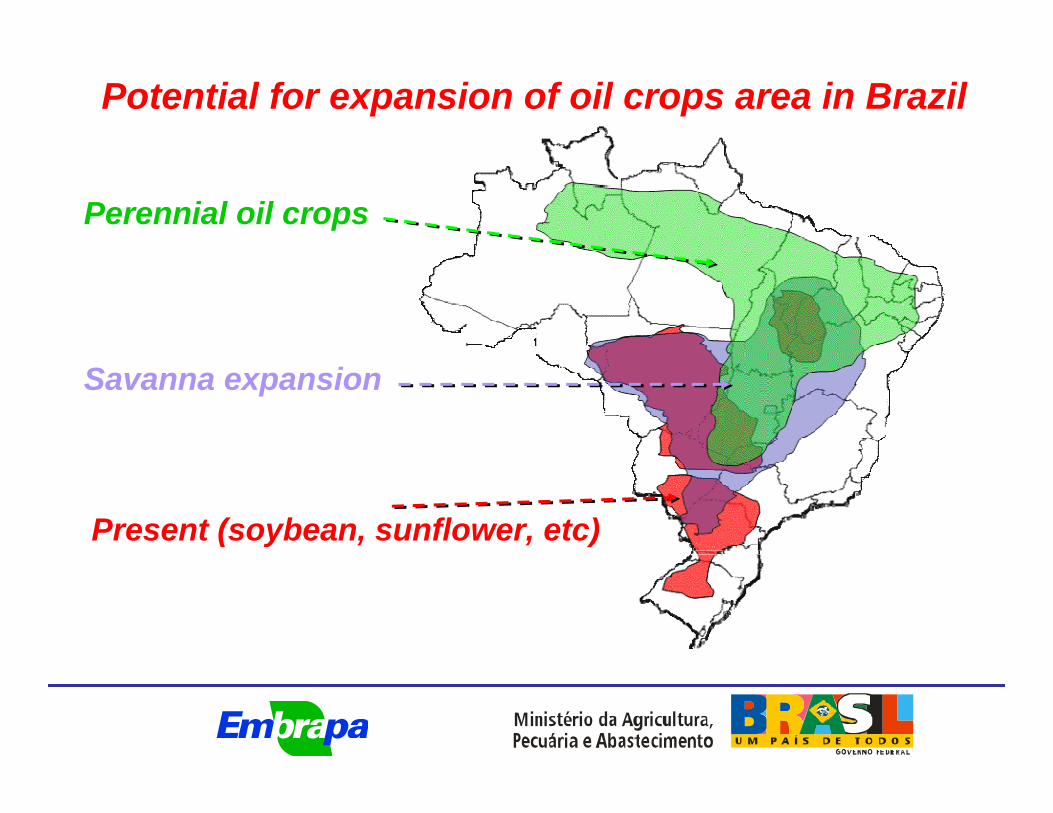
Potential for expansion of oil crops area in Brazil
Savanna expansion
Perennial oil crops
Present (soybean, sunflower, etc)
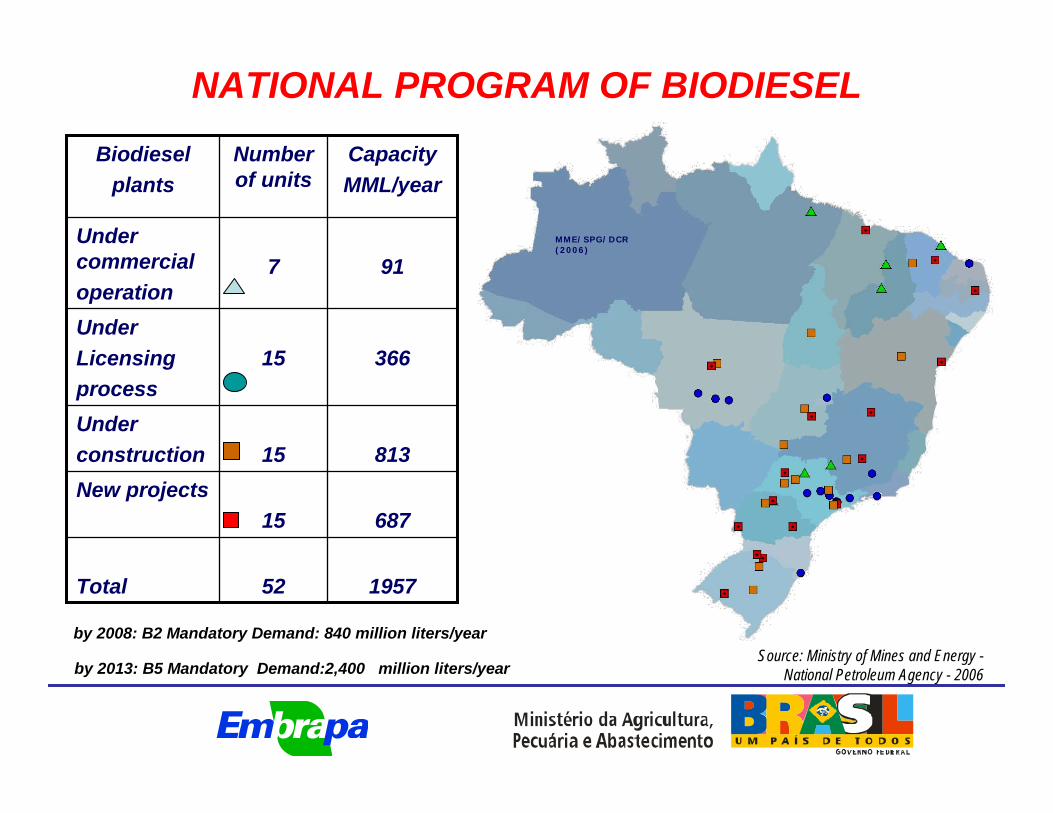
195752Total
68715New projects
81315Underconstruction
36615Under Licensingprocess
917Under commercialoperation
CapacityMML/year
Number of units
Biodieselplants
Source: Ministry of Mines and Energy -National Petroleum Agency - 2006
MME/SPG/DCR(2006)MME/SPG/DCR(2006)
NATIONAL PROGRAM OF BIODIESEL
by 2008: B2 Mandatory Demand: 840 million liters/year
by 2013: B5 Mandatory Demand:2,400 million liters/year
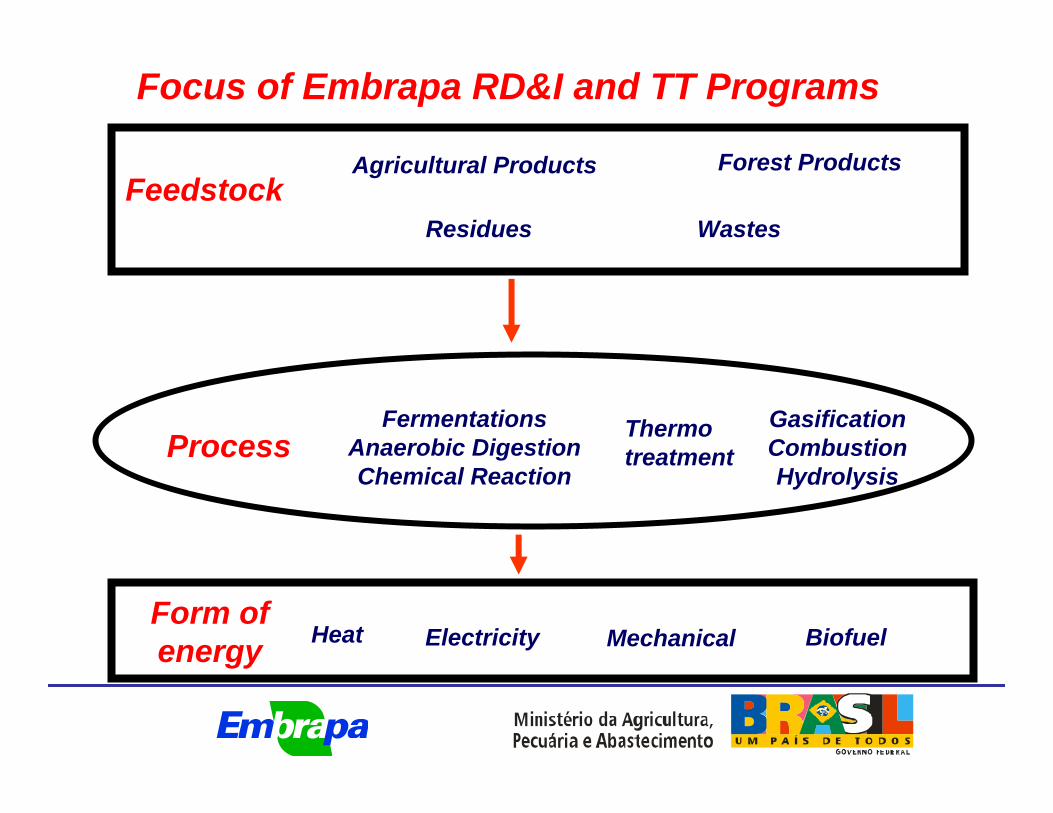
FeedstockAgricultural Products Forest Products
Residues Wastes
ProcessFermentations
Anaerobic DigestionChemical Reaction
Thermo treatment
GasificationCombustionHydrolysis
Form ofenergy Heat Electricity Biofuel
Focus of Embrapa RD&I and TT Programs
Mechanical
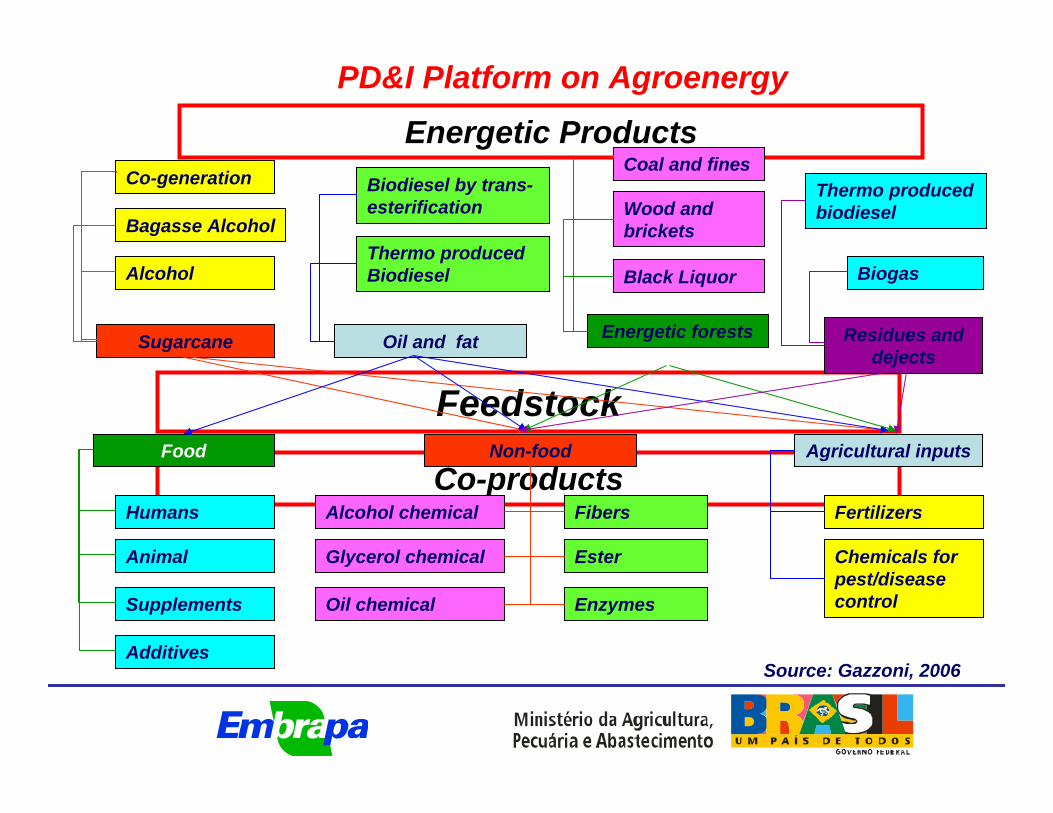
Energetic Products
Co-products
Feedstock
Sugarcane Oil and fat Energetic forests Residues and dejects
Alcohol
Bagasse Alcohol
Co-generation Biodiesel by trans-esterification
Thermo produced Biodiesel
Wood and brickets
Coal and fines
Black Liquor
Thermo produced biodiesel
Biogas
Food Non-food
Humans
Animal
Supplements
Glycerol chemical
Oil chemical
Fibers
Ester
Enzymes
Alcohol chemical
Agricultural inputs
Additives
Fertilizers
Chemicals for pest/disease control
PD&I Platform on Agroenergy
Source: Gazzoni, 2006
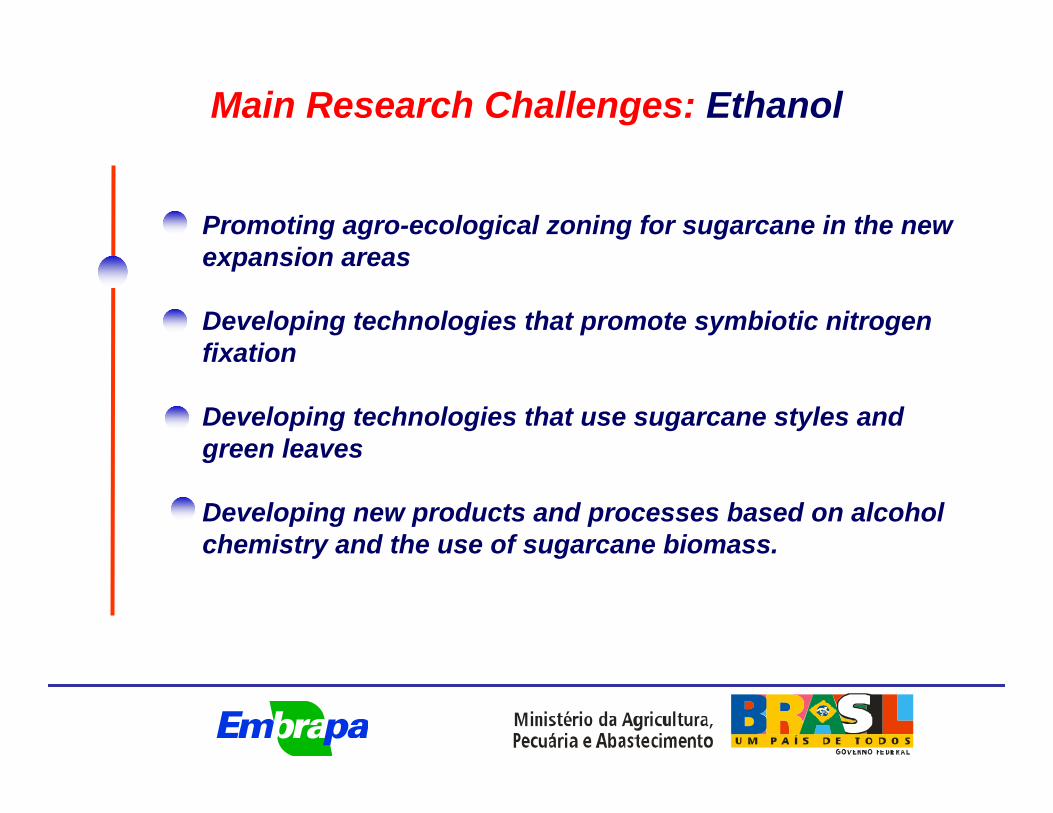
Main Research Challenges: Ethanol
Promoting agro-ecological zoning for sugarcane in the newexpansion areas
Developing technologies that promote symbiotic nitrogenfixation
Developing technologies that use sugarcane styles andgreen leaves
Developing new products and processes based on alcoholchemistry and the use of sugarcane biomass.
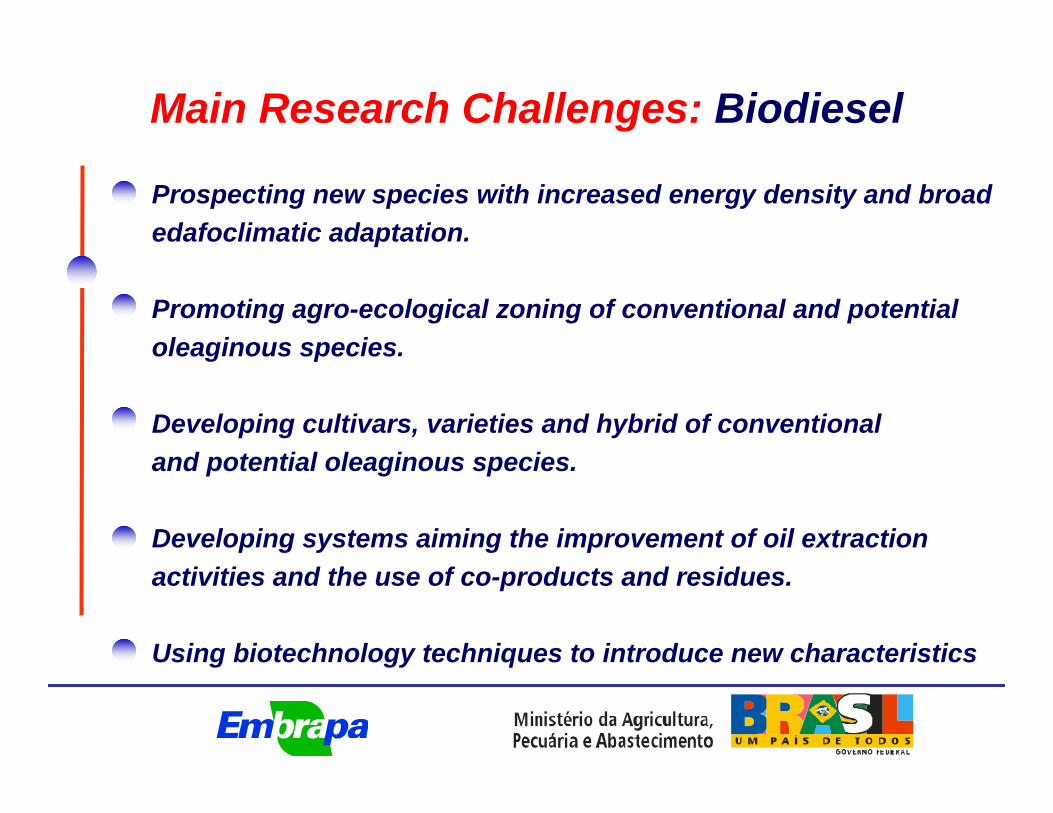
Main Research Challenges: Biodiesel
Prospecting new species with increased energy density and broad edafoclimatic adaptation.
Promoting agro-ecological zoning of conventional and potentialoleaginous species.
Developing cultivars, varieties and hybrid of conventional and potential oleaginous species.
Developing systems aiming the improvement of oil extraction activities and the use of co-products and residues.
Using biotechnology techniques to introduce new characteristics
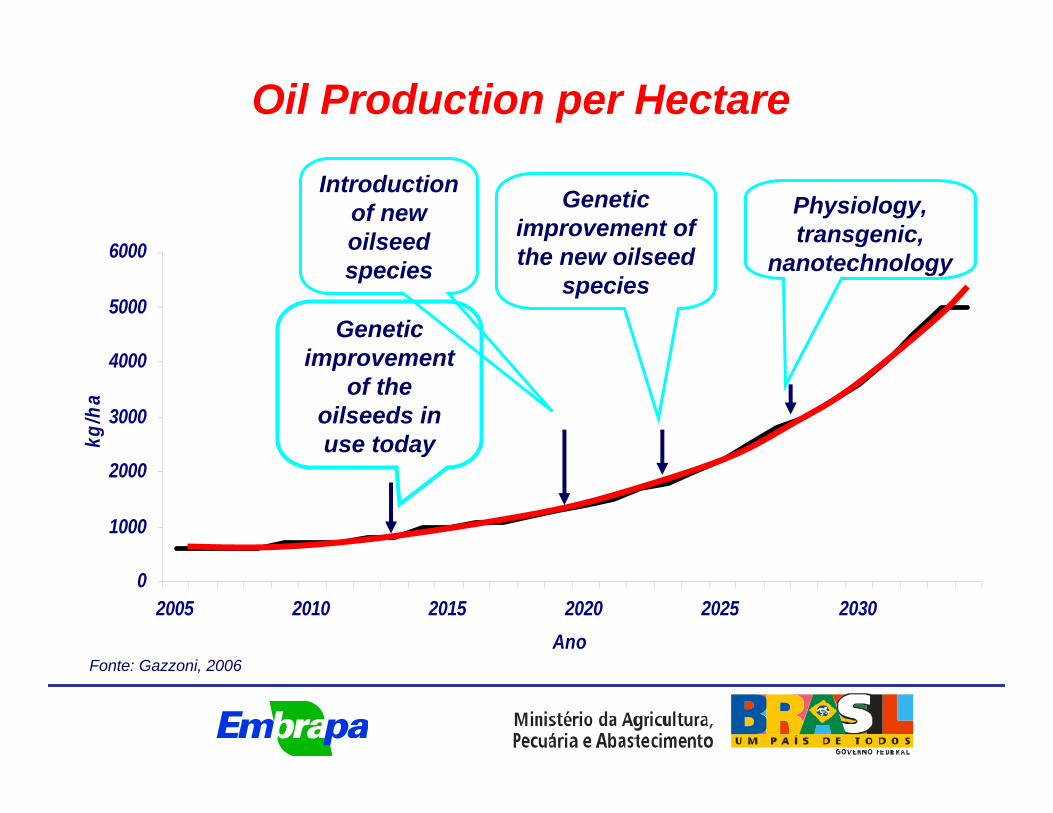
Oil Production per Hectare
0
1000
2000
3000
4000
5000
6000
2005 2010 2015 2020 2025 2030Ano
kg/h
a
Genetic improvement
of the oilseeds in use today
Introduction of new oilseed species
Genetic improvement of the new oilseed
species
Physiology, transgenic,
nanotechnology
Fonte: Gazzoni, 2006

Main Research Challenges: Forest
Developing technologies, which will enable theestablishment of energy forest in areas unsuitablefor agriculture and in areas degraded due toImproper agricultural management.
Developing agro-forest arrangement appropriated for small farmers.
Encouraging the use of geographic informationsystem technology in planning the use of energy from forest biomass.
Main Research Challenges: Residues and Wastes
Generating technologies that use agricultural residues and forest residues to produce energy
Developing technologies that use residues fromenergy production for other purposes, such as correcting soil acidity or increasing soil fertility.
Main Research Challenges: Industrial Technologies
Improving oil extraction methods, especially fromsmall and medium-sized plants.
Developing and improving the technological pathsof biodiesel production.
Developing studies on the catalysts and reagentsused in industrial processes.
Traditional/biotechnology techniques to introduce new characteristics:
pest resistancedraught resistancesoil acidity and salinity toleranceincrease nutrient uptake efficiency
Energetic efficiency
Energetic density
Input saver
Integrated systems
General Research Challenges

Some accomplishments
Sugar Cane Breeding Programs
Sugar cane varieties550 sugarcane varieties grown in Brazillast 10 years - 51 new varieties20 main varieties account for 70% of the planted area
Main Breeding ProgramsCopersucar - SP varietiesRidesa (universities network) RB varieties.Agronomic Institute of São Paulo State - IAC varieties
Germplasm Bank: 3000 entries
Two hybridizations stations: each of the main programs carriedon 1.420.000 seedlings /year
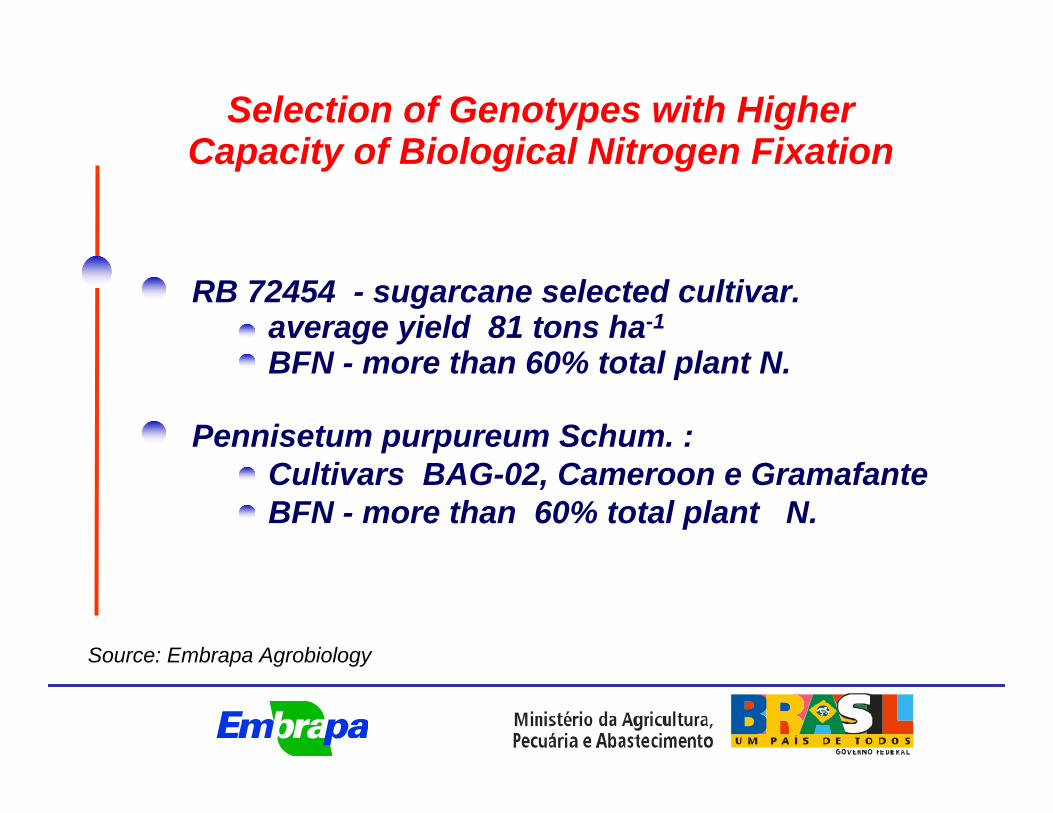
RB 72454 - sugarcane selected cultivar.average yield 81 tons ha-1
BFN - more than 60% total plant N.
Pennisetum purpureum Schum. :Cultivars BAG-02, Cameroon e Gramafante BFN - more than 60% total plant N.
Selection of Genotypes with Higher Capacity of Biological Nitrogen Fixation
Source: Embrapa Agrobiology
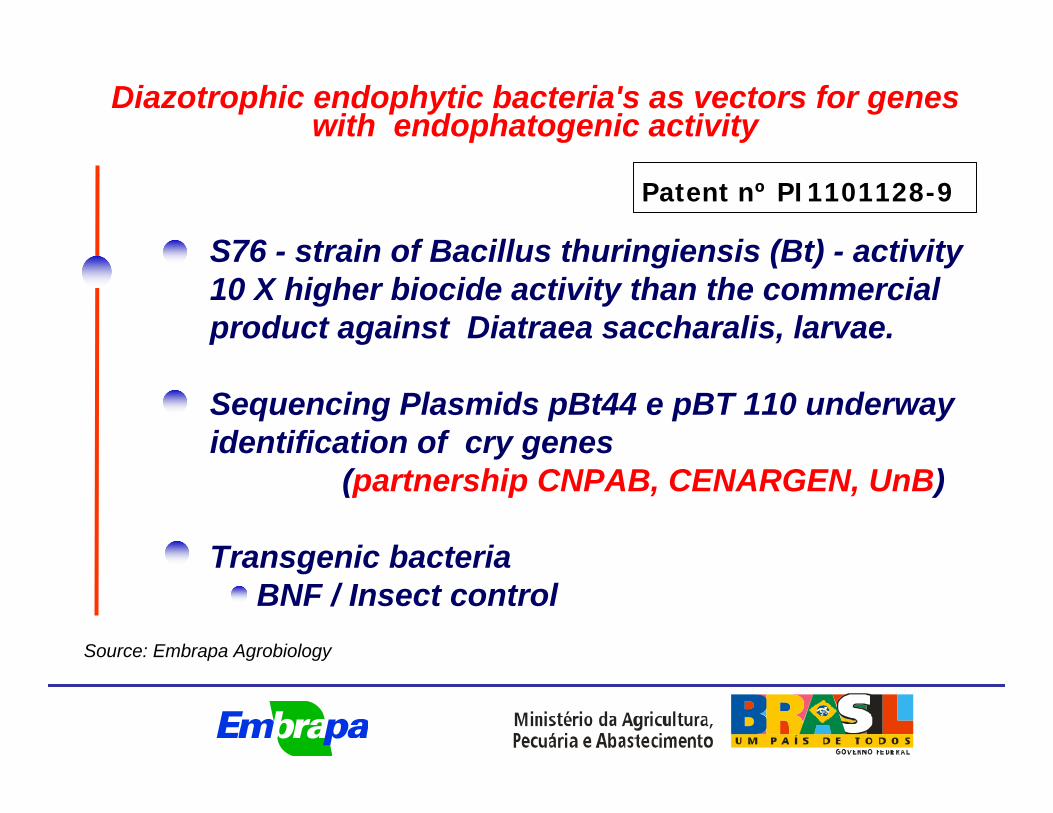
Diazotrophic endophytic bacteria's as vectors for genes with endophatogenic activity
S76 - strain of Bacillus thuringiensis (Bt) - activity 10 X higher biocide activity than the commercial product against Diatraea saccharalis, larvae.
Sequencing Plasmids pBt44 e pBT 110 underway identification of cry genes
(partnership CNPAB, CENARGEN, UnB)
Transgenic bacteria BNF / Insect control
Patent nº PI1101128-9
Source: Embrapa Agrobiology
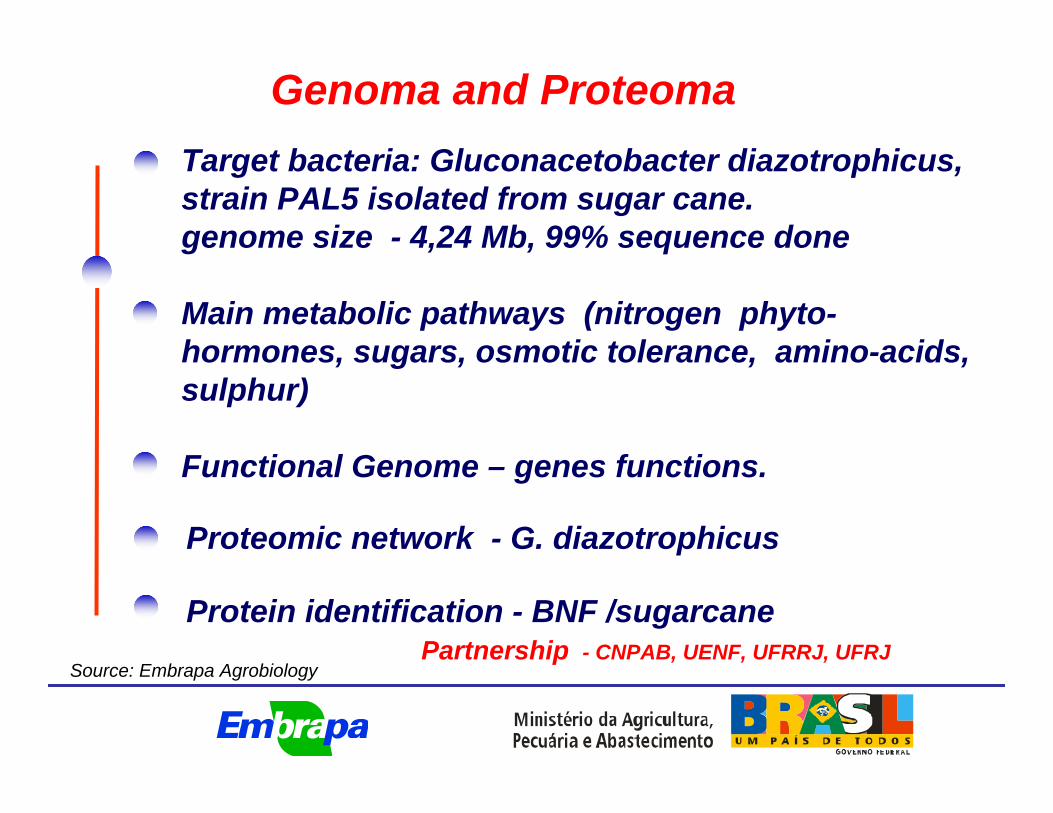
Genoma and ProteomaTarget bacteria: Gluconacetobacter diazotrophicus, strain PAL5 isolated from sugar cane. genome size - 4,24 Mb, 99% sequence done
Main metabolic pathways (nitrogen phyto-hormones, sugars, osmotic tolerance, amino-acids, sulphur)
Functional Genome – genes functions.
Partnership - CNPAB, UENF, UFRRJ, UFRJ
Proteomic network - G. diazotrophicus
Protein identification - BNF /sugarcaneSource: Embrapa Agrobiology
Challenges and Perspectives Challenges and Perspectives for R,D&I for Brazilian for R,D&I for Brazilian
AgroenergyAgroenergy
ThanksThanks
Kepler Euclides FilhoKepler Euclides Filho
Executive DirectorExecutive Director -- EmbrapaEmbrapa
Recommended