This is an excerpt from Measure What Matters, the new book from Katie Delahaye Paine available March 15, 2011 from Wiley Press. Measure What Matters can be preordered now at Amazon.com, Borders, and Barnes & Noble. © 2010 Katie Delahaye Paine
Chapter 7 Measuring the
Impact of Events,
Sponsorships, and Speaking
Engagements
“There is a lot of noise in the world. And there is a
lot of idiosyncrasy. But there are also regularities and
phenomena. And what the data is going to be able to do—if
there's enough of it—is uncover, in the mess and the noise
of the world, some lines of music that actually have
harmony. It's there, somewhere.”
—Esther Duflo
In an era where so much of business is conducted virtually, meeting
customers, prospects, and other stakeholders IRL as they say, or “in real
life,” takes on a very different role than it did in the old days of sales calls
and personal presentations. In today’s world you need to measure and
improve to keep costs down, to compare strategies, and to understand the
true value of your events and sponsorships.
Why Events and Sponsorships?
Generally speaking, organizations decide to participate in or
sponsor an event with one of three goals in mind:
1. Launch new products. Events provide an opportunity to test drive a product or otherwise bring people in direct contact with the brand. So a company might introduce a new product at a trade show so people can experience it in real life.
2. Drive affinity between customers and the brand. Sponsorship can demonstrate your brand’s support for something the customer or prospect is passionate about. So a car dealership or restaurant might support a local school hockey team to show support for the community in hopes that the community will reciprocate and support the car dealer or restaurant. Rolex sponsors historic car races to support historic car enthusiasts, who tend to be an affluent demographic that can afford to buy Rolex products. Such sponsorships can build strong ties that result in passionate loyalty. To this day, I prefer Duracell batteries over other brands because the company was a huge supporter of a sailboat race I followed back in 1994.
3. Reach new markets and customers. To a certain extent there are events and shows in which not showing up says so much about your brand that a company has little choice other than to participate. Your presence at some events can establish your

brand in a marketplace.
Use Data to Support Your Event
Decisions
The one reason not to participate in an event or sponsorship is
“because we always have.” Whether you decide to participate or decide not
to participate, you will need data to support your decision and to evaluate
the efficacy of your participation. Without data, you’re basing decisions on
nothing more than hunches.
For example, whenever I get a request to speak at a conference, I
consult a spreadsheet that compares data on all the speeches I’ve given in
the last year. It shows:
Total attendees. The number I can count in the audience or the
actual attendee list. Never believe conference organizers; they
always exaggerate.
Total views. Actual number of people going to my speech page
on the conference’s website.
Total leads. Number of business cards I bring home.
Site visits. People who visit my own website, www.kdpaine.com,
and move beyond the Speech archives.
Total contacts. Total Contacts = Leads + Visits + Views
Costs. Includes unreimbursed out-of-pocket costs as well as the
cost of my time, less any compensation, speakers fees, or
reimbursements.
I use this spreadsheet to estimate the cost per lead, the number of
leads per attendee, and the cost per contact. This information helps
determine whether I should accept the invitation. Besides helping to make
my speaking career more profitable, this form and process saves me hours
of consideration and debate when a speaking invitation comes in.
Social Media Has Redefined the Concept of
Events
As with most things in marketing today, social media has redefined
events. While some organizations are opting for the “instant store” or
airport or mall kiosk to get attention, an equal number of marketers are
creating virtual events that bring like-minded people together around a
cause, a game, or a memory. “Events” is a term that can now refer to an
online fund-raiser or an in-person Twestival organized via Twitter. As we
have seen with PR and other outreach methods, the companies that do this
best are combining online and real time. What that means for measurement
is that there are multiple dimensions to evaluate for any given event.
Events and the Relationships behind Brand
Engagement: How Are People Involved with
Your Brand?
This question brings us back to the importance of knowing
something more than just how many eyeballs saw your brand, or how many
people walked by your booth or display. A far more valuable measure is
how many people are somehow engaged with your brand or your
organization, and what is the nature and strength of that relationship?
In his seminal book Lovemarks, Kevin Roberts, CEO of Saatchi and
Saatchi, describes how we develop relationships with the brands we love.
Roberts argues that if a brand offers mystery, sensuality, and intimacy, it
has the makings of a Lovemark. I argue that Lovemarks are all about
building and nurturing relationships around a brand.
In fact, a 2004 study by Jack Morton Worldwide found that live
event marketing—experiences in which consumers interact with products,
brands, or brand ambassadors face-to-face—is among the most effective
ways to influence coveted consumer audiences
(www.accessmylibrary.com/coms2/summary_0286-19969873_ITM). The
study, an online survey of 2,574 consumers between the ages of 13 and 65
in the top 25 U.S. markets, confirmed that this increasingly important
marketing medium resonates strongly across all demographic and product
categories.
So sponsorships, events, and other word-of-mouth programs have
taken on a far more critical role than ever before. But it is no longer enough
to simply measure the number of eyeballs reached by a bunch of banners or
T-shirts. Today’s savvy marketers are demanding much more than CPM
numbers. They are looking to measure the relationships they are
developing, both in terms of attitude change and in terms of buying and
behaviors.
Seven Steps to Measure
Sponsorships and Events
While measuring trade shows, events, and sponsorships are
essentially three different things, the basic steps that need to be completed
are similar and follow the seven steps described in Chapter 3.

Step 1: Define Your Objectives
As with any effort, you can’t start to measure the success of an event
until you know what success means for you. So the first thing to do is get
consensus on goals and objectives for the event or sponsorship. If you are
dealing with multiple audiences (consumer, corporate, institutional), then
list those audiences and attach priority levels to each one.
In my experience, the great majority of companies cite product or
corporate awareness as their primary objective. Other typical objectives
include the following, each listed with typical measures.
Sell Products If you are just trying to sell products, then you will use basic
measures such as: Gross sales per time period, before and after the event.
Change in length of sales cycle.
Change in intent to purchase.
Change in traffic to website or brick-and-mortar locations.
Launch New Products This goal requires measures such as: Increase in market share.
Increase in market penetration.

Number of qualified leads for new product lines.
Ratio of new to existing customers.
Ratio of new to repeat visitors to website.
Increase in depth or breadth of customer base.
Drive Affinity between Customers and the Brand If the event is designed to bring in new clients or improve
relationships with old ones, then you will use measures such as: Increase in brand engagement.
Increase in awareness.
Increase in preference.
Increase in exposure and dissemination for the company name,
brand, or products.
Increase in company or product knowledge among specific
publics.
Reach New Markets and Customers If you are attending shows to get leads, build fan bases, and/or
generate attendees, you will use measures such as: Increase in new market-specific sales leads.
Increase in awareness or preference or intent to purchase in the
new market.
Increase in mindshare.

Step 2: Determine Your Measurable Criteria
of Success
Once you’ve agreed upon your objectives, establish the specific
criteria of success that you will measure. If your objective is awareness, a
criterion might be the percentage increase of unaided awareness of brand or
product. If your objective is to sell product, your criterion might be the
incremental sales or traffic to local dealers after a particular PR or
promotional program took place.
Consider using metrics that best reflect the health of your business or
that best represent customer characteristics that most affect your business,
including:
Percent of attendees more likely to purchase.
Percent of attendees remembering the brand.
Number of qualified sales leads generated.
Conversion rate of attendees.
Total potential sales (number of attendees x conversion rate x
average sale).
For press events: Number of key editors and analysts attending.
Percent of attendees writing on or quoted on a particular issue.
Total exposure of key messages in resulting press.
Number of tweets or retweets of speeches or presentations.
Percent conversion from a specific event website to a corporate
site.
To a certain extent, your choice of criteria is dependent on the type
of event you are evaluating. If the customer experience you are measuring
takes place at a trade show or exhibit booth, you might choose as a key
criterion the percentage of new visitors or the cost-per-minute spent with a
client in the booth. If the experience takes place at an event such as a
concert, count how many people were exposed to your brand or the brand
experience you were offering. Don’t trust the promoter’s numbers; do your
own counting. I often follow up with a survey to see if attendees remember
the brand.
Step 3: Decide Upon Your Benchmarks
The key point to remember about any evaluation program is that
measurement is a comparative tool: You need to compare one set of results
to something else. The most meaningful comparisons are between different
events or between you and competing sponsors at one event.
Define your benchmarks based on the decisions you need to make.
Are you comparing show to show or show vs. direct mail vs. Facebook?
Are you taking into account different geographies or different time frames?
Are you weighing different types of sponsorships: sailing vs. tennis or
sports vs. community?
Step 4: Select a Measurement Tool
In our opinion, the most reliable way to measure relationships with
your customers is to conduct an in-depth phone survey using the Grunig
Relationship Survey (see Chapter 4 and Appendix 1). This instrument has
been thoroughly tested and shown to be an extremely effective measure of
how customers perceive their relationships with an organization. The
Grunig Relationship Survey includes a number of statements with which
respondents are asked if they agree or disagree. Typical statements include:
This organization treats people like me fairly and justly.
This organization can be relied on to keep its promises.
I believe that this organization takes the opinions of people like
me into account when making decisions.
I feel very confident about this organization’s skills.
Online surveys are most organization’s first choice these days.
While they do suffer from self-selecting samples, the advantages of low
cost and quick turnaround are hard to beat. They are particularly effective
in measuring relationships with members of an organization that are all on a
mailing list or Listserv of some sort (Chapter 9).
If you are evaluating whether an event changed perceptions about
your brand, most people would think about doing some kind of on-site
survey, but that’s probably the last thing you should do. By far, the most
valuable assessment can be derived from a post-show survey that will
provide clear insights into visitors’ takeaways—their longer-term
perceptions and memories. These are much more effectively gathered after
the event via an online survey.
My company has conducted numerous trade show surveys, both on-
site and after events, with samples composed of people who actually visit a
booth. Typically, about 20 percent of people surveyed (and, remember,
these are people who had to be in the booth for us to get their names) do not
recall visiting the booth at all. We find that whatever people do remember
after the show is of greater value than their on-site responses, when they are
often most concerned about their sore feet.
For example, data from post-show surveys is far more revealing and
reliable about purchase intent. If you ask event attendees at a show if they
are likely to purchase a product, chances are they’ll say yes just to make the
interviewer happy. But if you call after the fact and ask if they have
purchased or intend to purchase, the response is far more likely to reflect
reality. Remember, however, that in event measurement time is of the

essence. You need the data in time to make decisions, and typically those
decisions are made fairly quickly after an event is concluded.
An alternative to the on-site or post-show survey is to closely track
website traffic before, during, and after an event to determine if there are
any significant changes as a result of the event. Or, if you are a consumer
packaged-goods company, you can use scanning data to track sales impact.
As an example, Colgate Palmolive sponsored the Starlight Starbright
Children’s Foundation and promoted it in point-of-sale communications for
several specific brands. It then tracked the sell-through of those brands after
the sponsorship was launched. As it turns out, the sponsorship was very
effective for boosting sales of some of its brands but had little impact on
others.
In another example, the Humane Society used a simple “Donate $1”
to judge the effectiveness of a “Cute Puppy Photo Contest” on Flickr and
raised some $650,000. But to correlate events to sales or donations requires
close coordination between your web analytics and event planning.
An alternative made possible by the real-time world of social media
is to create a hashtag (a nickname for your event preceded by the # sign) to
help you search and track any and all references to the event. Then you can
follow the real-time comments on Twitter and other social networking sites
to see how people perceive your brand or the event.
Step 5: Define Your Specific Metrics
If your goal is to change people’s opinions about you—to convince them that you are in the market, or back in the market, or doing better than your competition—then your metrics will be:
Percent change in perceptions.
Percent change in awareness.
Percent increase in preference.
Percent of attendees likely to purchase.
If your goal is to sell stuff, your metrics might concern greater efficiency as measured by:
Cost per contact. Event budget divided by the number of people
who had the opportunity to see your brand, whether in the booth,
via other media, on Twitter, or wherever.
Cost per lead. Event budget divided by the number of raw leads
you collect.
Cost per qualified lead. Event budget divided by the number of
qualified leads.
Cost per customer acquisition. Event budget divided by the
number of actual customers acquired from the event.
Cost per minute spent with prospect. This is a particularly useful
metric if you are comparing events to direct sales activities. What
does it cost you to spend time with a prospect at a show versus
the cost of a sales call (typically north of $300)? You’ll need to
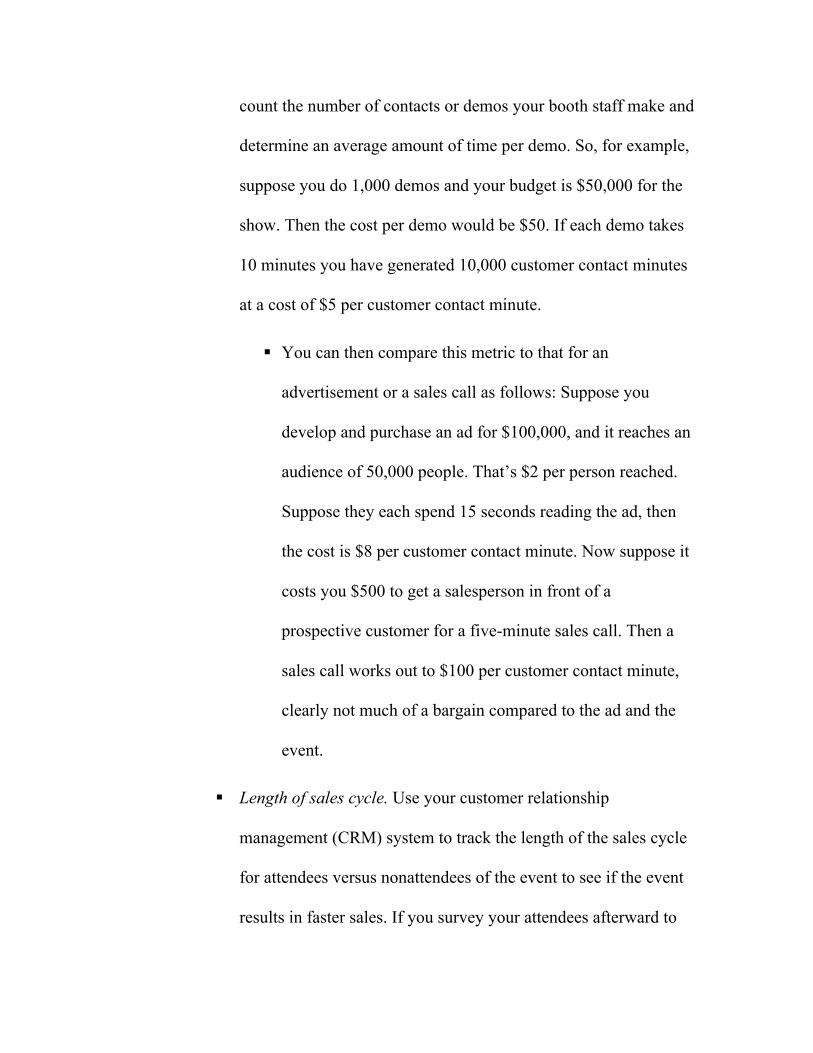
count the number of contacts or demos your booth staff make and
determine an average amount of time per demo. So, for example,
suppose you do 1,000 demos and your budget is $50,000 for the
show. Then the cost per demo would be $50. If each demo takes
10 minutes you have generated 10,000 customer contact minutes
at a cost of $5 per customer contact minute.
You can then compare this metric to that for an
advertisement or a sales call as follows: Suppose you
develop and purchase an ad for $100,000, and it reaches an
audience of 50,000 people. That’s $2 per person reached.
Suppose they each spend 15 seconds reading the ad, then
the cost is $8 per customer contact minute. Now suppose it
costs you $500 to get a salesperson in front of a
prospective customer for a five-minute sales call. Then a
sales call works out to $100 per customer contact minute,
clearly not much of a bargain compared to the ad and the
event.
Length of sales cycle. Use your customer relationship
management (CRM) system to track the length of the sales cycle
for attendees versus nonattendees of the event to see if the event
results in faster sales. If you survey your attendees afterward to
determine whether they plan to purchase your products and how
soon, you can compare the results show-by-show to your overall
company average.
Step 6: Choose a Measurement Tool
Counting Tools A clicker. Sometimes the easiest thing to do is to just stand in the
booth and count bodies. Use a regular clicker and count the
average number of people in the booth at the top of the hour.
Repeat at random times throughout the day to get an average.
Categorization. It helps to categorize event attendees by the
degree to which they are engaged in your event. Are they just
looking at your signage, or are they actually entering the booth
and having a conversation? What percentage of attendees ends up
as leads?
Survey Tools We recommend post-show electronic surveys (SurveyMonkey or
Benchpoint) because they will test what people ultimately
remember about the event experience not just their on-site
reactions.
Sales Tracking Tools
You need a database to enter leads and track them through the
sales process, be it a simple contact manager like the one in
Outlook, or some form of CRM system like SalesForce or
FileMaker.
Web Analytic Tools Whether you’re an e-commerce company or just drive people to
your website for more information, you need to determine
whether your activities at the show are helping engage your
potential customers. Google Analytics works just fine, but if
you’re already using something like Omniture or WebTrends it’s
even better. Create a unique URL for your event to which all
event-related traffic is directed. You can then see how much
traffic comes into that specific URL and where it goes once
people are done on that page. Do they leave your site completely,
or do they go elsewhere on your site for information about your
products or company?
Content Analysis Tools If you want to track what people say about your event, both
before and afterward, you will want to scan social as well as
traditional media. Assuming you have used a hashtag on Twitter,
you should be able to easily track conversations there. You can
set up Google Alerts or use your existing clipping service, but
make sure you begin tracking the buzz as soon as you put your
marketing materials out there.
Separate out your self-manufactured buzz (tweets, Facebook
page, blogs, SlideShare, etc.) from the content that other people
have put out there. Note the medium, the data, the author, and, if
possible, the source. Was it from a speaker, an attendee, or a
competitor?
You’ll want to analyze all the content for the following elements:
Product mentions. Did the products you featured at the
show appear in the conversations? Did they show up more
prominently or visibly than the competitions’ products?
Messaging/positioning. Do the conversations position you
in the marketplace the way you want to be positioned?
Key messages. Do they appear at all? If so, are they fully
communicated, or only partially, or—God forbid—
inaccurately repeated? Were attendees so engaged that they
amplified your messages?
Quotes. Did you have thought leaders speaking at the
event? Were they followed? Were they retweeted? Are
they amplifying your key messages?
Visibility and prominence. Were your announcements
covered in headlines or were you a minor mention? Did
photos appear?
Step 7: Analyze Your Results and Use Them
to Make Your Events More Effective
Using a combination of your web analytics and CRM system you
should be able to get a good profile of who was at your event and what they
did as a result. If you do use a follow-up survey, try to get as much
information as possible from visitors as to what made them come, what was
memorable, and what they plan to do with the information they gleaned.
Analyze and learn from the survey results. Determine what specific
elements engaged them with your brand. What specific part of your
marketing program helped them decide to attend? What elements were
most memorable?
Don’t just compare events; look at the big picture. Are events the
most efficient way to get your message across or to get new leads?
Compare online events to real-life events.
How to Calculate ROI for a Booth

at an Event: Was It Worth the Time
and Resources?
It is fairly straightforward to determine your return on an event.
First, ask your sales and accounting departments for figures on the average
profit margin on a sale and the total cost to attend the event. Then
determine how many people visited the booth and conduct a post-show
survey of all the leads collected in your booth. Ask respondents if they
intend to purchase, when they intend to purchase, and how much they
intend to spend. Be clear that you are measuring intentions not actual
purchases.
Now use this data to calculate ROI. Here’s how it works: If 50
percent of respondents indicate that they intend to purchase and you know
that 1,000 people visited your booth, that means that 500 people intend to
purchase something from your organization. If, on average, the respondents
indicate that they each plan to spend $1,000 on your products or services at
some point in the next six months, then you can project approximately
$500,000 in sales from the show. Now, to calculate the actual return you
need to multiply that $500,000 by your average profit margin on a sale
(revenue minus cost of goods sold). So if your profit margin is 50 percent,
you can then assume that the actual revenue from the show will be
$250,000. Now take the show’s expenses—including the booth, staff time,
travel, and so forth—and subtract them from that $250,000 and you will
have the net ROI for your event.
Don’t forget to include accurate costs of attending. Travel budgets
are severely restricted these days and a small change in the price of a ticket
can make a big difference.
It’s important to look beyond simple quantitative data, especially if
your objective is exposure, to assess the quality of your communications.
Do attendees remember being in your booth? Did they even know you were
a sponsor? Did they remember your brand, and the brand benefits or brand
positioning you were trying to convey? Did they leave more likely to
purchase or to recommend?
When a company clearly defines its objectives, it becomes a
relatively simple matter to define a set of criteria against which to measure
the company’s relationships with its constituencies in different events. Then
it is possible to compare and contrast results consistently across a number
of different events to ensure that the company has the most effective
sponsorship program possible.
Real-Life Event Measurement Stories
The Case of the Unfocused Auto Manufacturer
I met with a major auto manufacturer that wanted to measure the
effectiveness of different sponsorships. It was spending many millions of
dollars sponsoring car races, golf tournaments, antique car auctions, and a
variety of other events. I asked the assembled executives what they were
trying to achieve by these efforts. The first response was essentially: “We
are a major sponsor of these types of events.” Finally, after about two
hours of discussion, we agreed that the business objective was to drive
potential customers into dealer showrooms.
We began a series of surveys at each event to determine first if the
attendees remembered the sponsors and second if they were more or less
likely to test drive and/or buy the auto manufacturer’s car. We collected
names at the event itself and called attendees two weeks after the event.
Our results showed that, on average, 50 percent of all attendees were
more likely to test drive one of the sponsor’s vehicles after attending the
event. After we had measured several events, we were able to compare
and contrast the cost effectiveness (dollars per person reached) of
different events. See Figure 7.1.

Figure 7.1 Comparing events with projected ROI. Event results
varied greatly.
These results led the auto manufacturer to alter its sponsorship strategies
dramatically and focus more on golf and antique car events rather than
traditional car races. It also enabled the sponsor to better understand the
ROI from each event. By looking at the percentage of people more likely to
go to a dealership, it could determine the number of potential buyers. By
subtracting the cost of the sponsorship from the projected number of car
sales and the profit, it determined a projected ROI from the event.
Country Music Television Tunes In to Its Viewers
Country Music Television (CMT) had a program of sponsoring country
music concerts in Walmart parking lots. The concerts would move from
location to location in tractor trailers. Prior to getting in touch with me, CMT

had measured results by asking the truck drivers how many people
showed up. Realizing that this might not be the most accurate
methodology, it contracted with my company to design a measurement
program for these events.
CMT’s stated purpose was to convince attendees to call their local cable
company and request CMT, or to take some other action on behalf of
CMT. We agreed with CMT that the common criterion against which we
should measure all events was an ad-hoc measure we called “level of
engagement.” This was defined as the average response of attendees, on
a scale of 1 to 5, when asked how much the parking lot event affected their
relationship with CMT. We further defined success as an increase in the
percentage of people willing to take action on behalf of CMT. A sweatshirt
giveaway was included at the events to collect names and addresses of
attendees. We surveyed a sample of these people by phone two weeks
after the event.
Our surveys showed that 93 percent of attendees were willing to take
some action and 89 percent were willing to make a phone call to their local
cable company. We then compared results between different events in
different cities so CMT could determine where to expand the program the
following year.
Recommended