Characteristics of Elementary Schools Achieving Consistently High or Low Percentages of Students at the Provincial
Standard on EQAO Assessments
Prepared for Education Quality and Accountability Office by
Stephen E. Anderson, PhD Professor Educational Administration
Ontario Institute for Studies in Education
Joelle Rodway-‐Macri, M.A., OCT PhD Candidate, Educational Administration Ontario Institute for Studies in Education
Anna Yashkina, PhD Research Consultant
Daniela Bramwell, BA
MA Candidate, Educational Administration Ontario Institute for Studies in Education
May 2013
Disclaimer
The research study that provides the basis for this paper was commissioned and funded by the Ontario government’s Education Quality and Accountability Office. The findings and conclusions presented in this paper are those of the author and do not represent the official positions or policies of the funder or of the researchers’ educational institution.
L'étude qui a servi de base à cette communication a été commandée par l'Education Quality and Accountability Office/Office de la qualité et de la responsabilité en éducation (EQAO/OQRE) du gouvernement de l'Ontario. Les résultats et les conclusions présentés ici sont ceux de l'auteur et ne représentent pas la position officielle ou les politiques du bailleur de fonds ou de l'établissement d'enseignement du chercheur.

Acknowledgements
This comparative investigation of school effectiveness characteristics in high performing and low performing Ontario elementary schools was commissioned by EQAO. The investigation was conducted during the 2010-‐2011 academic year. As Principal Investigator for this study I would like to acknowledge the contributions of persons who collaborated in the design and implementation of the study. Nancy Watson provided important input into the design phase of the study. A team of graduate students in the Educational Administration program from OISE University of Toronto assisted with site visit data collection (interviews, observations) in the 22 participating elementary schools, including Joelle Rodway-‐Macri, Lauren Segedin, and Stephanie Tuters. Denise Wilson, an independent research consultant, aided with data collection in the French language schools. Dr. Anna Yashkina played a key role in the design of the Teacher Survey and in statistical analysis of the survey data. Ms. Rodway-‐Macri played a vital role in managing the qualitative data set (school interviews) and assisted with the analysis. Ms. Bramwell contributed to the final phases of qualitative data analysis. Completion of this study would not have been possible without the contributions of this team based at OISE/UT. EQAO authorities and staff also played key roles in the design and execution of this study. The study was originally conceptualized by the EQAO Research Committee in consultation with EQAO Research Director, Dr. Michael Kozlow and with its external consultant, Dr. Todd Rogers. The Committee advised on and approved the original research design and instruments. Dr. Kozlow and his staff took responsibility for identifying and recruiting the participating schools. A team of EQAO Outreach staff (all former principals) participated in the site visits, and assisted with the school individual and focus group interviews. Dr. Kozlow, Dr. Rogers and the EQAO Research Committee provided important feedback and suggestions regarding the format and content of the final report. Particular thanks is due to Dr. Rogers for his careful review and suggestions regarding the analysis and reporting of Teacher Survey findings. Dr. Kozlow and the Research Committee deserve my appreciation for their patience and interest as the findings from this study have emerged and been translated into this technical report. Although the schools that participated in this study remain anonymous in this report, we are of course entirely indebted to the principals, teachers, students and parents who voluntarily opened their doors and contributed their experiences and thoughts about factors contributing to and hindering school effectiveness in their particular settings. We have done our best to ensure that their views are accurately and fairly represented throughout this report. Stephen E. Anderson May 2013
i
Table of Contents Chapter 1 -‐ Introduction .............................................................................................................. 1
1.0 Background ...................................................................................................................... 1
1.1 Theoretical and Conceptual Background to the Study .................................................... 2
1.2 Purpose and Research Questions .................................................................................... 4
Chapter 2 -‐ Research Design and Methods ................................................................................. 6
2.0 Overview of the Research Design .................................................................................... 6
2.1 Selection of Schools ......................................................................................................... 6
2.1.1 School Sample Criteria ..................................................................................................... 6
2.1.2 School Sample ................................................................................................................. 8
2.2 Data Collection Instruments and Procedures .................................................................. 9
2.2.1 Interview Guides ............................................................................................................ 10
2.2.2 Teacher Survey .............................................................................................................. 11
2.2.3 Classroom Observation .................................................................................................. 13
2.2.3 Focus Groups (teacher, student, parent) ....................................................................... 14
2.3 Data Analysis Process ..................................................................................................... 14
2.3.1 Interview and Focus Group Data ................................................................................... 14
2.3.2 Teacher Survey Data ...................................................................................................... 16
2.4 Cautionary Note ............................................................................................................. 19
Chapter 3 -‐ Educational experiences of students ...................................................................... 20
3.0 Introduction ....................................................................................................................... 20
3.1 Teacher Survey Data ........................................................................................................... 20
3.1.1 Teacher Beliefs ................................................................................................................. 20
3.1.2 Pedagogical Autonomy .................................................................................................. 23
3.1.2 Instructional Practices: Teacher Survey ......................................................................... 26
3.1.3 Student Assessment Practices ....................................................................................... 27
3.2 Instructional Practices: Teacher and Principal Interviews ............................................. 28

ii
3.2.1 Teaching and Learning in High Performing Schools ....................................................... 34
3.2.2 Teaching and Learning in Low Performing Schools ....................................................... 38
3.3 School Climate ............................................................................................................... 42
3.4 Student Focus Groups .................................................................................................... 43
3.4.1 School Climate ............................................................................................................... 43
3.4.2 Assessment of Learning ................................................................................................. 44
3.4.3 Assistance with Learning Problems ............................................................................... 45
3.4.4 Learning at Home .......................................................................................................... 46
3.4.5 The Purpose of Learning ................................................................................................ 47
3.4.6 Main Points and Comparison High and Low performing Schools: Student Views ......... 48
Chapter 4 -‐ School Success Perspectives .................................................................................. 50
4.0 Introduction ................................................................................................................... 50
4.1 Meaning of Success ........................................................................................................ 50
4.1.1 Meaning of Success in High Performing Schools ........................................................... 52
4.1.2 Meaning of Success in Low Performing Schools ............................................................ 53
3.1 School Strengths ............................................................................................................ 54
4.2.1 School Strengths in High Performing Schools ................................................................ 58
4.2.2 School Strengths in Low Performing Schools ................................................................ 60
4.3 School Challenges .......................................................................................................... 61
4.3.1 School Challenges in High Performing Schools .............................................................. 66
4.3.2 School Challenges in Low Performing Schools .............................................................. 67
4.4 School Success Factors ................................................................................................... 69
Chapter 5 -‐ School Improvement Processes ............................................................................. 72
5.0 Introduction ................................................................................................................... 72
5.1 School Goals ................................................................................................................... 72
5.1.1 School Goals: Teacher Survey ........................................................................................ 72
5.1.2 School Goals: Teacher and Principal Interviews ............................................................ 73

iii
5.1.2.1 School Goals in High Performing Schools ............................................................... 78
5.1.2.2 School Goals in Low Performing Schools ................................................................ 79
5.2 School Improvement Strategies and Planning ............................................................... 81
5.2.1 School Improvement Planning in High Performing Schools .......................................... 82
5.2.2 School Improvement Planning in Low Performing Schools ........................................... 85
5.3 Teacher Development and Collaboration ...................................................................... 90
5.3.1 Teacher Development and Collaboration: Teacher Survey ........................................... 90
5.3.2 Teacher Development and Collaboration: Teacher and Principal Interviews ............. 94
5.3.2.1 Teacher Development and Collaboration in High Performing Schools ....................... 103
5.3.2.2 Teacher Development and Collaboration in Low Performing Schools ....................... 108
5.4 Data Use ....................................................................................................................... 117
5.4.1 Data Use: Teacher Survey ............................................................................................ 117
5.4.2 Data Use: Teacher and Principal Interviews ................................................................ 118
5.4.2.1 Data Use in High Performing Schools ................................................................... 124
5.4.2.2 Data Use in Low Performing Schools .................................................................... 130
5.4.3 Summary of Data Use in Schools ................................................................................. 139
5.5 Monitoring through Principal Walk-‐throughs .............................................................. 141
5.5.1 Principal Walk-‐throughs in High Performing Schools .................................................. 144
5.5.2 Principal Walk-‐throughs in Low Performing Schools ................................................... 145
5.5.3 Summary: Monitoring through Principal Walk-‐throughs ........................................... 146
Chapter 6 -‐ Parent Involvement .............................................................................................. 148
6.0 Introduction ................................................................................................................. 148
6.1 Parent involvement: Teacher survey ........................................................................... 148
6.2 Parent involvement: School Interviews ....................................................................... 150
6.2.1 Parent Involvement Activities in High SES schools ...................................................... 152
6.2.2 Parent Involvement Activities in Low SES Schools ....................................................... 158
6.2.3 Summary of Parent Involvement Activities ................................................................. 164
6.3 Parent Involvement and Community Characteristics .................................................. 165

iv
6.3.1 Parent Involvement and Low SES Communities .......................................................... 165
6.3.2 Parent Involvement and High SES communities .......................................................... 170
Chapter 7 -‐ School Leadership and Improvement .................................................................. 174
7.0 Introduction ................................................................................................................. 174
7.1 School leadership: Teacher survey .............................................................................. 176
7.2 Review of School Leadership Findings: School interviews ........................................... 180
7.2.1 School Leadership in High Performing Schools ........................................................... 181
7.2.2 Principal Leadership in Low Performing Schools ......................................................... 185
7.3 Principal Leadership and School Effectiveness: An Overall Perspective ...................... 189
References ............................................................................................................................... 196
APPENDIX A -‐ TEACHER SURVEY (ENGLISH AND FRANCAIS) ................................................... 200
APPENDIX B -‐ INTERVIEW GUIDES ENGLISH ............................................................................ 216
EQAO Elementary School Success Study ................................................................................. 217
Principal Interview ................................................................................................................... 217
School Success Focus Group ................................................................................................... 223
EQAO Elementary School Success Study ................................................................................ 224
Parent Focus Group ................................................................................................................ 224
APPENDIX C -‐ GUIDES D’ENTREVUE ......................................................................................... 227
Étude de l’OQRE sur la réussite des écoles élémentaires ........................................................ 228
Entrevue avec les directrices et directeurs ............................................................................... 228
Étude de l’OQRE sur la réussite des écoles élémentaires ....................................................... 237
Groupe de discussion sur la réussite de l’école ...................................................................... 237
Groupe de discussion des parents .......................................................................................... 238

v
APPENDIX D -‐ INTERVIEW CODING SYSTEM ............................................................................ 241
About the Authors ................................................................................................................... 245
List of Tables Table 1.1 Correlates of Effective Schools Table 2.1 Average Demographic Data for Schools by Category Table 2.2 School Sample Table 2.3 Interview Links to Research Questions and Effective Schools Correlates Table 2.4 Teacher Survey Scale Links to Effective Schools Correlates Table 2.5 Teacher Survey Scale Reliability Values Table 2.6 Teacher Survey Sample Characteristics Table 2.7 Teacher Classroom Observation Distribution Table 3.1 Teacher Beliefs About Teaching and Learning Table 3.2 Teacher Expectations Table 3.3 Teachers’ Personal Sense of Efficacy Table 3.4 Teachers’ Collective Sense of Efficacy Table 3.5 Pedagogical Autonomy Table 3.6 Pedagogical Autonomy in English and French Language Schools Table 3.7 Instructional Practice Table 3.8 Student Assessment Table 3.9 School Climate Table 5.1 School Goals Table 5.2 Professional Learning Activities Table 5.3 Professional Learning Sources Table 5.4 Professional Community Table 5.5 Data Use Table 6.1 Parental Involvement Table 7.1 Transformational Leadership Practices of Principals Table 7.2 Instructional Leadership Practices of Principals

1
Characteristics of Elementary Schools Achieving Consistently High or Low Percentages of Students at the Provincial Standard on EQAO Assessments
Chapter 1 -‐ Introduction
1.0 Background Since its inception in 1996, The Education Quality and Accountability Office (EQAO) has been charged with the responsibility of evaluating the academic achievement of students across Ontario. This occurs primarily through the annual administration of standardized assessments aligned with the Ontario curriculum content and performance standards in reading, writing, and mathematics at the end of the Primary (Grade 3) and Junior (Grade 6) divisions, as well as at the end of Grade 9 mathematics. EQAO also administers the Ontario Secondary School Literacy Test (OSSLT) at the end of Grade 10, the satisfactory completion of which is a high school graduation requirement. The results of these assessments and the OSSLT are intended to assist school system personnel at the school and board levels with the identification of needs, goals and plans for improvement in student learning, and to inform the public about the status of school performance. As part of its commitment to not only measuring but also promoting student achievement, EQAO provides support to both boards and schools in the use of student performance and related data (e.g., demographic information, student surveys) to inform continuous school planning and improvement processes. These supports include resource materials, as well as access to expertise in the interpretation and use of EQAO data for improvement planning through EQAO’s Outreach Team service. EQAO also has a mandate to undertake research and report on factors affecting school quality. The present report is for a study commissioned by EQAO to explore factors that have helped or hindered schools in enabling students to attain high levels of achievement in varying contextual circumstances. EQAO assessment results have profoundly affected how the Ministry of Education, school boards and schools approach improvement in student learning as a continuous process in schools, and how the public views the quality of schools in Ontario. This is a function not simply of the availability of the assessment results, however, but the use of the results at different levels of the education system to inform priorities, goals and actions to raise the quality of student learning in classrooms and schools across the province. The actions of the Ontario Ministry of Education are key to understanding the province’s generally positive education improvement trajectory over the past decade.
This began with the Provincial government’s proclamation in 2003 that 75% of all Grade 6 students should be performing at or above the acceptable standard of proficiency, (Level 3) as defined in Ministry curriculum policies, on the EQAO assessments by 2009. The Ministry

2
proceeded to create the Literacy and Numeracy Secretariat to work in partnership with the school boards, professional organizations such as the Ontario Principals Council and EQAO to help school board and school personnel to improve and enhance student learning to achieve the 75% goal. The history and details of this story are well documented elsewhere (Levin, 2010; Campbell & Fullan, 2006), and is therefore not repeated here. It is, however, a critical feature of the political and organizational context of the schools in this study, because what is happening in Ontario schools reflects both the accountability system and a decade of interventions that were sponsored and supported by the Ministry and school boards.
1.1 Theoretical and Conceptual Background to the Study
In preparation for this investigation, EQAO undertook a review of research on the characteristics of effective schools and school improvement over the past 30 years mainly in the United States and England (Calman, 2010). This literature has been synthesized on multiple occasions resulting in consistently reported characteristics of effective schools (e.g., Edmonds, 1979; Purkey & Smith, 1983; Levine & Lezotte, 1990; Sammons, 1999). The EQAO review highlights findings from a relatively recent review of school effectiveness and school improvement completed by Teddlie and Springfield (2007), as summarized in Table 1.1. Table 1.1 Correlates of effective schools Correlate: Effective schools process Sub-‐components of the process 1. Strong and effective principal leadership a. Being firm and purposeful
b. Involving others in the process c. Exhibiting instructional leadership d. Frequent personal monitoring of staff performance e. Effectively replacing and recruiting staff
2. Developing and maintaining a pervasive focus on instruction and learning
a. Focusing on academics b. Maximizing school learning time
3. Producing a safe and positive school climate and culture
a. Creating a shared vision b. Creating an orderly environment c. Emphasizing positive reinforcement
4. Creating high (and appropriate) expectations for all
a. For students b. For staff
5. Using student achievement data to a. At the school level

3
monitor progress at all levels b. At the classroom level c. At the student level
6. The processes of effective teaching a. Maximizing class time b. Successful grouping and organization c. Exhibiting best teaching practices d. Adapting practice to particulars of classroom
7. Involving parents in productive and appropriate ways
a. Buffering negative influences b. Encouraging productive interactions with parents
8. Developing staff skills at the school site
a. Site based b. Integrated with ongoing professional development
9. Emphasizing student responsibilities and rights
a. Responsibilities b. Rights
(Note: adapted from Teddlie and Stringfield, 2007, p.143) EQAO’s review of the effective schools literature also incorporated significant reviews of school effectiveness research and practice carried out in the Canadian context by Sackney (2007) and by Ungerleider and Levin (2007). While the Canadian findings confirm those reported by American and English researchers, Sackney highlights the following as major trends within the Canadian context.
First, research and practice are focused on student learning and the need to accommodate the diverse learning needs of individual students and those with special needs. Second, there is an emphasis on a culture of continuous improvement. More recently, the emphasis has shifted to developing capacity for learning communities. Such a shift assumes that all stakeholders are learners – students, teachers, administrators, parents and community members. Third, inquiry and reflection are key activities that can be accommodated through planning, action research and collaboration. Evidence-‐based practice has also been prioritized. Through the collection, analysis and interpretation of data, it is assumed learning will improve. Fourth, there is a strong emphasis on building capacity throughout the system. This can be achieved through effective, practice-‐based professional development that is planned, systemic, and sustained (Fullan, 2005). Fifth, knowledge management through networking and other avenues of knowledge acquisition are

4
emphasized. Many school jurisdictions are developing different varieties of learning networks with other schools and systems. Sixth, school self-‐ and peer assessment are being utilized. (Sackney, 2007, p. 178)
Given the consistency of findings from prior research on effective schools over the past 25 years, why undertake yet another effective schools study? Here we offer two reasons.
1. In Ontario, all schools, particularly those with high percentages of students achieving at lower levels than expected on the provincial proficiency tests in reading, writing and arithmetic, have been subject to significant policy and resource inputs from the Ministry of Education and its Literacy and Numeracy Secretariat branch in partnership with school boards over the past decade. While there have been substantial improvements in student achievement province-‐wide, there still remain schools with persistently low results, including schools predominantly serving students from middle to upper income families, not just those from socio-‐economically disadvantaged families. This prompts the question why students in some schools succeed academically and other school with similar socio-‐economic standings continue to struggle despite the existence of extensive support?
2. Much of the research on effective and less effective schools emphasizes factors that create the context for teaching and learning (e.g., leadership, staff development, parent involvement), without investigating what is happening in the classroom, other than stakeholder surveys about teaching. With this in mind we adopted a mixed methods approach in which both quantitative and qualitative classroom data were included in our research design through teacher surveys, stakeholder interviews and classroom observations. In a recent study in California in which mixed methods were used the researchers found little difference in classroom materials and teaching methods when they compared low and high performing schools (Mintrop & Trujillo, 2007). We wondered what is actually happening in Ontario elementary school classrooms in low and high performing schools with different demographic profiles that might help explain variation in results.
1.2 Purpose and Research Questions
The main purpose of this investigation is to gain a better understanding of factors within and outside a school that help explain differences between schools with higher student performance and schools with below average student performance, where the schools have similar contextual settings. The focus is on identifying and describing factors that have

5
contributed to the success of schools with varying demographic characteristics as well as the challenges and impediments to success faced by other schools in similar contexts. The goal is to contribute to knowledge about how to increase the performance of persistently low performing schools and their students while at the same time sustaining the performance of the high performing schools and their students in Ontario and elsewhere in the world. Following are the specific research questions for the study.
Do elementary schools that exceed expectations according to system performance criteria differ from schools that do not exceed expectations within similar contextual circumstances, with respect to the following: 1. the nature of the educational experiences they provide to students? 2. the school’s core leadership actions (setting directions, structuring the workplace,
developing capacity and instructional management)? 3. how school principals and teachers explain and demonstrate actions that they perceive
to be key to success? 4. their access to and relationship with external direction, supervision and support for
school improvement?

6
Chapter 2 -‐ Research Design and Methods
2.0 Overview of the Research Design The study was designed to provide an understanding of the activities and practices of 22 schools that represent a range of student achievement and demographic characteristics. The study employed mixed methods. Data were collected during 2-‐3 day school site visits by three member teams, and included interviews with the principal and selected teachers; teacher, parent and student focus groups; a teacher survey; and observations of literacy instruction in four primary and junior classrooms using a structured observation protocol and recording anecdotal notes. The research consisted of the following components: • Development of data collection instruments (teacher survey, interview and focus group
protocols and classroom observation protocol). • Training for the research team members to ensure consistency in implementation of the
data collection and reporting processes. • A pilot study, conducted in two English-‐language schools and one French-‐language school,
to field test and improve data collection instruments and procedures. • The main study, conducted in 22 schools. • The final report, that summarizes findings across categories of schools and identifies
differences in practices in successful and less successful schools. This final report presents a comparative analysis that takes into account similarities and differences across schools in similar performance groups (high and low performing), socio-‐economic contexts (high and low socio-‐economic characteristics of school communities) and, where salient differences appear, types of boards (English, French). The report includes ample illustrations of findings from the schools, but does not include case studies of each school.
2.1 Selection of Schools 2.1.1 School Sample Criteria

7
According to the research design, four categories of schools, differing in demographic circumstance and level of performance, were identified by EQAO staff for inclusion in the study. A socio-‐economic composite indicator was used to classify schools by socioeconomic status (SES). EQAO assessment results in reading, writing and mathematics were used for classifying level of performance of the schools. Socioeconomic status (SES) was defined as a demographic composite derived from parent education and the Low Income Cut Off (LICO) data obtained from the Statistics Canada 2006 census data. School summary statistics were generated by linking postal codes of students enrolled in the school with the enumeration areas used to aggregate census data. Parent education for a school was defined as the percentage students in the school living in a home in which at least one parent or guardian had received some university education. LICO was defined as the percentage of students in the school living in a household in which the income was below the LICO cut off — families that spend 20 percentage points more than the average family in their community on food, shelter and clothing (percentage of total income). A regression equation was generated for predicting achievement from LICO and parent education. The beta weights from this regression equation were then used to determine a demographic marker for each school based on LICO and parent education which ranged from 0 to 100, with high values indicating a lower percentage of students living below the LICO and a larger percentage of students with at least one parent with some university education.
Table 2.1 Average Demographic Data for Schools in Each Category
Category
Demographic Marker
LICO
Parent Education
Average Family Income
High SES High Performance
67.8 14% 52% $110 867
High SES Low Performance
64.9 16% 49% $94 825
Low SES High Performance
23.2 30% 24% $62 970
Low SES Low Performance
26.2 31% 31% $56 627
The first criterion for identifying schools with high and low achievement was that they had higher achievement than most of the 40 schools in the province that were most similar to them with respect to socio-‐economic status. Achievement results for schools identified through this process were examined, and schools with consistently high results across reading, writing and mathematics on the Primary and Junior assessments were selected. The average percentage of

8
students at Levels 3 or 4 across the three subjects and two grades in 2010 was 93% for high performing, high SES schools and 78% for high-‐performing, low SES schools. Low-‐achieving schools had lower achievement than most of the 40 schools in the province that were most similar to them with respect to the demographic marker. The average percentage of students at Levels 3 or 4 across the three subjects and two grades in 2010 was 59% for low-‐achieving, high SES schools and 37% for low-‐achieving, low SES schools.
2.1.2 School Sample The school sample target consisted of 24 schools (16 English-‐language public and Catholic schools and eight schools from the French-‐language sector). The aim was to recruit six schools (four English, two French) in each of four categories of schools: 1. High SES High Performance 2. High SES Low Performance 3. Low SES High Performance 4. Low SES Low Performance.
Schools were identified and recruited by EQAO staff according to this sample frame. Participating schools did so voluntarily though given permission from school board authorities. Further, for logistical purposes schools across all four categories within particular school boards were sought. That was not entirely possible. Francophone schools are less numerous than English language schools and it proved impossible to find and recruit four schools representing each sample group in any one school board. Francophone schools across the province have also shown remarkable improvements in student performance on EQAO tests over the last 10 years, which made it harder to locate and recruit low performing schools. Thus, the final sample in the French language school sector included schools from five school boards (all Catholic), two from each category of schools except the low achieving low SES group (one school). The final sample in the English language sector included four schools representing each category from two public and one Catholic school board, and one public board that included one low performing high SES school, and two low performing low SES schools (the high SES high performing school opted out of the study too late to be replaced by a similar school from the same board). The 22 participating schools are described in terms of the sample frame in Table 2.2. Table 2.2 School Sample Board Type High Performing Low Performing Total Schools High SES Low SES High SES Low SES

9
English Public (N=3)
2 3 3 3 11
English Catholic (N=1)
1 1 1 1 4
French Catholic (N=5)
2 2 2 1 7
Total Schools 5 6 6 5 22 When selecting the schools, we became conscious of the fact that Ministry and school board efforts targeted at strengthening the performance of low performing schools (the Turnaround School initiative and Ontario Focused Intervention Partnership) have considerably reduced the pool of schools with low performance across the three assessments at the Primary and Junior levels. With this reality in mind, we are mindful that the sample of low performing schools in our study do not necessarily represent large numbers of schools in the current Ontario context. This fact is something that we have endeavoured to keep in perspective in our analysis.
2.2 Data Collection Instruments and Procedures Data were collected during 2-‐3 day school visits. Data collection involved administering a questionnaire to all K-‐6 teachers; an interview with the principal; a focus group with 4-‐6 teachers; observation during the literacy block of two primary and two junior teachers, followed by individual interviews; a focus group interview with 4-‐6 junior division pupils; a focus group interview with 4-‐6 parents (recruited by the principal); and a school-‐walkabout led by the principal to showcase, explain or otherwise inform the team in their own way as to how they have been successful or what type of challenges they face. The research teams included two EQAO Outreach staff members seconded part-‐time to the study, and one to two members of the OISE/UT research group (the Principal Investigator and Research Assistants). Data collection in the French language schools was conducted by French speaking EQAO and OISE/UT team members. EQAO Outreach staff conducted the principal, teacher and parent focus group interviews, and accompanied the principal on school walkabouts. Members of the OISE/UT research team did the classroom observations and personal interviews with the teachers of the classes observed, and conducted the student focus groups. The teacher surveys were administered on-‐site in staff meetings or by distributing and retrieving them individually as agreed in consultation with the principal prior to the visits. Complete data were obtained from all participating schools, except one, where only two teacher surveys were retrieved (that school is not included in the survey analysis). Standardized semi-‐structured interview protocols

10
were developed for each interview and focus group (as described below). The interviewers took notes of interviewee responses, but digitally recorded the interviews to verify and complete the notes as needed. The individual and focus group interviews, teacher survey and classroom observation procedures were designed to address the four major research questions, with appropriate links to the effective schools correlates identified in prior research as previously noted. These instruments were drafted in the fall 2010 by the principal investigator and his team, reviewed by the EQAO Research Committee and then revised. The revised instruments were piloted in two English language schools and one French language school, not included in the main study. The instruments were then revised again as needed. In the process of developing the instruments, the Principal Investigator from OISE/UT delivered two half day data collection training sessions with the EQAO research team. The OISE/UT team also did two additional half day training sessions to strengthen inter-‐rater reliability in the use of the classroom observation protocols. English and French language versions were prepared for all data collection instruments. Copies of the survey instruments are provided in Appendix A. 2.2.1 Interview Guides The interview protocols were designed to respond to the core research questions and to correspond to the key effective schools correlates, as summarized in Table 2.3. Copies of the interview protocols appear in Appendixes B (English) and C (French).
Table 2.3 Interview Links to Research Questions and Effective Schools Correlates
Research Questions Interview Topics Interview Questions* ES Correlates Educational experiences of students
Teaching & learning -‐program -‐flexibility -‐weak students -‐strong students -‐differentiated instruction Student learning
PI-‐7, TI-‐2,TI-‐3 PI-‐7, TI-‐4 PI-‐10,TI-‐5, SFG-‐4
PI-‐11, TI-‐6
TI-‐7 SFG-‐2,5,8,9,10,11
Processes of effective teaching Focus on instruction & learning
Leadership -‐setting directions -‐developing capacity -‐structuring workplace
Principal Other school leaders SI goals SI strategies
PI-‐6, TI-‐13 PI-‐6, TI-‐14, PI-‐17 PI-‐5, TI-‐12, TI-‐21 PI-‐9, SSFG-‐5-‐6, TI-‐12, PFG-‐7
Strong & effective principal leadership School climate

11
-‐instructional management
Teacher learning Teacher collaboration Monitoring District role in SI -‐goals -‐strategies -‐monitoring -‐external agencies -‐school support
PI-‐9, TI-‐17 PI-‐9, TI-‐17 PI-‐8, TI-‐13 PI-‐17 PI-‐17 PI-‐17, TI-‐16 PI-‐17 PI-‐17
Developing staff skills Using student data
Success and success factors
Context -‐community -‐school -‐school climate Success -‐meaning -‐support factors -‐school strengths -‐school challenges
P1-‐1,TI-‐23, SSFG-‐1 PI-‐1, PFG-‐1 PI-‐14, TI-‐22, SFG-‐1 PI-‐2, SSFG-‐2, TI-‐8, PFG-‐2 TI-‐11, SSFG-‐4, PFG-‐4, SFG-‐3 PI-‐3, TI-‐10, SSFG-‐6, PFT-‐6, SFG-‐1 PI-‐4, TI-‐10, SSFG-‐6, PFG-‐6, SFG-‐1
High expectations Safe and positive climate & culture
External relations
Parental involvement
Involving parents
*PI=Principal Interview; TI=Teacher Interview; SSFG=School Success Focus Group; PFG-‐Parent Focus Group; SFG=Student Focus Group
2.2.2 Teacher Survey For this study we thought that interview and observation data from a small group of teachers was insufficient to obtain a complete and reliable picture of what was happening in the schools. We complemented the interview and observation data with a teacher survey of pre-‐K/K to Grade 6 teachers in the schools. There are many ready-‐made surveys keyed to the common lists of effective schools correlates in existence. Although we did not adopt an existing survey instrument, we drew upon scales and items from multiple existing effective schools questionnaires, as well as upon some additional sources that tapped into areas that we sought to probe in greater depth than typical effective schools survey instruments. The list of survey scale/item sources consulted included:

12
• University of Saskatchewan Educational Leadership Unit (SELU) effective schools surveys • Association for Effective Schools (U.S. organization) teacher surveys • Rosenholtz (1989) survey of teachers in more/less effective elementary schools • Robinson et al (2009) best evidence synthesis of research on school leadership and
student outcomes • Timperley et al (2007) best evidence synthesis of research on teacher professional
learning and development • Leithwood’s framework and survey items for assessing principal leadership (various) • Teacher surveys from a Wallace Foundation funded 5 year study of leadership and
learning (Louis et al) • Mintrop and Trujillo (2007) study of high and low performing California middle schools • Teacher surveys developed by Mitchell & Sackney to assess strength of teachers’
professional learning community in schools (Mitchell and Sackney, 2000) • Online information from the California Effective Schools Center
In developing the survey we checked for relevance and consistency with the EQAO school effectiveness review (and the ES correlates listed from Teddlie and Stringfield, 2007), as well as the Ontario Ministry of Education’s current School Effectiveness Framework (2010). Table 2.4 relates our teacher survey scales to the effective school correlates cited in the EQAO report (Calman, 2010). Scale items were randomly mixed in the surveys to help ensure that teachers responded to each item independently of other items in each scale.
Table 2.4 Teacher Survey Scale Links to ES Correlates
Effective Schools Correlates (Teddlie & Stringfield, 2007)
Teacher survey scales
Strong and effective principalship
Instructional leadership Transformational leadership Shared responsibility
Developing and maintaining a pervasive focus on instruction and learning
School goals
Producing a safe and positive school climate and culture
School climate

13
Creating high (and appropriate) expectations for all
Teacher expectations Teacher beliefs Teacher self-‐efficacy Teacher collective efficacy
Using student achievement data to monitor progress at all levels
School goals Student Assessment
The processes of effective teaching
Instructional practice Pedagogical autonomy
Involving parents in productive and appropriate ways
Parent involvement
Developing staff skills at the school site
Professional community Professional learning (sources, activities)
Emphasizing student responsibilities and rights
(not assessed)
As mentioned earlier, the teacher surveys and different interview schedules were piloted in the two English language schools and one French language school not included in the main study. The feedback provided by the participating teachers in these schools regarding the clarity of the questions was used to revise items as needed. Copies of the final form (English and French) of the teacher survey are provided in Appendix A. We surveyed all JK/K-‐Grade 6 teachers in each school. While some schools offered Grades 7 and 8, those teachers were not included in the survey in order to make the teacher data more consistent. 2.2.3 Classroom Observation We conducted classroom observations of two primary and two junior grade teachers during their scheduled literacy period in each school. The observation system and protocol were adapted from an observation system originally developed at the University of Minnesota as a tool to assess and provide feedback to teachers in grades K-‐6 about their literacy lessons, and which was related to: curriculum focus and goals, grouping, literacy activities, materials, teacher-‐student interactions and student engagement (Taylor, 2004). Our use of this system was also modeled on its use in an investigation of literacy teaching in high and low performing middle schools in California (Mintrop & Trujillo, 2007). The technique employs a time sampling procedure. The observer records a snapshot of what has been happening in the lesson for 5 minutes at prescribed intervals, as described by Taylor (2004):
The way the system works is as follows: the observer writes down a narrative of what is happening in the classroom, including what the teacher and children are
14
saying and doing, for 5 minutes. Then the observer takes a count of the total number of children who appear to be on task out of all the children in the room. Next, the observer codes the 3-‐4 most salient literacy activities occurring during that 5 minutes. For every activity, the observer also codes who was providing the instruction, the grouping pattern in use for the event, the major literacy category, the materials being used, the teacher interaction styles being used, and the expected responses of the students for that literacy activity. (Taylor, 2004, p. 3)
Unfortunately, the results of our analysis of these data revealed unanticipated findings that lead us to question the inter-‐rater reliability of the classroom observation snapshots, notwithstanding satisfactory inter-‐reliability ratings obtained during observer training sessions that relied upon scoring video-‐taped lessons. As a consequence, we do not report and comment on data from the classroom observation snapshots in the final report, and we do not present a detailed description here of the observation instrument. The methodological problems encountered with classroom observation instrument, however, did not affect the purpose and quality of interviews with the observed teachers. 2.2.3 Focus Groups (teacher, student, parent) We conducted focus group interviews with groups of 5-‐6 teachers, students and parents. The teacher sample was selected to include teachers other than those interviewed and observed, including some teachers in leadership roles (e.g., grade or division team leaders, resource teachers). We asked the principals to invite a sample of parents, including parents of both primary and junior division age students, and parents active on school committees (e.g., School Council). We limited the student sample to students from Grades 4 to 6 because we thought they would be able to respond more articulately and freely to questions about their perceptions of the school, its climate and teaching and learning experiences. The students were recruited through the principal and classroom teachers. The student samples were constructed to ensure a mix of Grade levels, gender, and classrooms in order to reflect a diversity of student experiences in the school.
2.3 Data Analysis Process 2.3.1 Interview and Focus Group Data Digital files were created by the interviewers of notes from the individual and focus group interviews. These notes paraphrased interviewee and group responses to the interview questions in point form or short phrases. The digital interview files were entered into an NVIVO

15
qualitative data analysis project file to facilitate systematic coding and retrieval. To systematize and standardize the coding process we created a coding structure and manual with operational definitions for each code (Appendix F). The interviews were coded by the Principal Investigator and two assistants who participated in data collection. French language interviews were coded by team members who were proficient in French. The schools were assigned identification numbers that designated them by board type (Public, Catholic; English, French); school sample group; specific board and school within board. These identifiers were also entered into the teacher survey data base. Coded interviews were assigned “attributes” in the NVIVO project that allowed for data retrieval for specific coding categories by school sample group (e.g., high performing high SES, high performing low SES), school, by role (e.g., principal, teacher, different focus groups). Analysis of the combined interview/focus group data proceeded according to these steps.
1. Generate an NVIVO report of all interview data tagged to a specific code (e.g., Success-‐Meaning; School Improvement-‐Goals; Leadership-‐Principal) for all schools within a school sample category (e.g., high performing high SES, high performing low SES, low performing high SES, low performing low SES).
2. Read these data and inductively generate a set of thematic categories that reflect salient findings within that coded topic. Create a matrix to record the incidence of each theme by adult respondent group (principals, teachers, parents) across the schools within that school sample group. This record indicated whether a theme was mentioned by one or members of each respondent group by school, not the frequency with which it was mentioned.
3. Generate assertions that describe findings for each major topic aligned with the themes and consistent with matrix analysis for a school group.
4. Compare findings across school groups in order to identify patterns of similarity and differences in findings associated with sample characteristics.
This procedure was replicated for all coded data. Our interview excerpts are based on notes of interviewee responses, not on verbatim digitally recorded transcripts. Thus, all interview excerpts in this report should be read as paraphrased notes of interviewee comments, unless enclosed in quotation marks. We identify the source of the interview comments by respondent type (T/E teacher/enseignant individual and/or focus group; P/D principal/directeur; PAR parent; SFG student focus group); and by school code. The school code numbers (e.g., 11112, 11434, 22314) indicate in sequence language (English, French); English or Catholic; school sample category – 1 high performing high

16
SES, 2 low performing high SES, 3 high performing low SES and 4 low performing low SES; school identifier within a board; and the identity of the board in which the school was located). 2.3.2 Teacher Survey Data Overall, we received surveys from 349 teachers across 20 schools (ranging from 9 to 45 teachers, average 18 teachers per school), with an overall return rate of 90%. Surveys were returned during the site visit in most schools. One school did not respond to repeated requests for completed surveys after the site visit. One school was excluded from the survey analysis because only four surveys were returned. The teacher survey sample characteristics for the 20 included schools are reported in Table 2.6. Table 2.5 Teacher Survey Sample Characteristics Sample characteristics Frequency Survey
Responses Percent Survey Responses
Board type • Public • Catholic
Total
179 170 349
51.3% 48.7% 100%
Language • English • French
Total
224 125 349
64.2% 35.8% 100%
School category • High Achieving High
SES • High Achieving Low
SES • Low Achieving High
SES • Low Achieving Low
SES Total
80 134 56 79 349
22.9% 38.4% 16.0% 22.6% 100%
Teaching position Primary (JK/K-‐3) Junior (4-‐6) Specialist
162 99 82 343*
47.2% 28.9% 23.9% 100%

17
*some respondents did not complete items that asked them to identify their position The complete sample characteristics displayed in Table 2.6 show that the teacher sample was relatively evenly distributed across the Public and Catholic school boards. There is a greater number of teachers in English language schools than in French language schools because a greater number of English language schools were included in the sample than French language schools. This difference reflects the differences in the number of schools in each language group in the province. The greatest number of survey forms was received from teachers in high performing low SES schools, and an almost even number of survey forms was received from teachers in high performing high SES and low performing low SES schools. The fewest number of surveys was received from teachers in low performing high SES schools. We anticipated that teaching level (Primary versus Junior) might be relevant to the analysis of teaching practices, but preliminary analyses revealed that this was not the case. Consequently, teaching level does not appear in our presentation and discussion of the results. To investigate the differences between high and low performing schools, descriptive statistics (means and standard deviations), t-‐tests and effect sizes (d statistic) were computed for high performance and low performance groups for all variables in the survey. The survey items were analyzed in clusters based on the original scales used in the design of the instrument. Besides individual items, some clusters also included construct variables that were found to be reliable (constructs with alpha of 0.70 or higher, see Table 2.5). The internal consistency of the teacher survey scales was determined by computing Cronbach’s alphas. Alpha values along with the number of items for each scale are reported in Table 2.6. All but 6 scales proved to be statistically reliable or, in other words, their alphas were above .7, which is a commonly accepted threshold (Nunnally, 1978).
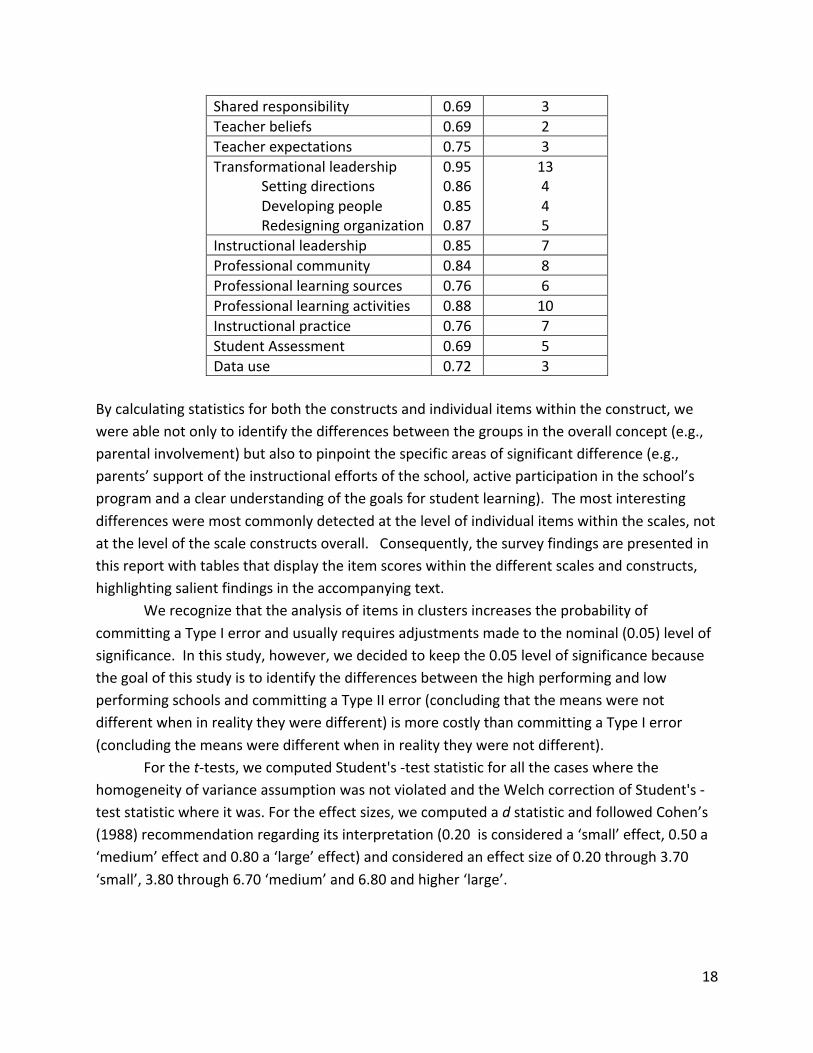
Table 2.6 Teacher Survey Scale Reliability Values
Scale Alpha Number of Items School goals 0.68 4
School climate 0.76 5 Parental involvement 0.78 5 Teacher collective efficacy 0.12 4 Teacher self-‐efficacy 0.64 3
18
Shared responsibility 0.69 3 Teacher beliefs 0.69 2 Teacher expectations 0.75 3 Transformational leadership
Setting directions Developing people Redesigning organization
0.95 0.86 0.85 0.87
13 4 4 5
Instructional leadership 0.85 7 Professional community 0.84 8 Professional learning sources 0.76 6 Professional learning activities 0.88 10 Instructional practice 0.76 7 Student Assessment 0.69 5 Data use 0.72 3
By calculating statistics for both the constructs and individual items within the construct, we were able not only to identify the differences between the groups in the overall concept (e.g., parental involvement) but also to pinpoint the specific areas of significant difference (e.g., parents’ support of the instructional efforts of the school, active participation in the school’s program and a clear understanding of the goals for student learning). The most interesting differences were most commonly detected at the level of individual items within the scales, not at the level of the scale constructs overall. Consequently, the survey findings are presented in this report with tables that display the item scores within the different scales and constructs, highlighting salient findings in the accompanying text. We recognize that the analysis of items in clusters increases the probability of committing a Type I error and usually requires adjustments made to the nominal (0.05) level of significance. In this study, however, we decided to keep the 0.05 level of significance because the goal of this study is to identify the differences between the high performing and low performing schools and committing a Type II error (concluding that the means were not different when in reality they were different) is more costly than committing a Type I error (concluding the means were different when in reality they were not different). For the t-‐tests, we computed Student's -‐test statistic for all the cases where the homogeneity of variance assumption was not violated and the Welch correction of Student's -‐test statistic where it was. For the effect sizes, we computed a d statistic and followed Cohen’s (1988) recommendation regarding its interpretation (0.20 is considered a ‘small’ effect, 0.50 a ‘medium’ effect and 0.80 a ‘large’ effect) and considered an effect size of 0.20 through 3.70 ‘small’, 3.80 through 6.70 ‘medium’ and 6.80 and higher ‘large’.

19
2.4 Cautionary Note As we approached this study we were aware of the influence of the province’s curriculum and student performance standards and accountability system on school system directions for improvement at the provincial, school and school district levels. It was not until we were in the schools talking with teachers and principals and observing in classrooms, that we realized the pervasiveness and depth of influence of the Ministry of Education’s efforts to develop the capacity of school district and school personnel since the present government came into power in October 2003. In other words, what is presently happening in schools is in large measure a reflection of provincially defined targets for improvement, and of provincially developed and supported interventions to develop the capacity of school personnel to improve student achievement as measured by performance on EQAO assessments of literacy and mathematics (see Chapter 7 for further detail and discussion of provincial context). This current reality in Ontario elementary schools bears significantly on the findings from this comparative investigation of the professional work of teachers and principals in high and low performing schools across varying types of boards and demographic contexts. Given the standardizing influence of provincial policies and initiatives, the differences in what principals and teachers are doing to improve and sustain the quality of teaching and learning are not pronounced. What accounts for differences in student performance between schools may be explained less by differences in what people are doing in the schools than by their expertise and skill in implementing common practices. We would argue that comparative studies of school effectiveness in the current era differ from traditional effective schools research in this regard. By implication, it is more difficult now than in the past to detect significant differences in the nature and quality of professional work of principals and teachers between high and low performing schools.

20
Chapter 3 -‐ Educational experiences of students
3.0 Introduction We collected and examined multiple sources of information about teaching and learning activities in the participating schools: teacher survey, individual interviews with principals and with four teachers (2 primary, 2 junior) of the classes that were observed in each school and the student focus groups. In this chapter we examine the findings from the surveys, interviews with principals and teachers (teacher focus group data were combined with individual teacher interview data for the analysis) and the student focus groups. The findings between high and low performing schools are presented and compared for both the survey and the interview data throughout this and the succeeding chapters. We conclude with a synthesis of the findings and conclusions across those sources and the different categories of schools.
3.1 Teacher Survey Data 3.1.1 Teacher Beliefs The teacher survey included items concerning teacher beliefs about teaching and the learning potential of students in their schools. One item asked teachers about teaching and learning; the second item asked teachers about their beliefs in the learning potential of all students.
Table 3.1 Teacher beliefs about teaching and learning
1. Teachers share similar beliefs about teaching and learning. 2. Teachers really believe every student can learn.
High Performing Schools
Low Performing Schools
Effect Size

21
M SD M SD d TBelief 1 5.04* 0.85 4.65 1.09 0.40 TBelief 2 5.34* 0.76 5.04 1.06 0.33 Scale: 1 – completely disagree to 6 – completely agree * Significantly higher mean, p < 0.05
Teachers in high achieving schools reported more consensus in beliefs about teaching and learning (moderate effect size). While they also reported greater agreement that teachers’ in their school hold positive beliefs about the learning potential of all students, the small effect size of this statistically significant difference suggests little concrete difference between teachers in high and low performing schools on this item. Teachers in low performing low SES schools reported the lowest consensus in beliefs about teaching and learning. The teacher survey included three items that worked together as a reliable scale (α=.75) to measure the extent to which teachers in each school hold and communicate high expectations for learning for all students, regardless of students’ personal and family characteristics.
Table 3.2 Teacher Expectations
1. Teachers agree on high standards of academic performance for all types of students. 2. Teachers have well defined learning expectations for all students. 3. Teachers communicate high learning expectations to all students, regardless of gender,
race, socio-‐economic status or other personal characteristics.
High Performing
Schools Low Performing
Schools Effect Size
M SD M SD d TExp 1 5.18* 0.84 4.64 1.09 0.55 TExp 2 5.08* 0.8 4.84 1.04 0.26 TExp 3 5.50* 0.63 5.26 0.97 0.29 Scale: 1 – completely disagree to 6 – completely agree * Significantly higher mean, p < 0.05

22
Teacher agreement on high standards and expectations for student learning was consistently stronger in high than in low performing schools. Teachers in high performing schools agree on high standards of academic performance for all types of students more than teachers in low performing schools (moderate effect size). Nothwithstanding the statistically significant differences, teachers in both high and low performing schools essentially have well defined learning expectations for all students that they communicate to students regardless of the students’ personal characteristics (small effect sizes). Teachers’ sense of efficacy as teachers (their confidence in their ability to effectively help students learn) has been shown in many studies to significantly affect their teaching behaviors and commitment to reaching and teaching all learners (Dembo and Gibson, 1985; Rosenholtz, 1989; Tschannen-‐Moran et al, 1998). The teacher survey included three items from teacher efficacy research related to teachers’ personal sense of efficacy, and four items to assess their collective sense of efficacy. Teachers reported a positive sense of personal professional efficacy (Table 3.3) for all three survey items. Statistical differences in personal efficacy scores between high and low performing schools were most apparent among teachers in high performing high SES schools (where the scores for self-‐efficacy were highest) and low performing low SES schools (where the scores were the lowest). However, those differences (not displayed here) were weak as reflected in the low and negligible effect size for the statistical comparisons between high and low performing school groups. Table 3.3 Teachers’ Personal Sense of Efficacy
1. If I try hard, I can get through to the most difficult or unmotivated student. 2. If a student does not understand information from a lesson, I know how to improve his or
her understanding in the next lesson. 3. When the grades of my students improve it is usually because I have found more effective
teaching approaches.
High Performing
Schools Low Performing
Schools Effect Size
M SD M SD d SelfEf 1 5.13* 0.76 4.89 1.07 0.26 SelfEf 2 5.09 0.62 4.97 0.83 0.16 SelfEf 3 5.13 0.73 5.03 0.79 0.13 Scale: 1 – completely disagree to 6 – completely agree * Significantly higher mean, p < 0.05
We also assessed teachers’ collective sense of efficacy in their schools. Overall, teachers in all

23
categories of schools do not feel a strong sense of need for more training in how to work with academically struggling students, and agree in their collective capacity to address issues affecting the quality of teaching and learning. While teachers in high performing schools report significantly greater confidence in the influence of their own actions on student motivation and performance, rather than attributing student learning outcome mainly to family factors, the low effect sizes for this and for the other collective efficacy items essentially diminish or negate the practical significance of these differences between teachers in these school groups. The teacher survey findings suggest that teachers in both high and low performing schools feel pretty confident about their individual and collective ability to positively influence student learning, even the learning of struggling students. Even in low performing schools, teachers do not attribute student performance simply to student characteristics.
Table 3.4 Teachers Collective Sense of Efficacy
1. If a student doesn’t learn something the first time, teachers will try another way. 2. Teachers need more training to know how to deal effectively with the students who
aren’t learning well (Reversed). 3. When it comes right down to it, teachers really can’t do much because most of a
student’s motivation and performance depends on his or her home environment (Reversed).
4. Problems affecting the quality of teaching and learning are viewed as issues to be solved, not as barriers to action.
High Performing
Schools Low Performing
Schools Effect Size
M SD M SD d ColEf 1 5.65* 0.54 5.47 0.71 0.29 ColEf 2 2.56 1.02 2.57 1.25 -‐0.01 ColEf 3 4.82* 1.05 4.5 1.18 0.29 ColEf 4 4.8 0.98 4.58 1.14 0.21 Scale: 1 – completely disagree to 6 – completely agree * Significantly higher mean, p < 0.05
3.1.2 Pedagogical Autonomy
One part of the teacher survey asked teacher to rate their level of “pedagogical autonomy” in decisions about curriculum content, student learning materials, teaching strategies and assessments for reading, writing, mathematics and social studies (1=little flexibility, 2=some flexibility, 3=broad flexibility). As shown in Table 3.5, the effect sizes for each element for each

24
subject were small, suggesting that the perceived level of teacher autonomy was the same for teachers in high performing schools and teachers in low performing schools. Overall, teachers reported high degrees of flexibility in making instructional decisions about selection of materials, teaching/learning activities and assessment of learning across the four subject areas. However, in contrast they reported lower flexibility in making decisions about curriculum content, which is not unexpected given the grade level prescriptiveness of the Ontario curriculum. We had expected teachers to report higher levels of flexibility in social studies, because social studies is not covered in EQAO assessments (that are aligned with tested areas of the curriculum for literacy and mathematics), potentially creating less pressure for standardization of curriculum and teaching. Overall, however, teachers reported high levels of flexibility and autonomy, regardless of curriculum area. The interview data presented in the following section present a more limited view of teacher autonomy than suggested by these data, although the focus of the teacher interviews was largely limited to literacy. Table 3.5 Pedagogical autonomy
SUBJECT AREA
High Performing Schools
Low Performing Schools
Effect Size
M SD M SD d Reading Activities 2.74 0.48 2.63 0.54 0.22 Assessment 2.66 0.55 2.63 0.54 0.06 Content 2.18 0.79 2.16 0.81 0.02 Materials 2.69 0.49 2.63 0.56 0.11 Writing Activities 2.78* 0.42 2.64 0.53 0.29 Assessment 2.72 0.49 2.64 0.54 0.16 Content 2.18 0.78 2.19 0.83 -‐0.01 Materials 2.75 0.45 2.68 0.52 0.14 Mathematics Activities 2.66* 0.5 2.49 0.58 0.31 Assessment 2.61 0.55 2.53 0.56 0.14 Content 1.96 0.73 1.94 0.8 0.03 Materials 2.54 0.53 2.44 0.61 0.18 Social Studies Activities 2.79 0.42 2.67 0.51 0.26 Assessment 2.76 0.47 2.68 0.47 0.17 Content 2.08 0.79 2.07 0.82 0.01 Materials 2.71* 0.47 2.57 0.56 0.27

25
Scale: 1 = little flexibility, 2 = some flexibility, 3 = broad flexibility * Significantly higher mean, p < 0.05
Unexpected differences in reported teacher flexibility in instructional decision making occurred between the French and English language schools. Francophone school teachers rated their pedagogical autonomy significantly lower in 12 of the 16 categories assessed. Of these 12, the effect sizes were moderate for six and small for three. The survey data suggest that there may be more prescription and standardization of instruction in the French language schools as felt by teachers. This finding is corroborated in the teacher and principal interview data presented and discussed later in this report. Table 3.6 Pedagogical Autonomy in English and French Language Schools
SUBJECT AREA
English French Effect Size
M SD M SD d Reading Activities 2.8* 0.44 2.5 0.56 0.60 Assessment 2.68 0.52 2.58 0.59 0.18 Content 2.38* 0.72 1.77 0.79 0.81 Materials 2.71* 0.5 2.57 0.54 0.27 Writing Activities 2.83* 0.41 2.55 0.54 0.58 Assessment 2.71 0.49 2.65 0.54 0.12 Content 2.4* 0.71 1.77 0.79 0.84 Materials 2.79* 0.45 2.6 0.51 0.40 Mathematics Activities 2.67* 0.54 2.47 0.5 0.38 Assessment 2.62 0.56 2.52 0.54 0.18 Content 2.11* 0.72 1.67 0.72 0.61 Materials 2.55* 0.59 2.42 0.52 0.23 Social Studies Activities 2.81* 0.44 2.63 0.49 0.39 Assessment 2.75 0.46 2.69 0.49 0.13 Content 2.28* 0.75 1.72 0.75 0.75 Materials 2.71* 0.51 2.56 0.5 0.30 Scale: 1 = little flexibility, 2 = some flexibility, 3 = broad flexibility * Significantly higher mean, p < 0.05
26
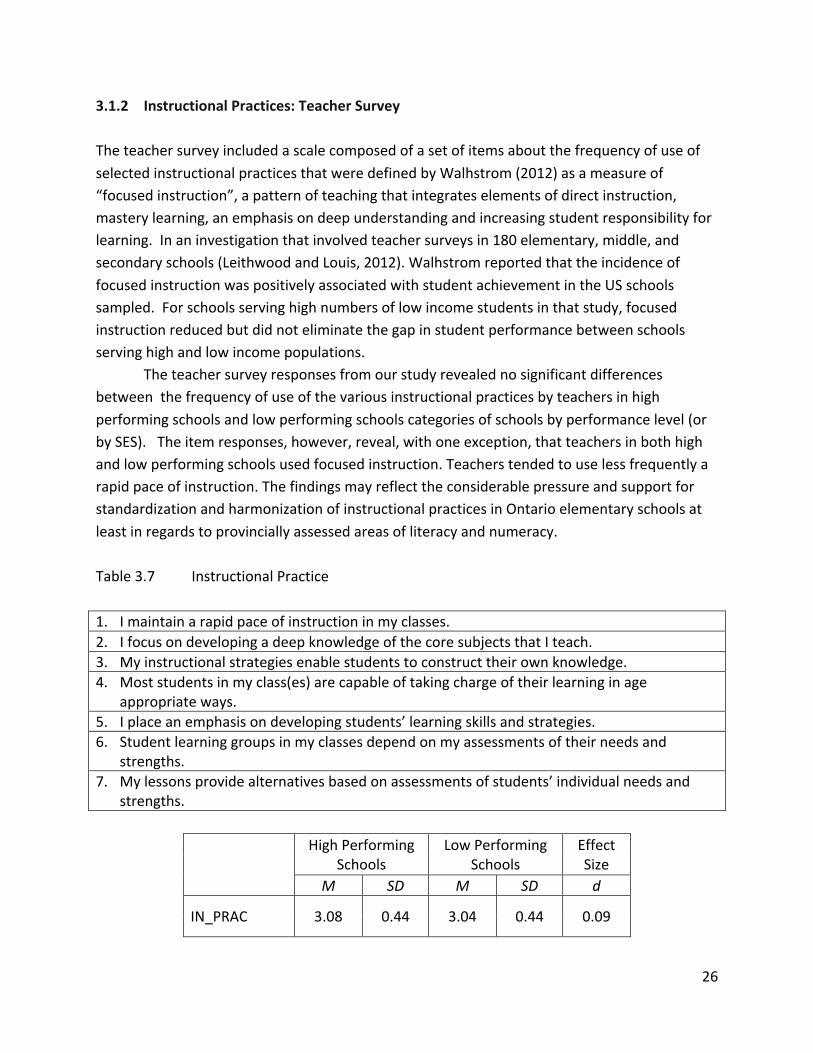
3.1.2 Instructional Practices: Teacher Survey
The teacher survey included a scale composed of a set of items about the frequency of use of selected instructional practices that were defined by Walhstrom (2012) as a measure of “focused instruction”, a pattern of teaching that integrates elements of direct instruction, mastery learning, an emphasis on deep understanding and increasing student responsibility for learning. In an investigation that involved teacher surveys in 180 elementary, middle, and secondary schools (Leithwood and Louis, 2012). Walhstrom reported that the incidence of focused instruction was positively associated with student achievement in the US schools sampled. For schools serving high numbers of low income students in that study, focused instruction reduced but did not eliminate the gap in student performance between schools serving high and low income populations. The teacher survey responses from our study revealed no significant differences between the frequency of use of the various instructional practices by teachers in high performing schools and low performing schools categories of schools by performance level (or by SES). The item responses, however, reveal, with one exception, that teachers in both high and low performing schools used focused instruction. Teachers tended to use less frequently a rapid pace of instruction. The findings may reflect the considerable pressure and support for standardization and harmonization of instructional practices in Ontario elementary schools at least in regards to provincially assessed areas of literacy and numeracy. Table 3.7 Instructional Practice 1. I maintain a rapid pace of instruction in my classes. 2. I focus on developing a deep knowledge of the core subjects that I teach. 3. My instructional strategies enable students to construct their own knowledge. 4. Most students in my class(es) are capable of taking charge of their learning in age
appropriate ways. 5. I place an emphasis on developing students’ learning skills and strategies. 6. Student learning groups in my classes depend on my assessments of their needs and
strengths. 7. My lessons provide alternatives based on assessments of students’ individual needs and
strengths.
High Performing Schools
Low Performing Schools
Effect Size
M SD M SD d
IN_PRAC 3.08 0.44 3.04 0.44 0.09

27
InPrac1 2.76 0.8 2.71 0.76 0.06 InPrac2 3.07 0.66 3.11 0.66 -‐0.06 InPrac3 3.28 0.62 3.25 0.68 0.05 InPrac4 3.11 0.58 3.09 0.61 0.03 InPrac5 3.31 0.63 3.27 0.62 0.06 InPrac6 3.08 0.8 3.01 0.84 0.09 InPrac7 2.98 0.62 2.85 0.68 0.20
Scale: 1 = never, 2 = sometimes, 3 = frequently, 4 = always
3.1.3 Student Assessment Practices The teacher survey included five items that reflect current expectations for student assessment in Ontario schools-‐-‐the use of common assessments, multiple measures, an emphasis on explicit learning goals and formative feedback to students, developing student abilities to monitor their own progress relative to learning objectives and use of assessment data for instruction planning.
Table 3.8 Student Assessment
1. Student assessments are collaboratively designed and implemented across grades. 2. Teachers evaluate student performance and progress in a variety of ways. 3. Students receive ongoing descriptive feedback on learning expectations and progress. 4. Students are taught how to evaluate their own performance. 5. Data on student performance and progress drives changes in instructional programs.
High Performing
Schools Low Performing
Schools Effect Size
M SD M SD d Assess1 4.38* 1.26 3.86 1.29 0.41 Assess2 5.53 0.63 5.43 0.74 0.15 Assess3 4.98 0.77 4.94 0.83 0.05 Assess4 4.81* 0.76 4.56 0.96 0.29 Assess5 5.21* 0.73 5.00 0.89 0.26 Scale: 1 – completely disagree to 6 – completely agree * Significantly higher mean, p < 0.05

28
The general pattern of high means and relatively low standard deviations for these survey items, suggest that teachers in both high and low performing schools are incorporating these kinds of student assessment related actions into their practice, though some differences are evident in comparisons between high and low performing schools, and in the degree of variability in the implementation of particular assessment behaviours. Of the five items related to assessment of students, only for the first item was there significant difference with a moderate effect size. Teachers in high performing schools more strongly agree than teachers in low performing schools that teachers work together to develop and implement common assessments across grades. While there was a significant difference for two of the remaining four times (students are taught to evaluate their own performance; data on student performance and progress drives changes in instructional programs), the effect sizes were small. Of note, there are larger standard deviations for the first item in comparison to the standard deviations of the remaining four items.
3.2 Instructional Practices: Teacher and Principal Interviews We asked teachers and principals to comment on the expectations for instructional practices in their schools. Were there programs and practices that all teachers were expected to implement? What flexibility did teachers have in pedagogical decision-‐making about curriculum content and objectives, teaching and learning materials and teaching practices? How did the lessons we observed fit in with their overall literacy program? Teacher comments focused mainly on literacy because the four individual teachers interviewed in each school were asked to comment on the teaching and learning activities observed in their literacy block. Teachers’ choice of what and how to teach in all the schools occurs within the parameters of provincial curriculum expectations for literacy, school board and school-‐level school improvement goals (grounded in analysis of student performance data), external (Ministry, board) school-‐level directions for the organization and delivery of instruction (e.g., timetabling, core materials, pedagogical structure and process) and teachers’ collective plans in division or grade level teams. Teachers’ individual discretion, to the extent that it exists, comes into play mainly in choosing activities from core and supplementary teaching and learning resources for different components of literacy instruction (e.g., guided reading, independent reading, learning centres, writing process), though in many schools these choices are a focus of team decision-‐making more than of individual preference. In all schools teachers talked more about shared foci for student learning (content to be learned, skills to be acquired) relative to provincial curriculum expectations than about the selection of teaching and learning materials or instructional methods per se, as illustrated in these interview excerpts.

29
As a school our School Improvement Plan our big goal was inferencing, finding the ‘big idea’. I think one of the district-‐wide goals we do focus on non-‐fiction text. Students need to recognize there is a difference between fiction and non-‐fiction. I’m trying to hone in on non-‐fiction texts and do that until June and then look at different types of writing –descriptive text, for example... how to summarize and find the main idea...It’s more of a district-‐wide goal. It’s tied to the curriculum and it’s one key element that I’m trying to meet. (T-‐11112)1 We are doing a non-‐fiction unit right now. We are trying to show the different forms of text especially before EQAO to make sure the Grade 3s know the difference between fiction and non-‐fiction. This one of the five reading strategies that we cover. We start with making connections, visualize, infer. Now we are asking questions to tie things together and they we will be synthesizing. It’s all part of the different reading strategies. (T-‐12233) First half of the year was working on routine development. Now moving on to reading strategies. Have worked on re-‐telling and now focusing on non-‐fiction...Eventually will lead to summarizing of a non-‐fiction text and eventually on to fiction and inferring and synthesizing. (T-‐11321)
We did inferencing and connections, and we did synthesizing and research and finding information and organizing ideas so that they make sense. We did that throughout the year. The only thing in writing left to do which I want to work on is narrative. We’ve done a lot of informative texts this year. (T-‐11434)
School-‐wide foci for teaching and learning typically reflect directions from the local school board, as well as discussion of student performance data through school improvement planning processes and grade or division level Pathways/parcours meetings (see explanation of Pathways/parcours in section 5.3.2). The more general point is that teachers talk more explicitly about what they teach (curriculum focus, objectives) than how they teach it. This tendency is not unique to groups of schools by performance or pupil characteristics. We encountered a strong degree of similarity in the foci on improving student learning named across schools, notwithstanding teacher and principal reports that they identified the goals for improvement through local board and school analysis of student performance patterns. This certainly reflects the standardizing effects of provincial curriculum expectations, and the presence of common difficulties in student performance associated with those expectations on the provinces’ EQAO literacy and numeracy assessments. In both the high and 1 See Chapter 2 section 2.5.1 for system of labelling interview transcripts by respondent type, school, etc.

30
low performing schools, as suggested in the preceding illustrations, school personnel commonly talked about school and/or division-‐wide foci distinguishing fiction from non-‐fiction texts, on understanding and practicing different types of writing (e.g., procedural, persuasive, descriptive, expository) and on summarizing and synthesizing texts. Teaching basic literacy skills (spelling, reading fluency and vocabulary) was mentioned mainly as a focus in the primary divisions across the schools, though it was reported as a more general ongoing concern in the French language schools because of the variability in French proficiency and use of French beyond the school among French-‐language students. Identifying what is taught, of course, is not indicative of how it is being taught. A third finding, and a recurring theme across our data, is that many of the instructional programs and practices reported by teachers reflect local board policy mandates, not individual school decisions. Thus, similar images of teaching and learning emerged in teacher comments from both high and low performing schools (regardless of SES characteristics) in the same school boards. This was most obvious in relation to board expectations regarding the timetabling and pedagogical structure of literacy blocks, and the adoption and use of core literacy programs and resources and board mandates. All school boards mandate extended blocks of time for literacy instruction for example, although the time varies by board (80-‐120 minutes). Some boards also prescribe or suggest how many minutes should be allocated to different components of the literacy program (e.g., reading and writing, shared-‐guided-‐independent activities). In one French language board, teachers in all elementary schools are required to group students by grade level into homogeneous groups according to assessed reading levels for targeted reading skills interventions by specialist teachers on a regularly timetabled schedule. The significant point for this study is that the kinds of variation in timetabling and organization for literacy instruction are determined by central authorities at the school board level and are not left to school discretion. Across the schools in all boards teachers reported a standard approach to literacy instruction, commonly described as ‘balanced literacy’, that teachers typically identify with external policy directions and professional support (e.g., professional development -‐ PD, resources) from their Boards and the Ministry. As described by the teachers, the term balanced literacy operates as an instructional approach that comprises the required components of literacy (reading, writing, oral language, media literacy), but also a sequenced pattern of instructional strategies. Teachers commonly talk about doing Read Alouds (teacher reads/models to students), Shared Reading (students read to each other), Guided Reading (teacher listens/coaches students reading in small leveled reading groups) and independent activities (students complete work on their own). Guided Reading is accompanied by students working on supplementary activities in small groups or independently on reading, writing, vocabulary or grammatical conventions while the teacher sits with and coaches Guided Reading groups. While teachers in all schools do not use the exact term ‘balanced literacy’, nor are they

31
necessarily aware of its source as a system-‐wide expectation, they describe a similar pattern and array of instructional strategies for reading, although less so for writing.
Our board has given us guidelines that we should be doing. We have a reading and writing block. Our reading block consists of a shared reading, a guided reading and an independent read the kids do. They work independently at centers set up by teachers on stuff we’re working on, and while they do that kids come back and we do guided reading lessons geared towards different groups. You may have different levels and different groups working on different things. This is explicit that we are to do this. (T-‐12323)
Now we’re starting procedural writing for 1 ½ weeks within a balanced framework – guided reading of procedural writing and read alouds and modeled writing or guided writing and some independent reading with that particular format of text—balanced literacy framework. It’s the 4-‐blocks model, not sure where that comes from. (T-‐11112) The focus for the board is to have a balanced reading program...guided reading, guided writing, shared reading and writing, Word Work where they are deconstructing words and looking at the spelling, rhyming words...independent read. (T-‐11434) L’enseignement explicite est très populaire dans le conseil scolaire et permet aux élèves de mieux comprendre ce qu’ils font et les étapes à suivre. Elle suit les étapes suivantes en enseignement explicite: le modelage, l’enseignement guide, la pratique coopérative (2 par 2), la pratique autonome et ensuite l’enseignement guide avec certains élèves qui n’ont pas compris. Elle utilise des centres littéraires dans la salle de classe. (E-‐22324)
This approach to teaching the reading component of the literacy curriculum is common across schools. In some boards and schools the model of Gradual Release of Responsibility (Fisher n.d.) – teacher models, students share, teacher guides, students perform tasks independently-‐-‐extends to writing as well. We found variability between boards in how expectations for literacy instruction are supported. The main difference is whether a board mandates the adoption and use of core and supplementary literacy programs/materials, in addition to providing professional development through board workshops and inputs from board literacy coaches (see 5.3.2 of this report). Teachers and principals from all schools in two of the four English language school districts, for example, reported that they were implementing the same commercial program because it was mandated by their board, and supplementing that program with other resources of their own choosing.

32
I use (R-‐1)2 program. It is a program that is endorsed by our school board and they purchased it for all students from Grade 1-‐8. It’s very up-‐to-‐date with the latest research on how to teach students to be good readers and good thinkers...Of course as teachers we use our own resources to supplement and draw from other places to help the kids grasp the concepts. (T-‐12113) This teacher uses (R-‐1) program predominantly for reading, media literacy, and oral presentations. For writing she also uses (W-‐1)...also (W-‐2). Junior division decided to make literacy consistent and use a consistent resource...(R-‐1) in this case...familiar to students as they move from year to year, consistency in teachers’ language...better student understanding. (T-‐11321)
Conversely, in the other English language boards, and in schools from the various French language school boards, teachers reported less district-‐wide prescription from the board in the choice of core literacy program resources, as illustrated in teacher interviews from Boards 2 and 4.
I pick and choose from different programs. The board has not handed a guideline to follow a particular program. I have resources here, from my other school and the internet to see and I decide where I want the kids to go. Then I find resources to see how I can meet this. (T-‐11112) We have our curriculum that we follow and then the (R-‐3) is not mandated by the Board. It’s a new program that was put out as a new initiative created by a group of teachers I think. The push towards balanced literacy is mandated by the board, so reading and writing and oral and media all linked together, and within the writing you spend time with reading groups and one-‐on-‐one and reading aloud. From there I’ve developed my program to meet my kid needs through my own assessments. There is no plan that says we have to do this now. (T-‐11434)
Commercially published program resources aligned with the Ontario curriculum are less widely available for the Francophone schools. As a result, principals and teachers are more likely to refer to the use of Ministry curriculum resources, curriculum frameworks and board expectations and professional development support for the use of common instructional strategies.
2 The names of the commercial programs are not reported here, because this study and report is not intended as an endorsement of any particular commercially produced teaching and learning programs.

33
L’école et le Conseil ont beaucoup misé sur l’harmonisation des stratégies de lecture. L’enseignant a reçu beaucoup de formation du Conseil pour développer ses habiletés dans ce domaine et sur le parcours fondamental. (E-‐22112) Elle utilise les fascicules du MEO: Le guide de l’enseignement efficace de la littératie. (E-‐22314) Nous avons tous reçus une formation sur la nouvelle grammaire au centre Franco par l’équipe FARE...Pas un manuel spécifique sur la nouvelle grammaire. On doit puiser un peu partout. C’est laissé à chaque enseignant de trouver et de développer le matériel requis. (E-‐22324)
Perhaps because there are fewer commercial teaching and learning materials in French well aligned with the Ontario curriculum and with a proven track record of effectiveness, staff in the French language schools (regardless of school group) talk more uniformly about the implementation of common instructional strategies than about the adoption and use of particular resource materials.
Mur de mots—mise en œuvre de la maternelle à la 6e année dans toutes les classes. Stratégies de compréhension en lecture. Tableau de la 1re à la 6e année – ce qui est à présenter à chaque année d’études. Ce qui est à consolider à chaque année d’études. Début de mise en œuvre de centres de littératie et de numératie de la 1re à la 6e. Livres nivelés avec GB+ et DRA, on discute beaucoup de cela. (D-‐22415) Ont travaille beaucoup les stratégies de lecture, les bries de compréhension, trouver le sens des mots. Ont utilise beaucoup le mur des mots pour intégrer les notions de grammaire. Faire ressortir le paragraphe et les grandes idées dans un texte informatif. Les collègues de 3e prennent la même approche. Ont utilise des textes variés en plus des textes de l’OQRE. (E-‐22111)
In sum, our findings do not suggest that choice of core literacy program resources is associated with school sample types, reflecting instead board-‐level policies and actions that govern choice. Overall, teachers tended to describe their teaching in terms of sources of teaching and learning lesson activities (e.g., commercial programs, Ministry documents, local instructional resources, resources available on internet sites), rather than in terms of specific instructional practices. While teachers in some schools reported that they and their colleagues decided on teaching and learning activities for school/divisional goals for student learning, it was not often clear whether this meant they were designing the lessons, or selecting lessons and activities

34
from available resource materials. We do not suggest that lessons developed by teachers are more or less effective than externally developed lessons that teachers find, adapt and apply. It does seem though that the current practice of teacher professionalism in Ontario elementary schools is characterized more by the assessment of student performance relative to provincial curriculum standards, and by the selection and implementation of available teaching and learning materials aligned with assessed needs, than by the development of original lessons by teachers individually or collaboratively in school, division, or grade level teams. The teachers did not voice objections to the constraints on teacher discretion in what and how to teach. Given the provincial and board-‐level mandates and expectations for curriculum and instruction, the overall image of literacy-‐focused teaching and learning is one of standardization and harmonization of instructional practice in elementary schools within the parameters described. In the paragraphs that follow we consider what differences between high and low performing schools emerge in our interview-‐based findings.
3.2.1 Teaching and Learning in High Performing Schools Once Ministry and board policy expectations and support for curriculum and teaching are taken in to account, it becomes difficult to discern with much certainty any patterns of teaching and learning activity that might be characteristic of or at least more typically associated with high performing schools. Teachers stressed their commitment to common goals for student learning set at the school level in school improvement plans and at the division or grade level in Pathways/parcours meetings (see explanation in Chapter 5, section 5.). They reported that lesson plans and goals for student learning were grounded in the collective analysis of student assessment data and in consensus about what areas of the curriculum to teach at different points over the year. They talked about adherence to common instructional approaches and strategies, such as the balanced literacy framework. They referred to the common use of teaching and learning resources and guides mandated or endorsed by the board where available. None of these patterns of teaching and learning activity, however, are distinctive of the high performing schools per se. We did find that teachers in the high performing schools often emphasized their freedom to supplement core curriculum and learning materials with other materials made available through the school administration, board in-‐service activities and prior professional experiences. Interview excerpts from three teachers in the one high performing school illustrate this kind of flexibility.
(L-‐1) and (L-‐2) are resources that are available, but they are not the primary intent...Teachers choose materials that respond to the interests of the students. (T-‐11111)

35
Borrow from other resources...a lot of great professional development around some key resources...e.g., Lucy Calkins primary/junior units of study...the Columbia teachers’ reading and writing project. For word study use “Words Their Way”.... (T-‐11111) Teacher uses the (L-‐3) literacy program “Reading with Meaning” and “Guided Readers and Writers, Grade 3-‐6” and other resources provided by the administration. (T-‐11111)
Faculty from other high performing schools reported similar levels of teacher flexibility in the selection of teaching and learning materials to achieve commonly prescribed and defined goals for student learning, though often as supplements to a board mandated or endorsed core program materials. The significance of this finding in high performing schools is not self-‐evident. It does not mean, for example, that teacher choice in teaching and learning materials leads to higher student achievement. It may simply be that in schools where student results are high, teachers feel less compulsion or external pressure to confine themselves to a specific core set of materials. Notwithstanding flexibility in choice of teaching and learning resources beyond those required by their board, teachers in several high performing schools referred to consensus on the use of some specific instructional methods. Some are promoted by the Ministry of Education and their boards, while others are embedded in commercial programs.
Kids do well on explicit questions, but struggle to identify the piece of evidence that they pulled the information from with inferencing. The whole school is using the Literacy and Numeracy Secretariat APE format (Answer, Proof, Extend). (T-‐11111) Rather than having one set of words for the whole class, we’re looking at where they are as spellers and what they need to learn...That’s how Word Study groups work...Spelling assessment 2-‐3 times a year or as needed. The (L-‐1) spelling inventory...We use that to inform our groupings. (T-‐11111) The (L-‐4) toolkit contains the lessons...The whole division is using the (L-‐4) toolkit and building their lesson using it as an exemplar. (T-‐11321) Le guide de l’enseignement efficace de la littéracie. Elle a puisé les jeux de communication oral et des jeux de vocabulaire suggérés dans le guide ainsi que de l’internet pour la leçon d’aujourd’hui. (E-‐22314)

36
Staff in most high performing schools reported that teachers within division or grade level groups discuss and coordinate the use of common teaching and learning activities for specific objectives.
TLCP decided to work on summarizing...The Primary division decided how they were going to teach it...decided to start with big ideas...Primary teachers collectively develop lessons and share. (T-‐11321) The teachers sit down at the TLCP and figure out what expectations they are going to figure out and work on them, how we are going to implement them and what accommodating tasks we are going to use and which texts we are going to use so we are not all using the same ones. (T-‐12323) Les enseignants se rencontrent 4-‐5 fois par année en CAP pour développer des stratégies par niveau. (E-‐22324)
In sum, across the high performing schools teachers reported a uniform press for coordination, coherence and consistency in teaching and learning activities as well as student learning objectives. They do not perceive and describe this as a negative constraint on their professional autonomy and claim substantial professional flexibility within the press for standardization. Teachers in several of the high performing schools talked about the development and use of various tools intended to facilitate greater clarity in learning objectives and less student dependency on teachers for guidance and feedback progress in their learning. Examples include word walls, anchor charts and graphic organizers that guide students through steps to complete tasks (e.g., writing process, summarizing, making connections), or that provide rubrics or exemplars to enable student self-‐evaluation aligned with expected learning outcomes at different levels. Teachers commonly referred to these as learning “strategies” that they were teaching students.
Last week we made a chart on a white board about the characteristics of fiction and non-‐fiction, because we are studying both in articles. So we have to determine which is which and use the characteristics to back it up... Comes from EQAO... They look for that... So we make sure we cover it. (T11112) Students are made aware of literacy learning via anchor charts, word walls and graphic organizers. (P-‐12113)

37
Ont utilise beaucoup le mur des mots pour intégrer les notions de grammaire: phrase négatives, phrase interrogatives, etc. (E-‐22111)
In some schools teachers explicitly stated that these “strategies” or protocols were aligned with Grade 3 and Grade 6 EQAO question formats that reflect Ontario curriculum expectations. Some might view these strategies negatively as narrowing instruction to test preparation and teaching to the test. On the other hand, these kinds of tools are designed to promote greater independence in student learning and to provide greater clarity for students about how to respond to cognitively complex questions. In several high performing schools the press for instructional coherence appeared to be recent. Teachers associated this variability with principal succession and differences in principal leadership. In some instances, incoming principals were more relaxed about harmonizing teaching practices (while still expecting teachers to comply with common goals for student learning).
This year, generally people are kind of doing their own thing. We do come together and talk about general strategies or skills our students need to learn. Last year based on our EQAO we decided to focus on concise short answers. So we all worked on how we would break that down and teach that to students, but we fit that into our own programs. This year we didn’t decide as a group what we would be teaching in reading and writing each term. In past years we have done more of that as a junior division. Because of Pathways and a change in leadership we have gotten away from that. (T-‐11111)
In other cases teachers reported that a change in leadership was accompanied by more proactive instructional leadership from a new principal, including monitoring and supporting teacher follow-‐through with plans for curriculum and instruction, providing time for Pathway/parcours activities and providing access to curriculum and teaching materials aligned with literacy expectations.
(The principal) has been really good. We did not have a strong principal here for years, so this year it was inspirational and we want to do more and better. She looks at long range plans and comes to talk to me about them. We never had guidance before. We could have done anything before without follow-‐up. She cares what you’re doing and she holds you accountable. It’s nice to feel that. (T-‐11112)
Thus, the degree of leadership pressure and support for coherence in teaching and learning in high performing schools is not predictable from knowledge of student results and characteristics.

38
In summary, across the high performing schools teachers and principals reported that teaching and learning activities were oriented towards school improvement goals related to provincial curriculum expectations and grounded in the analysis of student performance data at the board, school and division/grade levels. Teacher decisions about teaching and learning materials and instructional activities are responsive to policies and directions from the Ministry and boards concerning literacy programming and delivery, as well as to collective decisions of school faculty at the school and division/grade team levels. Teachers reported some flexibility in the choice instructional materials and strategies, but largely within the parameters of shared decisions about goals for student learning and the use of core program materials and/or strategies to maximize coherence in student learning. Notwithstanding the common administrative press for coherence and coordination in teaching and learning, the extent to which teachers actively sustain collaboration in practice is subject to variability in principal leadership.
3.2.2 Teaching and Learning in Low Performing Schools The findings (a) concerning directions, (b) constraints and flexibility in teacher decisions about what to teach, (c) what materials to use and (d) what teaching and learning activities to implement in low performing schools are generally similar in both high and low performing schools. Teachers and principals in the low performing schools, like their counterparts in the high performing schools, emphasized their adherence to grade and division level curriculum expectations in literacy, and to the ongoing use of common assessment and evaluation practices (see also Chapter 5.4.2) to track student performance relative to those expectations. While our findings point to some patterns of difference between high and low performing schools, there are exceptions. As in the high performing schools, teachers in the low performing schools talked about flexibility in choice of instructional materials and activities to supplement core literacy programs that all teachers were expected to implement.
T develops the program herself. High degree of autonomy/flexibility in program design. Writing – (W-‐1) program, dominant influence. Reading—(L-‐2) program...Reading for Meaning...dominant influence. (L-‐1), resource that was initially used for Guided Reading... Followed T’s guide initially, but now does it on her own... (T-‐11241) I do Daily Five in my classroom. It promotes kids working independently so that I have more time to conference with individuals in small groups...It is not my original idea. It is two books you can buy...by two teachers in Washington. I found it on the website, and saw that a bunch of people use it already. The first year I have used it. (T-‐11242)

39
(L-‐1) is for Grades 3-‐6 here. Grade 2 is wide open, so I basically use the curriculum document step by step and I build my own program. I taught straight Grade 2s for the past few years and I built this program for the reading – the visualizing, making connections and all that piece. So I’m building the whole thing and using different resources in the school for the writing program. (T-‐12233) (Are all teachers implementing the same program?) Mostly individual. I have discussed with other teachers. This is my first time in Grade 3. We have been using (L-‐4) series in Guided Reading, so it is kind of a structured literacy program with some flexibility. With the exception of our Learning Cycles that are focused on skill development of particular skills, most of the programming is done on our own though. (T-‐11224) We’re working on persuasive writing. We decided as a division. (Learning Cycles) usually last for six weeks. I have a couple of different books that I use personally. One is called ‘comprehension strategies’ and the other one is ‘independent reading in a box’ and that is where the lesson came from today. I just chose to use this today. No one else does. I do talk with the grade 4/5 teacher, but we work in isolation. (T-‐11444) We do have a month at a glance, and what the new (L-‐1) program does for us is a unit plan which is sort of yearly. But it’s only one program and can get boring if you use only one program. I like to pull from different areas. So we have one program that is there for us, but I like pulling from different areas and it makes your teaching better. (T-‐12443)
The reported emphasis on harmonization of program materials and instructional practices was greater in the French language schools than in the English language schools. Does flexibility for choice in instructional decision making differ between high performing and low performing schools? At least within the context of reading instruction, our interview data do not present a clear pattern of difference in the exercise of teacher discretion in teaching and learning. Everyone reports that goals for student learning are set at the board, school and division/grade levels, and that these goals provide the direction for curriculum planning during the year especially within Pathways/Parcours cycles. Everyone reports that student performance is assessed and tracked by teachers together in relation to these common goals. Everyone talks about using specific programs and instructional frameworks and practices endorsed by their board. At the same time, teachers claim that they are free to supplement board expectations by drawing from alternative programs and materials. Three subtle patterns do surface in our comparisons between higher and lower performing schools, though we cautiously report these as tendencies across our small sample

40
of schools. First, among eight of the 11 schools in the low performing group, the reported emphasis on teacher collaboration in instructional decision making at the school and division/classroom levels was reportedly recent and/or constrained by organizational features (e.g., school size and number of teachers per grade). To the extent that coherence in teaching and learning within and between grade levels depends on the quality of teacher-‐teacher collaboration in instructional decision-‐making, variability in depth and frequency of teacher teamwork, particularly at grade and division levels, could affect the contribution of that coordinated effort to student learning. Overall, our findings suggest that organized teamwork on teaching and learning was less uniformly institutionalized in the low performing schools. While there were some high performing schools where an emphasis on teacher collaboration was also recent and/or limited by school organizational characteristics (e.g., few teachers per grade), this was more idiosyncratic than typical of the schools in that cluster. Second, staff in low performing schools (especially high SES low performing) were more likely to rationalize teacher decisions about learning objectives and instructional activities in terms of preparation for EQAO literacy assessments, and of interventions that target students performing below the provincial proficiency Level 3.
(School goal) Teachers identify three children they figure they can have the biggest impact on moving forward...below Level 3. Teachers need to fill out a form... what interventions they’re going to use. Target the kids in the school who can have the biggest impact...e.g., 2.9 kids move them to Level 3. That is mandated from me (the Principal). (P-‐11242) (The lesson today) came from the board office person. Framework given regarding answering questions. Also for doing better on testing and getting Level 2 and Level 3 answers. The goal was to help the Cs jump to Bs as a school and as a board. (T-‐12233) We were working on the persuasive text form which flowed out of the report form of writing, and we know it shows up on EQAO and we saved it until the end so it would be more in their mind as we got there. (T-‐11224) Le Parcours est développé par des animatrices pédagogiques du Conseil...Les enseignants se sert des copies types de l’OQRE pour préparer les élèves et du matériel trouvé un peu partout. (E-‐22221)
As might be expected in low performing schools, teacher and principal concerns about student performance relative to external accountability pressures were more obvious in their comments than in those of their colleagues in the higher performing schools. The fact that they

41
explicitly frame their instructional decisions with reference to provincial standards and accountability expectations does not necessarily mean these teachers are using substantially different teaching methods than their colleagues in high performing schools. It may, however, reflect a patterned trend and difference in teacher thinking and discourse about instruction in these schools. Principals and teachers in low as well as in high performing schools reported school-‐wide efforts to implement similar commercial or teacher developed assessment and evaluation tools, and to use the information from those assessments as a basis for instructional planning in the context of scheduled grade or division level Pathways/parcours meetings over the school year.
Teachers are expected to use resources in a specific way. We use benchmarks in primary, CASI in junior. We’re developing our own rubrics. Teachers submit the data back to me after they’ve assessed the students. Samples of student work. I like to put samples of student work in front of teachers at staff meetings so we can discuss—moderated marking. (P-‐11242) The school goal is to improve writing and make sure everyone is assessing similarly so all teachers agree on what a particular level is. With EQAO we are trying to make our assessments more consistent just like they do. So we decide on an important area of writing that students need to work on. The first one was descriptive writing. So we did a six week study on that with diagnostic, formative and summative. (T-‐11224) Tâche d’écriture typique en lien avec le Parcours en écriture (intervention ciblée de six semaines). La classe est à la fin du Parcours et le test sommatif sera donné le lendemain. L’enseignant se rendra au (bureau central) pour corriger le sommatif avec les autres enseignants du conseil qui participent au Parcours. (E-‐22221)
While staff from all schools emphasized coherence in student assessment practices, we detected a tendency among teachers and principals in the lower performing schools to speak more uniformly about consistency in student assessment than about consistency in program implementation. This tendency may relate to the finding of less experience with teacher teamwork in a majority of the low performing schools when compared overall with the high performing schools in our sample. The first focus of collaboration may be assessment of student learning. Once that becomes engrained in teachers’ collective work, they may move on to greater consensus on how to teach collaboratively determined goals for student learning. In sum, if the positive effects of coordinated effort on student learning are not instantly achieved when teachers begin to collaborate, then our data suggest that among the lower performing

42
schools in our sample consistency in teaching simply may not yet be as deeply embedded in teacher culture and practice.
3.3 School Climate The teacher survey included a five item school climate scale (α=0.76). The findings are presented in Table 3.9. We did not specifically ask about school climate in interviews with principals, teachers and parents. Student views on their schools are reviewed in the Student Focus Group data that follows. The teacher survey posed questions about physical and emotional safety, orderliness of the learning environment, consistency in management of student discipline, maximization of instructional time and student participation in extra-‐curricular activities. While teachers from both high and low performing schools gave positive views of their school climate, with one exception, discernible differences appear between the high and low achieving schools.
Table 3.9 School Climate
1. The working and learning environment is physically and emotionally safe. 2. The learning environment for students is orderly and focused. 3. The teachers and administration demonstrate consistency in managing student discipline. 4. Disruptions of instructional time are minimized by the administration. 5. Most of our students participate regularly in at least one extra-‐curricular activity.
High Performing
Schools Low Performing
Schools Effect Size
M SD M SD d
CLIMATE 4.95* 0.56 4.42 1.07 0.62
Climate 1 5.51* 0.69 4.82 1.45 0.61 Climate 2 5.2* 0.67 4.48 1.32 0.69 Climate 3 4.82* 1.06 4.21 1.62 0.45 Climate 4 4.71 1.03 4.66 1.09 0.05 Climate 5 4.48* 1.23 3.98 1.34 0.39 Scale: 1 – completely disagree to 6 – completely agree * Significantly higher mean, p < 0.05
On the overall school climate measure, and on all items except minimization of disruptions of instructional time, teacher agreement about the positive indicators of school climate named in the survey items was significantly more positive in the high performing schools than in the low

43
performing schools (with moderate effect sizes). There was no meaningful variation across schools for the item concerning management of instructional time. Student participation in extra-‐curricular activities and its relationship to student/family characteristics is revisited in the section that addresses findings on parental involvement.
3.4 Student Focus Groups This section considers the students’ perspectives on topics such as (a) school climate, (b) assessment of learning, (c) assistance with learning, (d) learning at home and (e) the purpose of learning. We collected students’ viewpoints from focus groups with five or six students from grades four to six3. Their answers are summarized below. 3.4.1 School Climate The first question we asked students was “If you were visiting with some friends from out of town and they asked you what it was like attending this school, what would you tell them?” Their answers showed that in general, students had a positive view of their school and their teachers. They said things such as the following:
It is a really cool school; the teachers are nice and not too strict. (SFG-‐11224) It’s a good school to be learning at because the teachers are good at teaching. (SFG -‐11321) C’est une belle école et les enseignants sont très gentils. (SFG-‐22111) The teachers are nice and it’s a good school. The teachers are all really nice and they understand. They are reasonable. (SFG-‐11322)
Students within the high performing low SES schools were more likely to mention learning support programs (e.g. programs for English Language Learners), programs to help students in need (e.g. giving laptops to students), the provision of hot healthy meals, community programs (e.g. fundraising) and school activities (e.g. crazy hair day).
Across the low performing schools (especially low performing low SES), a few students seemed less positive about their schools. They said things such as It’s okay I guess (SFG -‐11434)
3 Given there was not a great variability between groups, the organization of this section will vary from the rest of the report in that it will be organized by questions and answers to those questions rather than by school group (high vs. low performing and SES level).

44
and were a little more likely to voice complaints, though this view was not generalized to all those schools. We also asked students “Is there anything that your teachers and the principal could do to make the school better?” Approximately half of the students answered that the schools was really good and there was nothing to improve. As one student phrased it:
I don’t know… it’s such a good school I don’t know how to improve it. (SFG-‐11112)
Other students did have suggestions. Students from all groups, except the high performing high SES group, mentioned they would like more art, drama, dancing, music and sports. Students from the low SES schools mentioned better playgrounds (e.g. grass, trees and games). For example, one student said:
I think they could make a play ground for the older kids so we have something to play with – only grades 1-‐3 can go on the playground. (SFG-‐11444)
Students from low performing schools (especially from the low performing high SES schools) suggested more resources, rules and a better school climate. Also, only students from schools in this group asked for more of the classes they liked (e.g., computer, French, public speaking, math, science, English, chemistry, geography) and a couple of students mentioned improving aspects of the classes (e.g., having more creative activities). 3.4.2 Assessment of Learning We asked students “How do you know how well you are doing in your school work and learning?“ The most common answer from students in all groups was what teachers told them their grades. They said things such as the following:
The teacher will tell us if we are not doing well. (SFG-‐11111) C’est surtout avec les notes des bulletins. (SFG-‐22112) I know I’m doing well because I’m getting good grades. (SFG-‐12233) Feedback from the teacher, feedback like by your report card. (SFG-‐11432)
Students from high performing schools were more likely to report examples of class activities related to reviewing their own work, using criteria to check their own work and positive incentives such as encouragement from the teacher, awards, prizes and honors list (especially

45
in high performing low SES schools). Conversely, students from low performing school were less likely to mention ways other than teacher’s comments or grades. Also, there were a few students from low performing schools that complained about their grades or mentioned teachers not communicating about the status of their grades or being clear about them. 3.4.3 Assistance with Learning Problems “What things help you to be successful in your school work?” was another question we asked students. Receiving help from the teacher in class was the most common answer among all groups of schools, for example:
If we don’t understand the question the teacher breaks it down piece by piece so we can go over the information when we’re reading or doing the question. (SFG-‐12113) When our teacher answers questions but not all the way – she’ll word it differently so we understand and then we look it over again and it makes more sense to us. (SFG-‐11242) L’enseignant nous donne des stratégies pour nous aider, par exemple, lire avant et après et petit mot dans un grand mot. (SFG-‐22314) My teacher because she sometimes calls us back to the table and helps us. (SFG-‐11444)
Students in high performing schools were more likely to mention test preparation (especially in high performing high SES), having clear criteria and instructions and classroom activities. As one student answered:
The teacher gives pamphlets of what should be Level 4 and rubrics for everything. (SFG-‐11111)
These same students were also more likely to mention resources (e.g. manipulatives, neumonics, smart boards), as exemplified by these student’s answers:
Using materials such as manipulatives and smart boards because usually in my head it’s hard to see… I need to be able to see it, touch it. (SFG-‐11321)

46
Students in low SES schools, but especially in low performing low SES, were more likely to mention their own work and effort. In addition, it might be worth mentioning that only students in low performing low SES schools mentioned basic considerations, such as not feeling afraid to participate, having extra time, having pencils and erasers and knowing how to read and write. We also asked students “What do your teachers do to find out if you and your classmates are having trouble understanding and doing your school work well? “ and “What do your teachers do to try to help kids who are having trouble with their school work?” Students from most schools mentioned that teachers could determine how they were doing with their school work by talking to them, marking their work and observing them. With regards to receiving help when they had trouble with their school work, the most mentioned aspect by all groups was receiving one-‐on-‐one assistance or help in small groups from a teacher or teaching assistant. Although less so, students from all groups of schools also mentioned receiving help outside school, being helped by the teacher in whole class discussions and working with peers (working with peers was mentioned more often in high performing schools). The students gave responses such as the following:
Enseignante ressource aide les élèves en difficulté. (SFG-‐22111)
Kids are asked to go to the carpet area where the teacher gives more explanations. (SFG-‐11241) Our teacher has extra time where students can come before or after school when people can come get help and he puts examples on the board and helps them. (SFG-‐11331) My teacher because she sometimes calls us back to the table and helps us. (SFG-‐11444)
Only students in low performing low SES schools mentioned teachers helping students by allowing them to work at another level or with different tasks. As one student described it:
If we’re below average she doesn’t force us to do what the other grade 5 and 6 do. If you have to she’ll give you whatever grade you need, like grade 4 work. (SFG-‐11444)
3.4.4 Learning at Home We asked students questions about homework, such as “How much homework do your teachers give you? What are examples of your homework in the last week? Where do you do

47
your homework? If you get stuck, what do you do?” There were many answers that were similar in all schools, and the following are the ones that were mentioned the most: • Homework most frequently consisted of whatever work students had not finished at school
or mathematics and literacy homework. • Students thought their teachers assigned the right amount of homework. • They did their homework in open areas at home (kitchen, dining room, living room) and
their bedroom. • They most often tried to solve it on their own or asked their parents for help.
Students from high performing high SES schools were more likely to mention that homework was related to EQAO or test preparation. A few students in this group described homework as fun and that it helps them understand. Contrarily, a couple of students in the low performing schools mentioned there wasn’t enough homework or it wasn’t challenging enough. Students from low performing low SES school were also less likely to mention asking their teacher for help with homework. 3.4.5 The Purpose of Learning The final question we asked students was “What are you and your classmates learning about this week in your reading and writing lessons? Why do you think that you are being asked to learn that?” There were no salient differences between groups in the answers to this question. The three most common answers were to further improve academic skills (learn how to write better, read better, etc.), for their future in general and for their future careers more specifically. With regards to future careers, students frequently mentioned that what they were learning would help them become writers and journalists (presumably because they were asked about their reading and writing lessons). For example, students provided answers such as the following:
Pour nous aider en lecture et pour nous aider à mieux répondre aux questions. (SFG-‐22112) To be a better writer when you get older if you want to be that or an author. (SFG-‐11224) Ça peut nous aider plus tard dans notre emploi. (SFG-‐22213)
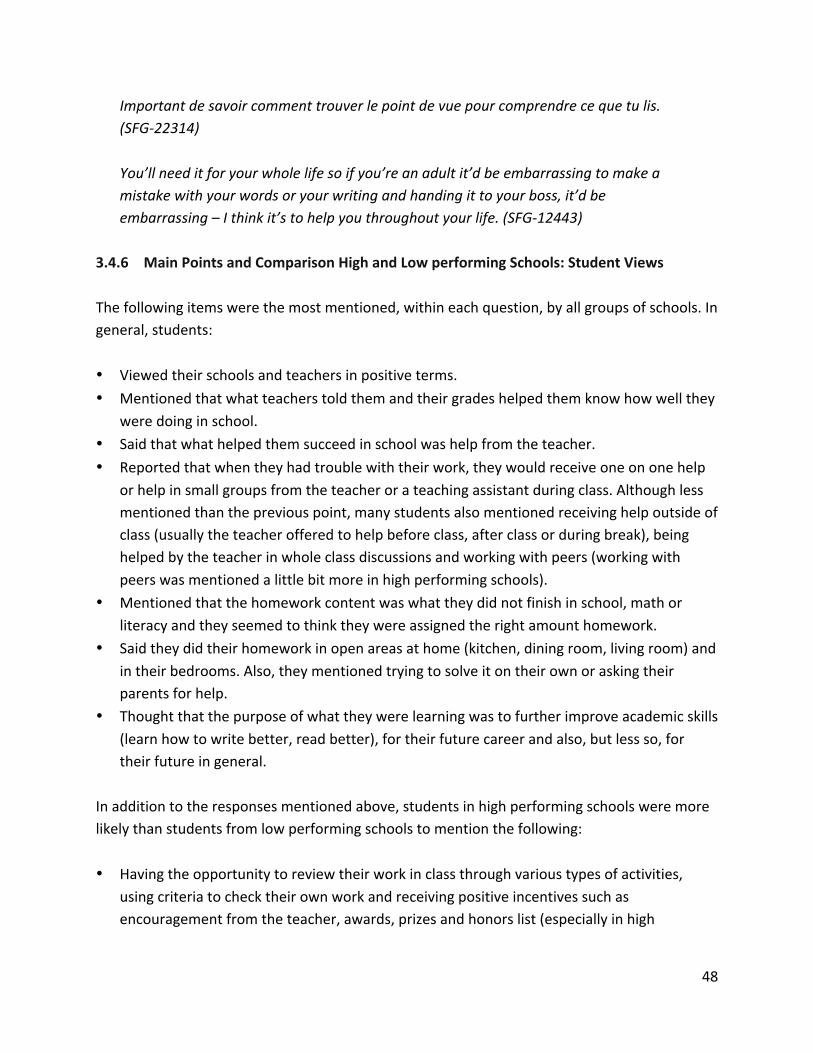
48
Important de savoir comment trouver le point de vue pour comprendre ce que tu lis. (SFG-‐22314) You’ll need it for your whole life so if you’re an adult it’d be embarrassing to make a mistake with your words or your writing and handing it to your boss, it’d be embarrassing – I think it’s to help you throughout your life. (SFG-‐12443)
3.4.6 Main Points and Comparison High and Low performing Schools: Student Views The following items were the most mentioned, within each question, by all groups of schools. In general, students: • Viewed their schools and teachers in positive terms. • Mentioned that what teachers told them and their grades helped them know how well they
were doing in school. • Said that what helped them succeed in school was help from the teacher. • Reported that when they had trouble with their work, they would receive one on one help
or help in small groups from the teacher or a teaching assistant during class. Although less mentioned than the previous point, many students also mentioned receiving help outside of class (usually the teacher offered to help before class, after class or during break), being helped by the teacher in whole class discussions and working with peers (working with peers was mentioned a little bit more in high performing schools).
• Mentioned that the homework content was what they did not finish in school, math or literacy and they seemed to think they were assigned the right amount homework.
• Said they did their homework in open areas at home (kitchen, dining room, living room) and in their bedrooms. Also, they mentioned trying to solve it on their own or asking their parents for help.
• Thought that the purpose of what they were learning was to further improve academic skills (learn how to write better, read better), for their future career and also, but less so, for their future in general.
In addition to the responses mentioned above, students in high performing schools were more likely than students from low performing schools to mention the following: • Having the opportunity to review their work in class through various types of activities,
using criteria to check their own work and receiving positive incentives such as encouragement from the teacher, awards, prizes and honors list (especially in high

49
performing low SES schools) helped them know how well they were doing in their school work and learning.
• Having clear criteria and instructions as well as classroom activities and resources (such as manipulatives, neumonics and smart boards) helped them succeed at school.
• Completing homework related to EQAO or test preparation. Students in high performing low SES schools were also more likely to mention school programs such as learning support programs (e.g. programs for English Language Learners or students with learning disabilities), programs to help students in need (e.g. giving laptops to students), the provision of hot healthy meals, community programs (e.g. fundraising), school activities (e.g. crazy hair day), positive incentives (such as encouragement from teachers, awards and prizes) and using criteria to check their own work. Students in low performing schools were more likely than students from high performing schools to: • View their school as "not too bad" or “ok” instead of "great". • Voice complaints (about the school not being demanding enough, discipline issues or
discontent with grades). • Have suggestions to improve their schools (including suggestions about classes and
teaching, not only about extracurricular activities or the playground). Only students in low performing low SES schools mentioned students working at a lower grade level as a way to help them with their learning. While many students in the other three groups of schools reported asking their teacher for help with homework, only students of one school across the low performing low SES group did. In addition, only low performing low SES schools mentioned basic considerations, such as not feeling afraid to participate, having extra time, having pencils and erasers and knowing how to read and write, when asked what helps them succeed in school. Finally, students in low SES schools, but especially in low performing low SES, were more likely to attribute their success at school to their own work and effort rather than classroom activities or other types of support.

50
Chapter 4 -‐ School Success Perspectives
4.0 Introduction This chapter examines principal, teacher and parent opinions and beliefs about the meaning of “school success” and about the particular strengths, challenges and factors influencing the school success in high performing and low performing schools. In Chapter 3 and in Chapters 5-‐7, we present and discuss findings concerning what principals and teachers are actually doing that relates to the accomplishment of school success in the participating schools.
4.1 Meaning of Success In our interviews we asked how principals, teachers and parents defined “success” in the context of their schools and communities. The majority of respondents, regardless of school category, expressed a multi-‐dimensional view of success that included, but was not limited to, students’ EQAO literacy and numeracy assessment results. It also was not limited only to academic success. Principals, teachers and parents in all schools emphasized children’s whole development as well as how they felt in school.
L’apprentissage aussi bien que la personne de l’élève… c’est pour cela qu’on travaille beaucoup les valeurs. (E-‐22112) There is an expectation to provide academic excellence but the total student needs to grow – academically, spiritually and as a citizen. (P-‐12113) Pour moi la réussite c’est l’enfant qui est heureux-‐il doit se sentir bien et qu’il aime venir à l’école. (PAR-‐22314) Success for me means improving student achievement. And improving student achievement for me means not just academically, but also their learning skills and just socially... (T-‐11331) …for me it is children feeling safe and comfortable, willing to risk and willing to share regardless of what level they are at, learning to share and cooperate. Those things are much more important to me when I look back on a class than can they do well on the EQAO. (T-‐11444)
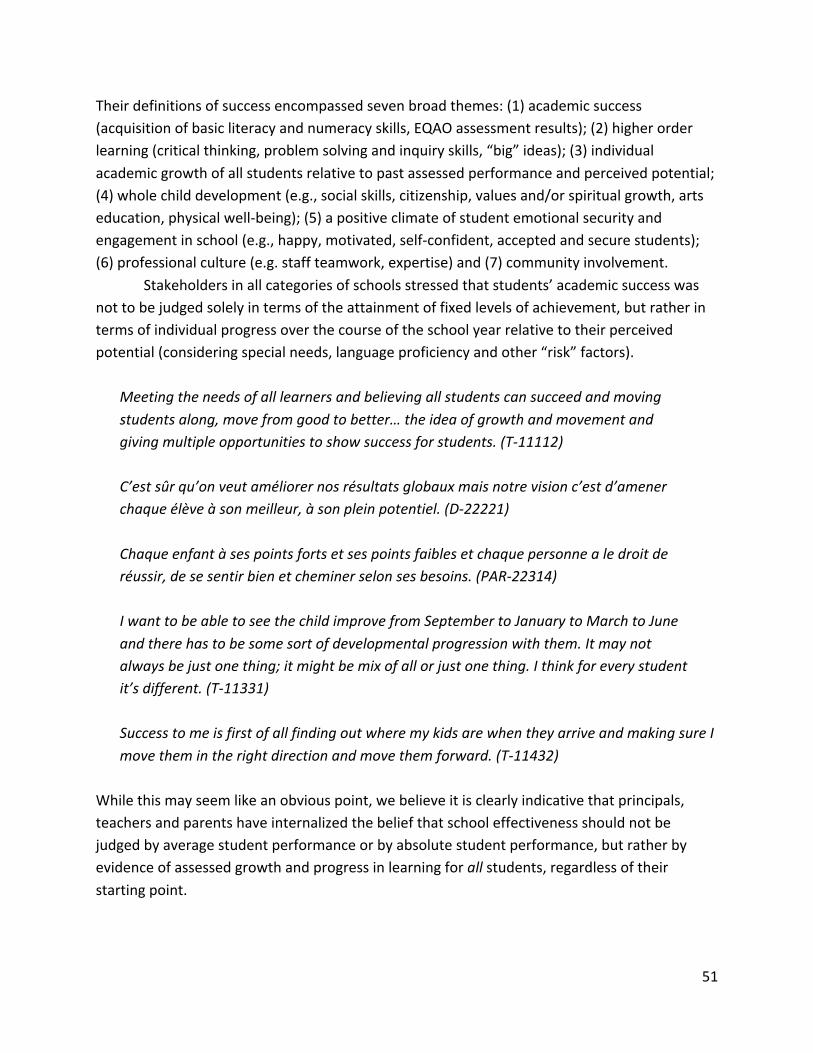
51
Their definitions of success encompassed seven broad themes: (1) academic success (acquisition of basic literacy and numeracy skills, EQAO assessment results); (2) higher order learning (critical thinking, problem solving and inquiry skills, “big” ideas); (3) individual academic growth of all students relative to past assessed performance and perceived potential; (4) whole child development (e.g., social skills, citizenship, values and/or spiritual growth, arts education, physical well-‐being); (5) a positive climate of student emotional security and engagement in school (e.g., happy, motivated, self-‐confident, accepted and secure students); (6) professional culture (e.g. staff teamwork, expertise) and (7) community involvement. Stakeholders in all categories of schools stressed that students’ academic success was not to be judged solely in terms of the attainment of fixed levels of achievement, but rather in terms of individual progress over the course of the school year relative to their perceived potential (considering special needs, language proficiency and other “risk” factors).
Meeting the needs of all learners and believing all students can succeed and moving students along, move from good to better… the idea of growth and movement and giving multiple opportunities to show success for students. (T-‐11112) C’est sûr qu’on veut améliorer nos résultats globaux mais notre vision c’est d’amener chaque élève à son meilleur, à son plein potentiel. (D-‐22221) Chaque enfant à ses points forts et ses points faibles et chaque personne a le droit de réussir, de se sentir bien et cheminer selon ses besoins. (PAR-‐22314) I want to be able to see the child improve from September to January to March to June and there has to be some sort of developmental progression with them. It may not always be just one thing; it might be mix of all or just one thing. I think for every student it’s different. (T-‐11331)
Success to me is first of all finding out where my kids are when they arrive and making sure I move them in the right direction and move them forward. (T-‐11432)
While this may seem like an obvious point, we believe it is clearly indicative that principals, teachers and parents have internalized the belief that school effectiveness should not be judged by average student performance or by absolute student performance, but rather by evidence of assessed growth and progress in learning for all students, regardless of their starting point.

52
In many of the schools that participated in our study, teachers and principals defined success not simply in terms of student performance, growth and engagement in school and learning, but also in terms of professional relations amongst staff.
At a staff level, success is about collaboration and about working with our grade partners, and our division, and across divisions. (T-‐11111) Staff work together as a team, are respectful of each other. (PAR-‐11322) Aligning and amalgamating with staff… A lot of conversations about what learning should look like and what learning could look like. (P-‐11242) I think just being able to collaborate with your teaching partner and staying up to date on everything… like this year we had a collaborative inquiry where we come together with our best practices with all the sister schools and staying up to date with what is current in our Board and implementing that the best we can in our own classrooms. (T-‐12443) C’est d’abord une équipe formidable au niveau du personnel où il y a de l’entraide et un esprit d’ouverture et de partage assez unique. (PAR-‐22415)
Specifically, they emphasized high levels of professional collaboration amongst teachers (teamwork, sharing of expertise, joint reflection and problem solving). 4.1.1 Meaning of Success in High Performing Schools One difference in the definition of success by school and parent respondents in higher and lower performing schools relates to the development of students’ higher order learning skills. Teachers in high performing schools commonly included critical thinking, problem solving and inquiry skills as important dimensions of student development and success.
Nous voulons que les élèves puissent réussir au niveau de la communication orale, de l’écrit, des habiletés de la pensée et de la résolution par problèmes. (D-‐22112) Success means to me I’d like them to go out and be problem solvers. (T-‐12323) For me success would be that they learn how to learn… more meta-‐cognition and strategies to know how to solve a problem if you’re stuck. (T-‐11112)

53
It would be inappropriate to infer that educators in the lower performing schools are not striving to push student learning beyond basic skills acquisition. Our findings do suggest, however, that teachers and principals in higher performing schools may be more preoccupied with this dimension of student learning, possibly given that a larger proportion of their students are already performing at or above the Ministry’s Level 3 proficiency standards on EQAO literacy and numeracy assessments.
Teachers and principals in two high performing high SES schools referred explicitly to evidence of academic growth for average and high performing students.
Try to move as many kids as we can to level 3… but how do we move the often neglected middle group, how do we move those into 4s? It’s about balancing the needs of all students. (T-‐11111) Also success means meeting standards… and they should be moving on a continuum. If at a level 3, how to get to a level 4? (T-‐11112)
They were not just preoccupied with those struggling to achieve the minimum proficiency Level. This could reflect their school’s high performing status, but it was not a general finding across the high performing schools as a group. 4.1.2 Meaning of Success in Low Performing Schools As previously mentioned, principals, teachers and parents in the low performing schools (particularly the low performing low SES schools) were less prone to emphasize student learning for deep understanding beyond basic literacy and numeracy skills in their definitions of success. In addition, there was a nuanced difference between low and high SES schools within the lower performing category: principals and teachers in low performing high SES schools mentioned higher order learning outcomes more often than their counterparts in the low performing low SES schools.
To me success goes back to the kids. Are they successful in terms of their learning and understanding? (T-‐11242) The expectations that I pick and the work that I’m doing is meaningful to the students… and they can find a connection to it. (T-‐11241)

54
These comments, however, were typically related to student understanding and making connections, rather than to more complex higher order learning skills emphasized in higher performing schools such as critical thinking, problem solving or grappling with “big” ideas. On the other hand, teachers in low performing schools were prone to emphasize evidence of progress in student learning recognizing differences in starting points, interests and perceived potential, regardless of whether or not the students achieve provincially defined standards. In other words, success was defined more in terms of student progress.
3.1 School Strengths We asked principals, teachers and parents to highlight what they regarded as the strengths of their school. Their answers echoed in various ways their definitions of the meaning of success. While there was a high degree of similarity across these groups and categories of schools in the areas of strength described, there were some observable differences in emphasis and details across school types that will be explained in the following sections. Overall, school respondents highlighted school strengths related to (1) learning and academic results, (2) school climate, (3) non-‐academic programs and student development, (4) teacher professionalism, (5) leadership and support, (6) school improvement plans, (7) quality of instruction, (8) at-‐risk student support and (9) parent and community involvement.
Principals and teachers in all schools highlighted specific foci of academic success in their schools.
We do a good job especially in literacy… in preparing our students for being good readers and to enjoy learning. I feel like we do a good job of that -‐-‐especially in literacy-‐-‐ we are working on it in math and other areas, but especially in literacy I feel like our students are very strong and it shows as they come up in the grades. (T-‐11111) Les élèves réussissent bien en lecture, écriture et même en mathématiques. (D-‐22112) Beaucoup d’affinité en math et la compréhension des calculs. (E-‐22314) Academics… the school has a good record. I did my homework before committing to buying a house in this area. (PAR-‐11321) We’ve raised the bar in primary… the vocabulary is much richer and the critical literacy aspect can be taught in grade 1 -‐ the kids are more challenged. (T-‐11432)

55
No one in any of the schools emphasized school strengths in academic areas such as science and social studies. Clearly the provincial focus, priority, support and accountability for student excellence in literacy and numeracy have had a steering effect on way people think and talk about the quality of their elementary schools.
Teachers, principals and parents in all schools spoke about the positive climate for teaching and learning in their schools as a school strength.
My daughter has been at several schools but here she is motivated, she excels and she is happy. (PAR-‐12113) Bonne participation et enthousiasme des élèves… une belle complicité entre les élèves; les grands surveillent les petits. (E-‐22221) Our kids want to be here; they’re happy and want to learn. (P-‐11331) Definitely the safe environment for them to come to every day. For all students and even teachers we have an established well-‐rehearsed routine, so expectations are clear and students know what is expected of them – they know the rules, routines and structure. This makes it a safe place for them to be. (T-‐11432)
Most comments about school climate centered on positive behaviours as well as positive attitudes and feelings of students (attributed to the effectiveness of school-‐wide positive behaviour reinforcement programs in some schools, both low and high performing), student engagement in learning and school activities and student sense of community (pride, belonging).
Interview participants in all schools highlighted the multiplicity of extra-‐curricular programs and activities as a school strength.
The many activities… for example the annual musical production, the Fun Fair, the community based functions and the noon hour extra-‐ curricular programs. (PAR-‐11111) The music program has developed in leaps and bounds and is an enormous success. We compete in festivals… travel around and perform. It makes our students’ transition into high school smoother because they’ve made connections with kids in high school through the music program. Kids are more prepared and sign up to be in the band and orchestra as soon as they get to the high school and it helps them graduate. (T-‐11224)

56
The teachers know the kids don’t get much outside of school, so they provide lots of extra-‐curriculars—the school is hopping with activity. (P-‐11331) Les élèves participent à toutes activités prévues (sports, compétitions, concours, etc.) pour eux et développent une bonne estime de soi. (E-‐22415)
These programs and activities were not just mentioned because of their benefits in terms of student engagement, but also as opportunities for students, especially students struggling academically, to experience success and recognition in non-‐academic ways (e.g., social skills, arts and physical activity).
Educators and parents in both high and low performing schools commonly emphasized the high level of teacher professionalism in their schools as a strength.
The teachers communicate among themselves. (PAR-‐12113) CAP… on examine les besoins des élèves de l’école et on adresse des stratégies pour y remédier en développant des Parcours. (E-‐22213) Development of strong PLCs. The staff works really well together; there is no weak link. They all work together to learn about effective strategies and use a common language. (T-‐11321) Teachers’ knowledge and team approach… there is always robust conversation around how kids learn. (P-‐11331) I think we’re doing a good job with TCLP. We’re tracking the boys’ progress. In math we do a pre-‐assessment to see where the kid is at and then at the end of the term we do a post-‐assessment… we track it – this is where they were and this is their result – and then we come together and see their progress. (T-‐12443)
In particular, they referred to teacher teamwork and sharing in the context of formally organized collaboration structures and processes, such as Teaching and Learning Critical Pathways/parcours and/or Professional Learning Community/CAP meetings (see section 5.3.2 for explanation), and engagement in mandated team activities such as moderated marking, data analysis, lesson planning and collaborative inquiry.
Teachers did not spontaneously and uniformly emphasize school leadership as a strength in their schools. This is not to say that they did not appreciate and recognize principal leadership and support where it was present, particularly as it relates to the acquisition of

57
resources for teaching and learning. They were more likely to highlight professional assistance that they were receiving from teacher leaders and central office literacy and numeracy coaches than direct instructional support from principals. We examine the kinds of instructional leadership direction and support reported across schools elsewhere (Chapter 7).
Teachers and some principals in both high and low performing schools talked about the quality of instruction as an area of success in their schools. They emphasized teacher implementation of common instructional and assessment strategies in literacy and mathematics that increased the level of coherence in teaching and learning within and across grade levels.
Critical learning and thinking… in the junior division there is a focus on 3-‐part lessons. Primary is now also doing this and moving away from following textbook programs, trying to make the content that we choose for the kids to be meaningful and relevant to the world. (T-‐11111) Mise en œuvre le programme ‘Lire à deux’ programme PAL (Peer Assisted Learning)… avec un tableau de pistage dans la salle de travail pour démontre le progrès réel des lecteurs dès la maternelle à quatre différents temps de l’année. (E-‐22213) I think literacy has been a very successful goal. We’ve delivered the literacy program well. I see that walking around the building and seeing from room to room… it’s nice to see the data to reflect on it. (T-‐12233) Méthode AIM (MAI) qui favorise le développement de la langue accompagné de gestes. Cette méthode développe de façon efficace le vocabulaire des jeunes enfants de quatre ans et les parents sont impressionnés du succès de cette méthode. Ils sont encouragés de poursuivre à la maison et l’intégrer dans leur quotidien. (E-‐22314) We do a good job of making sure all our initiatives from the Board are being applied in the classroom, for example, the use of word walls and guided reading. (T-‐12443)
Teachers characterized these strategies as “best practices” in terms of their reputed impact on student learning (e.g., Guided Reading, word walls, Directed Reading Assessments, 3 part math lessons, anchor charts, graphic organizers). Across schools, teachers stressed the data-‐informed and targeted (specific objectives, specific students) nature of instructional decision-‐making by teachers working in teams. We did not detect obvious differences between high and low performing schools in how they described the quality of teaching as a strength, although we

58
examine the interview and survey data on teaching and learning across school in greater detail elsewhere in this report (Chapter 3).
Principals, teachers and parents in all groups of schools mentioned supporting students who needed additional help as an aspect of s school’s strengths.
Ont réussi bien à répondre aux besoins divers des élèves, à la différenciation. (E-‐22112) Almost every teacher runs a homework club, before or after school. (T-‐11111) Meeting the kids’ special needs is one of the school’s strengths. (PAR-‐11224) There is support for students. Teachers have students come in at recess and after school for homework clubs (on the teacher’s own time). (T-‐11321) One of the school’s strengths is “Reading Recovery” for struggling Grade 1s. (P-‐12443)
Respondents from all schools also mentioned helping students with special education needs. Finally, teachers and parents in all groups of schools tended to mention parent participation and involvement in schools…
Parents are very concerned about how their students do here and very respectful of the teachers. The rapport between teachers and parents is good and there is a lot of collaboration with parents and the parent council. The teacher collaboration is a big part of that. (T-‐11112) There is good participation from parents and grandparents. Lots of parents volunteer in the school... parents are all over the school all the time. (PAR-‐ 11224) Les parents sont satisfaits et plus engagés. (D-‐22314) We have four literacy nights per year which are well attended by parents (about 100) -‐ we always feed them. (T-‐ 11434)
…as well as that of the extended family and community members in general, although there were small differences between groups of schools that are mentioned in the following sections. 4.2.1 School Strengths in High Performing Schools

59
Principals and teachers in high performing schools cited the obvious high levels of student performance on EQAO literacy and numeracy assessments as a school strength, although they were also more likely to cite a broader range of academic strengths.
Help students so they can independently be good readers and writers and thinkers and understand the numbers system and how everything works. (T-‐12113) Working on higher level thinking…developing critical thinking skills, working on descriptive feedback. A lot more opportunities for students to demonstrate higher-‐order thinking skills… a lot more that there has been in the past. (T-‐11331)
Respondents from high performing schools were more likely than those in low performing schools to cite a school-‐wide emphasis on academic success as a key element of school climate.
…including student acquisition of higher order learning skills (e.g., inferencing, critical thinking, inquiry). We have a culture of work; the kids have it. For example, kids will stay an hour after school working. Staff stay and work with kids at lunch and after school. We talk about kids and teaching with each other; not a union shop where people won’t do this or that… We work cooperatively with our admin, give and take… and the kids try hard. (T-‐11321)
This factor is referred to in the school effectiveness literature as academic press.
Teachers’ collective professionalism was highlighted by teachers overall in the high performing schools.
… We have consistently high but reasonable expectations of our students so that we’re always challenging them and that we’re always kind of asking more of them. So I think that when you raise the bar for kids, as long as you’re always helping them, giving them the little steps that they need to achieve those things...so I think that our kids are challenged. (T-‐11111)
In addition, teachers and principals in high performing schools were more likely to emphasize their high expectations for students, as well as trying to ensure adequate supports were in place to help them meet those expectations.

60
4.2.2 School Strengths in Low Performing Schools
Principals, teachers and parents in low performing schools referred to EQAO assessment results in relation to perceived school strengths, but typically focused on general improvements in literacy and numeracy performance, rather than on explicit achievement levels.
We had really low marks in the past but EQAO is steadily going up. (PAR-‐11444) Student achievement is in the area of reading. (P-‐11242) L’école réussit bien en lecture. (E-‐22415)
Additionally, although principals and teachers in all the schools highlighted specific foci of academic success in their schools, in the low performing schools their comments were commonly limited to improvement in reading skills.
Teachers in low performing low SES schools emphasized their success in creating an orderly by comfortable environment (structures, routines) for student learning.
Routine and consistency… they know what to expect and when they come in if it’s after lunch they come in and sit down and are ready for shared reading … so predictability and routine makes them able to learn. (T-‐11432)
At the same time, they presented the creation and sustainability of a positive climate for learning as an ongoing challenge in their schools because of the characteristics of the students served.
In addition to the teamwork dimensions of teacher professionalism previously mentioned, teachers and principals in low performing schools were more likely to cite high levels of teacher commitment and mutual support as a strength in their schools.
We have a close-‐knit group of teachers and we collaborate so the students would benefit from that. We talk about students who are coming and leaving; we collaborate in hallways, classrooms, staff room… Sometimes my friend who teaches kindergarten who has training in smart boards and I don’t know as much… so we will go to the principal and say is there time for training and 99.9% of the time it is doable… so whatever a particular teacher has training in will collaborate with each other. (T-‐11432)
While our data do not suggest that teacher commitment is stronger in low performing than in high performing schools, the fact that teachers and principals in these schools cite it as a

61
strength may reflect their perception of the student learning challenges they face in these schools.
Principals and teachers in lower performing schools more frequently mentioned their school’s participation in externally driven school improvement initiatives as sources of school quality. They mentioned their participation in the Ministry of Education’s Turnaround Schools and OFIP/PICO programs (Ontario Focused Intervention Partnership/Partenariat d’interventions ciblées de l’Ontario), enactment of district mandated Teaching Learning Critical Pathways/parcours processes (see section 5.3.2) and inter-‐school collaborative action research projects focused on math.
We’re addressing needs through CLIP and pathways. (T-‐11241) Turnaround gave us the confidence: yeah we really know what we’re doing. (T-‐11432) Nous avons été une école PICO puis une École au Milieu. On s’est dit que nos élèves sont aussi capables d’apprendre que les élèves d’ailleurs. Nous avons beaucoup de défis et on travaille donc à la mise en œuvre des situations et des stratégies de lecture de façon plus articulée. (D-‐22415)
Involvement in Ministry/school district interventions such as OFIP/PICO were characterized in positive terms as a strength, not as something punitive or to be ashamed of due to low performance.
With regards to at-‐risk students, principals and teachers in low performing schools were the only ones to mention areas such as Early Childhood Education, student attendance as well as nutritional, social and emotional assistance for students as areas of strength in school performance and services.
Finally, in terms of parent and community involvement, within the low performing schools, there were slight differences between SES groups. School respondents and parents of schools of higher SES lower performing schools, especially the parents, were more likely to mention parents volunteering, participating and generally being involved. Low SES schools, on the other hand, were more likely to mention programs for families and parents (such as literacy night or ESL classes) and school-‐parent relationships and communication. Parent involvement across all categories of schools is examined in-‐depth in Chapter 6.
4.3 School Challenges Education stakeholders in the study spoke about the particular challenges to improvement and success in their schools. Overall, their comments about challenges to success clustered around

62
the following five areas: (1) student learning, curriculum and instruction, (2) student and community characteristics, (3) school staff and leadership, (4) school capacity and resources and (5) parental involvement. Within these domains, there were several challenges that were similar across schools as well as challenges that more often emphasized in high or low performing schools. While participants identified several factors as challenges in response to our interview questions, in many cases principals, teachers and parents also explained how these challenges were being addressed in positive ways by the school. The respondents also often explained in what ways they themselves were contributing to overcome challenges. In sum, challenges are not necessarily viewed as excuses by school participants this study. Stakeholders in all categories of schools mentioned the challenge of moving beyond a narrow focus on basic academic skills toward improving student learning in all areas along with improving their general development.
The academic is strong but the social skills are lacking… students are introverted and not connected. We’re getting better but still working on that. (T-‐11112) L’enseignement religieux est souvent laissé de côté pour donner place à d’autres matières. (E-‐22112) The balance of student achievement, academics and the immediate health and safety needs of the students. (P-‐11322) I’ve been here long enough to see the thrust change and the balance is lost… we used to have science and technology and home economics and wood shop. What happened to the whole idea of looking at that in training the kids? We seem to have gone overboard on the academics. (T-‐11434)
Participants voiced concerns about the primary focus on literacy and numeracy proficiency, and their perceptions of the relative neglect of other areas of the curriculum (e.g., arts, religion). In French language schools and French Immersion schools, principals, teachers and parents identified the need to improve students’ basic competency in French (especially oral language) as a particular challenge in their contexts (Le grand défi est de faire parler les élèves en français. E-‐22213).
Teachers and principals in all categories of schools also identified ongoing instructional challenges to improvement and continued success.
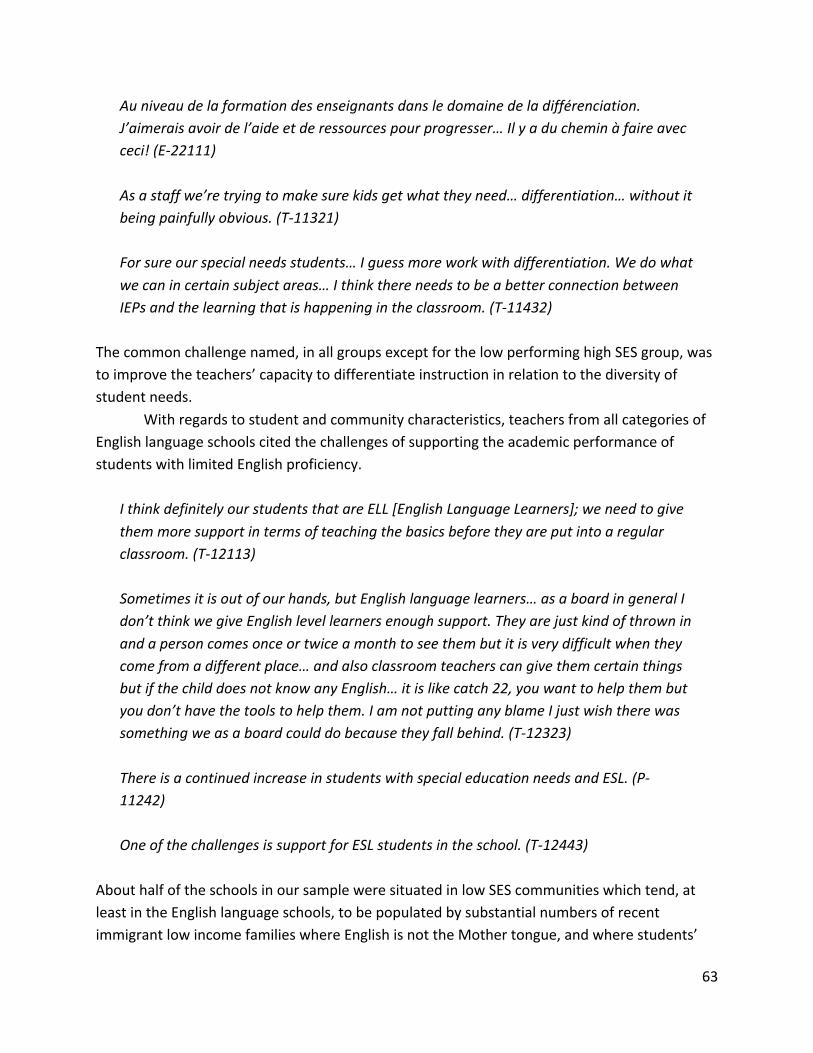
63
Au niveau de la formation des enseignants dans le domaine de la différenciation. J’aimerais avoir de l’aide et de ressources pour progresser… Il y a du chemin à faire avec ceci! (E-‐22111) As a staff we’re trying to make sure kids get what they need… differentiation… without it being painfully obvious. (T-‐11321) For sure our special needs students… I guess more work with differentiation. We do what we can in certain subject areas… I think there needs to be a better connection between IEPs and the learning that is happening in the classroom. (T-‐11432)
The common challenge named, in all groups except for the low performing high SES group, was to improve the teachers’ capacity to differentiate instruction in relation to the diversity of student needs.
With regards to student and community characteristics, teachers from all categories of English language schools cited the challenges of supporting the academic performance of students with limited English proficiency.
I think definitely our students that are ELL [English Language Learners]; we need to give them more support in terms of teaching the basics before they are put into a regular classroom. (T-‐12113) Sometimes it is out of our hands, but English language learners… as a board in general I don’t think we give English level learners enough support. They are just kind of thrown in and a person comes once or twice a month to see them but it is very difficult when they come from a different place… and also classroom teachers can give them certain things but if the child does not know any English… it is like catch 22, you want to help them but you don’t have the tools to help them. I am not putting any blame I just wish there was something we as a board could do because they fall behind. (T-‐12323) There is a continued increase in students with special education needs and ESL. (P-‐11242) One of the challenges is support for ESL students in the school. (T-‐12443)
About half of the schools in our sample were situated in low SES communities which tend, at least in the English language schools, to be populated by substantial numbers of recent immigrant low income families where English is not the Mother tongue, and where students’

64
prior educational experiences may disadvantage them initially in Ontario schools. Several upper SES school communities in our study, however, were also experiencing demographic changes that resulted in increasing numbers of ESL students, though not necessarily from the families at the lower end of the socio-‐economic spectrum. Learning to accommodate the needs of growing numbers of ESL students was a more recent challenge, and posed a threat to sustaining current levels of high performance on EQAO assessments. Diversity in French language proficiency levels of students in the French language system is common, regardless of school SES, since many students come from families where English is spoken at home and because students often live their lives predominantly in English outside of school. This factor was highly stressed as a challenge in these schools.
School personnel in both high and low performing schools mentioned the perceived challenge of not having enough support staff (special education and ESL specialists, resource teachers, librarians, education assistants, etc.).
We don’t have a lot of educational assistant support here… We do still have students who have profound needs… I feel we need more support in the classroom, even maybe canvassing for more volunteer support for education or coop students. (T-‐11112) Sometimes I wish I had more one-‐on-‐one time or support… when I’ve done that the results are better. (T-‐11322) There are students in higher grades having a hard time coping in the classroom and they are having a hard time with the teacher allocation and EA [educational assistants] cutbacks meeting their needs, and they are not getting the help they need because they do not have enough EAs and Spec Ed [special education] teachers. (T-‐11242) Lack of people and resources to address special education needs… we have some support for behavior… but the volume of need here is so great that there’s not enough staff to address the needs. (T-‐11434)
The felt need for more support staff was more frequently stated by low performing schools, as mentioned below.
School leadership issues were mentioned as a challenge by teachers and principals in a few schools, although this was much less frequently mentioned than other challenges. The most common issue was leadership succession, and sometimes because the current principal’s leadership style differed from that of their predecessors.
The succession planning is one of the challenges. (P-‐11322)

65
Les enseignants doivent s’adapter à la nouvelle direction… nouvelles approches. (E-‐22112) Transition in leadership… (P-‐11432)
As described in more detail in Chapter 5 of this report, teachers in several cases reported that the previous principal was a more active instructional leader, whereas in others teachers claimed that the current principal was more active in that sense (e.g., visiting classrooms, facilitating and participating in teacher teamwork activities).
Principals, teachers and parents in all schools mentioned issues related to their school’s financial and resource capacity as challenges.
Ressources en enseignement de la lecture (semblable à la ressource mathématiques… un peu, beaucoup, à la folie) ressource prête à utiliser avec textes variés selon le curriculum et une large sélection d’exemples. (E-‐22111) Les budgets… nos capacités d’achat sont limitées; la technologie est dispendieuse. (D-‐22314) Resources for all subject areas are school’s biggest challenge… the public part of the school started in 1980 and still needs to catch up… They’ve just purchased current and relevant guided reading resources for grades 1-‐3 and the junior and intermediate levels have just been ordered. School population is growing. (T-‐11241) Our school doesn’t have the funds for technology that other schools fundraise for… we only have seven smart boards and our parents are not able to manage a strong fundraising program. (T-‐11434)
Resource challenges mentioned in all groups of schools were class size and the perceived need for additional resources such as instructional material, books and technological equipment.
Principals, teachers and parents in all groups mentioned challenges related to parental involvement, although this was more frequently stated in the low SES schools.
We have been trying to get parents involved… we hosted a parent literacy info night to try to get parents more involved in learning about the components of literacy so they can get involved at home. We’ve have been doing echo reading and trying to get parents doing that as well. It doesn’t always need to be math or literacy just getting involved in

66
their learning, so we have been working on their community involvement, but we think there is work to be done still… trying to be flexible to student needs and find things that are interesting to the students. (T-‐11242) I think the parental involvement is huge… the lack of parental involvement. We have about five six parents come and help out and do that kind of thing but very few that really actively get involved in what my child is doing, asking to support them or do reading with them. (T-‐11444) Parent academic support is sometimes a challenge… parents are very willing but sometimes language is a problem and math presents a problem. (T-‐12323) L’absence des parents au foyer parfois à cause d’un emploi au loin. (PAR-‐22415)
Teachers in low SES schools talked about challenges particular to their school communities related to poverty or culture (e.g., nutrition, student mobility, low levels of parent education, attitudes towards schooling, cultural traditions of non-‐intervention in school matters). These factors contributed to concerns about parental involvement, including support for student learning at home, getting children to school regularly and parent participation in school activities. Although some of these schools expressed pride in the results of proactive efforts to involve parents through programs like Literacy Nights and Books for Breakfast, teachers and principals identified parental involvement as an ongoing challenge and focus of attention. Findings concerning parental involvement are considered in greater detail in Chapter 6 of this report. 4.3.1 School Challenges in High Performing Schools With regards to student learning, teachers in high performing schools were more likely to highlight the challenges of differentiating instruction to meet the needs of high performing and gifted students than their colleagues in low performing schools.
Probably more emphasis on gifted students… we talk about low-‐achieving students but for gifted we need more of a school-‐wide initiative, more strategies, more resources and know-‐how of what to do – knowing what else can we do… We hear that from parents; they feel that there’s not enough of a focus on that as well. We do have a lot of gifted students and we could really push and help those students excel to the next level. (T-‐11112)

67
It was also only schools in this category that mentioned the challenge of helping students achieve higher order learning goals.
In high performing schools, principals and teachers complained about insufficient school-‐based time for teachers’ collaborative work and professional development (in addition to contractually defined individual preparation time). It may be that these schools, because of their overall results, have had less access to targeted resources from their Boards or the Ministry for teamwork and professional learning.
Time for teachers for professional development… (P-‐11112) I would like more professional development and support… I want to ensure I’m helping students meet their learning and development needs… things change so quickly. (T-‐11322)
In addition to teamwork and professional development, school staff in high performing low SES schools emphasized the wish to receive more support, for example, guidance related to how they could further support their own students.
In terms of resources, educators from the high performing high SES group talked about enrolment pressures associated with academic success, and the perceived impact on class size (Junior and Intermediate divisions) and space.
Large junior classes… there is a cap on numbers in primary grades. Also, the school’s reputation results in families moving into area or not moving away. (P-‐11111) Too many initiatives are being rolled out too quickly—all good, but not sustainable… Time to teach the curriculum with all the interruptions to the program. (T-‐11321)
Schools from the high performing low SES group, on the other hand as illustrated in the quote above, were more likely to mention the challenge of the large number of initiatives coupled with limited time and resources. 4.3.2 School Challenges in Low Performing Schools With regards to student learning, principals, teachers and parents from low performing schools tended to highlight the challenge of improving their EQAO assessment results. Additionally, respondents from the low performing low SES schools placed a great deal of emphasis on the need for improvement of students’ basic reading, writing and mathematics skills.

68
To improve their marks on government assessments. (PAR-‐12233) We are talking a lot about making connections to everything but we are not talking about the skills… we are talking about problem solving and strategies but they can’t add, we are talking about writing exciting stories but they can’t write. (T-‐11434) Honestly I think the differentiated part of it, I didn’t have it… they were in groups but it wasn’t differentiated. So with this I can put them in groups and have them in different assignments at different times… (T-‐11444)
In low performing low SES schools, as illustrated in the quote above, teachers spoke of the difficulties of differentiating instruction to meet the needs of comparatively larger numbers of academically struggling students in their schools, often compounded by linguistic and social diversity.
In terms of student and community characteristics, principals, teachers and parents from low performing schools were more likely to mention student absences and transiency as challenges than respondents from the high performing schools.
Transient population so kids come to us with huge gaps in their learning… Absences... try to get kids caught up, how do you get those gaps filled? Our kids don’t know how to advocate… for example, I’ve been away from school, what have I missed? (T-‐11434) One thing we need to work on is attendance issues and lateness… it seems to be quite frequent especially our school which is mixed in terms of socio-‐economic status. (T-‐12443)
School personnel from high performing low SES schools tended to emphasize student’s lack of prior knowledge and language barriers, whereas their counterparts in the low performing low SES schools were more likely to communicate perceived challenges associated with parent and family characteristics (poverty, parent attitudes towards education and schools, parent employment and single parent families).
Students come to school without prior knowledge, enriching experiences… teachers work hard to provide authentic experiences during school time. (T-‐11331) Parents have poor perceptions of their experiences in school… a lot of parents don’t value education and think of it as “us against them”…poor work ethic…poor role models at home. (T-‐11444)

69
Furthermore, teachers in low performing low SES schools were more likely to highlight school climate challenges related to their perceptions of low student engagement in learning, low sense of student community, social skills and behavioural issues and irregular attendance.
4.4 School Success Factors We asked principals, teachers and parents to identify what they regarded as key circumstances that influence the quality of student learning and other dimensions of success in the work of their schools. While their responses echoed in some respects what was said about the definition of school success, as well as school strengths and challenges described in the preceding sections, here they were communicating their views on the major determinants of student and school success. Overall, teachers, principals and parents attributed school success to seven factors: (1) teachers’ collective professionalism; (2) the purposefulness and quality of instruction; (3) the creation of a positive learning climate; (4) parental involvement; (5) leadership direction and support; (6) student/family characteristics; and (7) the availability of school and classroom level student support services. There were differences among schools in the priority or emphasis given to different school success factors. Not surprisingly, teachers in lower SES schools were more likely to call attention to student characteristics that negatively affect student engagement and success and which are associated with poverty and related at risk circumstances. These include nutrition and other health care issues, poor attendance and stressful family circumstances, sometimes compounded by recent immigration and the learning challenges associated with learning English and lack of familiarity with the Canadian context embedded in the curriculum. Teachers in these schools emphasized the importance of school and classroom level support services to aid them in addressing these multiple dimensions of student needs. These included educational aides in the classroom, direct assistance from specialized resource personnel (e.g., Reading Recovery teachers, speech pathologists, Learning Support Teachers) employed by the school board and external assistance from community agencies (e.g., Family Support Counselors, school nutrition and after-‐school programs). Teachers in these schools talked about these kinds of services as essential to create the conditions for all students’ learning. The greatest consensus across stakeholder groups and schools about factors influencing student and school success centered on teachers’ collective professionalism. While teacher teamwork was not as deeply institutionalized in teachers’ work in some schools, teachers in all schools emphasized the positive influence of teachers working together in teams and with the administration towards common goals for student learning. They highlighted multiple dimensions of collective professionalism, including shared goals; commitment to students and their learning; mutual engagement in ongoing improvement through inquiry, reflection and

70
innovation (taking risks); professional trust; high expectations for all students’ learning; and consensus on key goals and preferred practices to accomplish those goals. We explore findings about teacher collaboration in greater detail in Chapter 5. Teachers in all schools attributed student success partly to the quality of instruction. There were some differences in the attributes of instruction emphasized by teachers in higher and lower performing schools. In the higher performing schools teachers emphasized the purposeful and targeted nature of instruction, grounded in teacher analysis of student assessment data and differentiated according to identified gaps in student learning (literacy, numeracy). While teachers in low performing schools were also using assessment data to inform and differentiate instruction (as explored in greater detail in Chapters 3 and 5), they talked more about their efforts to make curriculum content relevant to and building upon students’ prior knowledge, and about helping students experience academic success in incremental steps. Because of the overall higher levels of proficient student performance in high performing schools, it may be that teachers are able to be more precise in focusing attention on specific struggling students. Whereas in low performing schools teachers may be more prone to emphasize instructional strategies that address identified gaps in student learning more generally across the school and they may be more attuned to evidence of progress than to attainment of key performance benchmarks. Teachers across schools highlighted teacher consensus and commitment to the implementation of common teaching strategies that contributed to greater coherence and coordination in student learning within and across grades. Teachers in French language schools, both high and low performing, were particularly likely to signal their use of best practices in literacy and numeracy, that is, specific teaching methods known to yield improvements in EQAO test scores. Teachers in some lower performing schools cited a perceived lack of consensus and coherence in teaching practices as hindering the quality and improvement of learning in their schools. Leadership and support from principals and other change facilitators were cited by teachers and parents in many of the low performing schools as a key factor influencing student and school success, including both French and English settings. Leadership support was less commonly or strongly emphasized in higher performing schools as a key school success factor, except in the French language schools. Teachers referred to direction and support from principals for goal setting and improvement, acquisition of resources and arranging in-‐service assistance. They also emphasized the contributions of external inputs from their Boards and the Ministry such as Turnaround School resources and professional learning activities, assistance from literacy and numeracy coaches and mandated school improvement structures and process (Teaching and Learning Critical Pathways/Parcours, Collaborative Inquiry projects). We examine leadership for school improvement in greater depth in Chapters 5 and 7. School personnel and parents emphasized the contributions of a positive learning climate in their schools to school success, though as previously noted staff in some schools felt
71
they faced greater challenges to creating and sustaining that climate. They highlighted multiple dimensions and indicators of school climate, including the creation of a safe and secure environment for students and their learning (e.g., taking risks, positive behaviour); high levels of student engagement in learning and school activities; and positive teacher-‐student and student-‐student relations. Teachers in higher SES schools were more likely to report that they had “good” students and that disruptive behaviour was less a problem than it might be elsewhere. In some schools (not particular to any category) school personnel and parents cited the impact of school-‐wide positive behaviour programs. Teachers in lower performing schools had more to say about the importance of teacher caring and about building students’ self-‐esteem as persons and as learners. They did not emphasize the academic dimensions of school climate (e.g., high expectations, academic press) as commonly as colleagues in high performing schools. Perhaps the most significant conclusion from our analysis of teacher and principal accounts of key factors influencing student and school success is that school personnel do not simply attribute student achievement to the personal and family characteristics of students. While acknowledging the reality and influence of these factors, they emphasize the effects on student success of teachers working together on identifying and addressing the instructional, as well as the social and emotional, needs of students in their schools. Furthermore, they give explicit credit to the use of common high yield instructional strategies across the school, and to the implementation of continuous assessment processes to identify and track student learning. Any differences noted between higher and lower performing schools were matters of degree.

72
Chapter 5 -‐ School Improvement Processes
5.0 Introduction
In chapter 4 we examined principals’, teachers’ and parents’ views about the meaning of “school success”, their perceptions of the strengths and challenges to success in their schools, and their beliefs about the major influences and determinants of school success. In this chapter we look more concretely at what school personnel do to improve the quality of teaching and learning in their schools. We report our findings about school improvement goals, school improvement strategies, teachers’ professional learning and collaboration, the uses of data to inform instructional decision-‐making at the school and classroom levels and monitoring of teaching and learning by principals. Findings about the leadership of principals and others contributing to leadership in their schools are embedded in the discussions of each of these topics. In Chapter 7, the concluding chapter of this report, we present an integrated overview of the findings about school leadership and include the teacher survey data related to school leadership.
5.1 School Goals
5.1.1 School Goals: Teacher Survey The teacher survey included four school goal items. Teachers were asked to indicate, on a six point scale ranging from 1 “completely disagree” to 6 “completely agree”, their level of agreement with four statements related to school goals. The first item asked teachers whether they agreed that the teachers in their school shared clear specific goals and targets for desired student learning. The second asked whether, in their schools, they thought school improvement decisions and actions were closely aligned with the school’s goals for student learning. The third asked whether teachers agreed that decisions about school improvement goals were influenced by data on student performance in their schools. Finally, the fourth item inquired as to whether teachers had the resources to meet the goals for student learning.

73
Table 5.1 School Goals 1. Teachers share clear specific goals and targets for desired student learning. 2. School improvement decisions and actions are closely aligned with the school’s goals for student learning.
3. Decisions about school improvement goals are influenced by data on student performance. 4. Teachers have the resources to meet the goals for student learning.
High Performing
Schools Low Performing
Schools Effect Size
M SD M SD d Goal 1 5.06* 0.76 4.78 1.04 0.31 Goal 2 5.22 0.69 5.13 0.87 0.11 Goal 3 5.49* 0.65 5.28 0.75 0.30 Goal 4 4.90* 0.87 4.43 1.41 0.40 Scale: 1 – completely disagree to 6 – completely agree * Significantly higher mean, p < 0.05
Overall, teachers in high performing schools more highly agreed that their schools
reflected the proposed statements shown in Table 5.1 than teachers in low performing schools. Although significant differences between high and low performing schools were observed with regards to answers Goals 1, 3 and 4, the effect sizes for Goals 1 and 3 were small. Notwithstanding these small effect sizes, interview data presented in this chapter also indicate comparatively greater clarity about school goals for student learning and more systematic use of data on student performance for goal setting in high performing schools as compared to low performing schools. Teachers in high performing schools also agreed more than teachers in the low performing schools that they have the resources to meet the goals for student learning (medium effect size). There was no difference with regards to “school improvement decisions and actions are closely aligned with the school’s goals for student learning”.
5.1.2 School Goals: Teacher and Principal Interviews We asked principals and teachers to identify the major directions or foci for improvement in their school. They mentioned school goals related to the following seven broads themes: (1) academic success (basic skills acquisition, progress, EQAO results), (2) higher order learning (critical thinking, problem solving, learning skills), (3) individual academic growth of all students (potential, progress, “at risk” students), (4) whole child development (citizenship, values, prep

74
for futures, francité), (5) positive learning climate (students feeling happy, safe, engaged), (6) professional culture (data use, teamwork, expertise) and (7) community involvement (resources, communication, participation).
With regards to student learning, the reported goals for improvement in all schools center on literacy and numeracy, with varying degrees of specificity and depth.
…literacy and math is our focus. (T-‐11111) La lecture au niveau de l’école et l’inférence, plus spécifiquement en 3e et 6e. (E-‐22111) We have our SIP and it is focusing on literacy and developing a deeper understanding of texts and we’ve been doing that through identifying an author’s message and making connections to that message and do kids understand that. (T-‐11242) Literacy… we want to improve literacy. (T-‐11321) We go through what we look at in literacy and numeracy and look at our strengths and weaknesses and then make our school improvement plan. (T-‐12443)
Although literacy (reading, writing) is essential to learning in all subject areas, it seems noteworthy that no principals or teachers identified curriculum goals for improvement outside of the provincial and board emphasis on literacy and numeracy (i.e., no science, no social studies, no arts). That said, it is true that Ministry curriculum expectations as measured on EQAO assessments do aspire to higher order learning skills beyond basic reading comprehension, grammatical writing and mathematics computation and that these higher order skills are applicable broadly across curriculum areas. Being able to make inferences, to justify one’s interpretations of a text or problem and to solve complex problems, for example, are not subject-‐specific cognitive skills. Nonetheless, provincial curriculum and accountability policies associated with literacy and numeracy clearly framed the goals for school improvement identified by principals and teachers.
Even within the parameters of provincial curriculum expectations for literacy and numeracy, the school goals for improvement identified by principals and teachers were restricted to a comparatively narrow spectrum. The primary emphasis in literacy, for example, was on reading and writing skills. Oral language development was only named as a focus of improvement in French language and French Immersion schools.
We also know that reading is the basis of everything so we put a big focus on reading, even our math program is very language based, so reading strategies in our school have

75
become very important so that is a big focus, reading, reading, reading, reading. (T-‐12323) Nos cibles cette année sont surtout l’écriture, la lecture qui est toujours à travailler, et les maths, car il y a eu un laisser aller dans ce domaine. (D-‐22213) The second one [goal] was oral – we are French Immersion and not speaking enough French in terms of oral communication. (T-‐11112)
While Ontario curriculum goals for media literacy may be taught in the schools, no one identified it as a school focus. For numeracy, talk about school goals was commonly directed towards improving students’ mathematical problem solving skills, not just their basic computational skills.
School goals for improvement in student learning were strongly influenced by school board priorities for improvement, which themselves were grounded in analyses of EQAO assessment scores at the board level. Principals and teachers in many of the schools, for example, reported that their goals reflected board level shifts in emphasis from literacy to numeracy, or vice versa.
L’accent a été mis sur la numératie cette année au niveau du Conseil parce qu’ils s’étaient beaucoup concentrés sur la littératie auparavant. (E-‐22112) Numeracy is a current board emphasis. It is an area where scores need to be improved. Utilizing board provided resources and resource personnel are happening. Currently, the 3 part math lesson is being worked on. The school has purchased manipulatives for teaching. (P-‐12233) Literacy has been a huge school board and provincial emphasis for several years. In spite of new initiatives, literacy must receive continual stress because of the particular needs of these students. (P-‐12323)
They also spoke about more explicit directions for improvement from their boards within the parameters of literacy and numeracy, such as developing student skills to distinguish fiction from non-‐fiction texts or to use problem solving strategies in mathematics, or to implement teaching methods associated with literacy and numeracy instruction (see below).

76
I think one of the district-‐wide goals we do focus on non-‐fiction text and I think students need to recognize there is a difference between fiction and non-‐fiction and navigate through it. (T-‐11112)
In addition to academic goals for improvement, principals and teachers in several schools reported that their school goals included a focus on character development (e.g., social skills).
Also character development, appropriate social skills and how to react to a situation that it isn’t going their way… breaking it down and how to take a step back and voice their opinion why they don’t like something rather than showing aggression or getting really angry. (T-‐11434)
Since the Ministry has mandated all school boards and schools to implement character education programs, this goal is practically understood as a response to external direction, rather than as something unique to particular schools or categories of schools.
We noted similarities across schools in school-‐based goals for student learning. For example, school personnel frequently mentioned improving student abilities to make inferences, to use problem solving strategies, to make connections between texts and other knowledge, to respond to open-‐ended questions and/or to link writing with reading and mathematics problem solving.
As a school our School Improvement Plan (SIP)’s our big goal was inferencing – finding the “big idea”. (T-‐11112) Utiliser un vocabulaire plus riche dans ses textes et faire des liens entre ses textes et son vécu. (E-‐22221) Right now it is reading comprehension because of our EQAO scores. We are working on meta-‐cognition and synthesizing, gathering new information and incorporating it with what they already know. (T-‐12323) The board highlights areas of focus and schools extend them in School Improvement Plan. For example, in the area of Numeracy, developing and applying problem solving strategies and conducting investigations to help deepen understanding. (P-‐12443)
These similarities across schools may reflect common weaknesses in student responses to EQAO assessment questions across the province. Thus, while based on school specific analysis
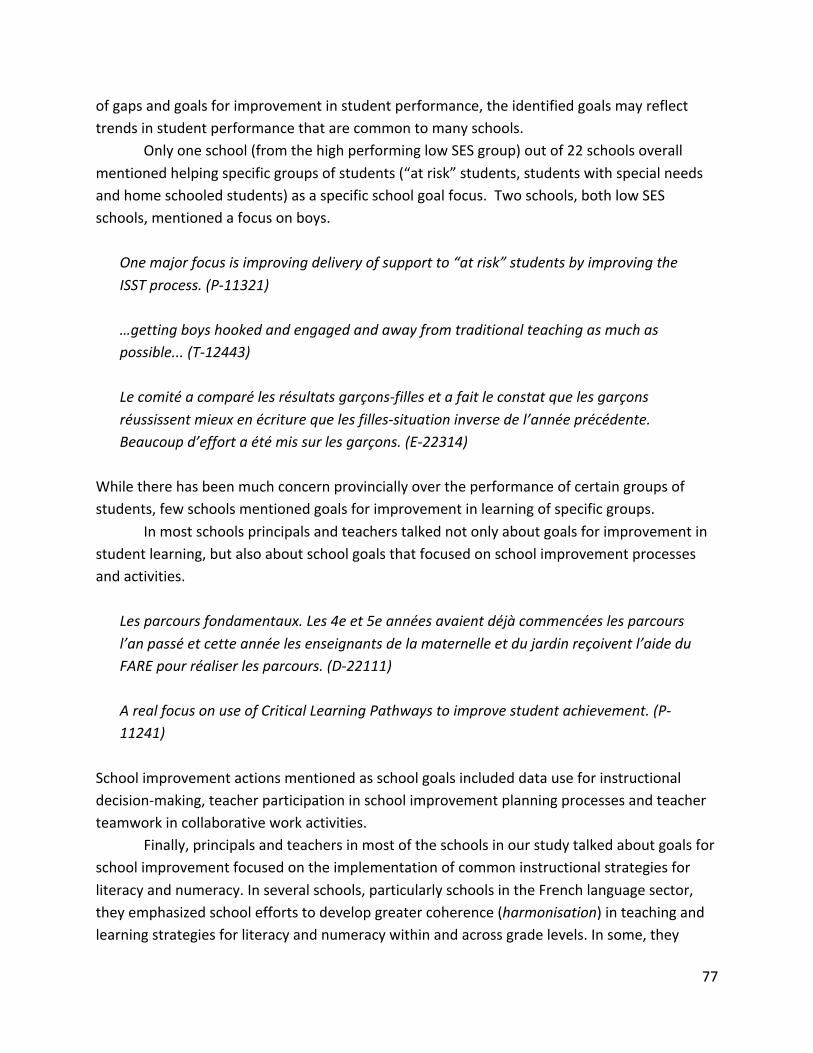
77
of gaps and goals for improvement in student performance, the identified goals may reflect trends in student performance that are common to many schools.
Only one school (from the high performing low SES group) out of 22 schools overall mentioned helping specific groups of students (“at risk” students, students with special needs and home schooled students) as a specific school goal focus. Two schools, both low SES schools, mentioned a focus on boys.
One major focus is improving delivery of support to “at risk” students by improving the ISST process. (P-‐11321) …getting boys hooked and engaged and away from traditional teaching as much as possible... (T-‐12443) Le comité a comparé les résultats garçons-‐filles et a fait le constat que les garçons réussissent mieux en écriture que les filles-‐situation inverse de l’année précédente. Beaucoup d’effort a été mis sur les garçons. (E-‐22314)
While there has been much concern provincially over the performance of certain groups of students, few schools mentioned goals for improvement in learning of specific groups.
In most schools principals and teachers talked not only about goals for improvement in student learning, but also about school goals that focused on school improvement processes and activities.
Les parcours fondamentaux. Les 4e et 5e années avaient déjà commencées les parcours l’an passé et cette année les enseignants de la maternelle et du jardin reçoivent l’aide du FARE pour réaliser les parcours. (D-‐22111) A real focus on use of Critical Learning Pathways to improve student achievement. (P-‐11241)
School improvement actions mentioned as school goals included data use for instructional decision-‐making, teacher participation in school improvement planning processes and teacher teamwork in collaborative work activities.
Finally, principals and teachers in most of the schools in our study talked about goals for school improvement focused on the implementation of common instructional strategies for literacy and numeracy. In several schools, particularly schools in the French language sector, they emphasized school efforts to develop greater coherence (harmonisation) in teaching and learning strategies for literacy and numeracy within and across grade levels. In some, they
78
named particular approaches (e.g., Balanced Literacy and Gradual Release of Responsibility, collaborative inquiry) or specific instructional strategies (e.g. Guided Reading, 3 Part Math, the APE process for accountable learning – Answer, Proof, Extend).
L’école et le Conseil ont beaucoup misé sur l’harmonisation des stratégies de lecture. (E-‐22111) Now we’re working on math as our SIP. We’ve been working on the 3-‐part math lesson and we’ve been talking about learning math through problem solving – to improve their reflection and reading the question and understanding what it’s asking and the discovering through doing rather than us teaching and them answering. (T-‐11322) All the teachers are teaching the same way and we’re implementing APEs and problem solving in math… making connections so they can make those text connections – not just through APEs – but showing what they’re reading. (T-‐12443)
The emphasis on standardization and coordination of instructional practices, and the adoption and implementation of strategies promoted as “best practices” by the Literacy and Numeracy Secretariat in collaboration with the school boards is common across the schools. Using our survey and interview data, we explored the findings about teaching practices in more detail in Chapter 3. 5.1.2.1 School Goals in High Performing Schools While there were many more similarities across schools than differences, there are certain trends in school goals identified by principals and teachers that seemed more common in high performing schools. For example, although the identification of higher order learning skills as a focus for school improvement was not unique to high performing schools, it was more commonly mentioned in these schools than others. While schools in general did not refer directly to improving EQAO scores as a goal, in a few high performing schools, teachers and principals stated that the school’s efforts were not limited to increasing the number of students scoring at the Level 3 proficiency standard, but also increasing the number of students that reach the Level 4 standard of competence in their learning.
I would say that ensuring that those students are not quite at the level 3 or 4 are brought to those levels. (T-‐12113)

79
La priorité: le projet au niveau du conseil scolaire d’amener les élèves du niveau 3 à 4. (E-‐22324)
Data use for instructional decision-‐making at the school and classroom levels was common in all schools…
Using assessment for learning, collecting data and “letting that data drive your instruction”. (T-‐11331)
…however, getting better at the use of EQAO assessment results and other data to set school goals and to diagnose and monitor student learning at the classroom level was identified as a goal mainly in higher performing schools, especially the high performing high SES schools. Teachers associated the emphasis on greater or improved data use with the implementation of district reviews of their school performance, the introduction of Pathway/parcours structures and processes (see section 5.3.2 on teacher collaboration) and the leadership of new principals.
With regards to naming specific instructional strategies as goals for improvement, while in low performing schools half the time it was the principals that mentioned the strategies, in high performing schools it was mostly the teachers that mentioned them.
Descriptive feedback, Accountable talk, Success criteria and 3-‐part lessons. (T-‐11331) We are all working on the gradual release of responsibility. (T-‐12323)
In addition, there were more mentions overall of instructional approaches and strategies from teachers in the high performing low SES group than in other categories of schools. 5.1.2.2 School Goals in Low Performing Schools There was a high tendency in all schools to focus on literacy and numeracy as school goals for improvement. However, improvement in writing was reported as a focus for improvement in literacy, in addition to reading skills, mainly among low performing schools.
I told my kids in the fall our goal for learning was to have more depth and detail in our writing because that is what they struggle with; they are very to the point and nothing extra. (T-‐11224) Writing is still a focus… See references to writing on the walls of the building; even on artwork there is a written description of the art. (P-‐11434)

80
The reasons for this pattern were not self-‐evident in the school interview data.
In lower performing schools principals and teachers talked frequently about improving the quality of teacher teamwork in school and classroom improvement processes as a school goal, whereas in high performing schools they talked more about improving their use of data as a goal related to skill in the enactment of school improvement processes and activities.
In the low performing schools, principals were much more likely than their teachers to identify the implementation of specific instructional strategies as school goals. Additionally, across the low performing schools there were differences in pedagogically related goals between the low and high SES groups of schools. The identification of higher order learning skills as a focus was more frequent in low performing high SES schools. In three of the six low performing high SES schools teachers talked about helping students make connections as part of the goals for improving literacy. This difference was striking in comparison with the low performing low SES schools, where there was rarely any mention of higher order learning skills as a goal.
Principals and teachers did not normally specify quantitative targets for improvement with regards to EQAO assessment results. However, the principal of one low performing low SES school reported that the goal was a 5% overall gain in students scoring at Level 3 on EQAO tests (We are trying to improve our marks by 5% on EQAO for literacy. P-‐11444). Principals and teachers in the low performing low SES schools were more likely to talk about moving school performance closer to the provincial targets of 75% of students at Level 3 standard of competence in literacy and numeracy, while their counterparts in low performing high SES schools made no explicit mention of raising EQAO scores as a goal (although they did say that EQAO results influenced school goals). Finally, across the low performing schools, teachers were more likely to speak about lack of clarity in school goals. They mentioned that school goals had not been shared with them, that they were not involved in establishing school goals (or did not want to be) and other such statements.
I do recall I think picking out of some meetings we had using data and trying to determine the focus our previous focus with the last administration had a specific math focus, communication through math and then somewhere along the way it morphed into looking more specifically at communication. When we blended with the other school their focus was more with reading and I think the board decided we would focus on the writing -‐ I think administration made that decision to focus on writing. (T-‐11444) The school improvement plan has not been officially shared with the entire staff as far as I know. (T-‐12233)

81
The principal wrote the plan himself and then had a meeting a month afterwards where teachers had the opportunity to offer revisions… had the opportunity, but many teachers didn’t attend. The plan wasn’t brought up or talked about. It was shown to us once (maybe) and then it was just shelved. We didn’t look at it again. (T-‐11241) I’m not sure how it was decided as a focus… I was just told the focus at a division meeting. Our principal outlines what we are going to do in our classroom. (T-‐12443)
This pattern was unique to these schools as a group and was most notable in the low performing high SES schools.
5.2 School Improvement Strategies and Planning We asked principals and teachers to identify key actions enacted at the school level to mobilize, implement and support past and current school improvement efforts in their schools. Principals and teachers in all categories of schools highlighted the importance of (1) school improvement goal setting and planning, (2) student assessment data use, (3) instructionally-‐focused teacher collaboration, (4) implementation of school-‐wide instructional goals and strategies, (5) teacher professional development aligned to school improvement goals and plans and (6) instructional leadership support from school administrators and from both school and board level resource personnel. In addition, faculty in low SES schools (regardless of performance level) were more likely to talk about academic interventions to assist students identified as low performing or at risk in other ways and about school efforts to strengthen parental involvement and support for the school and their children’s learning. Many of these strategies overlap in the lives of principals and teachers. Data use, for example, occurs as part of school improvement planning, which often takes place in the context of teachers’ collaborative work activities, and which teachers regard as a form of professional learning facilitated by colleagues acting as instructional leaders. In the remainder of Chapter 5 we examine findings concerning school improvement planning, teacher collaboration, teacher development, data use and principal monitoring of teaching and learning leadership. Chapter 6 looks in-‐depth at parent involvement, and Chapter 7 synthesizes the school leadership findings. Although we present the findings for high and low performing schools separately, we note that many of the school improvement planning processes reported appear to be determined at the board level and may be shaped by school specific factors such as school size and principal leadership.

82
5.2.1 School Improvement Planning in High Performing Schools Principals and teachers in high performing schools spoke about the utility of school improvement planning processes as a vehicle for school-‐wide improvement. They emphasized four dimensions of school improvement planning: (1) consensus on school-‐wide goals for improvement in student learning; (2) use of student assessment data to identify precise areas and goals for improvement in student learning; (3) teacher participation in analyzing data to determine student learning needs and goals for improvement; and (4) the role of principals and other sources of leadership in facilitating planning processes and providing resources (e.g., PD, time) for teachers to engage in improvement planning. Teachers in most schools spoke about the establishment of precise school-‐wide goals for improvement in student learning through school improvement planning.
Previously identified three skills students are struggling with: 1) use of evidence to demonstrate knowledge (based on DRA, CASI and EQAO data), whole school focus; 2) LNS ‘APE’ format (answer, proof, explain); first term spent on ‘inferencing’; 3) this term looking at how the point of view shows us what’s being said...how it allows us to be more critical of what we’re doing. All these features apply to the whole school’s literacy program. (T-‐11111) We decided ‘inferring’ as our area to improve...That is school-‐wide. We’re doing in all grades and how to measure it through SMART goals. (T-‐11112) In terms of math, we as a team decided that the biggest problem was communication. So from 1-‐8 it is a goal and how you approach it in your division is up to you. (T-‐12113) We have literacy goals and we are all working on the gradual release of responsibility and the reading strategy we’re doing is summarizing and going in more depth with the synthesizing as well as point of view and then we have numeracy goals. (T-‐12323)
Durant les CAP – (4e,5e 6e ensemble) les enseignants se sont fixés l’objectif SMART d’améliorer l’écriture, la phrase, la ponctuation. C’est une décision d’école. (E-‐22314)
Principals and teachers in many high performing schools reported that their school improvement plans addressed goals defined system-‐wide at the board level (although adapted to student performance in their schools), as well as goals that emerged from school level analysis.
83
We align our plan with the board’s school improvement plan...Still allow enough flexibility based on the needs of our students and our community. (P-‐11322) We do CILM (Collaborative Inquiry) here – the board issues math questions for every single unit and there is a diagnostic and the post-‐assessment so we give it to the students before the unit and then after the unit to assess them on how they are have improved – we all do that – we sit together as a core group and discuss it first and then we get together as a whole staff. (T-‐12323) En mathématiques nous travaillons la résolution par problèmes. Nous faisons partie du projet d’enquête pédagogique en mathématiques. (P-‐22112)
The melding of system and school goals in school improvement planning is not limited to high performing schools as a group. It is a board specific and board-‐wide phenomenon. Principals and teachers in all the high performing schools described the use of EQAO and other assessment data as key sources of information for setting school goals.
Principal and curriculum chairs organized PD designed to ‘dissect data’ and to ‘look more closely’ at the results...E.g., they looked at raw score data – many Level 3 students were actually very close to being Level 4. They asked themselves ‘what do we need to do to move them into Level 4’...When they looked closely at raw scores, they saw that many students had difficulties with open response questions. (P-‐11111) Au niveau de la lecture—processus continue d’évaluation d’après les résultats des tests de l’OQRE et harmonisation des pratiques—discussion lors des réunions du personnel. (E-‐22111)
D’après les données de l’OQRE, il y avait des lacunes en écriture 6e (fluidité des phrases et conventions linguistiques). Nous nous sommes donc engagés à travailler sur un parcours fondamental sur chaque lacune. (E-‐22324)
We examine the uses of student assessment and related data about student characteristics for instructional goal setting more closely in section 5.4 of this report. Teachers in high performing schools communicated a sense that school improvement planning was less a yearly event than an ongoing process of collectively gathering and analyzing student performance data, setting long and short term goals for improvement and tracking student progress. School improvement plan goals provided a focus for data analysis and

84
collaboration, and inquiry about student learning through these processes contributed to the setting and revision of school goals.
We have time set aside as a division to see where our kids are struggling and how we can go about improving that...For example, in class we’re focusing on making connections...As a division we figure out what we can do to make connections when they are reading. That is based on what we see in the classroom...and if you check EQAO you can see they struggled with it there too. So we bring all of that together to decide what our goals are as a division and as a school. (T-‐12113) Les rencontres CAP et les résultats des Parcours permettent d’identifier les besoins. Un comité formé de la direction et de représentants du personnel discutent les priorités. Le personnel se rencontre à la fin de l’année pour établir les priorités pour l’année qui suit. (E-‐22212)
The process and experience of teacher involvement in school improvement goal setting did vary across the high performing schools, though this variation does not appear to be shaped by school SESand performance levels. Rather, school size and leadership seem to affect how principals organize and facilitate teacher input in school improvement decisions.
Previous year we did synthesizing…realized need for pre-‐teaching and to think about summarizing and how to teach it...then come back to synthesizing. Everything at this school done together…sit in staff room…most of our committees are everybody…12 staff and a principal...junior div meeting is 3 of us in hall (T-‐11321—small school) Leadership team, then scaffold, then division teams (develop next steps, clarity), then the entire staff. The administration starts with the leadership team, after discussion then presents ideas to the division leaders and support staff and then present and discuss with the entire staff and create a plan. Develop a timeline that we can all be excited about, don’t rush a process, collectively decided, by division, we publish this timeline. Then we align our plan with the board’s school improvement plan (P-‐11322—large school)
Principals in two high performing high SES schools reported that teacher participation and buy-‐in to school improvement planning was strengthened by engagement in the self-‐study process during recent District Reviews of their schools required by central administration.
Principal ‘led them’ through participation in area review and preparation for it...e.g., school self-‐assessment, looking at EQAO data...This process helped staff to ‘buy into

85
what needed to be improved’...They want to do the best they can. Most of our classrooms are already there. They know good teaching. It’s just a matter of leading them there. (P-‐11111) District Review Process...We saw our strengths. We’re already excited about what we’re going to do next year...School improvement process increasingly transparent, including staff. This is the first time the process has been a practical, deep meaning process for staff. (T-‐11112)
The District Review process reportedly prompted more deliberate and in-‐depth collective examination of student performance data for school goals than teachers in these schools said that they had experienced in the past. Finally, as described by principals and teachers in the high performing schools, their school improvement plans were not simply about setting goals for student learning. School improvement plans encompassed explicit strategies for improvement, including teacher collaboration and professional development activities, implementation of school-‐wide instructional programs and practices and arrangements for expert assistance and support.
Improvement plan is not just about kids improving, but also about teachers improving... Improvement Plan has incorporated everything...e.g., teacher collaboration, moderated marking...are embedded in School Improvement Plan. (P-‐11112)
In subsequent sections of this chapter we take a closer look at data use, teacher collaboration, teacher development and leadership support. But first, we provide a synthesis of what we heard and learned about school improvement planning as a strategy for improvement in the lower performing schools. 5.2.2 School Improvement Planning in Low Performing Schools Principals and teachers among the low performing schools spoke less frequently and directly about school improvement planning as a vehicle for school-‐wide improvement than their colleagues in the high performing schools. We are not suggesting that they are not engaged in school improvement planning, only that participation in those processes was not as commonly emphasized as a key strategy. Our analysis of the interview data yields some nuanced differences in comparison to the higher performing schools that we cautiously characterize as tendencies, rather than assert that they hold for all schools in this group. Principal and teacher reports of systematic data-‐informed and collective school improvement planning were notably

86
less evident among low performing high SES schools within the low performing school sample group. Principals and teachers in low performing schools tended to be less explicit than in the high performing schools about school goals for student learning. In two high SES low performing schools, for example, the faculty spoke generally about a focus on excellence.
On cherche l’excellence. On ne se contente pas du status quo. (D-‐22213) The staff is focused on excellence (T-‐12233)
In others they referred to aims for raising overall EQAO test results across the school or to broad focuses for improvement in student learning, particularly basic literacy skills.
We have taken steps to intervene and support kids who are on the cusp of moving to L3 from L2. We do see and can see a way to move those students forward from L2 to L3. (T-‐11432) Our school is focused on balanced literacy and we are trying to improve our marks by 5% on EQAO for literacy. The focus this year in primary has been writing...procedural writing. (T-‐11444) The school goal is to improve writing and make sure everyone is assessing similarly, so all teachers agree on what a particular level is. So we decide on an important area of writing that students need to work on. The first one was descriptive writing... The second one I forget...and now we are doing open responses. (T-‐11224)
Across the low performing French language schools teachers and principals uniformly reported school-‐wide goals for improving basic literacy skills in French.
La cible principale depuis l’an dernier: le vocabulaire et la compréhension en lecture. (D-‐22415) Continuer à renforcer positivement les élèves à parler en Français. C’est un effort continu qui ne pourra jamais arrêter. (E-‐22221)
In a few low performing schools, principals and teachers did describe more complex cognitive objectives for improvement in student learning in literacy and numeracy (e.g., inferencing, making connections, problem solving, defining the author’s message).

87
In comparison to high performing schools, faculty in low performing schools often talked more about what was being done to strengthen school improvement processes than about explicit student outcomes. The principal and/or teachers in seven of these eleven schools, for example, reported that opportunities for teachers to collaborate in Pathway/Parcours cycles and/or cross-‐school network meetings were recent or renewed focuses of attention in the last two years (see section 5.3.2 for greater detail).
Nous avons participés cette année au Carrefour fondamental en lecture et en écriture de la 1re à 7e année...L’an passé les profs avaient refusé de participer. Cette année quelques nouveaux membres du personnel voulaient participer. (D-‐22221) Learning cycles has been biggest bang for our buck...dialogue...cycle of inquiry... getting the teachers together at the table...What do you need? We grouped the whole division together and teachers could see what’s expected in the next grade. (P-‐11444) Last Friday I held a school leaders meeting. The topic of discussion for the school leaders....embed technology, collaboration to be continued next year, continue literacy efforts...want to look critically at the timetable so that there are better opportunities for collaboration. (P-‐11432)
Principals and teachers in low performing schools often highlighted instructional strategies and specific programs that they were implementing school-‐wide with the aim of improving student performance in reading, writing and mathematics (e.g., components of balanced literacy, the APE strategy, word walls, Borrow a Book reading program, 3 Part Math, “Apprendre à lire à deux”, OWA writing assessment, student-‐led conferencing). In sum, educators in the lower performing schools not uncommonly talked about school improvement goals more in terms of what they were doing to improve student learning, than in terms of precisely identified objectives for student learning. The appointment of new principals to schools was reported to be having a catalytic effect on the implementation of teacher collaboration strategies and on teacher follow-‐through with implementation of common instructional strategies school-‐wide in some schools. Teachers in the low performing schools, similar to their colleagues in high performing schools, talked about data-‐informed planning for improvement in student learning, particularly in the context of reported grade or division-‐level Pathway/Parcours or PLC/CAP teams (see section 5.3.2).
We did use EQAO data for our first TLCP. We looked at the scores in writing. (T-‐11444)

88
Review the data: EQAO, DRA, short-‐term focused intervention to target the students that are in need. (T-‐11434)
Teachers in the low performing high SES schools, however, described the utilization of EQAO and other assessment data for school goal setting in general and superficial terms.
Last year we looked a bit at the EQAO results and did a bit of a gap analysis and tried to account for the discrepancies. (T-‐11224) EQAO reports provide a snapshot of strengths and weaknesses that figure in school decisions. (T-‐12233) On regarde les évaluations et les résultats de nos élèves sur les tests de l’OQRE dans le but de déceler les positives et de cibler les lacunes pour y remédier. (E-‐22221)
We examine the uses of student assessment and related data about student characteristics for instructional goal setting more closely in section 5.4 of this chapter. The general impression across the low performing schools, however, is that principals and teachers have been less systematic and intensive in the analysis of EQAO and other student assessment data than their colleagues in the higher performing schools. School board level effects on school improvement plans and goals were reported in the low as well as in the higher performing schools. School personnel reported that their school improvement plans addressed goals defined system-‐wide at the board level (although adapted to student performance in their schools), as well as goals that emerged uniquely from school level analysis of needs.
Le plan de l’amélioration de l’école et celui du conseil scolaire ont des buts très précis, très pertinent à nos données. (E-‐22415) APES that is across the board...I think it’s board-‐wide. We get together for every unit and for APES as well about once a month...We meet as a school...Our principal would decide. (T-‐12443)
The blending of system and school goals in school improvement plans is a board-‐wide phenomenon and expectation. The principal and teachers from two low performing (one low and one high SES) school also reported that faculty engagement in school improvement planning was strengthened by the self-‐study process of a District Review of their school as required by central administration.

89
District review this year...We have specific ideas about focus and where we want to go this year. (T-‐11434) We had a board review the first year we amalgamated. They gave us specific feedback for what we could improve in our school. (T-‐11242)
The District Review process reportedly prompted more in-‐depth reflection on school goals than principals and teachers in these schools said that they had experienced in the past. District reviews are a periodic occurrence in all schools as required by Ministry policy, not just those struggling to achieve higher performance levels. Principals and teachers in the low performing schools were less likely to describe widespread participation of teachers in school level improvement planning, though they certainly talked about their involvement with short term planning in the context of Pathways/parcours or PLC/CAP teams (see section 5.3.2). In sum, we noted a tendency for school goals and plans across these schools to be set by principals and school improvement committees, taking into account board level priorities.
School leaders talk first, then present at staff meeting (P-‐11432) We had a team who sat down and looked through the results to see our areas of need and this helped form our school goals. (T-‐11444) Les priorités sont détermines en équipe-‐école au début de l’année scolaire selon les résultats des tests de l’OQRE, des tests diagnostiques et par observation. (E-‐22415)
Broader teacher participation was reported in the implementation of these plans in the context of grade and/or division level teams. By comparison, principals and teachers in the high performing schools were more likely to report that teacher collaboration in Pathway/parcours and PLC/CAP groups and activities was contributing, and not just responding, to school goals and plans. Again, we report this as a tendency. Exceptions exist for either group of schools and these appear to be more associated with school leadership and school size than performance. Finally, as described by principals and teachers in the low (as well as high) performing schools, school improvement plans were not simply about setting goals for student learning. The plans encompassed explicit strategies for improvement, including teacher collaboration and professional development, implementation of school-‐wide instructional programs and practices and arrangements for expert assistance. As previously noted, the faculty and parents in low performing schools, particularly the low SES schools,

90
were more likely to talk about interventions focused on students at risk academically, and about efforts to engage parents in supporting the school and their children’s learning. In following sections of this chapter we take a closer look at teacher collaboration, teacher development, teacher collaboration, data use and monitoring of teaching and learning.
5.3 Teacher Development and Collaboration School improvement literature suggests that teachers have the single greatest impact on student achievement among in-‐school factors. As such, the expectation that continued teacher development to improve teacher efficacy is integral to ensuring a school climate where student achievement is prioritized. As one principal in the study stated, "[The] improvement plan is not just about kids improving, but also about teachers improving" (P -‐ 11112). Teachers and principals were both asked in this study about the opportunities and supports that existed within their schools to support teacher development. Teachers were asked directly to describe and provide examples of professional learning experiences from the current school year that have had an impact on teaching and learning in their classrooms. Principals were asked to discuss the strategies that were employed in the school to support and develop teachers' individual and collective capacity to be effective teachers. 5.3.1 Teacher Development and Collaboration: Teacher Survey The teacher survey measured the strength of teacher agreement/disagreement about the extent to which professional learning activities available to teachers in their school were consistent with knowledge about the characteristics of effective learning on the job (e.g., shared and sustained focus, building on but challenging prior knowledge, learning with colleagues, linked to student learning data, aligned with organizational goals for improvement and adequately supported with time and resources).

91
Table 5.2 Professional learning activities In my school, professional development plans and activities … 1. occur in a series of activities that have a common focus. 2. build on teachers’ skills and beliefs about learning and teaching. 3. often challenge teachers’ skills and beliefs about learning and teaching. 4. involve teachers learning together to acquire new knowledge and skills in the school. 5. are informed by staff analysis of data about students’ academic performance. 6. are closely aligned to school goals and priorities for improvement in learning. 7. provide teachers with a variety of ways to learn new knowledge and acquire new skills. 8. are adequately supported with time for professional learning. 9. are adequately supported with resources for professional learning 10. involve school administrators as active learners with teachers.
High Performing
Schools Low Performing
Schools Effect Size
M SD M SD d PLAct1 4.87 0.89 4.86 0.86 0.01 PLAct 2 5.00 0.76 4.84 0.96 0.18 PLAct 3 4.54 0.97 4.39 1.06 0.15 PLAct 4 5.14 0.86 4.98 1.00 0.17 PLAct 5 4.89* 0.77 4.56 1.02 0.37 PLAct 6 5.01 0.83 4.90 1.01 0.12 PLAct7 4.82 0.99 4.84 0.96 -‐0.02 PLAct8 4.55 1.09 4.42 1.04 0.12 PLAct9 4.56 0.92 4.48 1.10 0.08 PlAct10 4.74 1.01 4.75 1.22 -‐0.01 Scale: 1 – completely disagree to 6 – completely agree *Significantly higher mean, p < 0.05
Teachers across the schools provided a positive image of professional learning activity in their schools. The only statistically significance variance between high and low achieving schools concerns the use of student performance data to inform professional development plans and activities. Teachers from the high achieving schools more strongly agree that this is common practice in their schools than teachers in the low achieving schools. The magnitude of this difference is small in terms of effect size, but it is consistent with other survey and interview

92
evidence of more systematic and institutionalized data use for school improvement related decision-‐making in high performing as compared to low performing schools. In the teacher survey, teachers were also asked how frequently they got new teaching ideas from a variety of sources (e.g., print and electronic media, school-‐based in-‐service activities, external in-‐service activities, teamwork with other teachers and self-‐directed learning). Although the magnitude of differences (effect sizes) was small, teachers in the high performing schools responded that they relied significantly more frequently on collaboration with colleagues for new instructional ideas than their colleagues in low achieving schools. Conversely, teachers in the low achieving schools reported more frequent reliance on personal problem solving and creativity. These findings (notwithstanding small effect sizes) are consistent with comparisons about teacher development presented in the principal and teacher interview findings that follow (5.3.2). Table 5.3 Professional learning sources How often do you get new teaching ideas from the following sources? 1. Print (magazines, books, websites, blogs, etc.) 2. Electronic resources (websites, blogs, networks, etc.) 3. In-‐School in-‐service activities (workshops, consultants, etc.) 4. External in-‐service activities (courses, workshops, etc.) 5. Self-‐directed problem solving and creativity 6. Collaborative work with other teachers
High Performing
Schools Low Performing
Schools Effect Size
M SD M SD d PLSour1 3.43 1.09 3.33 1.12 0.09 PLSour2 3.55 1.21 3.58 1.16 -‐0.03 PLSour3 2.91 1.14 3.01 1.13 -‐0.09 PLSour4 2.81 1.00 3.07* 1.04 -‐0.25 PLSour5 3.48 1.29 3.63 1.31 -‐0.12 PLSour6 3.72* 1.18 3.46 1.14 0.22 Scale: 1=never, 2 = 1-‐2 times, 3 = 3-‐5 times, 4 = 6-‐9 times, 5 = 10 or more *Significantly higher mean, p < 0.05
The teacher survey also included a set of eight items that measured the strength of “professional community” in the schools. Teachers were asked how frequently they engaged in

93
various kinds of professional interaction and collaboration with colleagues about student learning and teaching. As illustrated in the school interview data further on, teachers (and principals) describe teacher collaboration activities as key contexts for teachers’ ongoing professional learning. Hence, we report the survey “professional community” data here, and refer back to these findings as appropriate in our discussion of the interview data regarding teacher collaboration reported later in this report. The survey data suggest that teachers in all schools have positive perceptions of the strength of professional community in their schools. Exchanging suggestions for instructional materials and having conversations with colleagues about what helps students learn best are the most common forms of professional community activity. The two least frequent kinds of professional interaction reported are mutual classroom observation and giving direct feedback on one another’s teaching. The infrequency of peer observation of teaching is a consistent finding in the teacher collaboration and professional community literature since Little’s landmark article on teacher collegiality 30 years ago (Little, 1982). The only significant variation between high and low performing schools is the frequency of team planning of units and lessons, which is greater in high achieving schools. The effect size of this difference is small, but the finding is consistent with the prior finding that teachers in those schools say they learn the most from collaboration with colleagues.

94
Table 5.4 Professional community
In your school, how often in this school year have you… 1. had conversations with colleagues about what helps students learn best? 2. visited other classrooms or had other teachers visit your classroom to observe instruction? 3. received meaningful feedback on your teaching from colleagues in this school? 4. prepared unit or lesson plans together with colleagues? 5. exchanged suggestions for instructional materials with colleagues? 6. had conversations with colleagues in this school about how to solve classroom management
problems? 7. worked together with colleagues to interpret student assessment data? 8. made decisions together with other teachers about how to help specific students who are
not learning well?
High Performing
Schools Low Performing
Schools Effect Size
M SD M SD d PC1 3.93 1.17 3.8 1.15 0.11 PC2 2.08 1.19 2.23 1.18 -‐0.13 PC3 2.68 1.29 2.65 1.19 0.02 PC4 3.44* 1.34 3.11 1.37 0.24 PC5 4.03 1.10 3.90 1.15 0.12 PC6 3.59 1.21 3.60 1.21 -‐0.01 PC7 3.41 1.26 3.21 1.26 0.16 PC8 3.80 1.17 3.71 1.12 0.08 Scale: 1=never, 2 = 1-‐2 times, 3 = 3-‐5 times, 4 = 6-‐9 times, 5 = 10 or more *Significantly higher mean, p < 0.05
5.3.2 Teacher Development and Collaboration: Teacher and Principal Interviews A number of teacher development strategies were identified by study participants. Teachers and principals spoke about teacher learning through teamwork in various types of professional learning community contexts; individual participation in external professional development activities; teachers sharing ideas, resources and expertise; interaction with central office and in-‐school resource teachers; new teacher induction and support programs; multi-‐school network activities; and principal leadership for professional development in their interviews. Here we provide an overview of teacher development and collaboration opportunities that teachers and

95
principals identified across all categories of schools. As in the survey responses, the similarities in reported teacher learning and collaboration activity across schools are more impressive than the variability. We call attention to differences in teacher development activity between schools with different performance and SES profiles where evident. In broad terms teachers and principals in all schools distinguished school-‐based from external teacher learning opportunities and activities. School-‐based teacher learning activities typically involved teachers learning together and from one another, sometimes with assistance from outside helpers. External professional development activities encompassed a conventional menu of workshops and courses sponsored by the school boards and other providers (teacher federations, university-‐based Additional Qualification courses). Schools varied in the extent to which teachers described different sources and forms of ongoing professional learning internally and externally. This variation was more dependent on particular school and central office leadership than a distinguishing feature of either high or low performing schools as a group, or of schools serving different types of communities. Literacy and numeracy were the dominant foci of teacher professional learning activity reported in the interviews with school personnel across all schools. This was attributed to mandated priorities for improvement in student learning and teaching at the Ministry, school board and school levels, grounded in terms of student results as measured and reported on Primary and Junior EQAO assessments. Teachers and principals in a few schools also talked about support for technology integration into teaching and learning (e.g., laptops, smart boards), though this was idiosyncratic to particular schools. While there was variability across school groups as noted later, the overriding image of teachers’ professional learning activity in the Ontario elementary schools sampled for this study is one of collegial learning, not of individual learning. By that we mean teachers at the school level were learning together and from one another on common focuses of development. Little’s research on teacher-‐teacher collaboration as a form and context for ongoing professional development provides useful concepts for describing what we found. In her landmark investigation of norms of teacher collegiality and experimentation, Little (1982) described four critical practices of collegiality in schools characterized by high levels of ongoing teacher development: talk about instruction, shared learning, shared planning and mutual observation (the least common collegial practice). In a subsequent publication, Little (1987) identified a continuum of collaborative practices among teachers, ranging from scanning and telling (informal exchanging of ideas, anecdotes), providing help and assistance (mainly when asked), sharing of materials and teaching practices, and joint work where teachers collaboratively inquire, plan and/or teach together. Sharing and joint work are the more powerful forms of teacher collaboration and learning, and are consistent with the previously mentioned key collegial practices. The strong and pervasive emphasis on collegial professional development in Ontario schools has arisen and is being sustained by the creation of various

96
kinds of administratively structured opportunities, leadership and support for collegial work on improving student learning in literacy and numeracy. Nearly half of the teachers (n = 20/44)4 and half of the principals (n = 11/22) across all categories of schools indicated that sharing resources, knowledge, ideas and expertise among teachers is an important avenue for teacher development. This finding is consistent with the teacher survey results.
It's important [for teachers] to discuss and talk about where students should be or if they have had that student in the past and if something isn't working what you did to make it work -‐ talking to peers really helps -‐ that is where I get most of my help and direction. (T-‐12113) Le partage avec les enseignants d'un même niveau durant les journées pédagogiques sont très profitables. Elle a mis en pratique avec succès une stratégie de résolution de problèmes en maths utilisant l'enseignement explicite présenté lors d'une journée pédagogique. Le but est d'encourager toutes les stratégies possibles pour arriver à la bonne réponse. (E-‐22314) Primary teachers don’t meet regularly, just casual conversation...run our lessons by one another... nothing formal (T-‐11241) Our division is very supportive, the primary division and the junior division, the intermediates tend to be pretty separate but as a group we are very supportive and willing to help each other in any way. We spend our whole lives talk[ing] about how to do things or what to do, we stay after school or meet on weekends etc. to work on things. (T-‐11444)
Teacher sharing of ideas for teaching and learning can occur in multiple contexts: in informal daily conversations between teachers (often grade level partners); in grade level and division meetings; in scheduled professional teamwork activities and in school-‐wide faculty meetings. Thus, sharing is fundamentally a collegial norm not confined to a single context of practice. Teacher learning through teamwork by grade level or by division in formally constituted and periodically scheduled school and classroom improvement activities was described as a significant context and process for school-‐based teacher development in a majority of the schools (18/22) sampled. Within the English language sector, principals and teachers talked
4 In order to limit the length of teacher interviews, two of four teachers (one primary, one junior) in each school were asked about teacher development activities and two about teacher collaboration activities. Thus, the number of teacher interviews cited (44) is half the overall teacher interview sample (88) for each topic.

97
mainly about collaborative work and learning in Teaching Learning Critical Pathways-‐TLCPs (referred to as Learning Cycles or Critical Learning Instructional Pathways in some settings) (Literacy and Numeracy Secretariat, 2008; cf Fullan and Crevola, 2006). The TLCP structure and practice was originally introduced by the Ministry’s Literacy and Numeracy Secretariat through its special initiatives to turnaround the student performance low achieving schools (Turnaround Schools, Ontario Focused Intervention Partnership) in the mid-‐2000s. Schools whose performance improved as a result of the turnaround school initiatives were expected to carry on the TLCP practice after funding for release time and guidance from Ministry and board instructional specialist were no longer guaranteed. Eventually, school boards across the province began encouraging and supporting the extension of the practice to other schools. The practice and language of Professional Learning Community (PLC) meetings and activities popularized early in this decade appear to have been replaced in English language schools by the Pathways (though some teachers refer to Pathway teams and activities as PLCs).
Our general PD with us in our Pathways. Being able to come together as teachers and find common ground and identify what is a Level One, Two, Three and Four, doing moderated marking. That has been very helpful. (T-‐11111) TLCP on summarizing...main goal for this year...learning from colleagues. Having the day to learn about summarizing. “It’s always important to remind yourself how to go about teaching a particular strategy, because here at [school] we always share things…Learning from colleagues has been really important. (T-‐11321) With EQAO we are trying to make our assessments more consistent just like they do. So we decide on an important area of writing that students need to work on. The first one was descriptive writing. So we did a six week study on that with diagnostic, formative and summative. I did another one on persuasive writing and now we are doing open responses. We are coming together in more of a collaborative way. (T-‐11224) I would say the Learning Cycles did impact on certain part of it for sure. We met over the course of the year last year in literacy and this year it is math...in the division...the Learning Cycle we met as a group and we worked on various things and collaborated as a division on what we were going to work on. (T-‐11434)
In Pathway groups, teachers meet by grade or by division to identify explicit goals for improvement in student learning associated with EQAO literacy and numeracy results, to diagnose students’ baseline performance, to plan common instructional interventions, to design formative and summative assessments and to track and analyze student progress over a six to
98
eight week cycle. The focus for Pathway cycles is defined in school improvement plans, and typically reflects board priorities for improvement. The number of cycles varies across boards and schools, depending upon administrative decisions about when the meetings will occur (e.g., on Professional Activity Days, during separately scheduled Pathway meetings), and on what resources are committed to support this work (e.g., school time, supply teachers). Schools designated as recipients of the Ministry’s OFIP/PICO program that targets low performing schools get access to expert assistance and funding for release time for teachers to engage in Pathway cycles. Extra funding stops once their EQAO results reach satisfactory levels. Continuation of the Pathway cycles depends on local board support and on school leadership. Principals and teachers in some schools, as described below, talk about continuing this teacher teamwork in the context of regular grade and/or division meetings without the aid of additional funding and time. In the French language schools, teachers and principals consistently distinguish between scheduled in-‐school professional learning community CAP (communautés d'apprentissage professionnelles) meetings and grade or division team Pathway meetings known as parcours.
Les parcours pédagogiques ont débutés l’an passé et se poursuivent cette année. Plusieurs enseignants impliqués...Lors de réunion de CAP et de parcours on peut aussi voir les besoins de formation. (D-‐22314) ...La conseillère pédagogique vient aux CAP et aide avec les stratégies. (E-‐22314) Une réunion CAP à chaque deux semaines, bien organisée. (E-‐22111) Grand travail d’équipe—CAP—les professeurs planifient des parcours et des leçons ensemble. Leur porte est toujours ouverte et sont toujours prêts à partager. (E-‐22213) ½ journée de CAP entre cycles pour faire un alignement du curriculum—que les stratégies se suivent d’un niveau à l’autre. (E-‐22415)
CAP meetings were evidently an institutionalized form of teacher collaboration in Francophone schools prior to the introduction of the Pathway/parcours process by the Ministry’s Literacy and Numeracy Secretariat. As reflected in the interviews, CAP meetings are more frequent and are concerned with team analysis of student assessment data and setting school improvement goals. They may also be scenarios for in-‐service training. Parcours meetings are devoted to joint planning and intervention by grade or division teams over 6-‐8 week cycles in accordance with the Ministry’s TLCP model and expectations, and as an extension of directions for improvement in teaching and learning begun through CAP meetings.

99
Regardless of school performance and SES characteristics, teachers generally experienced Pathway/parcours and PLC/CAP activities as a form of on-‐going professional learning in their understanding of student performance and of effective instructional practices in concert with colleagues.
We focused a lot on literacy -‐ retells, non-‐fiction and fiction -‐ I hesitate to say that we're doing this really well, but we're doing really well with it, but it's probably not ideally where it should be...but there is a lot of dialogue about where it should go next...We've done literacy for a while and I feel more comfortable; it is overwhelming how much you don't know when you start. I feel like I've learned so much. (T-‐11322) In PLC meetings, [we] have been discussing and learning about 'co-‐creating success criteria with students', using 'high yield strategies', 'gradual release model', 'descriptive feedback'. (P-‐11241) The Learning Cycles have been great. When I first started teaching as a new teacher I was unsure about language. I thought there is no way I can get them to read and give them comprehension questions. So when we started Reading Learning Cycles it was great and I learned so much. I think I improved as a teacher. I’m more confident in teaching language than I was before. (T-‐11434) Les rencontres CAP sont souvent des discussions. Le travail de partage et de collaboration avec son collègue après les heures de classe est le plus profitable. (E-‐22213)
These structures and processes provide significant contexts for teacher sharing of knowledge and experiences, shared learning and joint work (analyzing student assessment data and progress, unit/lesson planning for shared goals) as described by Little (ibid). The focus of these activities is almost exclusively linked to literacy and numeracy related achievement goals and practices promoted as best practices or “high yield” instructional strategies, promoted by the Literacy and Numeracy Secretariat and school boards. The theme of developing a "common language" and consistency in instructional practice among faculty within schools often emerges in the comments about teacher sharing.
TLCPs help to develop a shared understanding: 'What are some of the high yield strategies that we can use in our classroom? What does effective instruction look like? What does differentiated instruction look like?'...Making sure that our assessment and evaluation is consistent. You know, I think that all of those things benefit the

100
kids...making [sure] that we've got consistency across classrooms and across grade is really, really key to the success of students. (T-‐11111)
Consistency in student evaluation processes and judgements is also prominent in the rhetoric around building a common language and understanding about student learning and performance. The prevalence of in-‐school collective professional learning experiences across all school categories was not limited to formal Pathway/parcours and PLC/CAP meetings and informal sharing. Teachers in some schools described collaboration about teaching and learning in periodic grade and division team meetings, similar to what they were doing in distinct Pathway/parcours meetings. As described further on, it appeared that the Pathway/parcours process in some school was being carried on mainly in the contexts of grade, team or whole school faculty meetings, rather than as a separately scheduled time and series of events during the work week and school year. This was happening in schools where designated funding for release time for that purpose was not currently provided by the board and/or Ministry. Principals and teachers commonly talked about the incorporation of professional learning activities into the agendas of school faculty meetings, including presentations by principals or by external experts (e.g., school board instructional coaches), opportunities for teachers who attended external professional development events to share their learning, and involvement in the analysis and discussion of school performance data. Teachers spoke about the importance of sharing what they learned from PD outside the school with colleagues. They indicated that they were "encouraged to go to learn and then use it and share it with others, don't just put in on the shelf" (T-‐11322) and to "be professionals that can teach each other" (T-‐11322). Principals played a key role in creating opportunities and expectations for this type of knowledge sharing by building time into faculty meetings or facilitating informal on-‐the-‐job events such as "lunch and learns" for teachers to present to their peers during lunch periods. Resource teachers were identified in comments about people who play a role in teachers' school-‐based professional development (collective and individual) across our school sample. The term 'resource teacher' was a broad term that encompassed both external and internal resource personnel. These included literacy and numeracy coaches (board-‐level serving multiple schools, or school-‐based assigned to specific school), traditional school resource teachers (e.g., special education, ESL), Reading Recovery teachers and division or grade team leaders. Participants from nearly two-‐thirds of the schools in the sample (n = 14/22) included resource teachers in their descriptions of the various supports and learning opportunities that have had an impact on their professional development.
Les enseignants consultent beaucoup le personnel ressources pour la modification de l'enseignement et des stratégies d'évaluation... Les deux enseignants ressources font du

101
modelage et outillent les enseignants... Je trouve des conseillères pédagogiques pour former les enseignants qui en ont besoin, pour venir dans les salles de classe. (D-‐22213) La conseillère pédagogique du conseil vient aider avec la planification des blocs d'intervention par niveaux. Les enseignants sont retirés de la classe pendant [une demie] journée pour ces planifications. La conseillère vient aussi en salle de classe faire du modelage au besoin. Elle est venue dans la classe de [nom d'enseignant] l'an dernier faire du modelage pour l'écriture. (E-‐22314) Absolutely our instructional coach -‐ she was assigned by our board -‐ she has been the piece that has brought it all together. She is in the classroom with us from K-‐8 and she works in all divisions with no preference. (T-‐11432) The Reading Recovery teacher… I go to her with any literacy question. She specialized in that… she works with kids so we can collaborate on the struggling kids so I can continue what she is doing in her classroom. (T-‐12443)
The involvement of external resource teachers in school-‐based professional learning activities is collective when resource personnel participate in, support and even provide leadership in meetings where teachers are engaged in joint work focused on understanding and improving student learning (e.g., TLCP/parcours, PLC/CAP). It is individual when they model and coach teachers in the use of expected instructional practices in the classroom, or assist in solving particular student learning problems. The presence and influence of resource teachers in teachers’ professional learning was evident in all categories of schools, though the identity of those helpers and in nature of that involvement varied as noted further on. Discussion of the influence of school board literacy and numeracy coaches was consistently reported in the French schools. It appears that collaborative work/learning between board resource personnel (des conseillères pédagogique) and classroom teachers is more formalized and entrenched in the daily practice of French language schools. Whilst board resource personnel are available in English language schools, it is more 'by school invitation' basis and left to the teacher/principal discretion. Our interview sample included a few teachers who were involved in the province’s New Teacher Induction Program (NTIP), either as beginning teachers or as their mentors. While NTIP activities are described as another form of school-‐based teacher learning, this is idiosyncratic to teacher turnover and recruitment in particular schools, and not associated with school performance or SES characteristics. Mention of NTIP activities was most prevalent in the French language schools, perhaps because teacher retention and turnover is a persistent issue in Francophone schools across the province.

102
Principals and teachers both referred to teacher participation in external professional development activities as a significant ongoing source of teacher learning. In over 75% of the schools sampled in this study (n = 17/22), teachers indicated that learning opportunities provided through external PD positively affected their daily practice. Professional learning activities provided by the school board outside of the school (e.g., workshops) were by far the most common examples of external PD named. Overall, teachers talked about participation individually or in small groups in workshops organized by school board professionals to introduce and support the use of common teaching and assessment strategies promoted by the Ministry’s Literacy and Numeracy Secretariat. This included both voluntary and mandatory professional learning activities and was not restricted to schools in particular categories.
The board provides a lot of literacy workshops...Guided and Shared Reading... Teachers can go to those if they want. (T-‐12113) Les journées pédagogiques systémiques sont données sur des thèmes suggérés par les enseignants. Ils en sortent avec des idées et du matériel concret. Auparavant, les journées étaient moins pratiques et les enseignants devaient développer le matériel par après...Le conseil mise beaucoup sur la numéracie cette année. (E-‐22314) The board provides good opportunities that are both voluntary and required, math workshops, DRA workshops...PD is good but there is a lot of time spent away from the classroom. There are incentives for taking free courses, which is great too if you get there early. (T-‐12233) Ateliers de formation offerts par le Conseil...ateliers sont plus profitables quand toute l'école participe -‐ des CAP peuvent être organisées pour travailler ce qui a été présenté durant l'atelier. Quand l'enseignant assiste seul à une formation, il doit se débrouiller par la suite pour l'intégrer dans son enseignement. (E-‐22415)
Teachers spoke less frequently about participation in professional learning activities that appeal to their personal professional interests, such as Professional Activity Day events where teachers select from a menu of workshops and presentations by board consultants and/or external sources (teacher federations, publishing houses), Additional Qualification courses and conferences. In sum, teachers’ external professional development was commonly oriented to Ministry, school board and school expectations and goals for professional practice. Despite the prominence of external PD in their comments, the relevance of these workshops varied, with teachers making statements such as, "sometimes it is useful and sometimes not" (T-‐12113), "[it's] hit and miss on how good they are" (T-‐11112), “journées pédagogique au niveau du Conseil sont

103
généralement une perte de temps” (E-‐22112). As described below, we noted variability between school performance groups in reported expectations that teachers taking part in external professional learning activities will share their learning with colleagues upon return to their school, and whether teachers were encouraged to attend individually or in small groups on behalf of their school. Principals and teachers in both high and low performing schools also referred to professional learning that was occurring through inter-‐school networks or hubs/carrefours. In most instances this was happening in conjunction with direction and support (funding, external expertise) through board participation in a Ministry of Education collaborative inquiry initiative (Literacy and Numeracy Secretariat, 2010). Clusters of elementary schools are partnered in a network. The principal and one or two teachers meet to define a common student learning focus, and to participate in professional learning activities related to this goal with board and/or Ministry professional staff. They plan a collaborative action research project to be carried out in all the network schools, and bring this goal and plan back to their home schools. The goals and follow-‐through activities may dovetail with school-‐based professional learning activities, such as the Pathway/parcours plans and sharing in staff meetings and other professional development events. Where this was happening, the broad focus of the collaborative inquiry network projects appeared to be decided at the board level, and then tailored through the inquiry process to the network school needs. 5.3.2.1 Teacher Development and Collaboration in High Performing Schools Overall, external PD, teacher sharing and teamwork and interaction with resource teachers were the most frequently cited sources and influences on teacher development in the high performing schools. Other strategies such as new teacher induction supports and multi-‐school networks were less commonly included in participant responses across this group of schools. External professional development activities were common sources of teacher learning cited by principals and teachers in the high performing schools (9/11). Comments often referred to teacher participation in board sponsored workshops focused on literacy and mathematics (6/11 schools) in keeping with local priorities for improvement. They also included reference to general in-‐service learning opportunities (workshops, courses) offered by the board and other external sources (e.g., teacher federations, Additional Qualifications courses) that appeal to individual growth interests.
There are literacy and math nights through our family of schools that we can go to if we choose, but they are usually on your own time outside of school. (T-‐11111)

104
It's so great when you do workshops. A math one right now. We've gone to different classrooms and watched different teachers -‐ we watch for a focus and we go and experiment with it. (T-‐11322) We've gone to in-‐services provided by the board after school that we can voluntarily sign up for...our board provides good opportunity to go out and develop professionally. (T-‐12113) Journées pédagogiques du conseil ciblées avec thèmes différents (4 par année) -‐ l'enseignant peut faire un choix selon les thèmes qui l'intéresse, par exemple, intégrer la technologie dans l'enseignement. C'est très motivant pour l'enseignant et lui redonne de l'énergie. (E-‐22324)
Participation in board sponsored external professional development activities after regular school hours was described as voluntary for teachers. For those focused on literacy and numeracy, however, school personnel were likely to refer to encouragement and incentives from principals (e.g., funding). In some (5/11) high performing schools, teachers and principals talked about groups of teachers attending external workshops together, sometimes with their principals, as though this were a change in practice.
There are a lot of PD opportunities that are offered throughout the year and the principal has taken a lot of people to a lot of them throughout the year. Usually people who are part of the leadership team. The last one (literacy focus) was very inspirational. I wish the whole class could have gone. (T-‐11111) Many workshops to do on your own and encouraged more to attend those workshops...There is release time and more opportunity for everyone to go, not just team leaders. In previous years the team leaders would go and summarize what they learned in staff meetings and handouts. This year there is more. All grade 4 math teachers can go. Release time is provided. The administrators are there too for the one I’m going to. It’s a three day workshop how to better implement high yield math skills in the classroom. I volunteered for that. (T-‐11112)
Some school principals (4/11) from high performing schools were described as supporting the personalized professional development interests of teachers, in addition to facilitating participation in external in-‐service activities associated with board and school literacy and numeracy goals. Sharing resources, ideas and expertise among teachers in high performing schools replicates the description of teacher sharing across all schools. Teacher learning through participation in more formally organized Pathway activities was highlighted in six of seven high

105
performing English language schools, whereas references to des CAP and des parcours were common across all three high performing French language schools.
Release time for divisions to come together to develop their Pathways and to do moderated marking... meet fairly consistently, e.g., every six weeks...dependent on where they are in their Pathway. (T-‐11111) This year there has been more release time to get together and work with our colleagues. For our SIP (School Improvement Plan) we had four release time blocks. After we had the goals to focus on we had release time again to figure out our pre-‐assessment and post-‐assessment for those goals... in the middle the explicit teaching. We talked about what we would use...division and grade teachers...what resources to use. Third release time to look at pre-‐assessment to know common language and were we consistent with the rubric we made and we leveled our marking. Altogether four blocks of release time to see what we learned or if we saw an improvement. Great professional learning to know others are thinking along the same lines. First time it ever happened in my career. (T-‐11112) Our third TLCP this year. We have eight weeks to do them. We try to do four a year...one per term. We have been focussing on communication for oral and for written. We have release time. Our principal gives us a whole afternoon to meet with her and our division. (T-‐12113) Division meetings...plan TLCPs. In-‐service PD during school time for critical Pathways. Administration provides time for grade team and division level meetings to free up a double block (80 minutes) for teachers to meet. (T-‐11331) A lot of that funding has been eliminated. One time we had a snow day so we organized putting classes together and created ways to have more time to work together. Using snow days for PD instead of a free day...Or they’ll take our recess for us to provide the extra time. (T-‐11322) Il y avait des rencontres CAP 2-‐3 fois par semaine dans le cadre du programme de redressement PICO mais ces rencontres n’ont pas lieu cette année par ce que l’école avait atteint leur but. Le programme était financé par le MEO. (E-‐22314)
The reported experiences with the Pathway/parcours process, administrative support for implementation (scheduling, coverage and funding) and sustainability of support varied across

106
the high performing schools. This variation was affected by the availability of funding from the Ministry and/or board to support the implementation of PLC/CAP and Pathway/parcours teamwork as a distinct process. It was also affected by school leadership willingness to facilitate that kind of professional teamwork in the absence of extra funding through creative scheduling and classroom coverage, and through the appropriation of traditional division and grade level meeting time for the implementation of Pathway/parcours activities. Reported reductions in special funding were limited to some low SES high performing schools that had formerly benefitted from the Ministry’s turnaround school initiatives and support (OFIP/PICO). Teacher sharing about student learning and instruction is administratively encouraged and supported in faculty and division/grade level meetings, or by creating shared planning time for grade level partners, not simply through formal Pathway/parcours or PLC/CAP meetings in the high performing schools. Often teachers’ joint work in these traditional team contexts was described as an extension of team decisions and plans initiated in more formally structured team events.
We do a lot of moderated marking and stuff through our Pathways and division meetings, and informally as well. We have similar teaching strategies and feel comfortable talking to each other about students’ work or activities or getting help from each other. We have division meetings to plan about three or four times in each Pathway, so about 12 times a year. (P-‐11111) Division meetings and work sessions: teachers learn from each other. (P-‐11321) Administration provides time for grade team and division level meetings to free up a double block for teachers to meet...sometimes entire afternoon...for job-‐embedded PD. Administrative covers themselves or arranges for supply teachers. (T-‐11331) Lors des réunions du personnel nous faisons le partage des pratiques réussies et des stratégies efficaces pour l’exploitation du matériel de manipulation. J’ai ajouté beaucoup de matériel en mathématiques. Il faut que les enseignantes sachent quoi faire avec ce matériel. (D-‐22112)
The infusion of professional learning activities into traditional teacher collaboration contexts may be more dependent upon individual school leadership beliefs and actions than on their performance status. Teachers from one high performing high SES school, for example, claimed that they had no shared planning time and no grade level division meetings other than those funded for Pathway work available to support implementation of school improvement plans. Although his teachers were implementing Pathways, another high performing high school

107
principal noted that they have had less access to external funding from the Ministry and from their boards for teacher teamwork (release time, supply coverage) in the form of Pathways/parcours than low performing schools. Principals in the high performing schools may, as a result, feel a greater need to encourage and support the incorporation of teacher sharing and learning into traditional team meeting contexts such as staff meetings and grade/division team meetings. Interactions with board resource teachers (literacy and numeracy coaches) to support teachers’ individual and/or collective professional learning did not feature prominently in the comments of teachers and principals in high performing schools except in French language schools. The involvement of board instructional coaches in Francophone schools appears to be a routine expectation and practice, regardless of a school’s reputation for and evidence of high performance.
L’enseignant accompagnateur vient une fois par semaine à l’école et agit comme enseignant ressource pour tous les élèves. Il a beaucoup aide avec les centres et an faisant du modelage. L’enseignant le contacte à l’avance pour lui dire quels sont ses besoins. Il aide aussi avec les parcours. (D-‐22112) La conseillère pédagogique du conseil vient aider avec les planifications des blocs d’interventions par niveaux. Les enseignants sont retirés de la classe pendant ½ journée pour ces planifications. La conseillère vient aussi en salle de classe faire du modelage au besoin (ex...L’écriture). Elle aide également les enseignants de 3 et 4 qui ont fait des parcours, des stratégies de lecture et d’écriture...part de tests diagnostique jusqu’à l’évaluation sommatifs. (E-‐22314) Partenariat avec la conseillère pédagogique : présence aux réunions, formation, appui et aide en salle de classe, suivi. (D-‐22324)
Among the high performing English schools, respondents did not mention collaboration with external instructional specialists from their boards in four of the eight schools. In others teachers reported that in-‐school assistance from board instructional coaches was available upon request, but there was little felt need to involve them. Some said that coaches were more active in the past.
Not so much. A few years ago there were a lot of literacy coaches coming in. But not really now. (T-‐12113)
108
Literacy coaches are available to the school, but she hasn’t had any need to contact them. They are available on demand, but need to invite. A few years earlier a board person modeled inferencing based on a specific invite. (T-‐11321) Math and literacy coaches visited at beginning of the year but she didn’t necessarily find them all that effective. They are assigned to a family of schools so they are very busy...Thinks they visit based on invitation. (T-‐11331)
We can only speculate on the differential use of central office instructional coaches in high performing English and French language schools. Because the French language school boards serve fewer schools, it may be that the services of board specialist teachers do not need to be rationalized as much as in the larger English school boards.
Teachers in one English and all French language schools also talked about teacher collaboration with in-‐school resource teachers in their classrooms (e.g., Special Education, ESL). This kind of collaboration was typically framed more in terms of the resource teacher directly assisting with the instruction of students with identified needs related to their specialization than it was in terms of teachers’ collaborative learning. The only mention of new teacher induction programs and supports was made in French language schools, perhaps because teacher retention and turnover was reported as a persistent issue in Francophone schools. None of the respondents in the six English language high performing schools explicitly mentioned new teacher induction programs as a teacher development strategy. Respondents from four high performing schools spoke about teacher development through multi-‐school initiatives. Although both English and French schools were represented, all comments from English language schools came from schools in the same school district. One teacher stated, "There are literacy and math nights through our family of schools that we can go to if we choose but they are usually on your own time outside of school" (T-‐11111). Availability, however, does not equal participation and it is unclear in the data the extent to which teachers in high performing schools are participating in multi-‐school network activities. A Francophone principal spoke about "[des] échanges avec d'autres écoles de même réalité" (D-‐22324), but without details about these exchanges. Overall, inter-‐school activities were not described as prominent teacher development strategies across the high performing schools. 5.3.2.2 Teacher Development and Collaboration in Low Performing Schools The interview data from principals and teachers in low performing schools do not convey a dramatically different pattern of teacher development and collaboration activity from the high performing schools. External professional development opportunities were the most widely

109
cited teacher development strategy in the low performing schools, regardless of school socioeconomic status. Most descriptions referred to a mix of required and voluntary board-‐sponsored professional development activities associated with expected literacy and numeracy practices, and often supported by incentives for teacher participation (e.g., supply coverage, funding and encouragement).
Board programs for new teachers are very good. (The principal) ensures training for new teachers and LTOs in such things as DRA and CASI. (P-‐11241) I’ve gone to a few PD workshops—a couple on literacy—one was on reading and two on math—one about closing the gap in Grade 6 and another one was a problem solving in math—so 5 or 6 this year. They were done on school time. There was a supply teacher provided for me. It was a district initiative and the principal said ‘You should go to this’. I wouldn’t have known about it otherwise. (T-‐11242) Journée pédagogique sur la numératie à l’automne...Journée pédagogique au mois d’avril sur l’écriture : référentiel de correction, la nouvelle grammaire. (E-‐22415)
As in the higher performing schools, principals and teachers distinguished between teacher participation in external professional learning activities driven by school and board priorities (for literacy and numeracy), and professional development linked to teachers’ personal interests.
The principal is trying to develop leadership throughout the school by supporting professional development offered by Board and also self-‐directed professional development. Encourages us to pursue our own passions and what we are interested in. (T-‐11241) The principals encourage our own independence and personal development I guess. There are two half days you can take and do whatever you want for PD, and they are very supportive of that and they have given some suggestions too for that. (T-‐11124) Meet with each teacher in September to assess where each individual is. Provide whatever support is needed to assist and develop each teacher (resources, personnel, in whatever area is looked at for growth) as a way of actualizing their growth plans. (P-‐12233)

110
He’s found ways to support you if you do come and support him. For instance, he sent me to a workshop in Phys Ed, which is something I love. He found money to do that. Not that I needed to go to a workshop to come to his events, but he just kind of gets that if you invest in him, he invests in you, and that hasn’t always been the case here. (T-‐11432) I have done some personal stuff through the Board workshops that I attended that were offered during non-‐school time—some different math programs that were introduced. We had a day release of self-‐directed PD. There were sessions offered by ETFO. I attended something on smart boards and something about science. We could choose based on our interest. It was new this year to choose what you want. (T-‐11434)
Comments about principal support for teachers’ personal professional learning interests figure prominently in the descriptions of teacher development in a majority of low performing schools (7/11), particularly in the low performing high SES schools (4/6). The emphasis across low performing schools on principal support for teachers’ personal learning goals, in addition to professional development for system and school improvement priorities, was more consistent than in the high performing schools (4/11). Our data do not suggest that teachers’ personal professional development is not a concern in the higher performing schools; however, in the balance between professional learning opportunities linked to personal and to system goals may favor the latter in the high performing schools. or linked to system goals. Perhaps teachers’ personal and system goals for improvement are more mutually reinforcing in high performing schools. Teachers and principals in a few low performing schools (3/11) talked about shifts towards principal support for teacher participation in external PD related to system priorities in small groups and expectations for returning teachers to share their learning in staff meeting contexts.
They go to board run workshops. Sending two people is better so they can talk. Individuals who went to workshops modeled strategies to staff at staff meetings. (P-‐11242) The reading conference...We were able to go...Six of us went...We don’t often have the opportunity or the funds. But that was spectacular for the presenters and the workshops they offered—really cross-‐curricular activities that you could do and focused on literacy. (T-‐11432) Ateliers de formation offerts par le Conseil. Ateliers sont plus profitables quand toute l’école participe. Des CAP peuvent être organisés pour travailler ce qui a été présenté durant l’atelier. Quand l’enseignant assiste seule à une formation il doit se débrouiller par la suite pour l’intégrer dans son enseignement. (E-‐22415)

111
Administrative support for collaborative external learning related to common goals for improvement is not universal and not unique to high or low performing schools as a group. It seems to be more dependent on individual principal leadership, though it probably reflects a general trend towards expectations and support for collegial work on school improvement at the school level. According to one principal “the collaboration piece sets the framework for professional development” (P-‐11432). Whether informally or formally organized, principals and teachers from all but one of the eleven low performing schools spoke about the importance of teachers sharing (resources, ideas and expertise) with each other as a valued source of teachers’ ongoing professional learning.
I guess because it is my first time in grade three I talk to the other grade three teachers and ask them what they are doing and how and whatnot...they are my grade partners and are helpful. (T-‐11224) The primary and junior division...As a group we are very supportive and willing to help each other in any way. We spend our whole lives talking about how to do things or what to do. We stay after school or meet on weekends etc. to work on things. (T-‐11444) ...and monthly staff meetings aside from division meetings -‐ we keep up to date with things going on at the school and best practices...keeping everyone in touch -‐ we do best practices... we use different ideas that work in the classroom. (T-‐12443) Le travail de partage et de collaboration avec son collègue après les heures de classe est le plus profitable. (E-‐22213) Beaucoup d'entraide entre collègues...Rencontre du personnel enseignant une fois par mois -‐ toujours un élément pédagogique à l'ordre du jour. (E-‐22415)
Teachers from three of five low performing low SES schools and two high SES schools, reported that their principals incorporated teacher sharing of new learning and promising practices into staff meeting agendas. According to the principals and teachers interviewed in low performing schools, teacher learning also occurred in the contexts of formally organized teacher teamwork activities -‐-‐ the Teaching Learning Critical Pathways/parcours cycles and in French language schools the PLC/CAP meetings. As previously noted the implementation of parcours cycles appeared to be happening

112
as an extension of goal setting and training activities associated with an established structure of CAP meetings in the French schools.
CAP-‐-‐on examine les besoins des élèves de l'école et on adresse des stratégies pour y remédier en développent des Parcours. (E-‐22213) Les formations offertes pour les Parcours peuvent être choisies selon les besoins et avec l’approbation de la directrice… Parcours a eu un gros impact sur son enseignement et sur l'apprentissage des élèves. (E-‐22221)
Principals and teachers from only two of the eight low performing English language schools talked explicitly about formally and systematically organized divisional or grade level Pathway meetings.
For our Learning Cycles we collaborate with teachers in our division or grade partners. The Learning Cycle is six weeks and we have done three of them. The Learning Cycles have been great. When I first started teaching I was unsure about language....So when we started Reading Learning Cycles it was great and I learned so much. (T-‐11434) The release time we have for TLCPs and also I know that the primary and junior divisions have division meetings so I sit down and talk to mine, but I only have one teacher and we plan what we are going to do for the next stop of the way. We don’t plan our lessons together but I know the primaries do a good job of that. (T-‐11444)
The two schools were from the same school board. The introduction of Pathways (or Learning Cycles) had been recently mandated, and was described as new in both schools. In one of those schools the teachers expressed uncertainty about the effectiveness of their work in Learning Cycles due to the absence of instructional leadership from administrators or board resource teachers. Teachers from another low performing low SES school in that board spoke candidly about the challenges of teamwork and learning associated with the recent experience of implementing Learning Cycles.
We did one where we planned a unit from start to finish in terms of balanced literacy being part of that and the big idea and the whole assessment piece –the anchor charts and rubrics. A lot of that stuff was fairly new to use because we had never done it. So many of our meetings we didn’t necessarily look forward to...And I think a lot of the staff felt like that this year. It was a new principal and everything was new. We were supposed to change everything about our teaching right away. (T-‐11444)

113
Teachers in three other low performing English language schools report teacher teamwork activities at the division/grade level that are consistent with descriptions of the Pathway process in other schools, though they did not refer to them specifically as Pathways or Cycles.
This year we were given money to work together. Like asking the two grade 3 teachers to get together to look at the math EQAO questions and what EQAO questions there were so we could create a lesson together and work together...We bring in supply teachers because we were given a grant this year to free teachers up for that kind of thing. (T-‐11432) This year they have been meeting in divisional groups. Professional development focus has been on critical literacy—inferencing, point of view. They plan together, assess, instruct, use success criteria, authentic culminating tasks. (T-‐11241)
The adoption and implementation of the Pathway process (however labelled) was also described in these schools as a recent innovation stimulated in part by funding from the board and by school leaders. The other three low performing English language schools reported gathering with colleagues at the school level to define shared foci for improvement in student learning as part of the School Improvement Plan and perhaps to get some professional development input concerning teaching and learning related to that focus. Organized teacher teamwork akin to the Pathway strategy, however, was not reported in those schools.
There is the SIP. There are some staff meetings where there’s specifically time set aside to collaborate on something. Like a math activity...a problem solving problem once to a math question. Or when the progress report came out we took one learning skill and we had to turn it into ‘I am’ or ‘I do’ statements to see what it looks like. Unless we go make it ourselves no one has outright set it up as any collaboration. (T-‐11242) I’m not in the TLCP group. They are the ones who set the goal for the school, like the school improvement team. Sometimes at lunch we talk or after school. We don’t have organized shared planning time. We talk during lunch and recess. We have division meetings too once a month. We would talk about work that a student did and how we would score it and what we would do. (T-‐12443)
Implementation of teacher teamwork and professional learning through Pathway/parcours activities across the low performing schools is less consistently practiced in comparison to the high performing schools. It is often described as a recent innovation and thus any impact on

114
student academic results school-‐wide would not likely have been evident on EQAO assessments as yet. One might expect that intervention and support from central office instructional coaches would be more evident across the low performing schools, but that was not the case. As with the high performing schools, the active support of board instructional resource teachers was more consistently highlighted in the low performing French language schools (2/3) than in the English language sector. Among the English schools, the principal and teachers in only one school (low SES) strongly affirmed the contributions of a board instructional coach to ongoing teacher development.
Le modelage et l'accompagnement par l'accompagnatrice pédagogique... Les enseignants consultent beaucoup le personnel ressource pour la modification de l'enseignement et des stratégies d'évaluation...Les deux enseignants ressources font du modelage et outillent les enseignants. [Le directeur] trouve que des conseillères pédagogiques pour former les enseignants qui en ont besoin, pour venir dans les salles de classes, par exemple, pour la gestion des comportements, etc. (D -‐ 22213) Lead en littératie et numératie appui et fait du modelage en salle de classe. (E-‐22415) Absolutely our instructional coach. She was assigned by our board. She has been the piece that has brought it all together. She is in the classroom with us from K-‐8 and she works in all divisions with no preference. So I would say she has had a big role in fostering that collaborative spirit in the school. She comes to staff meetings. We’re one of four schools that she’s with. (T-‐11432)
Respondents from one low performing school described literacy coach input as a recent event. In another they bemoaned the absence of external guidance for implementation of Learning Cycles.
We had someone in...a head literacy coach, but I can’t think where they were from. They took us through some different sessions on how to provide feedback to kids and how to bump up work. (T-‐11434) Other schools really know what they are doing because they had a literacy coach come in and here it’s a job we have to do to get through the Learning Cycles. (T-‐11224)
These schools were from the same board. Given the Ministry of Education’s investment in the creation of literacy and numeracy coach positions to support changes and improvements in

115
classroom practice, we were surprised that we did not hear more about the active presence of people in this resource teacher role in the low performing schools, overall. Board level arrangements and principal leadership appeared to govern access to instructional coaches. In lieu of or in addition to external resource teacher assistance, teachers from several low performing schools highlighted in-‐classroom assistance and support from in-‐school teacher resource teachers (e.g., reading specialists, special education teachers).
The Reading Recovery teacher...I go to her with any literacy question. (T-‐12443) Our resource staff working in classrooms as the new model this year... rather than just withdrawing individual students....The Learning Resource teacher can model strategies and good teaching to the teachers. (P-‐11444)
In other schools, especially the French language schools, teacher collaboration in the classroom with school-‐based resource teachers was described more in terms of the assistance those teachers provide to designated students than in terms of a context or process for teacher learning. Principals or teachers from eight low performing schools mentioned teacher participation in collaborative inquiry projects with neighboring schools in networks or “hubs/carrefours”. These are collaborative action research projects in which groups of teachers and in some cases principals get together to set common objectives for improvement in student learning, plan and implement common interventions, and examine the results together. Select teachers take part in the external meetings and may share and involve their colleagues back at the school.
This year we had a collaborative inquiry where we come together with our best practices with all the sister schools...I had to pick two boys because boys is a focus in our school and we had to videotape them in how they perform orally...Based on a reading they have to answer different questions. We came together and we were able to see how the boys are performing from Kindergarten, Grade 1 and Grade 2 ...the Kindergarten teacher, myself, the Grade 1-‐2 teacher, the Grade 2 teacher, the Reading Recovery teacher and the librarian just in this school. There were 7-‐8 schools involved and we watched all the kids on the smartboard so we could compare how our kids are against other kids. It was a workshop we did. There were three collaborative inquiries this year...all focused on boys. It’s a Board initiative. (T-‐12443) Getting more confidence in math literacy and getting more tools and strategies through the math task force has been great. The principal thought that would be helpful for me. We have been working on developing three part lesson plans. You work on it at your

116
school and get student samples and they you go back and debrief and co-‐plan with your group. (T-‐11224) The past two years they have been involved in Schools in the Middle where their school and three or four other schools get together who get less funding and a literacy coach provides ideas and ways to collaborate with each other. It would be great if the board could give them more money to meet with other schools and see what other people are doing and get more literacy coaching. (T-‐11242) Networking—most effective tool—taking Learning Cycles beyond the building to sister schools that have similar clientele to us. (P-‐11434) We had time for networking. We met with Junior teachers from three other schools at the same level as us and we got to bring some of our assignments and the rubrics we used and we focused on feedback and got ideas from other people. (T-‐11444) Nous avons participés cette année au Carrefour fondamental en lecture et en écriture de la 1re à la 6e année, à des temps différents. L’an passé les profs avaient refusé de participer. Cette année quelques nouveaux membres du personnel voulaient participer. C’est très positif. Cela a amené l’harmonisation des pratiques. Les profs voient les bénéfices. (D-‐22211) Les enseignants de 5e participent à l’Enquête Collaborative—une formation de 8 jours pour enseigner des stratégies de mathématiques. (E-‐22213) L’année dernière les enseignant d’un même niveau des écoles avoisinantes du conseil se sont rencontrés en “Carrefour” avec l’appui de la conseillère pédagogique pour planifier une intervention ciblée pour mettre en application dans les classes. La conseillère pédagogique est venue observer dans les différentes classes et les enseignant se sont rencontrés à nouveau en groupe-‐écoles pour discuter des résultats. (E-‐22415)
These are school board initiatives, with support from the Ministry, intended to promote more school to school development and sharing of promising ideas and practices. While in principle they are not limited to schools sharing particular performance or socioeconomic characteristics, reference to participation in networked learning and inquiry initiatives was essentially limited in our sample to schools in the low performing group. We can only speculate on reasons for that difference in comparison to high performing schools. It may be that central office administrators and principals believe that teachers and principals in lower performing schools

117
have a greater need to collaborate with colleagues from other schools in order to gain additional ideas and strategies for effective ways to strengthen their students’ academic performance.
5.4 Data Use 5.4.1 Data Use: Teacher Survey The teacher survey included a three item scale that sought to measure the overall use of student performance data in school improvement related decision making (school goals, PD plans and activities and change in instructional programs). Teachers in all schools reported relatively high levels of agreement on the uses of student data for these purposes; however, the levels of agreement were significantly higher for high performing schools. The magnitude of these differences (the effect size measure) was small, but the comparative difference was consistent across the three items. The survey also contained two items that asked teachers about the frequency with which they collaborated with colleagues on interpretation of student assessment data, and how often their principals encouraged data use for instructional planning at the classroom level. These questions did not yield any significant differences across categories of schools. Teachers in high and low performing schools reported 3 to 5 times during the year to both items with similar standard deviations, which suggests that variability in these actions is more idiosyncratic to particular schools than to categories of schools grouped by performance levels or by student SES characteristics.

118
Table 5.5 Data Use
1. Decisions about school improvement goals are influenced by data on student performance.
2. PD plans and activities are informed by staff analysis of data about students’ academic performance.
3. Data on student performance and progress drives changes in instructional programs.
4. How often in the school year have you worked together with colleagues to interpret student assessment data?
5. How often in this school year have your principal encouraged data use in planning for individual student needs?
High Performing
Schools Low Performing
Schools Effect Size
M SD M SD d
Data use 5.20* 0.55 4.94 0.74 0.40
Data use 1 5.49* 0.65 5.28 0.75 0.30 Data use 2 4.89* 0.77 4.56 1.02 0.37 Data use 3 5.21* 0.73 5.00 0.89 0.26 Scale: 1 – completely disagree to 6 – completely agree *Significantly higher mean, p < 0.05
High Performing
Schools Low Performing
Schools Effect Size
M SD M SD d Data use 4 3.41 1.26 3.21 1.26 0.16 Data use 5 3.06 1.13 3.02 1.23 0.03 Scale: 1=never, 2 = 1-‐2 times, 3 = 3-‐5 times, 4 = 6-‐9 times, 5 = 10 or more
5.4.2 Data Use: Teacher and Principal Interviews
Data informed decision making for assessing student performance, instructional planning and school improvement planning is commonly embedded in the professional work of principals and teachers in all schools, regardless of student results, SES characteristics and school board. Principals and teachers in all schools refer to intentional use of student assessment and related data in three professional contexts: (1) goal setting for school improvement plans; (2)

119
the implementation of Teaching Learning Critical Pathways (TLCP)/parcours and Professional Learning Community (PLC/CAP) meetings (French language schools); and (3) ongoing classroom assessment of student performance. Comments about data use for classroom and school improvement were exclusively oriented towards literacy and numeracy teaching and learning. That is not surprising given that EQAO assesses literacy and numeracy at the end of the Primary and Junior divisions. No principals talked about the use of teacher appraisal data or of observations of teaching and learning in conjunction with classroom walk-‐throughs as a form of data, though these two sources of data do feed into their discussions with teachers about instruction and professional learning as previously reported (see also section 5.5). The word “data” is used specifically with reference to assessment-‐related information on student performance and characteristics. Principals and teachers from all categories of schools report that EQAO assessment results and reports are used in decision making about student learning needs and goals for improvement (i.e., School Improvement Plans), with an emphasis on tested areas of literacy and numeracy.
That’s the big thing this year for our whole School Improvement Plan. We took our EQAO scores, a big part of our school planning and improvement...looking at the scores and our students, the Trillium data. (T-‐11112)
I guess the data drives what our SIP is going to be. We use EQAO results from previous goals to write our SIP and that is our main thing we look at. (T-‐11322)
Les priorités sont établies au début de l’année durant les CAP d’après les résultats de l’année précèdent aux tests de l’OQRE. Quelles compétences à améliorer? L’école a vu une bonne amélioration dans la lecture suite à un effort concerté et compte miser maintenant sur l’écriture au cycle moyen. (E-‐22324)
EQAO definitely. We digged deep into the data, asked open-‐ended questions. That’s how we got the writing goal. (P-‐11224)
Les résultats des tests de l’OQRE sont examinés au début de l’année scolaire en équipe-‐école et suite à ceci la lecture a été identifiée comme priorité pour cette année: compréhension, comment élaborer une réponse, etc. (E-‐22213)
We use the EQAO results to determine the SMART goals for the following year. We sat down together and looked at the EQAO results from the year before, decided as a team to see what needs to be improved and areas of focus and making a plan from there. (T-‐11432)

120
EQAO assessment results and reports are the key, but not the only, source of student assessment data cited by principals and teachers as informing decisions about goals for improvement in student learning at the school level, and at the level of teams of teachers meeting by division or by grade level in Pathways/parcours and in PLC/CAP groups. Principals and teachers from all categories of schools report the use of a common suite of diagnostic and formative student assessment data generated through use of commercially developed assessment tools/processes (e.g., DRA, CASI, PM Benchmarks; GB+ in French language schools); running records tools and data; report card data; and specific program assessments.
Primarily EQAO data. Also DRA, CASI, attendance and report card data. Use of CASI and DRA to establish benchmarks. (P-‐11111)
Starts with EQAO school data. It is the driving force. We looked at ‘making connections’ in Grade 3 as an area of need and then we drilled down to what we needed to do in Grade 1. DRA and CASI mirrored EQAO results. (P-‐11331)
Nous avons plusieurs données-‐-‐ OQRE, GB+ et analyse des méprises...Les données du programme “Apprendre à lire à deux”...pour mesurer les élèves qui suivent le programme. (D-‐22213)
Use a variety of data. DRA, CASI, EQAO, report cards. EQAO is used to support the school improvement process. (P-‐11241)
EQAO data, DRA, PM Benchmarks, CASI, report card data are all sources of data considered in school improvement decisions. (P-‐12443)
All the externally developed assessments named are focused on literacy (reading fluency and comprehension). None were mentioned in regards to assessment of numeracy performance, though two principals talked about local assessment tools for mathematics. The use of external assessment tools such as DRA and CASI to diagnose and track student reading competencies at the primary and junior levels is a central office decision and not a school decision. Teachers administer the assessments and submit their data through the principal to the central office. The data are processed by district office specialists and results fed back to schools for interpretation and use. In our sample, all school boards require teachers to administer these assessments at the beginning and end of the school year. In some schools the assessments may be repeated during the year. In addition to school improvement planning, principals and teachers talked specifically about the use of EQAO and other types of assessment data during Pathway/parcours and/or PLC/CAP meetings and processes at grade or division levels (teacher grouping depending on school size).

121
Tests diagnostiques au début du Parcours aident à identifier les difficultés. Deux Parcours cette année. Un en maths et l’autre en littératie. (E-‐22112) School looks at lot at EQAO data and that helps inform Pathways. (T-‐11111) Data is used for learning cycles diagnostic at beginning and end and ongoing and assessing final assessments. They compare pre-‐test and post-‐test results and anticipate where they can take students, where they can move them to (L2-‐L3, L3-‐L3+, etc.). (T-‐11224) Priorités établies suite aux résultats de l’OQRE et des observations en salle de classe durant les rencontres CAP à l’intérieur des cycles et avec les enseignant d’autres cycles durant journées pédagogiques. Rencontres CAP aux 8 semaines environ. (E-‐22213)
Learning cycles...diagnostic testing to see where the weaknesses are and plan based on that. Then created data walls and made predictions on where the students would be after the formative assessment. After formative assessment, re-‐visit predictions. After summative assessment look to see how much growth there was. That’s what I like about the learning cycles. (T-‐11444)
The Pathway/parcours process (called “learning cycles” in some boards) involves teachers working in teams by grade level or division (1) gathering and analyzing student performance data in order to identify and select a gap in student learning related to board/school improvement goals and the Ontario curriculum standards in literacy and/or numeracy; (2) setting up charts (“data walls”) to track student performance over a 6-‐8 week period of intervention focused on the chosen focus for improvement; (3) planning and implementing common instructional strategies that target the focus for improvement; (4) conducting and sharing formative assessments of student progress while implementing the Pathway/parcours and (5) developing and conducting common summative evaluations of student results at the end of the Pathway/parcours. It is common for teachers participating in a Pathway/parcours to develop common evaluation rubrics to assess student performance in accordance with the Ministry’s four levels of performance standards (L1, L2, L3, L4) and to meet in “moderated marking” sessions during and at the end of the Pathway/parcours cycle to compare and discuss samples of student work in order to develop greater consistency in their understanding and evaluations of student work and performance aligned with the four levels. The Pathway/parcours strategy for improvement in teaching and learning is used in elementary schools across the province.

122
The significance of the Pathways/parcours strategy for data use in schools and classrooms cannot be understated. It is a context that both requires and enables teachers working together to connect “assessment data” to “interventions” to an analysis of the “impact” of teaching on student learning in a focused way for all students. It is collaborative action research as a normal component of teachers’ professional work on-‐the-‐job on a recurring basis, not as an isolated project involving a few teachers, and not as added workload after school. It is grounded in the curriculum expectations and linked to school and teacher accountability priorities. All that is not to say that Pathways/parcours are being effectively implemented in all schools, though it is clearly at the heart of data use for instructional decision making in all categories of elementary schools for this study. Within the English language schools, the adoption of Teaching Learning Critical Pathways (TLCPs) appears to have displaced earlier school improvement initiatives framed in terms of Professional Learning Community (PLC) groups and activities. Staff in those schools rarely referred to PLC structures and processes. In the French language sector, however, these two organizational strategies for school improvement co-‐exist. Teachers gather together to examine data, set goals and discuss progress on school time periodically during the year in Communauté de apprentissage (CAP) teams. In their CAPs they participate in decisions about school goals and about explicit focuses for scheduled parcours cycles. The mandate to implement des parcours was reported as recent as in the past year or two. Decisions in both contexts are shaped by collaborative review and analysis of EQAO assessment results and other data. Two professional practices typically associated with data use are the construction and use of “data walls” and “moderated marking”. Data walls chart and track individual student performance in reading competencies and/or mathematics over the course of the school year, or during a Pathways/parcours cycle. Among the schools we studied, principals and teachers commonly reported the construction and use of data walls (tableau de pistage or progression in French language schools) as a tool for identifying and tracking student performance (e.g., reading comprehension levels) using both external and teacher made diagnostic, formative and summative assessment tools. The creation of data walls is ubiquitous across school categories and jurisdictions, and is a common expectation by central office authorities to promote and enable data informed instructional decisions. Moderated marking is another commonly reported focus of collaborative teacher development activity promoted and supported the Ministry (Literacy and Numeracy Secretariat, 2007b), central office professional staff and principals. Teacher involvement in moderated marking in grade and/or division level teams is intended to increase coherence in teacher evaluation of student work aligned with provincial curriculum standards. It also holds teachers mutually accountable for follow-‐through with jointly agreed upon instructional plans. Data walls and moderated marking, per se, do not

123
distinguish professional practice in higher and lower performing schools, though as discussed further on, how they are reportedly used is not the same for all schools in those groups. We asked principals and teachers about leadership and support for the collection, interpretation and use of student performance and other data for instructional decision-‐making. Principal leadership is key both as participants in data use (e.g., interpreting data, setting goals) and as supporters (e.g., developing teacher capacity for effective data use, and facilitating data use through the provision of time, professional resources, access to help and organizational routines). Across the schools, principals varied in how they enacted in-‐school leadership for data use. Some took an expert role in the analysis and presentation of data (e.g., EQAO results, report card data, student data profiles) and in teacher development for data use. Some facilitated teacher access to external expertise (e.g., board literacy and numeracy coaches) or to resource teachers within the school who are presumed to have greater expertise with data interpretation for instructional decision-‐making (e.g., Learning Support Teachers, Special Education Teachers, Reading Recovery or ESL teachers). Some do both. All principals are responsible for the provision of time and material resources (e.g., EQAO and Board data use tools) and for supervision of expectations for data use in the schools. We explore variability in how principals enact leadership for data use among the higher and lower performing schools in following section. Principals and teachers in some boards and schools cited the important role of board resource personnel (e.g., literacy and numeracy coaches) and resources (data management technologies and reports) with data analysis. Assistance from the central offices included technical help with data interpretation by board literacy/numeracy consultants and with use of computerized data systems, in-‐service training for principals and teacher leaders on data use, provisions for professional activity time to work with data and, in a few school boards, provision of local assessment tools (e.g., sample tests). The involvement of board resource personnel in assisting principals and teachers with data use was more consistent across the French language schools as a group than for the English language sector. This may reflect a common pattern across the French language school boards, perhaps in part due to the fact that board consultants have fewer schools to support, even considering their geographical dispersion. Some schools reported having participated in “District Reviews” in the past couple of years. District Reviews are a Ministry mandated whole school evaluation process associated with the Ministry’s School Effectiveness Framework (SEF) that was adopted in 2010 (Ministry of Education, 2010). The mandated process includes school self-‐studies based on the SEF and using available student and school performance data, as well as visits and reports by district teams that include supervisory personnel and seconded principals and teachers from other schools. The output of a District Review is expected to feed in to a school’s annual school improvement plans, and the District Reviews themselves are structured occasions for principals and teachers in schools to examine and use “data”. This is happening in all schools, though in

124
our sample, we found that boards were focusing first on lower performing schools. Only two of high performing schools had been examined in a District Review. District Reviews provided a stimulus and rationale for increased systematic data use in schools regardless of their performance.
5.4.2.1 Data Use in High Performing Schools Principals and teachers in all high performing schools talk about using previous year EQAO reports (assessment results, student survey data) in combination with other assessment data (e.g., CASI, DRA, report cards) to determine school goals for improvement in student learning. Staff from schools in three boards (one Francophone, two English) reported that they also examined results from supplementary tests mandated by their school boards. One of the Francophone boards required elementary schools to administer a literacy test to all students twice a year. One English language board required teachers teaching at the Junior division to administer an additional diagnostic test in September “like a quick snapshot to highlight what is there and not” (T-‐11322). One low SES high performing school was participating in a Board initiative focused on selected high poverty schools that required them to administer the CAT-‐4, which the teachers described as a “kind of Grade 2 exit exam” (T-‐11331). In addition to student assessment data, principals and teachers from three high performing schools reported that they considered a wider range of information about student characteristics and prior performance made available by their boards through locally managed data-‐base systems. In sum, reported differences in the types of data informing school goals across the high performing schools in this study appeared to be idiosyncratic to particular boards and schools; however, the use of supplementary tests as noted in some boards was only reported in the low SES high performing schools. Given their status as high performing schools on the Primary and Junior EQAO assessments, one might expect teachers in these schools to report less engagement in assessment and data use, or to raise concerns about expending so much time administering and interpreting assessments. In the schools visited that was not the case. Educators in some high performing schools, however, did suggest that identifying school goals for student learning through the analysis of standardized assessment data was challenging because academic results were so strong at the school level.
EQAO...disaggregate data looking for trends, areas where skills need to be improved. If achievement is less than 80% in a cluster, those skills become a focus, e.g., the issue of using proof to support their answers. (T-‐11111)
As a school we looked at our EQAO results and they were strong, so not a focus. It was more just teachers coming in and saying this is what I notice in my classroom or students

125
are struggling here. We talked first as small groups and then as a division. We grouped them into three categories, then we saw the common thread as a whole school. We also saw the district goal of non-‐fiction, but we saw that the students were achieving that at a high level. We saw ‘inferencing’ and ‘deep quality answers’ were needed and the social was also needed. (T-‐11112)
We use the EQAO data quite a bit...We use running records that we do with the kids every year for their reading levels. We have a data wall we look at to see where they are at a glance and see where we need to move. Looking at it now, we know we have a few high and a few low. The Grade 3s are mostly at the higher level so there are a few we need to bump up. (T-‐12323)
Effective data use to inform goals for student learning in these schools requires teachers to look closely at student performance for specific curriculum objectives and to query the scope of student learning gaps. They may need to be more precise than teachers in low performing schools about what areas of learning and which students require attention. While principals and teachers are looking at EQAO and other student assessment data to rationalize decisions about school goals for improvement, an equally if not more significant context of data use for instructional decision-‐making is in Pathway/parcours and PLC/CAP meetings and in the individual teacher’s classroom. At these levels teachers concretely examine diagnostic testing data for their students aligned with school goals, plan short-‐term interventions to improve student learning relative to those goals in their classrooms, monitor student progress and evaluate the impact of those interventions on student learning. Teachers were collecting and using data for instructional decision-‐making in Pathways/parcours and other division/grade level team meetings in all the high performing schools sampled in this study.
We get together during our team meetings – we bring up students of concern-‐ look at the achievement chart and different categories and our expectations of where we want students to be and then look and their work – first we need to be consistent in terms of what we feel is a level 1-‐4 is – then look at strategies and what the next steps are in terms of getting that student to that stage – at a division level – there’s 5 English teachers. (T-‐11112) Données servent à se fixer des objectifs à atteindre pour la salle de classe. Les
enseignants de 5e et 6e ont fait un test diagnostique sur comment les élèves faisaient les liens avec le texte, avec le vécu, etc. Suite à ceci, les enseignants ont mis au point en CAP un plan pour travailler sur cet aspect (Parcours). Le niveau primaire se sert beaucoup du test GB+ pour évaluer rendement (trois fois par année). (E-‐22112)

126
Under the direction of our principal we are to submit certain data at certain times of the year...So we collect all the data and then at a staff meeting or on a release day we look at the data across the school or the division and then from there...OK we need to focus on. (T-‐12323)
Les données sont analysées lors des rencontres CAP et CARE et des plans sont faits pour développer et mettre en place des stratégies pour améliorer le rendement. De plus, la direction se penche sur les données et sur les stratégies lors des rencontres mensuels avec le personnel entier de l’école: ex. Modifier l’horaire pour donner plus de temps aux blocs de littératie. (E-‐22314)
In these contexts two kinds of assessment data are at play: (1) results of standardized assessments (EQAO, DRA, CASI, GB+), typically converted into data displays (data walls); and (2) results from the use of shared rubrics and other assessment tools developed by teachers themselves to assess student performance attached to specific intervention cycles. A key factor is that the data and its analysis are overtly linked to specific classroom interventions. The most common interventions are grouping students in leveled reading groups for Guided Reading activities and for student choice of commercially developed leveled reading materials. In addition, teachers talked about deciding together on common or at least similar teaching strategies and lessons during a Pathway/parcours cycle. Principals and teachers in about half (6/11) of the high performing high SES schools mentioned the use of data walls to aid in tracking expectations and growth in student performance. It cannot be said, however, that they strongly emphasized the utility of data walls other than as a “useful visual” (P-‐11112). Their status as high performing schools may have some bearing on the utility of data walls that are based on EQAO scores and other standardized assessments, especially reading levels. As one principal noted, “There are not that many at risk students, so there wouldn’t be much movement evident” (P-‐11111). The same principal reported that the school does not allow public data walls that might single out the relatively few struggling students. A Junior division teacher in another school stated that data walls that track student reading levels were more common in other schools, because students in her school were likely to have attained maximum reading levels by Grade 3. Teachers in two of four high performing French language schools referred to data walls/tableau de progression as a tool for identifying and planning for students at different performance levels in PLC/CAP meetings, including color coding student identifiers to reflect their level (“Après chaque évaluation diagnostique: system de drapeaux rouges ou jaunes pour déterminer le niveau d’aide à apporter, stratégies suggérées” E-‐22111). In sum, though data walls were present in high performing schools, their practical use in instructional decision-‐making was not emphasized. Teachers in two schools described them

127
as a “quick way to see where kids are” or a way “to see where they are at a glance” (T-‐11112; T-‐12323). Principals and teachers in the high performing schools (8/11) expressed more enthusiasm about the utility of implementing moderated marking sessions in grade or division level teams.
Moderated marking all the time. That emerged from the OFIP Turnaround time. Now we’ll never talk without any student information in front of us (student work). (P-‐11322)
Moderated marking sessions. Teachers meet purposefully. Conversation is always about student work. Student work is on the table. (P-‐11331)
Within classrooms we do diagnostic assessments and do a lot of moderated marking together with grade partners. (T-‐11111)
Moderated marking provides consistency and common frame of reference. (P-‐12113)
Moderated marking in which teachers collectively evaluate student work against exemplars and/or rubrics that they have designed to be aligned with provincial standards is experienced by teachers as a valuable exercise in assessment and interpretation of student performance. Although some stakeholders suggested a connection, it was unclear how moderated marking relates to data walls that display student performance as part of the diagnostic, formative and summative evaluation processes during Pathway/parcours cycles. According to teachers in the high performing schools, the use of standardized and shared assessments did not eliminate traditional individual teacher evaluations of student learning in the classroom. At a minimum this involved teachers’ personal use of external assessment tools such as PM Benchmarks and GB+ to group students for Guided Reading and leveled reading programs that boards and schools across the province have adopted. Teachers referred to, as well, the use of data from such things as teacher-‐made tests and anecdotal observation.
It’s probably going to depend on every teacher, but to me, data informs every lesson. Data could be what was their work yesterday, and how is my lesson today going to reflect that...Diagnostic, building on what students know and what they don’t. (T-‐11111)
I use data a lot that I collect in terms of their progress in guided groups...I’ll change groups due to strengths and weaknesses...I collect a pop-‐quiz or observation in their writing...If their reading is not at the level I want or comprehension is not as high as I like...PM benchmark ...leveled books from 1-‐30. (T-‐11112)

128
Tests... you have to make tests in a non-‐threatening way. It’s not a big thing...I give them an assignment and say what I’m seeing and we can’t move on until we straighten this out...Based on the test on the overhead I ask them what makes this a level 4...in reading, writing and math. (T-‐12113)
Test GB+ pour déterminer les niveaux en lecture permet d’établir les plans pour faire progresser l’élève. (E-‐22112)
Our findings suggest that in the higher performing schools teachers have struck a balance between the traditional in-‐class assessments of student performance that teachers make and standardized external and school-‐developed assessments. We invited principals and teachers to talk about leadership and support for data use to inform school goal setting and instructional decision-‐making. Their responses revealed variability in the roles played by principals and other sources of assistance. A majority of principals (6/11), as described by themselves and their teachers, act more as enablers and facilitators of data use by teachers, relying more heavily on external expertise from board consultants or school-‐based expertise (e.g., Reading Recovery, Special Education teachers) than on their own data analysis skills. This was particularly common for the French language schools within our sample.
This year we had a breaking down of EQAO data. Our math and literacy coach came in. We were in smaller groups based on Grade. They broke down the data and showed the kinds of questions the kids did poorly on. (T-‐11331) Discussion et partage durant les CAP appuyés par la conseiller du FARE durant les journées pédagogiques. (E-‐22111) Discussion des résultats fournis par l’OQRE au début de l’année avec la conseillère pédagogique et le sondage des élèves par rapport aux autres écoles du conseil, de moyenne de la province, etc. (E-‐22314)
Work with P.O.R.s to help staff plan for improvement...M.A.R.T. also assists in assessing and gathering data, working on improvement plans. (P-‐11111) Principal, special ed teacher and language resource teacher provide in-‐school assistance and board resource personnel assist in interpreting and recommending directions. (P-‐12113)
Other principals (5/11) contribute personal expertise in the process as well as involving outside help. Principal expertise focuses mainly on the presentation and interpretation of

129
standardized assessment data at the school level, and less on the particularized analysis and use of data in Pathway/parcours or similar teacher teamwork contexts.
The principal is excellent at analyzing data and evaluating student performance. (T-‐11111)
EQAO reports come in the fall and we’ve always scored well. Basically the principal will break it down into which particular strands students didn’t do as well in. (T-‐12113)
EQAO regional workshop helpful in learning how to use all the data (i.e., demographic, perceptions, student achievement) to support student learning. After workshop principal spent a half day in-‐servicing staff on this learning. (P-‐11321)
It is difficult to gauge the depth of principal expertise in the interpretation and use of data for goal setting and instructional planning. Teachers in one high performing school, for example, reported that the principal was skilled at summarizing and presenting external assessment and report card data, but left discussion about the practical use of those data to teachers individually or in their teams. Among the high performing school principals, one stood out as modelling and providing deep expertise in the analysis of student performance data, beyond initial presentation.
Principal brings data to the meetings and discusses our data and where we are low and how to improve. She always brings it around and it drives our instruction. With EQAO I have a book she has given me of questions in previous years where kids have gone wrong. The principal goes through everything with us at our meeting and discusses what was what so we could understand better. Under the principal’s direction we are to submit certain data at certain time of the year. We collect all the data and then at a staff meeting or on a release day we look at the data across the school or division. She is excellent at putting things in perspective. She will do a chart about this is where we are and this is where we want to go. These are the students under L1 or L2 and this is what we need to focus on to move the children. (T-‐12323)
It is of note that this high performing low SES school had successfully graduated from the OFIP turnaround program some years before. Teachers reported that they used to hold monthly literacy meetings to look at data with assistance from board specialists. The current principal had the expertise to assist them on her own. Among the five principals in high performing schools that were singled out for expertise in data analysis, four were new to their school. We are unsure about the significance of that finding. It may be that new principals feel compelled to get involved in analysis of student data as a way of getting to know the status of student learning in their schools, and as a way of demonstrating to staff their commitment to data use as a tool for improvement.

130
In addition to access to specialists from the central office, principals and teachers referred to other forms of assistance from their board offices related to data use (and to instruction). School personnel in two boards, for example, said that their boards hosted annual workshops for principals and Grade 3 and 6 teachers to help prepare them for upcoming EQAO tests. In two boards school staff talked about data-‐systems at the board level that compiled and generated school and classroom level assessment data reports of various sorts to aid with data use. This kind of help, however, is not limited to high performing schools and thus is not unique to that group. Overall, neither principals nor teachers in high performing schools strongly emphasized the principal’s role in data use beyond ensuring that expectations for use of EQAO and other assessment-‐related data were being examined as a part of school goal setting and in teacher teamwork activities (e.g., Pathways/Parcours); leading or facilitating the analysis of EQAO results in the annual school improvement planning process; and arranging access to board specialists and data resources (PD, data systems) as needed. The principal in one high performing school described his role in data use simply as “share it, defend it, explain it” (P-‐11111). Although there were variations in nature of data use for school goal setting and instructional decision-‐making in the high performing schools, the overall impression given was that principals and teachers had incorporated data use into their professional work as an ongoing norm and practice. The use of student performance data begins with Primary and Junior EQAO assessment results, but data use extends as well to other forms of assessment and interventions across all grades.
The Grade 3s and 6s have always been very aware of the data. But recently it has been more about the whole school and how we can use the data. (T-‐11331)
Les enseignants de mat-‐jardin sont aussi impliqués dans l’analyse des données des tests de l’OQRE parce qu’ils sont conscients que l’apprentissage commence dès un bas âge. (E-‐22314)
5.4.2.2 Data Use in Low Performing Schools Principals and teachers in low performing schools talked about using EQAO assessment results in combination with a variety of diagnostic assessment data, and with student profiles generated by their board’s student information systems. They used this data to determine goals for improvement in student learning, and to monitor student performance in Pathways/parcours cycles and other grade or division team meetings where short term plans for instruction linked to school goals are made. The overall impression communicated in teacher interviews, however, is that a professional culture (beliefs, practices, organizational

131
routines) of standardized and common assessments and data use for instructional decision-‐making was less deeply institutionalized in the lower performing schools when considered as a group. Some schools, however, do not fit this generalization. In one exception, the principal and teachers reported that increased data use was a recent change that was directly attributable to the pro-‐data use actions of a new principal. Also, as a group, data use seemed to be more engrained in the ongoing school improvement activities of principals and teachers in the French language schools, and did not notably differ from data use as reported in the high performing French language schools. In spite of these exceptions, the interview data indicate some patterns of comparatively less systematic data use for instructional decision-‐making in the low performing schools: low teacher participation in data analysis for school goal setting; limited use of EQAO test data beyond the identification of broad school goals for improvement in student performance; inconsistent use of standardized assessment tools for tracking student performance (e.g., DRA, CASI, data walls); and greater emphasis on the use of individual teacher-‐made assessments for instructional decision-‐making at the classroom level. Even where teachers reported more systematic and complex uses of data, these practices were often talked about as recent innovations not as routine norms of practice. Broad teacher participation in data analysis for the purpose of setting school-‐wide goals for improvement was less evident in the low performing schools than in the high performing schools. Teachers in half (6/11) of the low performing schools said they were uncertain about how the school improvement goals were set or that the school goals were set by the principal, perhaps in consultation with a school improvement team, who presumably looked at student performance data.
I told my kids in the Fall our goal for learning was to have more depth and detail in our writing... (Was that determined using the EQAO results?) ...I don’t know. One of the other teachers wanted to focus on that. We didn’t talk about it so I don’t know. (T-‐11224) There are 9 LTOs this year. So what the administration decided was rather than start something brand they continued with the SIP goal from last year. I don’t know how it was developed. I think it’s based on EQAO maybe or scoring of some type, but I don’t know. (T-‐11242) I’m sure they use the EQAO data at the school. At other schools we have had a copy in our hand and we highlighted areas... I am hoping they are doing that with the school improvement plan. (T-‐12233)

132
There is a planning committee and I don’t know what they do. I was told that the school goal would be written again. (T-‐11434)
EQAO is a big push, and all the teachers are teaching the same way and we’re implementing APES and problem solving in math...making connections...showing what they’re reading. I’m not sure how it was decided as a focus. I was just told the focus at a division meeting. Our principal outlines what we are going to do in our classroom. (T-‐12443)
The principal brings a lot of data in and shares it with us. Talks to us about what it means and where we should go with it, but I can’t think of it off the top of my head. (T-‐11242)
The apparent lack of widespread teacher participation in data analysis and setting school goals was more typical of low performing English language than French language schools (though there were two exceptions among English sector schools). Teachers in the French schools consistently reported that they reviewed EQAO data with the administration and school team at the beginning of the school year in order to determine the school-‐wide focuses for improvement; however, the basic directions for improvement were set by a school improvement team.
L’équipe-‐école se rencontre en début d’année pendant une journée complète pour analyser les résultats des tests de l’OQRE...Ceci détermine le focus de l’apprentissage pour l’année. Les enseignants doivent déterminer les besoins pour leur salle de classe...discussion et partage entre enseignants. (E-‐22415)
L’écriture. Déterminée par l’équipe-‐école au début de l’année scolaire durant une réunion du personnel. Les enseignant se regroupent par cycle et regardent les résultats des tests de l’OQRE. (E-‐22221)
It cannot be said that low teacher participation in the analysis of student data for school improvement goal setting is causally related to student results overall in the lower performing schools. This finding may reflect, however, a superficial engagement with data informed instructional decision-‐making in many of these schools, and this could influence the precision and effects of instructional interventions. Low widespread teacher participation in school improvement goal setting at the school level does not necessarily mean that teachers do not use student performance data for instructional decision-‐making. Among the lower performing schools, collective review of student assessment data occurs more at the point of operationalizing school goals in the context of grade or division team meetings and Pathway/parcours cycles during the school year in accordance with board and school expectations. We noted, however, some tendencies in

133
teacher use of data for instructional decision-‐making across the lower performing schools that may weaken the links between data use and school improvement. First, the links between EQAO test results and other standardized assessments for tracking student performance were not always transparent. Teachers in some schools reported that EQAO results applied mainly to teachers and students in Grades 3 and 6, and did not emphasize their relevance to literacy and math instruction in the grade levels preceding the tested years. The use of Board mandated assessments (e.g., PM Benchmarks, CASI, GB+, program specific assessments) for tracking student reading skills and for sorting students for Guided Reading groups and leveled reading programs was more generalized across all grades. Results of these assessments were used in divisional/grade level team planning in Pathways/parcours and related team meetings, and for making individual classroom decisions (e.g., grouping students for differentiated instruction). However, as reported by teachers from a majority of low performing schools, these assessments can be administered and used for instructional decision-‐making independently of skills deficiencies associated with EQAO assessment results.
The only data I really see are the DRA results that I can use, because by the time the EQAO results come out they have gone on to Grade 4. Because of the program I use they don’t really help me a lot. They help me determine who is reading at Grade level and who is not. I have a chart that I make of the ones that are really low. I will do a running record, but the ones that are above Grade level I won’t. I use it to give me a big picture idea of how the students are doing, but I don’t use it for specific things because the students really determine what we doing based on their needs. (T-‐11224)
For primary we do use the PM benchmarks to find out their level. So with Guided Reading we use the appropriate text and for reading groups, not a formal program....It’s based on what is in your classroom and on what you see and you do what you need to do and from what you see. You see where you need to improve, where there is trouble, and then you do a lesson on it. So I guess it’s data but it’s more observation just walking around and seeing what they’re having trouble with. (T-‐11242)
PM Benchmarks. I make up informal assessments at the beginning of the unit, part way through and the end of the unit...There is a lot of observing with primary kids, so I try to take as many notes as possible to see on a day to day basis what they are lacking, and I keep track of it in a notebook to check to see if there’s improvement. For formal assessments, there is the EQAO besides PM Benchmarks, but the rest I make up with my teaching partner.” (T-‐12233)
Based on the pre-‐assessment I can see where they need to go. At the end of the (Program name) unit there are five lessons. When I give that post-‐test at the end and if

134
they don’t understand I don’t move on to the next unit. I do PM Benchmarks once a year where we hand it in. I do running records all the time, probably every two weeks with all the kids when they are working at the Guided Reading table. I haven’t looked at EQAO results with the school at all this year. (T-‐12443)
As illustrated, teachers in these schools emphasize the importance, if not the primacy, of their ongoing personal evaluations of student work in the classroom (e.g., teacher-‐made tests and observations). Second, while teachers are expected to implement, report and use the results of common assessments mandated by their Boards and school administrators, inconsistent compliance with these expectations surfaced in teacher interview comments from several low performing schools.
Within the Learning Cycle the first thing you give them is a diagnostic assignment. We give the same one and the end and compare. We also do DRA. (Are all teachers doing that?) No, I have been trying to do that more, but not everyone does. I think the diagnostic assessments prove what you already know and they you can tweak what you teach based on what they no. I would say not all other teachers do this and I don’t all the time either. (T-‐11224)
There is a Grade 3 CASI but I haven’t used it. That whole idea is seeing an answer and seeing what the different levels are, which is good to show the students. I like it, but I haven’t done it this year. (T-‐11242)
In one low performing school teachers reported that keeping DRA and other assessment records “up to date” was a itself a school goal emphasized by their new principal. It is noteworthy that reports of inconsistent follow through with the use of these kinds of assessment practices was limited to schools in the low performing high SES (English) school cluster, and appeared to be a leadership issue. As in the high performing schools, teachers and principals in low performing schools provide mixed reviews of the use and utility of data walls. Data walls were not mentioned in the school interviews from two low performing schools. Staff from a third low performing school explained that teachers were expected to construct their own charts of student assessments and progress in their personal files (“The data walls we did have them but it is now a data wall in your book because of privacy issues I guess” T-‐11434). The principal reported that EQAO and other student data compiled at the Board office are only made available to principals, leaving teachers dependent upon their principals to share that information. Another teacher from that school said that while the principal encourages “data and proof on the walls” to “prove how kids are doing”, she does not choose to display that information publicly in her

135
classroom. The use of data walls as a data use tool in schools is affected by Board policies and support for data use at the school level, as well as by school leadership actions. In the other eight low performing schools teachers reported that school-‐wide data walls were in place, typically in a special resource room (e.g., Literacy or Reading Room) where teachers meet for team planning and to protect student privacy. These data walls displayed current and projected individual student reading levels by grade based on standardized assessments administered by teachers (e.g., PM Benchmarks, CASI and running records, GB+) at the beginning and during the school year at regularly prescribed intervals.
What we have over here is our literacy wall...the levels the kids are working at...All blue stickers are Grade 3 students. In September this gives us a rough idea of where the students are at...That is the starting point. Pink is Grade 1. Yellow is grade 2. That’s the primary division. The junior division have some sort of similar thing. It is really useful in September when we start the groups. We are shifting groups to find appropriate levels for students. (T-‐11432)
L’enseignant se sert du code de couleur dans toutes ses matières. Les couleurs correspondent aux niveaux de l’OQRE: vert = 4, jaune=3, rose=1 et 2. Système en place au niveau de l’école. On regarde les résultats par classe et par école. Se sert des données pour regrouper les classes, mélanger forts et faibles. La première réunion pédagogique au mois de septembre est très importante pour prendre ces décisions. (E-‐22415)
Mathematics data walls were only reported in one low performing school. Teachers described the data walls as useful to classify and group students by reading levels for literacy instruction, particularly at the start of the school year when teachers are getting to know new classes of students. Teachers in the low performing schools, similar to high performing schools, also talked about using diagnostic, formative and summative assessments of student learning for short term learning goals in division or grade level Pathway/parcours cycles. This included teacher-‐made assessments and the use of data walls collectively or individually to track student progress on these short term goals.
We’re becoming better at decoding data to help us make decisions. Don’t make any decisions without consulting the data. Staff and then in Learning Cycles and when teachers are working together, looking at actual student work or data walls. (T-‐11434) Learning cycles...diagnostic testing to see where the weaknesses are and plan based on that. Then create data walls and make predictions on where the students would be

136
after the formative assessment...after formative assessment, re-‐visit predictions...after summative assessment look to see how much growth there was. (T-‐11444) Considering we have to do TLCPs it’s basically all the students and our focus is on boys’ literacy. It’s one of our SMART goals. We put on a chart all the kids’ names that are boys in Grade 7 and 8 and they did an assessment piece where they had to use comprehension and we had a rubric for the levels and with that data we have to predict where we think we can get them in 6-‐8 weeks, and how we are going to get them there. (T-‐12443) Data is used for Learning Cycle diagnostic at beginning and end and ongoing and assessing final assignments. They compare pre-‐test and post-‐test results and anticipate where they can take students. Where they can move them to (L2-‐L3/L3-‐L3+, etc.). (T-‐11224)
Teachers across the low performing English sector schools talked less consistently about implementing team assessments of student performance during Pathways/parcours meetings, though they did report meeting in collaborative teams (e.g., grade level) on a regular basis to look at data and discuss progress.
Release time to be able to have meetings to discuss data and work with the DRAs and CASI. Time to meet and plan. One morning a month to work in grade teams and as whole school. (T-‐11241) They know they have trouble with EQAO. They have been working on that in their monthly focus groups. They have been working towards yearly goals with the annual learning plan. And working on monthly goals, their reading strategy, pre-‐ and post-‐assessments for math. It’s about finding out where they are and what they can do to get them to where they should be on an ongoing basis. (T-‐12233).
In sum, we did not find obvious consistent differences between high and low performing schools in data use for classroom decision-‐making in the context of grade and/or division team meetings specifically organized for that purpose, including but not limited to Pathway/parcours cycles. Principals and teachers in low performing low SES schools spoke positively about teachers coming together for moderated marking sessions to analyze student work and develop greater consensus on judgments about the quality of student work in relation to common

137
evaluation criteria and Ministry standards. This occurred in scheduled Pathways/parcours cycles or in other staff/team meetings.
Teacher moderation. Whenever we do professional development they have to bring student work with them. It’s all about student data and student work. (P-‐11432) Teachers do moderated marking at the end of each learning cycle... It’s good because it definitely gives us that opportunity to see what each (level) looks like...just to see that progression. (T-‐11444)
The principal had us do a lot of moderated marking, so we are working together with our marking to make sure our results are similar, so that we are all on board with our SIP plan, so we all know what a Level 1 or 2 and so on is. (T-‐11242)
Moderated marking was a recent activity for teachers in some of these schools and was linked to the arrival of new principals who played more active instructional leadership roles than their predecessors. There may be other differences in the nature of data use in these schools that were not consistently captured in our findings and that have more direct implications for differences in school performance. A principal who was new to one of the low performing schools, for example, reported that she was taking steps to increase the depth of teacher understanding and skill in using assessment data to guide instruction, because she found that teachers “were looking at data to look at levels only, not skills” (P-‐11444). We cannot say that teacher expertise in data analysis and use for instructional decision-‐making was similarly low in all the low performing schools. There was, however, a greater preoccupation in those schools with student progress from lower to higher levels of student performance according to Ministry and EQAO curriculum and accountability standards in literacy and numeracy. This seems reasonable given the external accountability demands emanating from the Ministry and the boards. Overall, neither principals nor teachers in low performing low SES schools strongly emphasized the principal’s role in data use beyond initially presenting and organizing the analysis of EQAO results in the annual school improvement planning process. Nor did they emphasize principal leadership in the use of data for instructional decision-‐making in Pathways/parcours activities or routine classroom assessment, other than arranging time and access to board resource personnel with expertise in data use. In a few schools teachers reported that their principals regularly monitored how they were using their time when they met as teams for data use and planning, though not necessarily in the role of expert. Notwithstanding this general view of principal leadership in support of data use for instructional decision-‐making, teachers in three low performing schools did describe and

138
commend the data use leadership and expertise of their principals (all of whom were newly appointed to their schools).
The principal is very transparent and very good at explaining things and if we have questions we can always go to her. She brings the graphs in and we all have a copy and she uses them to explain where we are and where we need to go and then she always has activities to do with it. She had us do a lot of moderated marking. (T-‐11242) In the Learning Cycles. We had a half day every time...As a group we sat and our principal said we’re going to look at the EQAO. She was at all the Learning Cycles. Then she directed us the way that those times were going. If she hadn’t been there, there is a tendency to not stay as focused on the task. She says let’s look at this, in the DRA there is a focus on instruction. There is a focus sheet so when you fill in all the things like comprehensions, fluency, ability for literal comprehension, reflection, all these areas so you have a different level. (T-‐11444) C’est la directrice qui fournit l’aide dans l’interprétation des données et qui aide à cibler les besoins. (E-‐22221)
Teachers from four low performing schools, however, described a complete lack of principal involvement and support for data use for instructional decision making beyond initial school goal setting.
We don’t make a point of analyzing the results. The previous principal maybe a little more. One session we looked on specific areas of students who are lagging, but not with this principal...One time in the Fall for the school improvement goals, it was after school and they gave us the time back...They gave us a free half day whenever we wanted. (T-‐11432)
We had to ask the principal for the EQAO data to highlight and figure out the poorly answered questions. (T-‐12233)
I haven’t seen anyone help look at the data. I’m not sure what is happening at the school improvement meeting. I only hear about it at staff meeting. (T-‐12443)
Pas de processus en place pour aider les enseignants avec les résultats. Les enseignants doivent demander de l’aide. (E-‐22415)
In sum, principals were not generally identified as providing direct leadership and expertise with data use for instructional decision-‐making in the low performing schools. There were

139
exceptions, but this was idiosyncratic to particular principals, rather than characteristic of these schools. The findings are similar for principal leadership in data use in high performing schools. It may be unreasonable to expect all principals to lead as experts in data analysis. It is not unreasonable to expect principals to demonstrate leadership by facilitating access to expert assistance. Principals and teachers from eight of the eleven low performing schools referred explicitly to the assistance of board resource personnel (e.g., literacy and numeracy coaches), though sometimes only upon request, and resources (data bases and documents) with data analysis.
There is a literacy person who comes in and we did the PM benchmarks and looked at the data together. I had the training with one other teacher...Not really any other help. (T-‐11432)
We’ve had these literacy and math cycles so we have been working as a division on these...We have a coach from the board come in...literacy and math coaches over the last five years because we were identified as a school that needs love and attention. (T-‐11434)
La conseillère pédagogique est normalement présente aux CAP. (E-‐22415)
Assistance comes from reports generated by each of these assessment tools, from Literacy and Numeracy coaches, school SO. (P-‐11241)
Board provided expertise is requested as needed. (P-‐12233)
Teachers in four of the low performing low SES schools talked more about assistance from board resource personnel than about help from in-‐school resource teachers (e.g., Learning Support, Reading Recovery and Special Education teachers) with data use (only 4/11 schools). This may reflect the fact that these schools had been targets for external intervention through the Ministry and Board OFIP program due to their low performance.
5.4.3 Summary of Data Use in Schools Data use for school goal setting and instructional decision making is clearly present in all categories of schools and in all jurisdictions. Overall, we found a common organizational pattern of data use that includes: annual examination of Primary and Junior EQAO assessment results and related student assessment data to determine school goals for improvement; the administration of a common array of standardized assessments to measure and track students literacy performance and to inform instructional decisions during the year; teachers working in division or grade level teams at structured intervals to look at diagnostic assessment data and to plan short term interventions aligned with school goals, typically but not exclusively in the

140
context of board mandated Pathway/parcours and PLC/CAP meetings; the use of board mandated tools and processes, such as data walls and moderated marking to assist with the interpretation and use of student assessment data for instructional decision-‐making; external assistance from central office literacy and numeracy coaches to aid in the collection and use of assessment data; and variability in roles that principals take in leading and supporting data use for school improvement. Many of the decisions about the kinds of data, data use and structural and resource supports are attributable to central office authorities and policies, not to principals and teachers at the school. We looked for evidence of differences in the ways that data use was being enacted and supported between the high and low performing schools in our sample. There is evidence to suggest that teachers in the low performing schools were less likely than teachers in high performing schools to participate in the analysis of EQAO and other performance data to determine school level goals for improvement; there was less integration of EQAO results with diagnostic data from standardized assessment tools (e.g., PM Benchmarks, CASI, DRA, GB+) and with teacher made assessments for tracking student performance; and that there were issues with compliance with administrative expectations for data gathering and use in some of these schools. That said, there was still clear evidence that teachers in the low performing schools were collectively gathering and reviewing student performance data related to the school goals for improvement in the context of Pathways/parcours cycles or other regularly scheduled team meetings. Variability in principal leadership for data use was idiosyncratic to particular principals, and not consistently associated with particular groups of schools. The majority of principals act as enablers and facilitators rather than as experts in the interpretation and use of data. Principals in low performing schools are more likely to make use of assistance from central office instructional coaches for professional development and direct assistance to teachers in the collection and interpretation of data. Principals in high performing schools are more likely to rely on supplementary expertise from school-‐based resource teachers (e.g., Special Education, Literacy Resource Teachers). Where we identified findings that we characterized as weaknesses in data use, particularly among the lower performing schools, these findings can often be linked to leadership issues at the school and sometimes at the board level. We argue that data use does not determine student results, though it certainly helps give focus and precision to school improvement goals and teachers’ instructional decision-‐making aligned with those goals. Notwithstanding evidence of strong leadership and intense data use in some of the hard-‐to-‐serve schools in our sample, they remain low performing. We also noted that despite the oft assumed academic capabilities and advantages of students from higher income communities, weaknesses in the practice and support for data use may contribute to unexpectedly low student performance on the provincial literacy and numeracy assessments school-‐wide.

141
5.5 Monitoring through Principal Walk-‐throughs Frequent informal classroom visits, conventionally referred to as “walk-‐throughs”, have been popularized as an instructional leadership practice in North American schools, including Ontario, over the past decade. During the walk-‐throughs, principals briefly observe what teachers and students are doing, look for evidence in behavior and artifacts that teachers are implementing expected practices and talk with students about their learning and progress. In theory, principals then provide feedback to teachers individually or as a group about what they have observed, including recognition of accomplishments in line with school improvement goals, raising questions and challenging teachers where their observations do not match expectations and offering additional supports as needed. In the 22 elementary schools that we visited, informal classroom visits are only one of the strategies employed by principals to monitor and gather information about school improvement needs and progress. As described in the preceding section of this report, they also reviewed student assessment data (EQAO test results, school assessment data, report cards), reviewed teachers’ long range plans and participated in organized meetings with teachers focused on data-‐informed planning for curriculum and teaching (e.g., Pathways/parcours, Professional Learning Community/CAP and Collaborative Inquiry meetings). Here we examine the principal practice of informal classroom walk-‐throughs overall, and then note findings that arise from comparisons between the high and the low performing schools. We found wide variation in the reported frequency and nature of principal classroom visits. Overall, the principals cluster into three broad groups: principals who rarely visit classrooms other than for formal teacher appraisal; principals who regularly visit classrooms, but engage in little interaction with students or teachers; and principals who regularly visit classrooms and who observe and talk to students about what they are doing and learning, or even advise or co-‐teach with the observed teachers.
The principal is pretty hands off at the classroom level, but will buy resources. Not a lot of hands on support or observation of teaching or anything. They’re pretty much are in the office most of the time. (T-‐12233)
He comes around to the classrooms to see what’s going on. I don’t know if he’s doing an observation, but he does make his presence known. Doesn’t take notes or anything, but just cruises around the classroom. (T-‐11241)
I’ve gotten lots of feedback for instruction – other than him coming in for evaluation he’s come in and asked how we’ve used the word wall and how it’s being implemented in class

142
and he’s given suggestions – like on mine I have 3 different colours and it came from him to represent the 3 different grades – he comes in almost every day when he’s here – he stops and talks to the students and walks around from group to group. (T-‐12443)
Teachers in several schools reported that in addition to regular informal walk-‐throughs their principals frequently observe and offered feedback when invited by teachers into the classroom.
She’s always walking around the hall and popping in and check… She may do that two or three times a week. She also invited everyone at a staff meeting to invite her in to observe a certain lesson she wanted us to implement. So she asked to observe upon invitation. (T-‐11242)
La direction vient souvent dans ses classes. L’enseignante l’invite pour lui montrer comment elle se sert du tableau interactif. (E-‐22112)
While lack of an active presence in the classroom can reflect a more general pattern of principal distance from instructional leadership, teachers in most schools report that their principals are quite supportive in other ways, such as providing clear directions for improvement, participating in teacher team meetings, responding to requests for resources and facilitating professional development. Some principals rely more directly on the use of school board literacy and numeracy coaches, or even vice principals and school resource teachers, for classroom-‐based monitoring and support to teachers. Teachers also reported variability in the kinds of feedback (if any) provided by principals based on informal classroom visits. While teachers in some schools reported that they received no feedback on teaching and learning from principals’ classroom visits, teachers in other schools reported that their principals provided both positive and challenging group feedback during staff meetings and/or in teacher team meetings (e.g., Pathways/parcours, PLC/CAP groups) or in other forms of communication.
He has come in a few times. I got some feedback a few times. He hasn’t really given any ideas about teaching, not a lot of feedback. (T-‐11241)
She does come in and observe – it’s nice –there’s notes at the end of every week that highlight things we need to work on. This is more procedural. And she writes about things she’s noticed in classrooms. Motivational to know what is going on in others classrooms and I think maybe I could try that to. (T-‐11112)
She will come in and she does curriculum walkthroughs and sometimes she will orally say oh I like the lesson you did or this looks effective. But normally once a week she will write to the whole staff and indicate on her curriculum walk-‐through I saw this

143
percentage of people trying this and she always will indicate to us as a group here is what I saw and here is what you might think about or another strategy to try. (T-‐11444)
Teachers in a small number of schools reported that their principal provided individual as well as group feedback on teaching during or following informal walk-‐throughs.
Fait des visites hebdomadaires dans la classe pour observer et fait des commentaires par la suite. Aime voir les stratégies en lecture surtout le modelage et les pratiques guides, les pratiques coopératives. (E-‐22415)
She’d pop in the classroom and sit in on a lesson with the kids...when I’m in the Guided Reading table, she’d be part of the lesson, so kids see her from a different light. She’s definitely involved. She definitively provides feedback and suggestions to work on. She is very visible in the classroom. To be honest I haven’t had someone in my classroom as much. (T-‐12323)
Principals who provided individual feedback and suggestions were typically recognized and valued by their staff for their expertise in related areas of curriculum and instruction (e.g., literacy, math). One, for example, had previously worked as one of the Board’s literacy coaches. It would be impractical to expect all principals to attain that level of instructional expertise. A more common strategy reported by principals is to facilitate teacher access to external instructional coaches or to in-‐school expertise (e.g., resource teachers, vice principals, other classroom teachers with appropriate expertise). Principal turnover is a common occurrence in schools, and these schools were no exception. Principals in 12 of the 22 schools were in the first to second year of their appointment to that school. The implications of principal succession for instructional leadership were not predictable from school performance. In five of these schools teachers reported that their new principals were more active in classrooms and conversations about teaching than their predecessors. In three schools they reported the opposite. In one school teachers said the current principal continued the laissez faire approach of her predecessor in regards to the classroom. In another school, teachers reported that classroom visits and evaluation under a new principal had subsided after an intense Ministry and Board directed Turnaround school phase (though the school was still classified as low performing in our sample). Principal engagement in informal classroom visits appeared to be dependent on individual principal leadership style and expertise and was not clearly associated with differences in school performance or socio-‐economic characteristics of students/families served.

144
5.5.1 Principal Walk-‐throughs in High Performing Schools All principals and teachers in the 11 high performing high SES schools indicated that the principals maintained high visibility in the school, though that does not necessarily extend to classroom visitation. Even within this small sample of schools the principals clustered into three groups: principals who rarely visited classrooms (four schools); principals who regularly visit classrooms, but with little interaction with students or teachers (two schools); and principals who regularly walk through classrooms and who observe and talk to students about what they are doing and learning (five schools). Teachers also reported variability in the kind of feedback (if any) provided by principals based on informal classroom visits. In six schools teachers reported that their principals provided both positive and challenging group feedback derived from informal classroom visits during staff meetings and/or in teacher team meetings (e.g., Pathways/parcours, PLC/CAP groups). In one of these schools, teachers said the principal made comments in a weekly letter to staff, including positive comments as well as comments about expected teaching and learning activities not observed. Only one high performing school teacher reported that their principal provided individual feedback on teaching associated with informal walk-‐throughs. Regular informal classroom visitation by principals was reportedly less prominent in the high performing French language schools. Francophone school teachers, however, highlighted the participation and support of principals in team meetings (parcours/CAP, Carrefours) where improvement goals and progress are discussed on an ongoing basis, as well as principal facilitation of visits by Board instructional coaches. Among six high performing schools with recently appointed principals, teachers in three schools reported that their prior principal spent more time in classrooms and gave more feedback to teachers. Teachers in two of these schools said their new principal was more visible and active in classrooms than the predecessors. The teachers in the sixth school (a French language school) did not comment on any change in classroom visit practice under the new principal. Another principal who was not new reported that she reduced the frequency of walk-‐throughs as she gained confidence in teachers to implement expected practices given the schools’ generally positive academic results, and due to teacher union concerns about the purposes of her visits. A common theme across the high performing (high SES) schools was that principals trusted their teachers…
La directrice circule en salle de classe juste pour dire bonjour. Pas de visite dans les classes sauf pour les évaluations des enseignants...(Direction) nous fait confiance. (E-‐22111)

145
She pops in. She looks to see what is going on. She’s come a few times this year... I think she has trust and faith in us that we’re doing our job and that is why I think she’s probably not coming in there once a week or what not. (T-‐12113)
…to teach effectively and to comply with expectations for professional practice in the classroom and teamwork (e.g., use of mandated programs, teaching and assessment methods, use of data to inform instruction decisions), and supported them in doing this (resources, PD, etc.). 5.5.2 Principal Walk-‐throughs in Low Performing Schools Among the 11 low performing schools, we observed similar variations in principal monitoring of teaching and learning through the practice of informal classroom visits or walk-‐throughs: those who do rarely visit classrooms (except for formal teacher evaluation purposes) (five schools); those who drop by classrooms quickly to observe and say hello (two schools); those who regularly visit classrooms and interact with students and teachers (four schools). Some principals (4/11) say that they actively facilitate access to in-‐class support by board instructional coaches in lieu of or with their own visits. In contrast to the high performing schools, we noted some differences in reported principal actions associated with school SES in low performing schools. Three of four principals that teachers characterized as making no classroom visits were from high SES low performing English language schools (one from a low SES English language school).
I don’t feel supported at all by the principal. She has never been in my room except to borrow a pen. She has never seen me teach. (T-‐11224)
She does not come in. She’s a lovely lady and I’ve asked her to come in, but she’s very very busy. She is not a wanderer or will pop in to look at the walls or to see what is going on. (T-‐12233)
She would expect that I’m doing my job which is what I need to do. She never pops in my classroom. She might pass by the children’s work and say what a nice display, but she never comes in or gives feedback. (T-‐11434)
According to teachers, this absence of visibility in classrooms reflected a general perceived lack of instructional leadership (direction, support) in three of those low performing high SES schools. On the other hand, teachers from five of the low performing schools described their principals as instructional leaders who frequently visited their classrooms and who provided both individual and group feedback based on their observations.

146
Walk-‐throughs and then report back to staff at a staff meeting. Instructional rounds about student work. Did it involve problem solving, group work, small group instruction? I didn’t see it. If you were doing it regularly I would have seen it. How can I include small group instruction in my classroom? (P-‐11444)
L’enseignante l’invite pour voir les présentations des élèves en différentes matières, ex. Récits fantastiques. Discussion par la suite durant un moment libre sur ce que la directrice a observé dans la classe. Directrice apporte toujours en élément pédagogique aux réunions du personnel mensuel. (E-‐22415)
Within this group, three were principals in French language schools (both high and low SES) and two were from the low performing low SES English language schools. Recent turnover in principals had occurred in six of eleven low performing schools. Teachers associated this with increased principal visibility in the classroom in two schools. In another low SES school, teachers reported that a former principal led the school through a Turnaround process that involved frequent and highly structured (i.e., checklists) evaluations of classroom practice by Board/Ministry consultants and school administrators. The intensity of classroom visits and feedback abated under the current principal, who remained highly visible and supportive (resources, PD), made frequent informal visits and chatted with students, but did not offer any feedback on teaching. In the fourth school teachers said that the new principal simply continued the laissez faire approach of the former principal. Teachers did not comment on change in principal walk-‐through activity in the other two schools. 5.5.3 Summary: Monitoring through Principal Walk-‐throughs In sum, the frequency and intensity of principal engagement in informal classroom visitations as a strategy for monitoring, reinforcing and supporting instructional practices aligned with school goals and expectations for teaching and learning is quite variable across the 22 schools. Not all principals do this, and in our sample, principals in high SES low performing schools were the least likely to engage in regular informal classroom visitations with feedback to teachers across the four categories of schools. A minority of the principals in the schools that we studied frequently visit classrooms and provide teachers with individual as well as group feedback and advice on teaching. The highest concentration of principals who combine classroom monitoring with direct intervention to guide and support instructional practice was in low performing schools, particularly those serving low SES school communities. Thus, direct instructional leadership actions of this sort are not necessarily associated with higher student achievement levels. It may be that school district authorities are simply more likely to appoint principals who have these skills in low performing schools serving high poverty communities. Paradoxically, we find higher concentrations of principals at both the high and low extremes of instructional leadership behavior in regards to classroom visits in the lower performing schools. In the remaining schools principals commonly drop by classrooms for regular informal visits, but limit

147
communication on their observations to group settings, such as staff meetings, teacher team meetings and/or principal memos to all teaching staff. Based on their observations, they are more likely to facilitate teacher access to expertise from other teachers (classroom, resource) or Board instructional coaches than to provide this kind of pedagogical advice and support on their own.

148
Chapter 6 -‐ Parent Involvement
6.0 Introduction The importance of parental involvement for student engagement and learning at school is widely acknowledged in the literature on school effectiveness. Strengthening parental involvement is a common priority in schools, particularly in elementary schools with histories of low or declining academic performance, where educators are more apt to identify parent expectations and support for student well-‐being and learning as key factors along with their own efforts in the classroom and school to improve student learning. Notwithstanding research on this topic, there remains a lack of clarity and consensus on what school personnel should do to encourage, enable and sustain effective school-‐wide parent involvement in the home and in the school, especially in schools where for one reason or another teachers and principals perceive that parental involvement is weak. In this study we asked principals, teachers and parents (Parent Focus Group) in each school about community characteristics that affect student learning, about the nature of parent involvement and actions to involve parents as partners in school improvement and student learning and about significant challenges to parent involvement. The teacher survey also included items about teacher perceptions of parental involvement in their schools.
6.1 Parent involvement: Teacher survey The teacher survey included five items that assessed the strength of teacher agreement with indicators of positive parental involvement their school, including: parent support for school efforts to teach their children, parent influence on school improvement plans, parent volunteer activity in the school, parent understanding of goals for student learning and school efforts to provide parents with information to help their children succeed in school. Overall, teacher responses indicated significantly more positive levels of parent involvement in the higher performing schools. There were significant differences between the high and low performing school groups, particularly in regards to teacher perceptions of parental support for the instructional program and parent volunteerism (moderate effect sizes). The reported degree of parent understanding of student learning goals was also significantly stronger in the high performing schools, but the effect size was small. Since this item only measures teacher perceptions of parent understanding that small difference should not be interpreted as a strong indication of differences in parent understanding of student learning goals between the two categories of schools. One cannot jump to conclusions about the

149
relationship between parent involvement and school-‐level student achievement levels from this finding. The practical challenges of parental involvement in low SES schools are presented and discussed in greater detail based on the interview data in this Chapter (6.2). While no one will argue that positive parental involvement does not contribute to student achievement, the survey findings do not suggest that high levels of student achievement are dependent upon high levels of parental involvement. The survey findings also indicated that high levels of parental involvement cannot simply be predicted by parent SES levels. Parent support and volunteerism were significantly lower in the high SES low performing schools when compared to the high SES high performing schools. This pattern is explored in the interview findings. Table 6.1 Parental involvement 1. Parents support the school’s instructional efforts. 2. Parents have significant influence on directions and plans for school improvement. 3. Parents and community volunteers play an active role in the school’s program. 4. Parents are given information on how to help their children be successful at school. 5. Parents have a clear understanding of the goals for student learning.
High Performing
Schools Low Performing
Schools Effect Size
M SD M SD d ParInv 1 4.77* 0.88 4 1.45 0.64 ParInv 2 3.85 1.18 3.65 1.44 0.15 ParInv 3 4.37* 1.27 3.68 1.54 0.49 ParInv 4 5.00 0.78 4.85 0.88 0.18 ParInv 5 4.42* 1.01 4.10 1.12 0.30 Scale: 1 – completely disagree to 6 – completely agree *Significantly higher mean, p < 0.05
Two additional findings emerge from the teacher survey data. First, parental influence on school improvement decision-‐making at the schools was rated lowest overall for all categories of schools. Second, teachers in all categories of schools reported that their schools actively provide information to parents about ways of helping their children to succeed at school.

150
6.2 Parent involvement: School Interviews In this section we consider the school interview findings from two perspectives. First we look at what principals, teachers and parents say schools are doing to foster and support parent involvement. Then we examine what they say about the influence of parent/family characteristics on parent involvement in the schools. We propose that parent involvement may be less a result of actions taken by school personnel than a reflection of existing parent attitudes and beliefs about education and the school and practical circumstances that inhibit or facilitate involvement. Joyce Epstein’s classic typology of six types of parental involvement provides a useful comparative framework for examining and discussing school actions to influence parental involvement (Epstein 1995).
(1) Parenting: Help all families establish home environments to support learning. (2) Communicating: Design effective forms of communication to reach parents. (3) Volunteering: Recruit and organize parent help and support. (4) Learning at home: Provide ideas to parents on how to help child at home. (5) Decision-‐making: Recruit and train parent leaders to take part in school decision-‐making
(PTA, School Councils). (6) Collaborating with community: Identify and integrate resources and services from the
community. Our aim here is not to question the actual or potential value of parental involvement per se, but rather to look across our school sample to see whether and how parental involvement differs between high and low performing schools, and schools in the differing demographic contexts (family income and education levels, linguistic and cultural diversity, etc.). We begin by reviewing some patterns of findings across the entire sample. Then we look at findings that distinguish parent involvement activities of high and low performing schools. In the subsequent sub-‐section we analyze how community characteristics shape parent involvement. Schools across our sample implemented a standard array of actions to encourage and support positive parent involvement in children’s education at school and at home. These included:
Communication: sending regular school/classroom newsletters home, sending assignment agendas home for parent signatures, formal parent/teacher interviews, personal communications through telephone calls or casual encounters, curriculum nights and open-‐door policies to invite parent concerns.

151
Volunteering: inviting and welcoming parents to assist in the classroom, and to assist and/or participate in school-‐level events (e.g., social activities such as picnics, school carnivals, student awards ceremonies), classroom field trips, school nutrition programs (snacks, breakfast), fund-‐raising activities (e.g., pizza lunches) and extra-‐curricular activities (sports, clubs). Learning at home: holding Literacy Nights and/or parent workshops to educate parents about how to support learning at home (e.g., reading at home), sending information to parents about student assignments/homework through student agendas and other media (e.g., newsletters, email) and providing suggestions/resources (e.g., worksheets) with ideas for how to help at home. Decision making: encouraging parent participation on School Councils. Community partnerships: cooperating with public service agencies such as the police, fire departments, public health agencies and local community service groups in the delivery of routine programs and services.
In some areas of parent involvement the variability across schools reflected differences in the socio-‐economic characteristics of the communities served, regardless of school performance. For example, none of the principals, teachers and parents interviewed in the high SES schools talked about the provision of parent support or education programs focused on basic needs of students and related to social challenges often associated with poverty (e.g., compensatory nutrition or clothing programs, community physical and mental health services, access to counselling to assist parents in obtaining public services related to employment, welfare and health care). Parenting as a focus of parent involvement activity was limited to schools in the low SES groups. Social factors influenced the nature of school-‐community partnerships, independent of school performance and family SES levels. Catholic schools maintained relations with their local parish church for religious education. French language schools interact with Francophone community organizations and services where possible (some French language schools have less access to Francophone community and cultural services outside school). The level of parent volunteerism in the classroom reported was low across all schools and, when mentioned, typically described as minimal and limited to very few parents. This finding is consistent with responses about parent volunteer activity from the teacher survey. As mentioned below, the only exception was in the high SES high achieving schools. Volunteer activity in the classroom, however, is independent of other kinds of parent volunteer activity.

152
In the two categories of schools, principals, teachers and parents made no distinction between provincially mandated School Councils and traditional Home School Associations. They simply referred to “parent councils” or “school councils” when talking about parent involvement in school decision-‐making. The main focus of parent involvement in decision-‐making in all schools centered on fund raising activities and special events. With the exception of a few schools from the high SES high achieving school group as described below, no one reported parent involvement in academic decisions and school improvement planning in their schools. There was little evidence that parents were acting in an advisory capacity on significant school improvement decisions as envisioned in Ministry’s School Councils policy. This finding is consistent with the teacher survey responses about parent influence on school improvement plans. In many schools we were told that parent involvement in school decision-‐making is limited to a few activist parents, and does not reflect parent involvement on a wide scale in the school. Family socio-‐economic status is a significant factor affecting parent involvement in schools. For that reason, we have organized the presentation of interview findings differently from other sections of this report. We present findings from high SES and low SES schools, and consider differences between high and low performing schools within those two broad groupings. The differences between high and low performing schools in actions taken by principals and teachers to involve parents are summarized at the end of this section (6.2.3). In the two sections that follow we examine how the actions of schools reflect and respond to the variable characteristics of the communities that they serve. 6.2.1 Parent Involvement Activities in High SES schools School staff and parents in all the high SES schools characterized parent-‐school relations as positive. Staff from six schools referred to annual parent satisfaction surveys required by their respective school boards.
A recent survey to parents showed good results… parents were satisfied… they feel their children are safe, they feel connected to the school and welcomed. (P-‐11111)
The generally positive survey responses may explain, in part, why we did not hear more about strategies to involve parents in efforts to improve student learning in the low performance high SES schools. Furthermore, respondents from the high SES schools said that parent-‐teacher interviews and school events were well attended. In all high SES schools, regardless of performance level, school personnel did not report that the schools were providing or facilitating access to the provision by the board or external

153
agencies of any parenting support or education programs focused on basic needs of students and families. School personnel from all high SES schools reported the standard array of communication strategies with parents: school and classroom newsletters, curriculum nights, scheduled and impromptu parent/teacher meetings, student homework agendas. School personnel and parents in the high SES schools also talked about the growth of digital communication through school and classroom websites and email. Beyond these similarities in school-‐parent communication activities, however, some differences did surface in how principals and teachers from high and low performing high SES schools characterized their communication with parents. Teachers in all five high performing high SES schools said that they send weekly or bi-‐weekly messages to parents informing them of homework assignments and learning projects. Teachers in most (4/5) of the high performing schools emphasized that parents have high expectations for their children’s learning, are knowledgeable about Ministry expectations for curriculum and student learning, talk with other parents about what is happening in classrooms, and do not hesitate to question teachers about the educational experiences provided to their children.
Parents bien impliqués mais très exigeants comme communauté – questionnent tout. (E-‐22112) They are very involved parents; they know what is happening in the classroom… on top of learning and lots of demands on you in terms that you’re exactly following the curriculum. They are well versed in that… they know what the expectations are at every grade level; they take it upon themselves to know it. They are involved in terms of providing support to students. They know what they’re working on and what is coming. They want to know about upcoming projects… nice for the support but pressure if it is not an A or a B; your fault if they are not meeting. (T-‐11112)
Communication with parents is two-‐way and is often focused on matters related to student learning. Teachers experienced this as support, but also as pressure. Teachers in low achieving high SES schools also reported including information about student learning activities in school and classroom newsletters. In contrast to the high performing schools, this kind of communication was described as one-‐way. Nor did school staff attribute high levels of parent knowledge and interest in curriculum and teaching to their parents. They did commonly talk about “open door policies” to encourage parents to communicate any concerns.
Parents have the freedom to roam the halls… it’s very free for parents to walk through. (T-‐11241)

154
Ce sont toujours les mêmes parents qui sont impliqués mais il y a de l’ouverture pour que tous les parents soient impliqués; s’il y a un besoin, les parents sont à l’aise d’en discuter avec le personnel enseignant ou la direction. (D-‐22213)
Reliance on that approach may not generate much interaction around teaching and learning outside of events like parent-‐teacher interviews. As described later, high SES schools were not immune to issues of diversity in the school community (e.g., recent immigration, non-‐English or non-‐French speaking parents). The challenges this may present for home-‐school communications, however, were only highlighted by the principals and teachers from the low achieving high SES schools. One English and two French language schools reported obstacles to parent communication associated with language barriers.
Language issues… sending things home in multiple languages more often. It happens, but not enough. (T-‐11241) Communication écrite en français avec quelque fois une note en anglais au bas de la page. (E-‐22213) Les directives administratives du conseil spécifient bien que la communication doit se faire en français en tout temps, mais par contre les annonces pour l’inscription dans nos écoles sont bilingues et cela donne une fausse représentation de nos services. (PAR-‐22221)
School policies vary in the French language sector. One of the schools sends bilingual messages to parents. The other adhered to a French only policy. Two of the English language high SES low performing schools had also recently been amalgamated with neighboring schools that were closed. The school principals reported a preoccupation with facilitating communication between the two groups of parents and with community building through school social activities. Principals, teachers and parents from the all high SES schools reported high levels of parents volunteering at their schools though this is mainly described in terms of assistance with extra-‐curricular activities (e.g., field trips, coaching sports, school musical), with organizing and attending school activities (e.g., school picnic, school shows, award ceremonies to recognize student leadership and good citizenship, charity events) and fund-‐raising activities (e.g., pizza days).

155
They’re involved in parent council and the hot lunch program… parent volunteers run that. They’re involved through student-‐led conferencing and involved by volunteering for different activities especially in primary grades… there’s a lot of parent council initiated activities like movie night; students come to movie night with their parents. (T-‐11242) Parents help with volunteering and fundraising but not with learning… they do not have much input in learning goals, etc.; the teachers do teaching without too much input from parents. (T-‐12233) Parents bien impliqués à l’école; ils organisent des activités et accompagnent dans les sorties… ils viennent aussi dans la classe pour aider avec la lecture. (E-‐22111)
Teachers in three of the high performing high SES schools highlighted the presence of parent volunteers in the classroom, particularly to support reading at the primary level. In two of these schools, teachers reported that the principal had to intervene to ensure that eager parents were not interfering with teachers’ control of classroom activity. In the other high performing and all low performing high SES schools teachers stated that parent volunteers to assist in teaching and learning activities at the classroom level were uncommon. A variety of factors were said to inhibit parent participation in the classroom: distance to the school was an issue in one rural school and in one recently amalgamated school where one group of families were not from the immediate neighborhood; lack of parent proficiency in the language of instruction and conflict with parent work schedules. Principals and teachers in all five high SES high performing schools emphasized the high levels of parent interest and support for extending students’ classroom learning at home (e.g., homework completion, reading at home).
Bonne implication des parents; très présents à l’école… c’est très important pour moi de voir les parents à l’école… et il y a un bon appui à la maison. (E-‐22112)
We maintain strong connections to parents… newsletters, emails, etc. because as a parent, your need some clarity on how to support and help your child. (P-‐11111)
In addition to communicating with parents about student assignments using homework agendas that parents are expected to read and sign, principals, teachers and parents from these schools cited school efforts to encourage parent involvement in learning at home by scheduling parent education events and by sending regular (e.g., weekly) messages and even worksheets to parents with information about class assignments and homework and how they could help at home. As previously noted, they emphasize that communication is two-‐way; parents actively

156
asked about what their children and learning and how they could help. It was not just about teachers sending information in the hope that parents might actively assist with children’s learning. Principals, teachers and parents from the low achieving high SES schools had little to say about parent support for student learning at home. Generally, they reported that parents were supportive of homework completion (monitoring, helping and communicating with teachers). They did not directly associate this with school/teacher interventions in support of parent involvement at home. Principals and teachers from two schools stated that students came to school with a lot of background knowledge related to family SES factors (e.g., high parent education), though in two other schools the teachers expressed concerns about students’ basic skills. Three English language schools stated that they held literacy nights to inform parents about the literacy program and ways to support children’s reading and other literacy-‐related activities at home. As in the higher performing schools, teachers in several high SES low performing schools (4/6) reported that information was provided in school or classroom communications (e.g., newsletters, agendas, weekly messages) about literacy and numeracy activities and expectations to keep parents informed.
We attempt to offer opportunities to make parents more knowledgeable about their child’s learning (articles in newsletters, guest speakers focused on literacy and numeracy). (P-‐12233)
The difference between high and low SES high performing schools appears to be less the strategies employed by schools to support parent involvement at home, than parent initiative and response. As with home and school communications in general, principals and teachers in some high SES schools reported challenges with parent’s lack of English or French language proficiency that inhibited direct assistance with children’s learning at home. These included a couple of schools experiencing recent influx of new immigrants (e.g., Croatian in an English medium school, Egyptian in a French language school) as well as the English dominant parents in many Francophone and French Immersion schools. This obstacle, however, is not necessarily indicative of lack of parent concern for student learning at home in the high performing schools. Teachers and principals in high SES schools were more likely than in low SES schools to talk about the opportunities that parents provide for children’s participation in extra-‐curricular learning experiences (e.g., sports, clubs, cultural events, travel) at home. These schools offer co-‐curricular enrichment activities at school, but not to compensate for lack of opportunity at home.
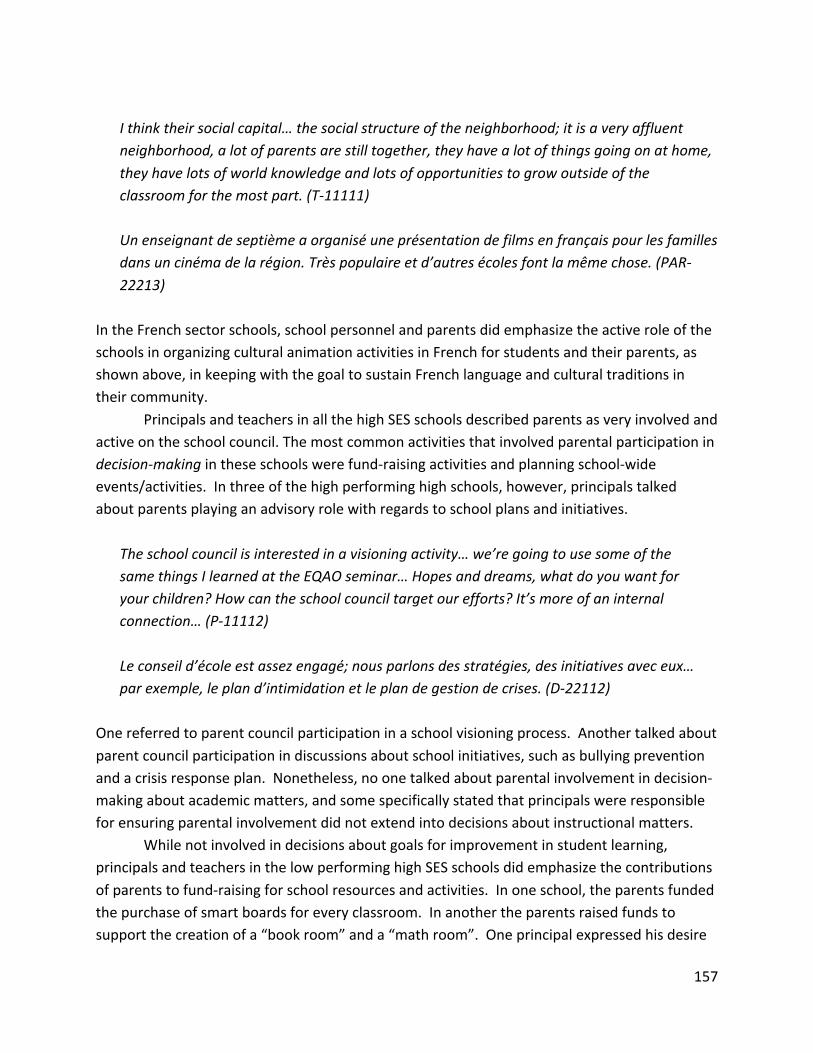
157
I think their social capital… the social structure of the neighborhood; it is a very affluent neighborhood, a lot of parents are still together, they have a lot of things going on at home, they have lots of world knowledge and lots of opportunities to grow outside of the classroom for the most part. (T-‐11111) Un enseignant de septième a organisé une présentation de films en français pour les familles dans un cinéma de la région. Très populaire et d’autres écoles font la même chose. (PAR-‐22213)
In the French sector schools, school personnel and parents did emphasize the active role of the schools in organizing cultural animation activities in French for students and their parents, as shown above, in keeping with the goal to sustain French language and cultural traditions in their community. Principals and teachers in all the high SES schools described parents as very involved and active on the school council. The most common activities that involved parental participation in decision-‐making in these schools were fund-‐raising activities and planning school-‐wide events/activities. In three of the high performing high schools, however, principals talked about parents playing an advisory role with regards to school plans and initiatives.
The school council is interested in a visioning activity… we’re going to use some of the same things I learned at the EQAO seminar… Hopes and dreams, what do you want for your children? How can the school council target our efforts? It’s more of an internal connection… (P-‐11112) Le conseil d’école est assez engagé; nous parlons des stratégies, des initiatives avec eux… par exemple, le plan d’intimidation et le plan de gestion de crises. (D-‐22112)
One referred to parent council participation in a school visioning process. Another talked about parent council participation in discussions about school initiatives, such as bullying prevention and a crisis response plan. Nonetheless, no one talked about parental involvement in decision-‐making about academic matters, and some specifically stated that principals were responsible for ensuring parental involvement did not extend into decisions about instructional matters. While not involved in decisions about goals for improvement in student learning, principals and teachers in the low performing high SES schools did emphasize the contributions of parents to fund-‐raising for school resources and activities. In one school, the parents funded the purchase of smart boards for every classroom. In another the parents raised funds to support the creation of a “book room” and a “math room”. One principal expressed his desire

158
to shift the focus of his school council from fund-‐raising to things like literacy nights and anti-‐bullying programs.
The school council does a lot of fundraising but I’ve tried to get them focused on other things like anti-‐bullying programs, parent involvement and literacy nights. (P-‐11224) Très peu de parents sur le conseil d’école… ils prennent des décisions sans vraiment être représentatifs. (E-‐22221)
In three of the six low performing high SES schools principals and teachers reported that parent participation on the school council was limited to a small but vocal and active group of parents. Given the low performance of these schools relative to other high SES schools, the absence of obvious pressure from parents to raise academic performance seems noteworthy, and actually distinguishes these schools from the high performing high SES schools where parents reportedly actively questioned school performance and practices despite high scores. In the low SES high performing schools community partnerships tended to focus on providing community social services to students and their families. This was not entirely absent in the high SES schools, particularly those that had pockets of low income families in their student population. However, school personnel in several high SES schools also talked about collaboration with community groups to contribute to worthy charities and causes (e.g., food bank, new immigrant reception, cancer research). This does distinguish these schools in that the direction of community partnerships is towards helping the community, as much as the community helping the schools. 6.2.2 Parent Involvement Activities in Low SES Schools School efforts to provide programs and services related to Epstein’s category of parenting were commonly highlighted by school personnel in the low SES schools. Two low performing low SES schools, for example, offered parent education programs in partnership with board-‐funded school counselors and community agencies and that were focused on parenting topics like nutrition and behaviour management. Three schools in this group provide supplementary nutrition programs (breakfast, snack) in order to ensure that students’ basic nutritional needs are fulfilled. Strictly speaking this is not parental involvement, rather school efforts to compensate for perceived deficiencies in satisfying students’ nutritional needs at home.
On offre divers programmes pour répondre aux besoins d’apprentissage et aux besoins primaires de tous, car ont à des familles de divers niveaux socio-‐économiques et beaucoup d’élèves ont grands besoins… ont offre le programme « partir d’un bon pas »,

159
« bien se nourrir pour mieux apprendre »… des diners chauds, des collations santé. (D-‐22314) We have a great social worker here… for example, she finds summer camps for kids who are really needy. (P-‐11434)
Also, several of these schools offered on-‐site counseling and health services (e.g., social workers, school nurses), as illustrated in the quote above, to assist parents in obtaining community social services related to basic needs (e.g., employment, welfare, health) and to advise teachers about the needs of particular children and families. These services are provided by the school board, often in partnership with local community agencies (e.g., Children’s Aid). Parenting support in the low SES high performing schools is similar to that reported in low SES low performing schools – supplementary nutrition programs and access to counseling and health services. Principals and teachers in high and low performing low SES schools describe a similar range of standard school/teacher-‐parent communication strategies that included: parent/teacher interviews, sending homework agendas home to be reviewed and signed by parents, school newsletters and personal communication through phone calls or casual encounters with parents. A notable difference between high and low performing low SES schools is that the patterns of communication reported in high performing schools are described as more responsive and two-‐way. School personnel in the low performing schools were more likely (3/5 schools) to report low levels of parent participation in parent/teacher interviews and to say that parents do not sign student homework agendas.
I think we could do more with parents to educate them, to get them on board… it’s tricky with homework programs… I have a reading program in my class and that is basically all the homework they get unless they don’t finish something. They have a reading log and many parents forget to sign the planners and don’t check the bags or don’t have time to read with their children… (T-‐11434)
They attributed communication difficulties to such things as lack of English/French language proficiency on the part of parents, parent employment issues (working multiple jobs, unemployed), students living with care-‐givers other than parents, parent beliefs that academic matters are mainly the teachers’ responsibility and negative parental attitudes towards the school. None of these schools reported any particular strategies to compensate for reported communication issues. In contrast, teachers from the high performing low SES schools (5/6) reported that parent/teacher interview nights are well attended and that teachers and parents communicate

160
regularly with notes on individual student progress and behavior in the homework agendas and in phone conversations as needed (3/6). In some of these schools, we were told that teachers by class or by grade level send weekly or bi-‐weekly messages to parents describing current learning activities and expectations.
Bonne participation de la plupart des parents... La majorité vient à la soirée des bulletins pour rencontrer les enseignantes. (E-‐22314) Their parents are very supportive though… even though they can’t speak the language or help with math they are very strict and their homework is always done and they want what is best for the child and keep contact and write notes. (T-‐12323)
Overall, it appears that in the high performing low SES schools teachers do more to communicate with parents on a regular basis about what students are learning in schools, and about their ongoing progress in ways that are not just limited to curriculum nights, scheduled parent/teacher interviews and report cards. Principals and teachers from four of these six schools also described specific measures (e.g., interpreters, bilingual messages) taken to ensure that school communications were accessible to parents with limited English or French language proficiency.
With immigrant parents… there is a language barrier and sometimes it is hard to communicate. However, we have interpreters galore for parent-‐teacher interviews… I’m not sure where they come from, but they are external to the school. Also, bilingual staff members will help with translation. (T-‐11321)
Teachers in two of the high performing low SES schools said that parents at their school expected to be kept abreast of student work and performance on an ongoing basis. In sum, communication with parents about student learning and academic progress in the high performing low SES schools is persistent and reciprocal. Finally, principals and parents in several schools emphasized the invitational and personalized nature of communication with parents. Parents are contacted individually when their children take part actively in school events. In these respects, home-‐school communication in the high performing low SES schools is similar to that reported in the high performing high SES schools, except the use of digital communications. Principals and teachers reported minimal involvement of parents volunteering in classrooms. Parent volunteer assistance with field trips, special programs (sports and clubs, supervision of lunch/snack programs), fundraising, or special events (e.g., holiday events, school carnivals and pizza lunches) was variable across these schools, but typically limited to a
161
small group of parents. In one school teachers reported that teachers did their own fundraising activities with no parent help. Despite solid parent support for the school and for children’s learning at home, principals and teachers in the low SES high performing schools also reported that parent volunteerism in the classroom was either absent or limited. They attributed this to conflicts with parent employment (both parents working, single parent working) and to low English or French language proficiency in schools with high immigrant populations or serving English-‐dominant French language school families. Even in the low SES high performing school with the strongest evidence of parent engagement for student learning and fundraising for purchase of school materials (e.g., smart boards, playground equipment), the incidence of parent volunteers in the classroom was reportedly quite low.
Ont appui avec les devoirs, ont appui les enseignants… Le conseil d’école est très impliqué dans le prélèvement de fonds qui ont permis les tableaux blancs interactifs et qui ramasse maintenant des argents pour des structures de jeux pour les enfants. (PAR-‐22324) Our school takes advantage of every single resource we can get our hands on. Volunteers are welcomed and trained to provide focused and meaningful support for our struggling kids… these volunteers are not parents; they come to the school via TDSB’s volunteer program… volunteers also provide leadership in other projects… nutrition clubs, book clubs, house leagues, field trips, etc. The school also takes advantage of nursing students, co-‐op students and student teachers. (P-‐11321)
In four of these schools, as illustrated with the quote above, school personnel compensated for the barriers to parent volunteer help in the classroom by using school volunteer programs provided by their school boards and community agencies. External volunteer assistance was not reported in the low performing schools. Respondents from five of six high performing low SES schools said that parent participation in field trips, school events and fund-‐raising was positive, but inhibited by parent work schedules and language barriers. Principals and teachers in some of the low performing low SES schools described specific programs or strategies designed to stimulate and support parent involvement in children’s learning at home beyond the supervision of homework completion. These included holding Literacy Nights to introduce activities that parents can use to help with reading and writing at home and implementing programs with food incentives to promote parent involvement in children’s reading and writing (e.g., Books for Breakfast, Write for Bite). These kinds of programs were typically offered with central office support. Parental response was mixed. Within the same board, the principal and teachers in one school reported that the gym was full on Literacy Nights and that 250 parents and grandparents were involved in a Books for

162
Breakfast program, while the principal and teachers in another school reported low attendance to Literacy Nights, that only four or five students and parents participated in a Write for Bite program, and that there was little use by parents of a school resource centre for parents to sign out books and learning games.
J’ai tenté d’avoir des parents bénévoles pour la lecture mais je n’ai pas encore réussi. Je poursuis. (D-‐22415) We have literacy nights and very few parents come in… you call them and they say they’ll take care of it but no change; that’s the big one for me. We are in a low income neighborhood but I’ve taught in schools with low income areas and the parents have been very supportive so I don’t think that is a key role. (T-‐11444)
Teachers from most of these schools reported frustration at the perceived lack of or mixed support for homework supervision and for student learning at home. They attributed this to parent language proficiency, employment issues, and/or lack of parent interest. As previously noted, parents in the high performing low SES schools are reportedly well informed, interested and communicate with teachers individually about their children’s homework assignments and academic progress. Most schools invited parents to take part in Literacy Nights, “book clubs” and similar events designed to let parents know what their children were learning and how they could help at home. However, as with the low performing low SES schools, parent attendance at these events was variable across the high performing low SES schools.
Now we have free play groups for our groups, Book Worm Club –Zero to Six-‐ offering literacy to our families, swimming program, grades one to eight… and now we’re looking at a youth program for children for sports, a homework club for the community… (P-‐11322)
Principals and teachers talk about the difficulties that parents had helping with homework due to low English or French language proficiency, lack of prior academic knowledge, lack of time due to employment circumstances and even the practical challenges of monitoring and helping each child in large families. Schools and parents in many of these schools compensated for the inability of parents to provide sufficient direct support for homework completion. Principals, teachers and parents in three high performing low SES English schools with large immigrant populations said it was not uncommon for parents to seek tutoring services for their children after school, perhaps replicating norms of tutoring common in their home countries. Principals and teachers in two of these schools organize teacher-‐led homework clubs during or after

163
school hours to ensure that kids have access to help, or include homework tips for parents in student agendas and/or weekly newsletters on a regular basis. One French language school stood out in this group. The community was majority French language and the proportion of families where one parent does not speak French and English as the dominant language at home was low in comparison to other Francophone schools in this study. Staff in this school reported multiple ongoing strategies for keeping parents informed about student assignments, homework and progress, including daily agendas, bi-‐weekly class newsletters and the creation of a popular homework blog with ideas about how to help students complete assignments.
Notes à la maison, invitations à l’école pour des activités et expositions, par exemple, études sociales, sciences, concours oratoire… À propos des devoirs, de la consolidation seulement car les élèves devraient avoir tout ce dont ils ont besoin pour faire le travail à la maison; les enseignants et enseignantes s’assurent de donner aux élèves les outils pour réussir les devoirs à la maison. Blog à l’intention des parents pour les appuyer et démontrer l’enseignement avec des exemples de leçons et d’explications données aux élèves. Les parents sont tenus au courant des progrès et des accomplissements de leur enfant… bulletins, notes, etc. (D-‐22324)
In sum, it appears that parents in the high performing low SES schools more so than parents in low performing low SES schools were interested and vigilant about homework assignments and completion, well informed about those expectations by the school and sought ways to collaborate with the school to compensate for the challenges of parent support at home. Principals, teachers and parents in low SES schools make little or no distinction between parent involvement in required school councils and traditional home and school associations. In most of the low SES low performing schools they reported that parent participation in school decision-‐making is limited to a handful of parents.
The school varies… but it’s generally small. About eight parents… (T-‐11434) Although current representation on the school council is not truly representative of the school community, the principal has provided interpreters for the meetings which has increased participation from the more underrepresented communities. (T-‐11321)
An effort was made in some schools to involve more parents by scheduling open meetings and providing incentives (e.g., food, transportation, child care, interpreters) to encourage attendance. None reported parent involvement in academic decisions and school improvement planning in their schools. The main focus of parent involvement in decision-‐making centered on fund raising activities and special events. Principals and teachers in two low performing low

164
SES schools reported that school activities that depended on parental involvement were cancelled or curtailed due to low participation of parents in planning and organizing those events. The picture of parent participation in school governance in the high performing low SES schools did not differ substantially from that in the low performing low SES schools; however, the parent groups in the high SES low performing schools were described as providing more active support for school events and fund raising activities than those in the low performing low SES schools. Principals and teachers in both the low SES low and high performing schools highlighted three types of school-‐community partnerships: (1) collaboration with social services agencies that help students and families deal with issues often associated with high poverty levels (e.g., physical and mental health problems, accessing and dealing with community social and legal services, child care, offering positive after-‐school experiences); (2) assistance from community organizations that offer resources to support student learning (e.g., volunteer services, funding for additional books and other teaching and learning resources); and (3) collaboration with local Catholic Church personnel for religious education and preparation for religious ceremonies (e.g., communion). School partnerships with social services agencies and community organizations to assist students and their families with basic needs were present in all the low SES schools.
On a de l’aide de l’équipe psycho-‐sociale, le centre de ressources familiales, le bureau de santé, le club d’Octogone, le club Optimiste, des projets du Ministère comme PICO et école en action, des liens avec d’autre conseils… je ne vois pas pourquoi on fermerait des portes; on gobe tout ce que le conseil nous offre! (D-‐22314)
The partnerships named tended to be arrangements negotiated at the central office level, though it was up to individual schools to take advantage of the opportunities. Some of these services were arranged in collaboration with school board social support counselors and workers. 6.2.3 Summary of Parent Involvement Activities Overall, we found that the schools engage in a fairly standard array of parent involvement strategies and activities, regardless of school demographics and performance levels. The analysis does highlight, however, a few patterns of variability in school efforts to engage parents in productive ways in support of their children’s education associated with our sampling frame. Most notably, communication between teachers and parents in high performing schools, regardless of SES level, tends to be more reciprocal and focused on matters of teaching and learning (e.g., homework, school assignments, student progress). In the low

165
performing schools, school personnel communicate information and implement activities intended to engage parents as partners in supporting children’s learning, particularly at home, but the parents are described as less responsive and less proactive in comparison to those in high achieving schools. In a related vein, principals, teachers and parents in the lower performing schools (particularly low SES) provided less evidence of measures taken by the school to address common obstacles to parent communication and involvement associated with language and employment-‐related barriers. Across all categories of schools the incidence of parent volunteers in classrooms was reportedly low and limited to a few parents where it did occur. Similarly, active participation of parents in school decision-‐making focused on student learning and academic programs was essentially absent across all categories of schools (except a few high SES high performing schools). School partnerships to provide or facilitate parent access to social and community services or to provide programs to compensate for perceived gaps in students’ basic needs (nutrition, health, clothing) were limited to schools in the low SES communities, regardless of school performance levels.
6.3 Parent Involvement and Community Characteristics The findings here concern parental involvement. Parental involvement, however, is shaped by the socio-‐demographic characteristics of families served by a school. It is not simply dependent upon what school personnel believe and do to involve parents in children’s education. Here we provide a comparative overview of the communities served by schools in our sample as described by school personnel and examine what principals had to say about how community characteristics shape parent involvement. The thesis of the argument presented is that parent involvement in a school is less determined by what the school does, but more by the prevailing parent attitudes and beliefs about the education of their children, and their dispositions and practical capacity for involvement. The views expressed in parent focus groups were consistent with those of principals and teachers. 6.3.1 Parent Involvement and Low SES Communities We classified schools by average family income level into two groups: low income (low SES), and mid to high income (high SES) as described in the methods chapter. Low family income is a common denominator for the low SES schools. It is inappropriate, however, to suggest that all low SES communities are the same. The communities served by all the schools classified in our sample as low SES schools were not necessarily homogeneous in terms of family incomes levels. The principals and teachers in four of the schools reported that their communities were split between low and middle to high income families, though the majority were low income families.

166
A wide mix of kids coming to our school from really low SES to middle of the road, a wide variety of cultural backgrounds… it’s great we have a wide variety of kids as well as the French and English strand here… it’s neat to see because the kids who come from the French are typically bused in and the others are all from this area… it helps to bring in more of a mix with the two strands and it’s cool for the kids to see and hear different languages on the announcements and in assemblies and in music. (T-‐11434)
One of these four schools was designated a dual track (K-‐3) English/French Immersion school three years before. The French Immersion program drew in students from higher income families who do not reside in the school neighborhood. The principal and teachers spoke mainly about the characteristics and challenges for student learning and parental involvement associated with the lower income families that predominate in the regular track. The origins of the socio-‐economic divisions in the other three schools were not clear from our interview data, but the low income families were in majority. The low income factor was reportedly compounded by socio-‐cultural and linguistic diversity in all but two low SES schools. Principals, teachers and parents from the English medium schools talked about a high incidence of parents and students for whom English is a second language. This was associated mainly with recent immigration and the presence of diverse cultural and linguistic backgrounds. Respondents from all but one low SES French language schools talked about the high proportion of exogamous families in their school communities, where one parent is Francophone and the other Anglophone, and where English is often the dominant language at home as well as in the community-‐at-‐large.
Les familles sont Francophones en grande partie mais une majorité des élèves viennent de familles exogames dont la langue première est l’anglais. (D-‐22415)
Low English or French language proficiency among parents affects parent communication with teachers, parent volunteering and parent ability to assist children directly with their homework. In the higher performing low SES schools, however, teachers commonly reported that despite the parents’ limited capacity to directly help with homework, these parents did monitor agenda books and ensure that homework was completed. In three of these schools teachers also reported that some immigrant parents made arrangements for private tutors to help their children with schoolwork.
Some parents say I can’t help but I’ll get a tutor… that shows me they are really making an effort. (T-‐12323)

167
Reliance on tutors at home may reflect cultural norms and practices from their home country contexts. Teachers attributed the stronger support for learning at home in high performing low SES schools to positive parent attitudes towards schools and education, not to school efforts to involve parents. In the low performing low SES schools, they were more likely to describe parent attitudes towards the school and education as negative or mixed. Not surprisingly, they also perceived that parents in these schools provided little direct or indirect support for learning at home. Student transiency in two low SES low performing schools reportedly affected student performance and parental involvement. In the case of these two schools this was associated with unemployment and instability in family residential arrangements, the presence of shelters and group homes for destitute families and children and the status of some neighborhoods as reception areas for low income new immigrants.
We always have to be prepared for the unknown because of the transient population of our school… it has a high impact in terms of strategies… maintaining the health of staff, the balance of student achievement, academics and the immediate health/safety needs of the students. (P-‐11322)
Other low SES schools were described as stable in terms of family and student mobility. These tended to be schools situated in historically low income neighborhoods that have not experienced significant demographic change tied to new immigration or changes in school programs (e.g., French Immersion) or changes in school boundaries. This is particularly so among the French language schools sampled. Student mobility was described as a factor in two of the low SES high performing schools. The potential negative effects of student mobility on student performance seemed to be offset in part by the reportedly more positive parent attitudes and engagement in school activities and support for learning at home in these two schools, as compared to the low SES low performing schools. Principals, teachers and parent groups cited additional community characteristics that adversely affected student learning and parental involvement among the low SES low performing schools. They talked about an array of social and emotional problems, such as childcare and parent supervision issues for single parents and for parents working multiple jobs to try to make ends meet, substance abuse, hunger and poor nutrition, family violence and mental health concerns. It is inappropriate to generalize these claims to all low income families. They may, however, be statistically more prevalent in school communities serving large numbers of families and students living in poverty, especially when compounded by high unemployment and/or by the stresses of adapting to a new language and country. These kinds of social and emotional problems were reported more frequently in the low SES English language schools, not in the French language schools which tend to serve more stable

168
communities less affected by immigration, although they are not immune to employment instability. Principals and teachers in the low SES high performing schools were less likely overall to list social issues in the community and family affecting the fulfillment of children’s basic needs. It is noteworthy that this “problem” does not appear in the interview data from two low SES high performing schools with large but culturally homogeneous immigrant communities in stable housing arrangements. In sum, principals and teachers in low SES low performing schools were more likely to cite social and emotional issues outside the school that impinge on children’s readiness for learning than their peers in low SES schools where student performance overall is not perceived as a significant problem to be resolved. Related to social and emotional issues outside the school that affect attendance, behaviour and learning, teachers and principals in most of the low SES schools (regardless of performance) claimed that low income parents were not able to provide many enrichment experiences for their children outside of school (e.g., travel, clubs, sports activities) in comparison to high income schools.
I think with our school the thing is a lot of kids come here and this is their opportunity… they may not get so many opportunities at home. Some of the extra-‐curriculars like the glee club, sports club and after-‐school programs… I think that is positive for our kids. I think our kids and our community really appreciate what they get here. (T-‐11322)
As a result, the schools put a high priority on providing a wide array of extra-‐curricular activities in the school for students. Strictly speaking, this was not a parent involvement intervention. It was more a compensatory intervention introduced at the school and intended to strengthen student engagement in school and provide a more well-‐rounded educational experience and opportunities for students to excel in ways other than academically. Among the Francophone schools, the perceived problem (regardless of SES) was less one of lack of student access to enrichment activities in general outside the school, but more of lack of access to extra-‐curricular activities in French. Hence, all of the Francophone schools endeavored to mount cultural animation activities to support French language use in contexts other than teaching and learning activities in the classroom. Relatively low parent education levels were another common feature of low SES schools reported by principals and teachers. This had definite implications for parental support of children’s learning at home, and was sometimes (but not necessarily) connected to parent beliefs about the value of school. Although many low SES schools serve large numbers of children of recent immigrants, it is not the case that all low income immigrants are not well educated. Teachers from one high immigrant low SES school reported that parents were well educated but underemployed (hence low SES) in Canada. In any case, parent education levels are not a reliable predictor of parental attitudes and support for children’s learning, nor of

169
student performance in our sample. Parent education levels were reportedly low or mixed in the low SES high performing schools, yet still accompanied by positive parental attitudes towards school and education. The combination of reportedly negative or mixed parent attitudes and low education levels was limited mainly to the low SES low performing schools within our school sample. In one low SES English language school, the principal and teachers described parent attitudes towards education and the school as negative overall, with obvious consequences for low parental involvement.
Some parents didn’t have favorable school experiences, didn’t finish school… they don’t think they can help the kids. (P-‐11444)
This was a stable low income neighborhood where there was reportedly a multi-‐generational adversarial relationship with the school. In other low SES low performing schools, principals and teachers characterized their parents as split between those with positive and those with negative or laissez-‐faire attitudes towards the school. This was typically associated with variability in SES levels within the school community. Within the low SES schools, low parental involvement did not necessarily mean lack of interest in their children’s education or support in general for the schools. Parents can be quite supportive of the school and their children’s learning, but not extensively engaged in school activities such as the School Council, participating in school-‐wide events and volunteering in the classroom or on field trips. Among the low SES schools, the low engagement in school activities (particularly volunteering) reflected obstacles to parent capacity to get to school due to work and family circumstances such as both parents working, single parenthood, work schedules that inhibit parent participation, low English or French language proficiency and residence outside the immediate neighborhood of the school (e.g., common in French Immersion schools and some recently amalgamated schools where many students bussed). Comparing the high and low performing low SES schools, it appeared that parental engagement was lowest across the low performing schools. In the high performing low SES schools parental engagement at the level of attending school events was reportedly more positive and accompanied by low/mixed involvement as volunteers. Finally, a frequent theme in teacher comments about parents in low SES schools was that parents trusted teachers to educate their children, and that they regarded this more as the teachers’ job than as a partnership or joint responsibility.
I find that Asian parents stand back and let the teachers teach, which is good, but we want their input. (T-‐11321)

170
They are entrusting us with their kids… here is a different group of parents who put trust in us and don’t question it. (T-‐12443)
This was most common in schools serving high immigrant communities where, according to principals and teachers, cultural norms and prior education experiences in the home country among some immigrant groups did not emphasize parental involvement in teaching and learning. However, those same communities may be deeply committed to education, express high regard for the work of teachers and schools in educating their children, and demonstrate support through attendance at school events, participation in fund-‐raising and so on. Teachers reported that parent beliefs about the primary role of teachers in educating their children can be an obstacle to direct parent engagement in children’s learning at school or even in the home. In summary, our comparisons of parent involvement between low SES low performing and low SES high performing schools suggest two broad patterns. The level of parental involvement and engagement overall in the low performing low SES schools can be characterized as low to mixed support and low engagement. In contrast, the overall level of parental involvement in the high performing low SES schools can be described as high support but with low engagement. As explained, low income circumstances are more predictive of low engagement than of parental attitudes and general support for schools and education. There was nothing particularly distinctive about school actions to induce and facilitate strong parental involvement among the low SES schools. They are all doing similar things. Parent disposition to be involved in supporting school efforts to educate their children at school and at home is what varies across different school communities. In our sample, there was one low SES high performing school where the principal and teachers reported a significant change for the better in parent attitudes and involvement in their school over the preceding five years. Notably, this came about as a result of the school’s participation in the Ministry’s OFIP intervention program to raise the quality of student learning. The inference is that significant improvements in student academic performance school-‐wide may lead to improvement in parental involvement across the school, rather than vice versa. 6.3.2 Parent Involvement and High SES communities
Average family income in all the high SES schools was average to high in keeping with our sampling criteria. However, principals and teachers in four of the six high SES low performing schools reported that their school communities included a mix of high and low income families.
Plusieurs enfants de professionnels (avocats, médecin, etc.) mais plusieurs aussi de familles avec peu de moyens financiers. (E-‐22213)

171
The community has extremes; extreme poverty or fairly affluent families… the bulk is working class population. (P-‐11242)
In contrast, only one of the high performing high SES schools had a mix of high and low income families. The “low performance” ratings of the four high SES schools with mixed income levels may be associated, in part, with difficulties that principals and teachers in these schools have responding to the significant presence of more educationally challenged lower income students amid the high SES majority. The low performing high SES schools also portrayed parental engagement as mixed in ways that may be linked to the particular problems of participation of the low SES families within their school communities. Recent and growing numbers immigrant families from non-‐English speaking countries was common in both high and low performing high SES schools. Staff from the French language schools similarly reported the integration of growing numbers of immigrants for whom French is not the mother tongue, though this was limited to the high performing high SES schools.
Plusieurs familles immigrantes de l’Égypte… défi parce que l’arabe est la langue parlée à la maison et les enfants ne parlent pas français. (E-‐22112)
The French/English language proficiency of parents in the high SES schools was not consistently correlated to the school academic performance levels. Family income, as previously noted, and parent attitudes towards education and the school (see below) were more stable predictors. Two high performing high SES schools and one low performing high SES schools reported that their communities remained predominantly White Anglo Saxon and unaffected by recent immigration trends commonly reported in other schools. Student residency patterns can interact with other factors to affect student performance and parental involvement. Among the high performing high SES schools in our study, principals and teachers reported that they served stable neighborhood communities; one school did bus students from outside the neighborhood for the French Immersion track. Of the low performing high SES schools, on the other hand, educators from five of six schools described residential patterns that likely affected parental involvement and which may have contributed to their comparatively low overall performance levels.
The changing demographics… there is up to a 50% transiency rate in any given year… The high turnover rate impacts negatively on school success and school scores. (P-‐11241)
Principals and teachers from two of these schools described segments of their school communities as transient. Educators from four schools reported that significant numbers of
172
students were bussed from out of neighborhood for a variety of reasons (school amalgamation; dual track French Immersion; “alternative school” programs; rural community distance). Such residential patterns can inhibit school efforts to build a strong sense of school community and parental participation. This may interact with other factors that negatively affect student performance. As might be expected in predominantly high SES communities, principals and teachers either characterized parent education levels as high or simply did not call attention to parents’ education level (presumably because they did not see parent education levels overall as an issue). Similarly, principals and teachers from most of the high SES schools made no reference to the variety of social issues affecting student and family welfare that were commonly mentioned in the low SES schools (e.g., safety, employment issues, nutrition, substance abuse), except one low performing school with some group and foster parent homes in the community. Principals and teachers from two low performing high SES schools talked about perceived negative implications for parental involvement of families where both parents work and single parent families. Another feature common to all high SES schools, in contrast to low SES schools, is that principals and teachers do not highlight their efforts to compensate for children’s lack of opportunities for enrichment activities (e.g., clubs, sports) outside of school. Of course, these schools also devote time and energy to providing extra-‐curricular activities and programs as a component of student engagement and development. They simply do not rationalize that in terms of social and economic constraints at home that limit access to those sources of experience and development. In the high SES French language schools, however, principals and teachers did emphasize their efforts to provide extra-‐curricular programs and activities in French.
L’école présente des spectacles Francophones… La troupe de théâtre va monter une pièce avec mes élèves. Il y a aussi des activités avec d’autres écoles Francophones… camp de leadership de avec les élèves de septième et huitième. (E-‐22221)
They argued that this was needed because students have limited opportunities to communicate in French in the home or community as linguistic minorities often living in exogamous homes where English is the dominant language of communication. This finding was the same as in the low SES French language schools. Regardless of performance level, principals and teachers in the high SES schools described parent attitudes towards the school, teachers and education as positive, using such words as “support”, “respect”, “involved” and “satisfied”.

173
We are fortunate to have a parent group that is supportive towards the school. (P-‐12113) The parents are very involved… the school community connection is great. (T-‐12233)
In most of the high performing high SES schools they also described parents as holding high expectations for their children and school, and as being overtly “demanding” in terms of expectations for the school. Principals and teachers in the low performing high SES schools were less likely to talk about high parental expectations for the school and for students, though parent attitudes were still perceived as positive. The level of parental engagement in school activities (events, volunteering) in the high performing high SES schools was universally described as high, with only positive comments from teachers about parental support for children’s learning at home as well. By comparison, school personnel in the low performing high SES schools characterized parental involvement in school events and volunteering at school as mixed, typically higher for attendance at school events, and lower for volunteering. They associated the lower levels of parental engagement with the previously mentioned mixed (neighborhood and out-‐of-‐neighborhood) residential patterns that were more common in these schools, and with recent influxes of low income immigrant families. Principals and teachers in these schools were also more likely to talk about problems with parental support for homework for various reasons (limited English among low income immigrant parents, parent inability to help French Immersion students with homework due to a lack of parent proficiency in French). Based on these qualitative impressions, we judged the overall parent involvement level in all the high performing high SES schools as high support with high engagement. The overall parental involvement picture for low performing high SES schools was high support with mixed engagement in all but one school (a French language school where parents were described as highly supportive of the school, with high expectations for students, and high engagement in school events, volunteering and homework completion).

174
Chapter 7 -‐ School Leadership and Improvement
7.0 Introduction In Chapter 5 we looked in-‐depth at what the principals and teachers do to improve and sustain the quality of teaching and learning in their schools, including: school improvement goal setting and planning, teacher development and collaboration, data use to inform instructional decision-‐making at the school and classroom levels and monitoring of teaching and learning. The involvement of school leaders (principals and others) is reported separately within each of these areas, as well as in Chapter 6 on parent/community involvement. We conclude in this chapter with an overview and discussion of findings about school leadership in high and low performing schools, drawing from both the teacher survey and from the school interview data. Elementary school leadership need not be limited to principals. Other individuals may contribute to leadership as it relates to school quality and improvement in teaching and learning, such as assistant principals, teachers with “positions of responsibility” (e.g., division or grade team chairs) or special expertise (e.g., Reading, Special Education, ESL) and central office personnel (e.g., supervisory officers, curriculum, teaching staff). Leadership may also be provided by organized groups, such as a School Improvement Plan committee or a School Council. That said, principals play a key role, not just in providing leadership, but also in mobilizing and coordinating the leadership contributions of others. In this study we asked teachers directly about the leadership behaviours of their principals in the teacher survey. In the interviews, we asked principals and teachers to talk about principal leadership in relation to school improvement goals and activities and to identify others providing leadership in this domain. We begin with the teacher survey responses. We then recap the interview data in regards to principal leadership and the contributions of others to school effectiveness. The significance of principal leadership for the quality and improvement of student learning is widely accepted. Based on a meta-‐analysis of research on the relationship between principal leadership and student academic outcomes, Leithwood and his associates (Leithwood et al., 2004) claimed that principal leadership is second only to the instructional practices of teachers among in-‐school factors influencing student learning. Robinson et al’s (2009) best evidence synthesis of principal leadership actions that affect student learning lends support to this claim. That said, it is also widely acknowledged that the combined influence of within-‐school factors, such as those listed as effective schools’ correlates on student academic achievement is modest in comparison to external factors associated with student and community socio-‐economic characteristics. Here we attempt to identify common patterns of principal leadership behaviour across our sample of schools, as well as any salient patterns that might distinguish high from low performing schools in differing SES contexts across the sample.

175
Principal turnover and succession are key considerations in any talk about the relationship between principal leadership behaviours and other factors associated with the quality of teaching and learning. How long does a principal need to be in a school before credible claims can be made about the links (direct or indirect) between what they do and the quality of teaching and learning in that school? What happens to school improvement initiatives when there is a change in principals? In this study 12 of the 22 principals were in their first or second year as principal, five in their third year, and four in their fifth year as principal in the schools studied. Only one principal had served as principal for more than five years in his or her school (10 years in that case). The “new” principals (i.e., those in their first or second year at the school) were evenly distributed across the four types of schools, with three new principals (two English and one French language) in each group (high performing high SES, high performing low SES, low performing high SES, low performing low SES). Thus, it cannot be said that principal turnover is associated with schools by performance or SES characteristics in this sample. On the other hand, it may be that the frequency of principal turnover reflects district-‐level norms and policies concerning principal transfers. Among the four English language boards, for example, six of eight new principals were concentrated in two boards, whereas in the other two boards only one of four principals in each board was new to their school (others had three to 10 years school experience). In our analysis of the school leadership and improvement data we were attentive to principal succession effects. Leithwood et al (2004; cf Leithwood et al 2006) reviewed the research evidence on successful school leadership practices that influence student learning, and defined four core leadership practices: setting directions, developing people, redesigning the organization and managing the instructional (teaching and learning) program. Setting directions includes goal setting processes, articulating and communicating school goals to staff and other stakeholders (e.g., parents), reinforcing and rewarding progress towards accomplishment of school goals and influencing the alignment of teachers’ individual goals and goals for school improvement. Developing people includes providing individualized support to teachers for professional learning; offering intellectual stimulation by promoting professional growth, sharing information about promising practices, challenging the status quo and encouraging innovation; leading professional development activities; modeling professional learning by engaging in (but not directing) professional learning experiences with teachers and mentoring prospective leaders. The core leadership practice designing or restructuring the workplace to align with efforts to accomplish school goals encompasses four broad areas: building a collaborative culture, (re)structuring the organization to facilitate goal attainment, relations with parents and connecting the school to the wider professional environment (see Chapter 6 for findings related to parent/community involvement). Managing the instructional program is the fourth core practice associated with successful school leadership according to Leithwood et al (ibid). The sub-‐practices associated with managing the instructional program included providing general

176
support to teachers for implementation of the instructional program (e.g., resources, timetabling, curriculum coordination), staffing, monitoring student learning and teacher implementation of expected programs and instructional practices and buffering teachers from distractions to the core work of teaching and learning (e.g., screening multiple demands on their time, student discipline). This model of successful leadership practices was the foundation for the Leadership Framework developed by the Ontario Ministry of Education (2010). The Ministry added a fifth “core practice” which they called “securing accountability”. We used the Leithwood et al. schema as a theoretically and research grounded foundation for organizing and discussing the findings. Since “Managing the instructional program” includes monitoring the effectiveness of school practices and their impact on student learning through the purposeful use of data, we do not address “securing accountability” as a separate core practice.
7.1 School leadership: Teacher survey The teacher survey included two scaled sets of items adopted from surveys of principal leadership by Leithwood in prior investigations (e.g., Louis et al., 2010). The first set of items asks teachers to rate on a 6 point scale the extent to which they agree or disagree that their principal enacts specific practices associated with three of the four core transformational leadership practices defined by Leithwood et al (ibid): setting directions, developing people and redesigning the workplace. The survey strategy assumed that teacher reports of what their principals do provides a more valid measure than a principal’s self-‐report, especially when teacher responses are aggregated for all teachers within a school as in this study.

177
Table 7.1 Transformational leadership practices of principals
My school’s principal… Setting Directions 1. Gives staff a sense of overall purpose. 2. Helps clarify the reasons for the school improvement initiatives. 3. Provides useful assistance to me for setting short-‐term goals for teaching and learning. 4. Demonstrates high expectations for my work with students. Developing People 5. Gives me individual support to help me improve my teaching practices. 6. Encourages me to consider new ideas for my teaching. 7. Models a high level of professional practice. 8. Encourages an atmosphere of caring and trust. Redesigning Organization 9. Promotes leadership development among teachers. 10. Encourages collaborative work among staff. 11. Ensures wide participation in decisions about school improvement. 12. Engages parents in building community support for the school’s improvement efforts. 13. Is effective in building parental support for the school’s improvement efforts.
High
performance Low performance Effect Size
M SD M SD d
TOTAL_TR_LEAD α=.95 5.07 0.71 4.88 0.97 0.22
SetDirec α=.86 5.05 0.76 4.92 0.99 0.15
TrLead1 5.09 0.92 4.90 1.23 0.17 TrLead2 5.16 0.99 5.15 0.99 0.01 TrLead3 4.61 1.10 4.50 1.26 0.09 TrLead4 5.32 0.75 5.18 0.98 0.16
DEV_PEOPLE α=.85 5.00 0.83 4.90 1.09 0.10
TrLead5 4.54 1.18 4.51 1.42 0.02 TrLead6 4.86 0.95 4.88 1.21 -‐0.02 TrLead7 5.24 0.99 5.19 1.05 0.05 TrLead8 5.36* 1.00 5.06 1.31 0.26
REDES_ORG α=.87 5.13* 0.69 4.86 0.96 0.32

178
TrLead9 5.05 0.99 4.89 1.18 0.15 TrLead10 5.47* 0.87 5.26 1.00 0.22 TrLead11 5.21 0.94 5.06 1.21 0.14 TrLead12 4.96* 0.87 4.67 1.07 0.30 TrLead13 4.90* 0.9 4.45 1.15 0.44
Scale: 1—completely disagree to 6—completely agree *Significantly higher mean, p < 0.05
The survey results displayed in Table 7.1 suggest little variation in principal leadership practices associated with setting directions and developing people between high and low performing schools. The only significant variation appeared for items that assessed teacher opinions about whether their principal encourages an atmosphere of caring and trust. Teachers in high performing schools rated their principals more positively on developing a climate of caring and trust, though the magnitude of that difference (the effect size score) was quite small and may not reflect a meaningful difference in practice. More significant variability was evident for principal practices associated with structuring the organization to support the accomplishment of school goals. Teachers in higher performing schools reported that their principals were effective in building parental and community support for the school’s improvement efforts than teachers in the lower performing schools (medium effect sizes). In response to accumulating evidence surrounding “instructional leadership”, practices reported by researchers such as Robinson et al. (2009), Leithwood et al. (2006) added “managing the instructional program” to what began as a framework of three core successful transformational leadership practices. We included a separate scale in the teacher survey for instructional leadership that was adopted from a teacher survey used by Leithwood and colleagues in a large scale investigation of school leadership as it relates to student learning in about 180 schools across 43 school districts in the United States (Louis et al., 2010; Leithwood & Louis, 2012). The items in this scale were designed to measure the frequency with which principals perform the specific leadership practices named.
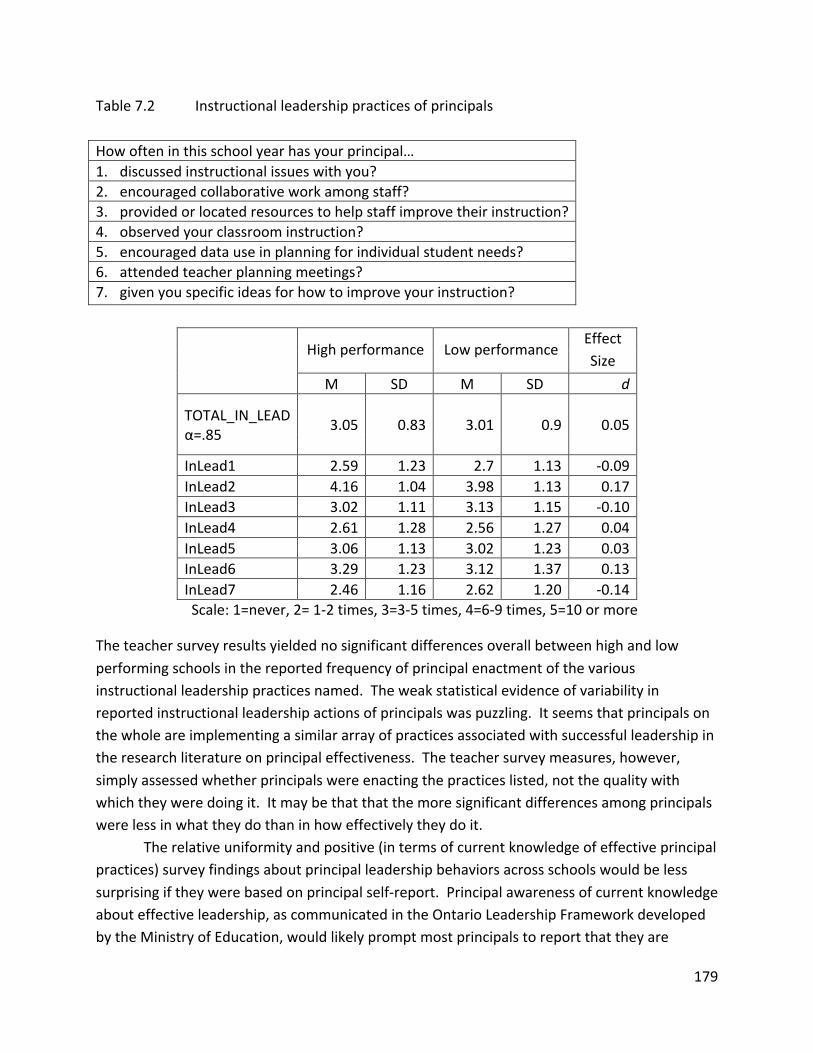
179
Table 7.2 Instructional leadership practices of principals How often in this school year has your principal… 1. discussed instructional issues with you? 2. encouraged collaborative work among staff? 3. provided or located resources to help staff improve their instruction? 4. observed your classroom instruction? 5. encouraged data use in planning for individual student needs? 6. attended teacher planning meetings? 7. given you specific ideas for how to improve your instruction?
High performance Low performance
Effect Size
M SD M SD d
TOTAL_IN_LEAD α=.85 3.05 0.83 3.01 0.9 0.05
InLead1 2.59 1.23 2.7 1.13 -‐0.09 InLead2 4.16 1.04 3.98 1.13 0.17 InLead3 3.02 1.11 3.13 1.15 -‐0.10 InLead4 2.61 1.28 2.56 1.27 0.04 InLead5 3.06 1.13 3.02 1.23 0.03 InLead6 3.29 1.23 3.12 1.37 0.13 InLead7 2.46 1.16 2.62 1.20 -‐0.14
Scale: 1=never, 2= 1-‐2 times, 3=3-‐5 times, 4=6-‐9 times, 5=10 or more
The teacher survey results yielded no significant differences overall between high and low performing schools in the reported frequency of principal enactment of the various instructional leadership practices named. The weak statistical evidence of variability in reported instructional leadership actions of principals was puzzling. It seems that principals on the whole are implementing a similar array of practices associated with successful leadership in the research literature on principal effectiveness. The teacher survey measures, however, simply assessed whether principals were enacting the practices listed, not the quality with which they were doing it. It may be that that the more significant differences among principals were less in what they do than in how effectively they do it. The relative uniformity and positive (in terms of current knowledge of effective principal practices) survey findings about principal leadership behaviors across schools would be less surprising if they were based on principal self-‐report. Principal awareness of current knowledge about effective leadership, as communicated in the Ontario Leadership Framework developed by the Ministry of Education, would likely prompt most principals to report that they are

180
implementing those practices. However, the survey assessed teacher views about what their principals do, and thus, might be expected to be more valid and more sensitive to variation. Notwithstanding the particular differences noted above, the overall image of principal leadership behaviors from the teacher survey data is one of sameness and not one of variability. As suggested, the differences among principals may be less a function of what they are doing than of the skill with which they are enacting a similar range of behaviours, such as leading and facilitating data use and teacher teamwork or monitoring teaching and learning. The qualitative accounts of principal leadership behaviours from our school interviews provide further data on school leadership and reported differences across different types of schools.
7.2 Review of School Leadership Findings: School interviews In this section we recap previously presented school interview findings pertaining to the role of principals and other sources of leadership in the enactment of school improvement activities (e.g., school goals and goal setting, school improvement planning, teacher collaboration and development, data use to inform instructional decision making at the school and classroom levels and monitoring of teaching and learning). We review and discuss these findings within the framework of core successful leadership practices adopted from Leithwood et al (2004; 2006). The principal and teacher interview data provided insight into salient patterns of similarity and difference in school leadership practices across and between the schools, which we recap in the paragraphs that follow. However, those data also revealed some compounding factors that complicated the analysis of comparisons between high and low performing schools. A major complicating factor is the incidence of principal turnover. As noted earlier, 12 of the 22 principals were in their first or second year as principals in their schools, and these cases were evenly distributed across the four categories of schools. In some schools the “new” principals reported that they were deliberately easing into their new role in the school and relationship with teachers. In other schools they came in with a big bang applying both greater pressure and support for change and improvement in teaching and learning than their predecessor. In some schools teachers said the new principals were more actively engaged in instructional leadership behaviours (e.g., visiting classes, leading professional development), while in others they said that the new principals were less engaged in instructional leadership than their predecessors. A second confounding factor was the incidence of recently amalgamated schools. In every school category there was at least one school that had recently been amalgamated from two schools. School amalgamation creates at least a temporary need for greater principal attention to community building amongst teachers, parents and students than otherwise might be the case, which may divert attention from other concerns. Given the small number of schools in this investigation, however, the effects of recent turnover and school amalgamation made it more difficult to identify “typical” practices of principals in different categories of schools. School findings may appear to be idiosyncratic to particular school

181
circumstances, rather than reflective of patterns that transcend specific schools. Having said that, we were able to identify some patterns of leadership practice through the interview data that did seem to be distinctive of high versus low performing schools, or schools in different contexts varying by SES or language group (French versus English language schools). We did our best to err on the side of caution in claims that we make, since there were typically exceptions, and the distinctive patterns did not necessarily hold in all cases within each group. 7.2.1 School Leadership in High Performing Schools
Setting directions. All principals reported that school goals for improvement were grounded in an analysis of EQAO and related assessment data at the school level, while at the same time being responsive to school board level directions for improvement in literacy and numeracy teaching and learning. Our principal and teacher interview data, however, suggested some patterned differences between high and low performing schools in school goals and in how goal setting was carried out, and particularly in relation to data use and to teacher participation in decision-‐making. Principals and teachers in high performing schools were more likely to highlight higher order learning skills as a focus for school improvement and to emphasize goals for improvement in student learning for all students, not just those performing below provincial proficiency standards in literacy and numeracy. They tended to be more precise about school-‐wide goals for improvement in student learning based on team analysis of assessment data. Principal and teacher reports of systematic data-‐informed school improvement goal setting and planning were more consistent across the high performing than the low performing schools. And teachers across the high performing schools described more widespread participation in data analysis and decision making about school improvement goals and plans. In lower performing schools teachers were more likely to report that goals were set by the principal, although in consultation with a school improvement committee that included teacher representation. Developing people. In high performing schools principals and teachers talked about principal support for both individual and collective professional learning of teachers. That support (encouragement, release time, funding, recognition), however, was typically described as support for teacher development in relation to school and district priorities for improvement in teaching and learning rather than in terms of teachers’ personal professional interests. These two focuses of support may coincide in schools where there is strong consensus on needs and goals. Principals and teachers in all schools referred to principal actions that facilitate teachers’ professional learning through the provision of release time and funding to take part in external professional development events (board workshops, conferences), or enabling time for teachers to work and learn together in teams (see structuring the workplace below). They

182
varied in their reports of whether principals took active roles in “leading” professional development activities versus allowing others to act as the leaders in those contexts. Leadership for professional development was described in three ways: (1) setting directions for professional development; (2) acting as professional development providers contributing their own expertise on professional learning topics; and/or (3) participating in teacher professional development events and in teamwork activities (i.e., Pathways/parcours or PLC/CAP meetings). About half (6/11) of the high performing school principals were said to communicate clear goals and expectations for teachers’ instructional practices and, by extension, for capacity development to enact those practices. Explicit expectations for instructional practice were more characteristic of leadership in schools in the French language system (4/4). Having clear goals and expectations for teaching and learning practices, however, does not necessarily mean that principals themselves act as experts to support implementation. Only two of the 11 high performing principals were described by teachers as expert pedagogues who personally delivered professional development activities related to instructional practice in staff meetings, school-‐based workshops and classroom visitations. These two principals were from English language schools, new to their schools, and characterized themselves as “instructional leaders”. According to teachers, principals in most high performing schools (10/12) do regular classroom walkthroughs. Principal walkthroughs can serve multiple purposes, including monitoring the use of expected teaching and learning practices, developing principal awareness of classroom processes, demonstrating principals’ visibility in the school and offering pedagogical advice to teachers. Six of the high performing school principals were said to offer pedagogical feedback to teachers (e.g., in group settings, weekly newsletters) based on their observations. Two of these principals reportedly provided individual feedback to teachers in the classroom, as well. In sum, principals in the high performing schools did not all claim to be pedagogical experts. Principals and teachers in the high performing French language schools identified central office instructional resource teachers (e.g., des conseillères pédagogique) as playing important instructional leadership roles in CAP and parcours meetings, and also through modelling and coaching teachers on the use of expected teaching and learning practices in the classroom. In contrast, principals and teachers in the high performing English schools rarely mentioned the presence and interventions of board literacy and/or numeracy coaches in teacher development and collaboration at school, division/grade level team, or individual classroom contexts. When mentioned, their involvement was described as voluntary and by invitation, and as something that occurred more frequently in the past. The most common sources of instructional expertise for teacher learning in the high performing schools were associated with teamwork and sharing about student learning and instruction in the school, albeit reinforced by teacher participation external goal-‐related professional development activities, and by inputs from central office resource teachers in the French schools.

183
A majority of principals (10/11) in the high performing schools demonstrated leadership for professional learning by participating in school supported professional learning activities, including external workshops, in-‐school teamwork meetings (Pathway/parcours, PLC/CAP) and staff meetings where teachers share amongst themselves or interact with external curriculum and teaching consultants. Principals framed their participation partly as modeling their commitment to ongoing professional learning related to school goals, and partly in terms of their desire and need to understand the expectations for instructional practice. Structuring the workplace. A dominant theme across all schools was the emphasis that principals gave to facilitating teacher sharing and teamwork through formal structures such as professional learning communities/communautés professionelle d’apprentissages, Teaching-‐Learning Critical Pathways/parcours groups, collaborative inquiry projects and shared planning time for teachers at the same grade level. The principals’ actions centered on making or protecting time for these team activities, influencing grouping arrangements (e.g., grade, division, other), ensuring alignment of collaborative work with school improvement goals and plans and participating in the activities as observers and team members (i.e., co-‐learners). Principals of some high performing schools said they had less access to additional funding from the Ministry or from their boards due to their status as high performing schools. Thus, the implementation of Pathway/parcours cycles depended as well on the appropriation of more traditional times for these new forms of teacher teamwork (e.g., staff, division, grade level team meetings; in-‐school Professional Activity Days) in the high performing schools. Principals and teachers in four high performing schools (two English, two French) reported that that shared planning time arrangements had been made for teachers at the same grade levels. Administrative provisions to enable time and support for teacher teamwork in CAP and in parcours meetings were more uniform across the high performing French language schools. Managing the instructional program. Teachers across the high performing schools spoke positively about the general support provided by their principals for material resources for their instructional programs. No one identified staffing as a significant factor in school improvement decision-‐making. Principals and teachers emphasized the collection and use of EQAO and other assessment data to inform instructional decision-‐making at the school and classroom levels, and principal monitoring through the practice of informal classroom walk-‐throughs and participation in teacher team activities focused on analyzing data, setting short term goals, planning interventions and tracking student learning progress in PLC/CAP and Pathway/parcours cycles. A majority of principals (6/11) in the high performing schools were depicted by themselves and by their teachers more as enablers and facilitators of data use than as experts in data analysis. Even among the five singled out for expertise in data analysis, this was mainly limited to organizing and presenting EQAO assessment results, not to the collection and use of diagnostic and formative assessments implemented by teachers during the school year. A few

184
participated in moderating marking sessions with teachers, but as co-‐learners, not as experts in assessment of student work. Principals in all the high performing French language schools relied on external expertise from instructional resource teachers from their school boards (des conseillères pédagogiques) to aid in data analysis and use for instructional decision-‐making in PLC/CAP and Pathway/parcours meetings that are key contexts for use of student assessment data and improvement planning. Other principals and teachers referred to reliance on in-‐school resource teachers (e.g., special education, reading specialists) and division team leaders considered to be skilled in the interpretation and use of data. While variability in principal leadership for data use was idiosyncratic, the overall impression communicated in high performing schools was that data use for goal setting and improvement plans was occurring as an ongoing norm at the school and classroom levels. In other words, principals were making sure that it was happening, although they varied in the nature of their personal involvement in leading the organization and interpretation of data. Principals in the high performing schools did engage in the currently popular practice of classroom walk-‐throughs, as noted above in our review of findings related to teacher capacity development. That said, most of them reportedly did this mainly as an informal means of monitoring teaching and learning and classroom climate and to demonstrate their visibility and as mainly to “pop in” to say “hello” or “bonjour” with little or no interaction. In a only a couple of schools did teachers report that principals actively stayed for a while to observe the teaching and learning process, and perhaps to ask questions to students about what they were learning. There was variability across the high performing schools in the reported regularity of principal walk-‐throughs. Where principals visited classrooms on a more occasional basis, teachers were likely to say that their principals encouraged and were responsive to teacher invitations to come observe (e.g., creative uses of technology). Teachers in the high performing schools uniformly said that they experienced walk-‐throughs as positive demonstrations of administrator interest and support for teaching and learning and for relations with students and teachers. Among four English language schools that had experienced recent principal turnover teachers reported an increase in the frequency of principal walk-‐throughs in two schools and a reduction in the other two. In one school where the frequency of visits was less, however, the current principal was described as less intimidating and as providing more useful descriptive feedback than his/her predecessor. Frequency of classroom visits is not necessarily an indicator of the quality of those visits from a teacher perspective. Regular principal walk-‐throughs were reportedly less common in the French language schools as a whole, so principal succession effects were not emphasized. Principals and teachers in the French schools talk more about principal monitoring through participation in CAP and parcours meetings than through classroom walk-‐throughs. The French school principals relied more on classroom coaching from central office resource teachers.

185
Across the high performing schools, principals did not generally emphasize what they did to buffer and protect teachers from distractions to the core work of teaching and learning. Where they did, this was mainly limited to principals in the high performing low SES schools. Two principals talked about “filtering out” external demands and information that they perceived as potentially interfering with the school focus on students and student achievement. One reported that he/she consulted with teachers to determine how to prioritize “all the initiatives” for the school improvement plan. Another emphasized his/her efforts to protect instructional time by minimizing interruptions during the teaching day. One principal among the high performing low SES schools referred to the importance of attending to school safety and discipline issues. The inference from these findings is not that principals overall in high performing schools do not actively engage in protecting teachers from these kinds of distractions; rather the need to do so is not perceived as a major issue, particularly in the high SES settings. Two high SES high performing principals did say that they occasionally had to intervene when parents actively questioned the instructional decisions and actions of teachers.
7.2.2 Principal Leadership in Low Performing Schools Setting directions. Among the low performing schools reports of systematic data use for school goal setting and improvement planning were less consistently reported across the eleven schools, particularly among high SES low performing schools. Principals and teachers in the low performing schools also described less widespread teacher participation in school goal setting and improvement planning. Teachers were more likely to report that school goals and plans were set by principals and school improvement committees. This may contribute to the greater frequency across low performing schools, especially the high SES low performing schools, for teachers to say that they were unclear about school goals and how they were established. Clear direction from principals regarding the focus of school goals for improvement in teaching and learning was only reported in two low performing schools (both English). One of those principals was new to the school, and both were characterized by themselves and by their teachers as instructional leaders. Principal leadership and direction for school goal setting was not emphasized by teachers in all six of the high SES and three of the five low performing low SES schools. Among these schools, teachers in four schools characterized their principals as supportive, but essentially responsive to teachers’ ideas for school goals (though perhaps limited to a small group of teachers on a school improvement committee). This group of schools included the three French language schools, where principal reliance on instructional leadership from their school board’s conseillères pédagogique to assist teachers with assessment data analysis and goal (long and short term) setting was the norm across all French language schools in this study. Teachers from two high SES and one low SES low performing schools described principal leadership as weak overall, including decision-‐making about school goals. All three of these principals were recently appointed, which raises questions about board level decision-‐making regarding principal succession in low performing schools. In two

186
low performing schools (both high SES) the interview data from principals and teachers did not provide enough information to clearly discern the processes and principals role in setting school goals for improvement. Principals and teachers in low performing low SES schools were the most likely group across all categories of schools in our study to emphasize moving school performance closer to provincial goals for EQAO assessment results. This was not surprising, since they were the lowest performing schools among the 22 schools in our sample. Interestingly, principals and teachers in the low performing high SES schools did not refer to raising EQAO results as a school improvement goal. This may be related to the fact that these schools (as defined and selected for this study) are only low performing in relation to other schools serving students with similar SES profiles. The fact that reports of higher order learning skills as a school goal focus were limited to the high SES schools among the low performing schools may also reflect this relative difference in school academic results, as well as a perceived need of educators in those schools to signal the importance of emphasizing student learning beyond basic literacy and numeracy in those communities. Developing people. Principals and teachers in the low performing schools talked more commonly about principal support for teacher development in response to teachers’ personal professional interests than about principal intervention focused on teacher learning related to school-‐wide expectations for instructional practice. This finding held for all four low performing high SES schools, two of which had newly appointed principals (1-‐2 years). The linkage of personal professional development activities to school focuses for improvement was serendipitous. In five of the eleven low performing schools the principals and teachers described principals who were actively visiting classrooms and providing instructional advice to teachers on particular goals for instruction (e.g., Guided Reading, 3 Part Math lessons with an emphasis on problem solving, smart board use). This included principals or vice principals from the three French language schools, and two principals from the low SES low performing English schools. The principals in the two English schools were both characterized as instructional leaders. One was recently appointed to his/her school, while the other had served for 10 years as principal in his/her current school. In another school the principal was described as a frequent visitor to classrooms, but more in terms of relationship building with students and teachers, not in terms of pedagogical assistance. Teachers from four of six low performing high SES schools and one low SES school (all English) said their principals never or rarely stopped by their classrooms. Three of the six recently appointed principals were among this group. As found in the high performing schools, principal succession was not necessarily associated with positive changes in school leadership practices according to teachers. Principals in the low performing French schools actively supplemented their own pedagogical expertise with access to instructional support for teachers from board consultants or from in-‐house experts (e.g., vice principal). Given their low performing status, it seemed surprising that the active presence and

187
contributions to teacher development of central office instructional resource personnel was only highlighted in one of the eight English language low performing schools. Overall, the highest concentration of principals who combined classroom monitoring with direct intervention to support instructional practice across all categories of schools in our sample was found in the low performing low SES schools. Direct instructional assistance from principals was emphasized the least among the high SES low performing English language schools across the entire sample. Structuring the workplace. As reported in our prior analysis of teacher collaboration and development, teachers and principals across the low performing schools talked less consistently about principal actions to provide structured time for teacher teamwork, sharing and joint professional development. This generalization is not true of the French language schools, where the practice of school and/or division level CAP meetings with supply teacher coverage followed up by the more recently introduced parcours meetings appeared to be common practice in the French language system. Explicit reports of principals making provisions for teacher teamwork (shared planning time, release time to work on school SMART goals, Learning Cycle meetings) were limited to three schools. Principals and teachers in two low performing English language schools reported that Pathway cycles were recently introduced in their schools in response to direction from the central office. Among three low performing schools in that board in our sample, however, only one of the principals was described as actively leveraging or supporting the use of that time for division/grade level school improvement. Another scheduled regular lunch hour meetings for teachers by grade level to discuss common instructional plans, but teacher descriptions of the use of that time did not make any explicit links to school priorities for improvement (e.g., teachers discussing common themes such as “learning animal sounds”). Teachers from a fourth high SES low performing school reported that their principal (a new principal) rarely even called staff meetings and that the school was experiencing a general lack of organization in even routine decision-‐making (e.g., whether to cancel recess due to bad weather). In sum, in comparison to the high performing schools as a group, the principals in low performing English schools, with two exceptions, were not described as leveraging and structuring time for teacher teamwork and professional learning as actively and consistently. Managing the instructional program. Teachers in the low performing schools, as in the high performing schools, generally described their principals as supportive in terms of providing adequate resources for their instructional programs and being responsive to individual teacher requests for material or professional assistance. While principals and teachers in low performing schools talked about the use of EQAO and other student assessment data for instructional decision making at the school level and in the context of teacher teamwork (i.e., PLC/CAP meetings, Pathway/parcours meetings), principal leadership for data use was less consistently described and emphasized than in the high performing schools. In our in-‐depth

188
analysis of data use in Chapter 5, we reported that principal expertise and leadership for data use was only emphasized in three of the eleven low performing schools. As in the high performing schools, principals in the low performing schools were more often described as enablers and facilitators of data use than leaders, per se. Often the descriptions of principal participation in data use were limited to consideration of EQAO assessment results for school improvement planning. Principals, particularly in the French language schools, sought input from central office instructional support personnel to assist with data use at the school and division/grade team level. In Chapter 5 we concluded that less systematic data use for instructional decision making was happening in the low performing schools as a group. We noted exceptions to this generalization in a couple of English language schools associated with the appointment of new principals with greater instructional focus and expertise than their predecessors, and in the French language schools where data use is being managed more routinely in the context of school improvement planning, CAP and parcours meetings with the assistance of central office specialists (des conseillères pédagogiques). We argued that the use of data tools beyond the administration of EQAO assessments, such as common formative assessments, data walls and moderated marking was not as deeply or uniformly institutionalized in professional norms and practices of principals and teachers in the low performing schools when considered as a group. We highlighted issues of lack of teacher compliance in some of these schools with some administrative expectations for data use (e.g., formative assessments, data walls), lower participation of teachers in the analysis of data at the level of school goal setting and less consistent principal support for implementation of Teaching Learning Critical Pathways, which are key contexts for teacher use of diagnostic and formative assessment data for short term instructional planning and intervention. Teachers in four of eleven low performing schools explicitly stated that they got no help with data use, though data use by teachers for school and classroom improvement decisions was expected. As described above under the core leadership practice “developing people”, principals in a slight majority (6/11) of the low performing schools do reportedly implement classroom walkthroughs on a regular basis for the combined purposes of monitoring teaching and learning and the use of expected instructional practices, building relationships with teachers and students and providing instructional advice (in five of the six schools) to teachers In effect, the incidence of principals doing more than “popping in” and saying “bonjour” distinguished these schools from the prevalent informal monitoring reported in many of the high performing schools. The striking difference among the low performing schools in comparison to the high performing schools was that in nearly half the low performing schools (5/11) monitoring of teaching and learning in the classroom through the practice of principal walkthroughs was reportedly not happening at all or, if so, only on an occasional basis in response to teacher invitations. This was exclusive of required teacher appraisal visits.

189
Principals may also monitor and perhaps contribute to teacher teamwork discussions and planning related to student learning and interventions in the context of organized team meetings (PLC/CAP, Pathway/parcours, grade/division meetings). Among the low performing schools this form of principal monitoring behaviour was only highlighted by principals and teachers in the three French language schools and one low SES English language school. In the high performing schools principal participation in these meetings was mainly limited to the low SES schools. Among the low performing schools teachers did not talk a lot about what principals were doing to protect or buffer them from distractions or demands that negatively affect teaching and learning. When they did it was typically about what school leaders were not doing or not doing effectively in some schools. Teachers in two schools reported that principals devoted a lot of their time to dealing with student discipline problems and student health and safety concerns, as opposed to providing instructional leadership for the accomplishment of school goals for teaching and learning. Two of these schools were high SES schools, and the other school was low SES. Teachers in one low performing high SES school described their principal as disorganized, frequently disrupting the school schedule with impromptu changes in scheduling (e.g., of assemblies) and with indecision about management of routine events, such as cancelling outdoor recess due to inclement weather. This principal was new to the school.
7.3 Principal Leadership and School Effectiveness: An Overall Perspective This report examines findings from a comparative investigation of the characteristics of 22 elementary schools achieving consistently high or low percentages of students at the provincial standards on EQAO assessments in literacy and mathematics at Grades 3 and 6. The school sample included approximately equal numbers of schools within each of four categories varying by aggregate student performance on EQAO assessments and by socio-‐economic status (SES) of families served: high performance high SES (5), low performance high SES (6), high performance low SES (6) and low performance low SES (5). The sample included schools from both the English (15) and French (7) language school sectors of Ontario’s provincial school system. Two additional features of the school sample are important to keep in mind relative to the interpretation of school performance and effectiveness. First, the designation of a school as either high or low performing was based on their average annual performance over the three years on EQAO assessments relative to provincial standards and targets (i.e., 75 % of students achieving at Level 3 or Level 4) prior to the study (see school sample method, Chapter 2). This reduced the possibility that a school might be inadvertently classified as high or low performing due to unusual negative or positive fluctuation in results in a given year. Second, schools were classified as high or low performing relative to the performance on EQAO assessments of other schools serving students with similar family socio-‐economic

190
characteristics. This reduced the possibility of attributing variability in school performance simply to differences in family SES levels. We framed the presentation of findings as a contrast between high performing and low performing schools. However, we were careful in the analysis of the qualitative data from school interviews with principals, teachers and parents to consider patterns of similarity and difference between schools serving different SES groups. Although we did not set out to compare English and French language schools, some key differences emerged on a consistent basis across schools in all four school sample groups, and they have been noted where they appeared. We conclude this report with a commentary on the provincial context and the role of school leadership as it relates to school effectiveness in the elementary schools that took part in this investigation. An understanding of school effectiveness and improvement in Ontario elementary schools must take into account the Provincial government’s efforts to improve the quality of student and school performance over the past decade and half. This has created a context within which local educators at the school board and school levels are striving for excellence, and within which other key players, such as publishers of curriculum and related instructional resources play a role as well. Key elements of this provincial context for school effectiveness and improvement include the following:
• A common outcomes-‐based curriculum and curriculum performance standards by subject and grade level.
• A system of annual standardized assessments of student performance aligned with the
curriculum performance standards in literacy and numeracy at Grades 3 and 6.
• A standardized student report card format aligned with the curriculum performance.
• Provincial targets for student performance on the standardized EQAO assessments as goals for improvement (e.g., 75% of students provincially and at the school level achieving at Levels 3 or higher on the literacy and numeracy assessments).
• Intensive assistance to schools identified as under-‐performing on the basis of EQAO
assessment results by the Ministry of Education’s Literacy and Numeracy Secretariat in collaboration with school boards and with other key agencies, such as EQAO and the Ontario Principal’s Council.
• Encouragement and support for the adoption and implementation particular
instructional practices considered to be high yield in terms of their effects on student

191
performance on the EQAO assessments aligned with the provincial curriculum and standards.
• Development of curriculum, instruction and assessment materials aligned with
provincial curriculum content standards by commercial publishers and sources within the public education system (e.g., the Ministry, school board curriculum departments, professional associations).
• Administrative and technical support (time, resources, expertise) for the use of data
from EQAO and other curriculum-‐aligned assessments of student learning for instructionally-‐related decision making (learning goals and intervention plans) at the school and classroom levels.
• Administrative support for teacher consensus and teamwork within and between
schools on goals and plans for improvement in student learning through Teaching Learning Critical Pathways (TLCPs), Collaborative Inquiry and other forms of professional collaboration activity.
• Continuous monitoring of progress in student performance in order to progressively refine goals and target support for improvement in teaching and learning through the use of EQAO and classroom assessments, principal supervision of teaching and learning, school improvement plans and periodic district reviews of school performance.
The combined effect of these components of the Provincial government’s plan for continuous system-‐wide improvement in student achievement in Ontario elementary schools is a multi-‐dimensional press for alignment and coherence in goals and support for improvement in student learning within the parameters of provincially defined goals. In theory, if all these components are well implemented and well aligned at the school and classroom levels, high levels of student performance in literacy and numeracy as defined in the curriculum and as measured on EQAO assessments should be achieved. The government’s approach to continuous improvement in student learning and school performance combines high accountability measures with high support, in contrast to the relatively ineffective use of high stakes sanctions for low student performance that has characterized school improvement efforts across the United States over the past decade under the national No Child Left Behind policy. This study builds upon a long history of research on the characteristics of effective schools (see Chapter 1.2). Our findings confirm the relevance of the correlates of effective schools (Table 1) reviewed by Calman (2010) in contemporary Ontario elementary schools

192
(note: we did not gather or report any information about school emphasis on “student responsibilities and rights” Table 1). The contributions of this study have more to do with understanding (1) how these correlates are being operationalized in elementary schools across the school system in response to the provincial context described above; (2) how the elements are interacting and working together to promote continuously improving effective schools in different contextual circumstances and (3) how differences in school performance relate to variability in how school improvement processes are enacted in the schools. Throughout this report we have repeatedly observed a high degree of similarity across the schools in school improvement focuses and processes at the school and classroom levels, regardless of variations in jurisdiction, prior performance and school community characteristics. We attribute this in large part to the pervasive influence of the Provincial government’s direction and support for school effectiveness as enumerated above. This finding prompted us to wonder “if everybody is doing the same things”, why do we continue to see substantial gaps in student performance between schools? In particular, why are some schools persistently under-‐performing in absolute terms and in comparison to schools serving similar student populations? We hypothesize that the explanation can be found less in (1) the skill with which they are implementing school improvement-‐related actions; (2) the degree of integration and coherence among those actions; (3) the intensity of school improvement effort over time and (4) the capacity and ability of school leaders to mobilize, orchestrate and provide direction for school improvement over time. School leadership is key. When we compared the actions of principals in high and low performing schools we found, for example, that many principals in lower performing schools appeared to be less effective in using data, involving teachers and generating consensus around goals for improvement in student learning. We also found that principal direction and support for teachers’ collective learning and teamwork concerning student progress and the implementation of common expectations for instructional practice was manifested more strongly and consistently across the high performing schools than the low performing schools. We also found exceptions to these broad generalizations about principal leadership. In several of the low performing schools, for example, the principals were clearly demonstrating leadership in line with the core practices of successful leadership identified in research. However, it was typically the case in these instances that the principals were relatively new to their schools. Thus, the effects of productive leadership on turning around traditional indicators of low performance in those schools simply may not have had sufficient time to yield significant impact. We also encountered a few examples of less intensive leadership in some high performing schools. It appeared that professional norms around professional collaboration among teachers regarding the use of student assessment data for instructional planning, team planning and learning together about common teaching and learning practices were deeply institutionalized in the schools’ professional culture. There may have been less

193
need for principal direction than for principal continuation of what teachers were doing together to improve and sustain the quality of teaching and learning. There has been much talk about the need for principals to act as instructional leaders in their schools who effectively direct and focus efforts on developing the quality of teaching and learning and effectively mobilize and coordinate resources and professional and moral support to that end. Our findings do not dispute that view, however, they do illustrate variability in how principals enact instructional leadership. A key source of variability concerns the extent to which principals themselves have and are recognized by their teachers as having professional expertise related to the various aspects of improvement in teaching and learning in their schools. It seems impractical to expect all principals to be instructional experts in literacy, numeracy and other curriculum areas that might be a focus for improvement in schools. At a minimum, however, they need to have sufficient understanding of effective teaching and learning practices to be able to support teacher learning and implementation. The number of principals in our study who self-‐identified and who teachers described, as instructional leaders was small and typically limited to principals who communicated clear expectations for instructional practices, who personally led professional development activities in the school and who were able to provide advice to teachers on instructional practices. These principals were not only found in high performing schools. In fact, they tended to be concentrated more in schools in challenging socio-‐economic circumstances, both high and low performing. Another group of principals enacted instructional leadership less through demonstrations of their personal pedagogical expertise than through their capabilities as effective managers of continuous improvement through the establishment of clear goals, use of data, enabling support for teacher learning and collaboration and monitoring and leveraging pedagogical expertise from outside the school (e.g., board consultants) and inside the schools (e.g., resource teachers and other leaders). The incidence of this managerial approach to instructional leadership was notably consistent among the French language schools in our study and appeared to reflect consensus across the French language system regarding the organization and distribution of leadership for school improvement between principals and central office resource personnel. A third group of principals appeared to be comparatively less effective in the enactment of instructional leadership through either of these approaches. They were more concentrated in that group of schools which were classified in our study as low performing, and more particularly in the low performing high SES schools. The low performing high SES schools in this study repeatedly stand out in our findings and analysis as settings where key elements of school improvement practice are not working particularly well. This appeared to be connected to issues of school leadership and to external direction and support from their school boards and the Ministry. These were the schools, for example, where teachers reported that their principals rarely visited their classrooms and engaged them in discussions about their teaching

194
and learning practices. These were the schools where principals were reportedly more likely to emphasize support for teacher development aligned with teachers’ personal professional interests than with school goals for improvement in teaching and learning. Teachers among these schools were more likely to describe their principals as laissez faire in relation to school improvement, or even ineffective in the basic administration of the school. At the same time, we note that because their school results are persistently low relative to other high SES community schools, the results are sufficiently high that these schools have not necessarily been identified as targets for improvement and for receipt of additional resources and organized support from the Literacy and Numeracy Secretariat and their local school boards equivalent to that provided to schools in the government’s turnaround school and OFIP/PICO programs. Additionally, we found that while the incidence of principal turnover was no greater in the low performing high SES schools, central office authorities were not necessarily replacing principals who were previously ineffective in mobilizing improvement in student learning outcomes with principals who were more productive instructional leaders. It would be inappropriate to infer from these comments that the principals and teachers in these schools are not well intentioned. However, our findings do suggest that school leaders in this group of schools overall have been less effective in leading and supporting the implementation and coordination of the key elements of school improvement investigated in this study – i.e., goal setting and planning for improvement in teaching and learning; the use of EQAO and other student assessment data for instructionally-‐focused decision making at the school and classroom levels; professional teamwork amongst teachers focused on school goals and plans for improvement; shared professional learning and implementation of common expectations for instruction; mobilization of expertise for improvement in literacy and numeracy and monitoring classroom practice to understand and to provide follow-‐up support to teachers in the accomplishment of school goals for improvement in teaching and learning. In conclusion, we believe it is important to remind ourselves and readers of this report about some limitations of this study. First, the study is limited to 22 elementary schools. While these schools were purposefully selected to reflect the diversity of schools in the province in terms of jurisdiction (various school boards, French and English language systems), school performance and community characteristics, the sample is not large enough to confidently generalize the findings to all high and low performing schools across the province, particularly within the sub-‐categories of the school sample (high performing high SES, high performing low SES, low performing high SES, low performing low SES). Second, and again related to sample size, we were constantly reminded of the idiosyncratic circumstances of individual schools, related to such things as principal turnover, recent school amalgamation and exceptions in findings for particular schools that mitigated against generalizations to schools within particular categories. As a result, we prefer to characterize our findings as salient tendencies within and across the school groups studied. A second methodological limitation relates to the data and

195
findings concerning classroom practices of students and teachers. We set out to gather classroom observation as well as survey and interview data from teachers and principals about instructional practices. Ultimately, we judged our classroom observation data as not reliable on methodological grounds, and have not reported those data in this study. Clearly, the findings from this and subsequent comparative investigations of school effectiveness in Ontario schools would be enhanced by deeper investigation of what students and teachers are doing in the classroom and how well they are doing it.
Overall, we were impressed with the similarities across schools in what principals and teachers said is happening to create and sustain effective schools. We have puzzled and probed our data about how to explain the persistence of variability in school performance despite the lack of obvious and consistent variability in what school personnel say they are doing to create effective schools. Our conclusion, as articulated in this final section, is that the differences arise in the skill and persistence of school leaders and teachers in the enactment and coordination of the core conditions and practices associated with school effectiveness. An important implication of this conclusion is that future investigations need to be designed to more explicitly address issues of skill in both leadership and classroom practice as they related to indicators of student learning.
END

196
References Bennett, B. & Rolheiser, C. (2001). Beyond Monet: The artful science of instructional integration. Toronto, ON: Bookation Inc.
Calman, R. (2010). Exploring the underlying traits of high-‐performing schools. Toronto, ON: EQAO Research, Education Quality and Accountability Office.
Campbell, C. & Fullan, M. (2006). Unlocking potential for learning: Effective district-‐wide strategies to raise student achievement in literacy and numeracy. Project Report. Toronto, ON: Ministry of Education of Ontario.
Cohen, J. (1988). Statistical Power Analysis for the Behavioral Sciences (2nd ed.) Lawrence Erlbaum Associates. Dembo, M. & Gibson, S. (1985). Teachers’ sense of efficacy: An important factor in school improvement. Elementary School Journal, 86, 173-‐184.
DuFour, R., Eaker, R., & DuFour R. (Ed) (2005). On common ground: The power of professional learning communities. Bloomington, IN: National Education Service.
Edmonds, R. R. (1979). Effective schools for the urban poor. Educational Leadership, 37(10), 15–24.
Epstein, J. (1995). School/family/community partnerships: Caring for the children we share. Phi Delta Kappan 76(9), 701-‐712.
Fisher, D. (n.d.). A gradual release of responsibility. Research and Development for Jamestown Reading Navigator.
Fullan M., Hill, P., & Crevola, C. (2006). Breakthrough. Thousand Oaks, CA: Corwin Press.
Hine, E. & Maika, D. (2008). Why the teaching-‐learning critical pathway and why now? Principal Connections 12(1), pp. 16-‐19.
Leithwood, K., Harris, A. & Strauss, T (2010). Leadership for turning schools around. San Francisco, CA: Jossey-‐Bass.
Leithwood, K., Louis, K.S., Anderson, S. & Wahlstrom, K. (2004). Review of research: How leadership influences student learning. New York, NY: The Wallace Foundation.

197
Leithwood, K., Day, C., Sammons, P., Harris, A. & Hopkins, D. (2006). Successful school leadership: Wht it is and how it influences pupil learning. Research Report No. 800. Nottingham, UK: Department for Education and Skills, National College for School Leadership.
Levine, D. V., & Lezotte, L. W. (1990). Unusually effective schools: A review and analysis of research and practice. Madison, WI: The National Center for Effective Schools Research and Development. Little, J.W. (1982). Norms of collegiality and experimentation: Workplace conditions of school success. American Educational Research Journal 19(3), 325-‐340.
Little, J.W. (1987). Teachers as colleagues. In V. Richardson-‐Koehler (Ed.), Educator’s Handbook: A Research Perspective. White Plains, NY: Longman, 491-‐518.
Louis, K.S, Leithwood, K., Wahlstrom, K., Anderson, S., Michlin, M., Mascall, B., Gordon, M., Strauss, T., Thomas, E., & Moore, S. (2010). Learning from Districts’ Efforts to Improve Student Achievement: Final Report of Research to the Wallace Foundation. NY, NY: Wallace Foundation. Mintrop, H. & Trujillo, T. (2007). School improvement under test-‐driven accountability: A comparison of high and low-‐performing middle schools in California, Report #717, Center for the Study of Evaluation. Los Angeles, CA: National Center for Research on Evaluation, Standards, and Student Testing, Graduate School of Education & Information Studies University of California. Mitchell, C. & Sackney, L. (2000). Profound Improvement: Building capacity for a learning community. Lisse, The Netherlands: Swets & Zeitlinger Publishers. Newmann, F.M., Secada, W.G. & Wehlage, G.G. (1995). A guide to authentic instruction and assessment: Vision, standards, and scoring. Madison, WI: Wisconsin Center for Education Research, pp. 86-‐93. Nunnally, J. C. (1978). Psychometric theory (2nd ed.). New York: McGraw-‐Hill. Purkey, S. & Smith, M. (1983). Effective schools: A review. Elementary School Journal 83, 427-‐452.
Robinson, V., Hohepa, M. & Lloyd, C. (2009). School leadership and student outcomes: Identifying what works and why. Wellington, NZ: New Zealand Ministry of Education, Best Evidence Synthesis Programme (http://educationcounts.govt.nz/got/BES.) Rosenholtz, S. (1989). Teachers workplace: The social organization of schools. New York: Longman.

198
Sackney, L. (2007). History of the school effectiveness and Improvement movement in Canada over the past 25 years. In T. Townsend (Ed.), International Handbook of School Effectiveness and Improvement, 167–182. The Netherlands, Springer. Sammons, P., Hillman, J., & Mortimore, P. (1995). Key characteristics of effective schools: A review of school effectiveness research. London: Ofsted. Taylor, B. (2004). School change Classroom Observation Manual. Minneapolis, MN: Center for the Improvemetn of Early Reading Achievement, University of Minnesota Teddlie, C. and Stringfield, S. (2007). A history of school effectiveness and improvement research in the USA focusing on the past quarter century. In T. Townsend (Ed.), International Handbook of School Effectiveness and Improvement, 131–166. The Netherlands, Springer. Timperley, H., Wilson, A., Barrar, H. & Fung, I. (2007).Teacher professional learning and development. Wellington, NZ: New Zealand Ministry of Education, Best Evidence Synthesis Programme (http://educationcounts.govt.nz/got/BES.) Tschannen-‐Moran, M., Woolfolk Hoy, A., & Hoy, W.K. (1998). Teacher efficacy: It’s meaning and measure. Review of Educational Research, 68(2), 202-‐248. Ungerleider,C. and Levin, B. (2007). Accountability, funding and school improvement in Canada. In T. Townsend (Ed.), International Handbook of School Effectiveness and Improvement, 411-‐424. The Netherlands, Springer. Wahlstrom, K. (2012). An up-‐close view of instructional leadership: A grounded analysis. In K. Leithwood and K. Seashore Louis (Eds.) Linking leadershiop to student learning, Chapter 6, 68-‐86. San Francisco, CA: Jossey-‐Bass. Ontario Ministry of Education documents Institute for Education Leadership (2010). Putting Ontario’s Leadership Framework Into Action: A Guide for School and System Leaders. Toronto, ON: Institute for Education Leadership, Ministry of Education of Ontario. Literacy and Numeracy Secretariat Ontario (2007a). Learning blocks. Capacity Building Series, Special Edition #1. Toronto, ON: Ontario Ministry of Education, Literacy and Numeracy Secretariat. Literacy and Numeracy Secretariat Ontario (2007b). Teacher moderation: Collaborative assessment of student work. Capacity Building Series, Special Edition #2. . Toronto, ON: Ontario Ministry of Education, Literacy and Numeracy Secretariat.

199
Literacy and Numeracy Secretariat Ontario (2008). Teaching-‐Learning Critical Pathways. Capacity Building Series, Special Edition #6. Toronto, ON: Ontario Ministry of Education, Literacy and Numeracy Secretariat. Literacy and Numeracy Secretariat Ontario (2010). Collaborative teacher inquiry. Capacity Building Series, Special Edition #18. Toronto, ON: Ontario Ministry of Education, Literacy and Numeracy Secretariat. Ministry of Education Ontario (2010). School Effectiveness Framework: A support for school improvement and student success. Toronto, ON: Ministry of Education Ontario. Ministry of Education Ontario (2006a). The Ontario Curriculum Grades 1-‐8: Language. Toronto, ON: Ministry of Education Ontario. Ministère de l’Éducation de Ontario (2006b). Le curriculum de l’Ontario de la 1re a la 8e année: Français. Toronto, ON: Ministère de l’Éducation de Ontario.

200
APPENDIX A -‐ TEACHER SURVEY (ENGLISH AND FRANCAIS)

201

202

203

204
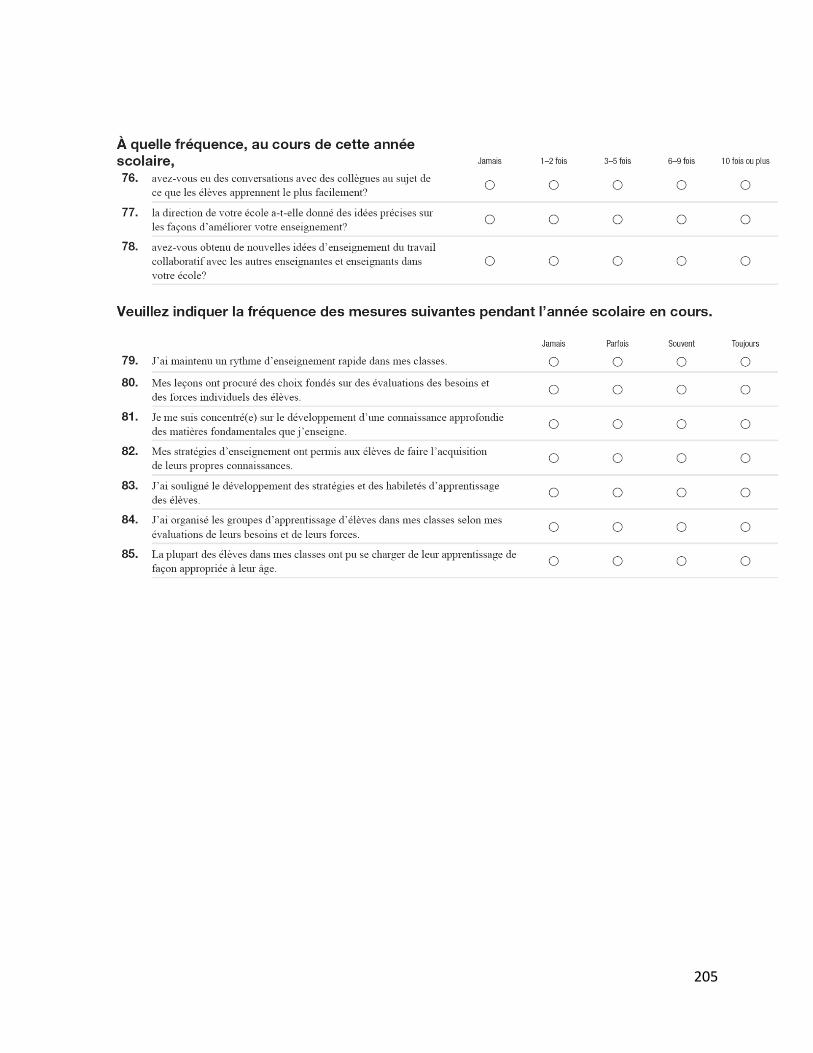
205

206

207

208

209

210

211

212

213

214

215

216
APPENDIX B -‐ INTERVIEW GUIDES ENGLISH

217
EQAO Elementary School Success Study Principal Interview
Introduction and Explanation
EQAO is interested in better understanding school success in elementary schools across Ontario. Our focus is on how schools with different kinds of student populations and various patterns of EQAO results see themselves, how they define and understand school success, and what strategies they use to support school success. Academic performance on provincial Grade 3 and 6 tests is one indicator of school success; schools can also be successful in other ways. The study will provide an opportunity for principals and teachers from participating schools to highlight areas of school success including, but not limited to, results of achievement tests and to identify the strategies schools have developed to address challenges and support success. The study will also investigate the interactions between schools and their partners including parents, the school board, the Ministry and the community, all of whom might provide direction or support.
Before we start, please tell us how long you have been the principal in this school.
School Context
1. What would you say is important for us to know and understand about your school that relates to its current and future potential for success? The community? The staff? Other?
School Success
2. All schools want to be successful, but the meaning of success can vary for different schools. How do you define success in the context of your and your teachers’ work in this school?
3. What do you see as your school’s greatest areas of success? Evidence?
4. What do you see as the main challenges to the school’s continued success?
School leadership
5. What are the major directions or focuses for improvement in the school? How were they determined? [Prompt: What steps are being taken to address them?]

218
6. Talk to us about leadership and school success in your school. How do you, as principal, contribute to school success? Specific examples? [Prompt: What other sources of leadership from inside or outside the school contribute significantly to school success efforts and in what ways?]
Curriculum and teaching
7. Are there any specific programs and practices that classroom teachers are expected to implement in this school to promote success for all students? Explain. Do they have flexibility to modify them?
8. What is done to monitor the quality of teaching in this school? Classroom observation? Reviewing student work? Other? Your role?
9. What strategies are used in this school to support and develop teachers’ individual and collective capacity to be effective teachers? Teamwork? Professional learning? Evidence of impact? Your role?
10. What classroom and school-‐wide processes are in place to help create awareness of children who are struggling and falling behind in their school work—in addition to IEP and IPRC processes? [Prompt: What is done with those students?]
11. Are there any school-‐wide initiatives to deepen the learning of students who are meeting or exceeding expectations for achievement? Explain.
Assessment and Achievement
12. How are data used in decisions about school improvement plans and progress in your school? Types of data (EQAO, other)? Activities and products for using data? Sources of assistance? Your role?
13. How are data used by teachers to inform instructional decision-‐making at the classroom level? Types of data (e.g., formative assessment)? Activities (e.g., moderated marking) and products (e.g., data walls) for using data? Sources of assistance?
Climate
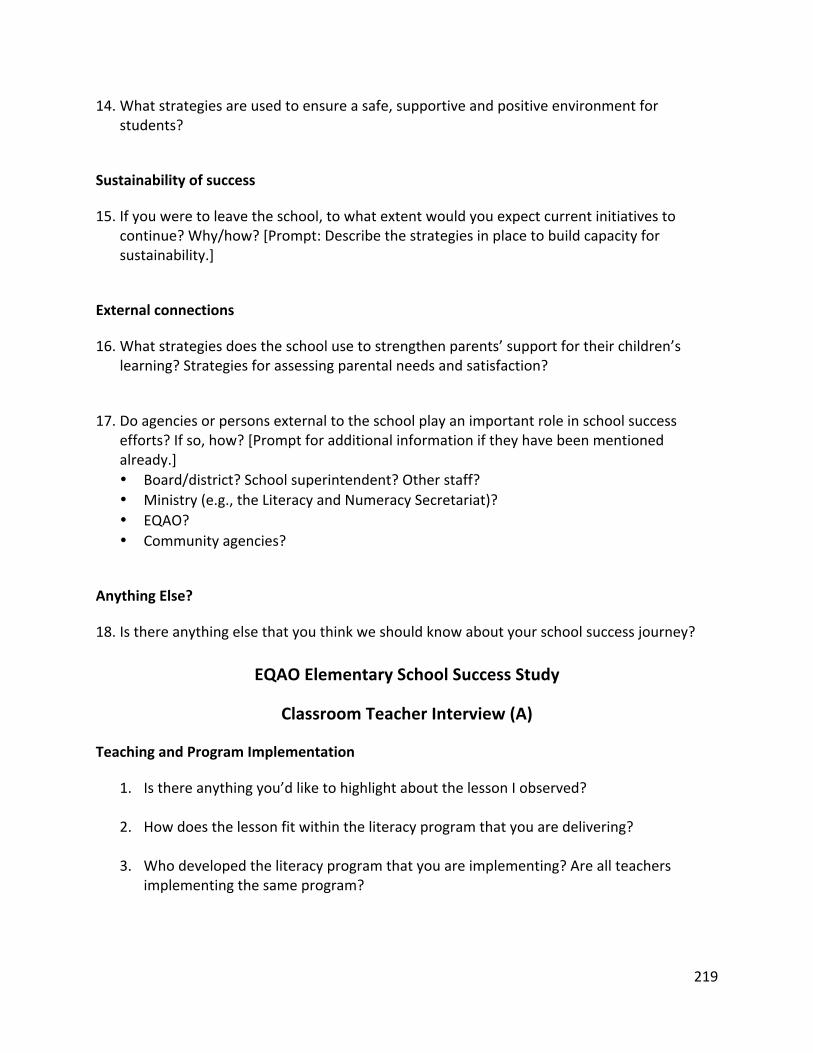
219
14. What strategies are used to ensure a safe, supportive and positive environment for students?
Sustainability of success
15. If you were to leave the school, to what extent would you expect current initiatives to continue? Why/how? [Prompt: Describe the strategies in place to build capacity for sustainability.]
External connections
16. What strategies does the school use to strengthen parents’ support for their children’s learning? Strategies for assessing parental needs and satisfaction?
17. Do agencies or persons external to the school play an important role in school success efforts? If so, how? [Prompt for additional information if they have been mentioned already.] • Board/district? School superintendent? Other staff? • Ministry (e.g., the Literacy and Numeracy Secretariat)? • EQAO? • Community agencies?
Anything Else?
18. Is there anything else that you think we should know about your school success journey?
EQAO Elementary School Success Study
Classroom Teacher Interview (A)
Teaching and Program Implementation
1. Is there anything you’d like to highlight about the lesson I observed?
2. How does the lesson fit within the literacy program that you are delivering?
3. Who developed the literacy program that you are implementing? Are all teachers implementing the same program?

220
4. Programs vary in the amount of structure and choice they provide to teachers. What flexibility do you have in implementing your literacy program?
5. What do you and other teachers do to identify students who are struggling or “falling behind”? At the classroom level? At the school level? [Prompt: What actions are taken?]
6. Are you and other teachers doing anything specific to deepen the learning of students who are meeting or exceeding expectations in the regular program? Explain.
7. In the lesson I observed, were the learning activities differentiated in any way? Explain.
Goals and Expectations
8. All schools want to be successful. What does “success” mean to you in the context of work in your school?
9. What student learning and development needs does your school do a particularly good job of addressing?
10. What student learning and development needs could be addressed more effectively?
11. What factors have the greatest impact on the quality of learning for students attending this school?
12. What are the major directions or focuses for improvement in the school? How were they determined? [Prompt: What actions are being taken to address them?]
Leadership 13. What role does your principal play in guiding and supporting your work in the
classroom? For example, -‐ frequency/purpose of classroom observation. -‐ feedback/suggestions to help your instruction.
14. Does anyone else in the school play a significant role in guiding and supporting your
work in the classroom? If yes, explain. [Prompt: For example, central office staff.] Professional Community and Learning
15. In what ways do teachers in this school collaborate with one another on matters of teaching and learning? Contexts? Participants and processes? Examples?

221
16. What kinds of direction and assistance are provided by the principal and/or central office staff to support collaboration among teachers?
17. What support and opportunities for professional learning have an impact on your efforts to improve the quality of teaching and learning? Examples from the current school year?
Shared Leadership and Decision-‐Making
18. What role and influence do teachers have in setting school improvement goals and plans?
Parent-‐School Connections
19. What would you highlight about the community served by your school? What special needs or challenges does it present? 20. How are parents involved in your school? [Prompt: What influence do they have on staff efforts to ensure the quality of student learning and life at the school?]
EQAO Elementary School Success Study
Classroom Teacher Interview (B)
Teaching and Program Implementation
1. Is there anything you’d like to highlight about the lesson I observed?
2. How does the lesson fit within the literacy program that you are delivering?
3. Who developed the literacy program that you are implementing? Are all teachers implementing the same program?
4. Programs vary in the amount of structure and choice they provide to teachers. What flexibility do you have in implementing your literacy program?
5. What do you and other teachers do to identify students who are struggling or “falling behind”? At the classroom level? At the school level? [Prompt: What actions are taken?]
6. Are you and other teachers doing anything specific to deepen the learning of students who are meeting or exceeding expectations in the regular program? Explain.
7. In the lesson I observed, were the learning activities differentiated in any way? Explain.

222
Goals and Expectations
8. All schools want to be successful. What does “success” mean to you in the context of work in your school?
9. What student learning and development needs does your school do a particularly good job of addressing? 10. What student learning and development needs could be addressed more effectively?
11. What factors have the greatest impact on the quality of learning for students attending this school?
12. What are the major directions or focuses for improvement in the school? How were they determined? [Prompt: What actions are being taken to address them?]
Leadership 13. What role does your principal play in guiding and supporting your work in the
classroom? For example, -‐ frequency/purpose of classroom observation. -‐ feedback/suggestions to help your instruction.
14. Does anyone else in the school play a significant role in guiding and supporting your
work in the classroom? If yes, explain. [Prompt: For example, central office staff.]
Data Use
15. How are data about students used in classroom-level decisions about teaching and learning? Kinds of data used? Processes? Purposes and contexts?
16. How are data about students used in decisions about school improvement? Kinds of data used? Processes? Purposes and contexts?
17. What help do you get in the use of data for classroom and school improvement? Tools, expertise, time?
School Climate
18. How would you describe the teaching and learning climate in your school? To what do you attribute it?
Parent-‐School Connections

223
19. What would you highlight about the community served by your school? What special needs or challenges does it present?
20. How are parents involved in your school? [Prompt: What influence do they have on staff
efforts to ensure the quality of student learning and life at the school?]
EQAO Elementary School Success Study
School Success Focus Group
1. What would you say is important for us to know and understand about your school? Can you talk about the demographics and important features of your community to give a better understanding of your school profile?
2. All schools want to be successful, but the meaning of success can vary for different schools. How do you define success in the context of your school?
3. What are your school’s greatest areas of success? Can you give us examples?
4. To what do you attribute these areas of success?
5. How is your school striving to approach and sustain improvement over time?
6. Are there areas of challenge that the staff in your school have identified? Can you talk about them as well as how you hope to address them?

224
EQAO Elementary School Success Study Parent Focus Group
1. What would you say is important for us to know and understand about your school? What are its most significant attributes? What about the student body? Important features of the community?
2. We believe that all schools want to be successful. Please talk about what success means to you in the context of the work of your school.
3. What do you believe are the school’s greatest areas of success? How can you tell?
4. What causes the school to be successful in these ways?
5. How are parents contributing to the school’s success? At home? At school?
6. What are the school’s primary challenges to success and ongoing improvement?
7. What is being done to address those challenges? What role are parents playing in these efforts?
8. What are the main challenges to effective parental involvement in supporting a positive learning environment for students?
9. How do you receive information about the EQAO testing program and about the results for your school? Are there different ways you would prefer to receive this information?
10. How could the school and its parent community best work together to use the EQAO test results to support student achievement at the school?

225
EQAO Elementary School Success Study
Student Focus Group
School Climate 1. If you were visiting with some friends from out of town and they asked you what it
was like attending this school, what would you tell them?
[Prompts: What do you like most about being at this school? Is there anything that your teachers and the principal do that helps make the school that way? (Ask for specific examples/illustrations.)] Is there anything that your teachers and the principal could do to make the school better?
Assessment of Learning 2. How do you know how well you are doing in your school work and learning?
[Prompts: What (other) kinds of things do your teachers do that help you understand how well you are doing in your school work? (Ask for specific examples/illustrations.)]
Assistance with Learning Problems 3. What things help you to be successful in your school work?
4. What do your teachers do to try to help kids who are having trouble with their
school work? [Ask for specific examples/illustrations.] [Prompt: Has your teacher ever had to help you with something you didn’t understand or do well the first time? What did he or she do?]
5. What do your teachers do to find out if you and your classmates are having trouble
understanding and doing your school work well? [Ask for specific examples/illustrations.]
Learning at Home 6. How much homework do your teachers give you? Examples of homework in the last
week? 7. Where do you do your homework? If you get stuck, what do you do?

226
Purpose of Learning 8. What are you and your classmates learning about this week in your reading and
writing lessons? [Ask for specific details.] 9. Why do you think that you are being asked to learn that?
[Prompt: What did your teachers tell you about why you should learn that?]

227
APPENDIX C -‐ GUIDES D’ENTREVUE

228
Étude de l’OQRE sur la réussite des écoles élémentaires Entrevue avec les directrices et directeurs
Introduction et explication
L’OQRE désire mieux comprendre la réussite des écoles élémentaires en Ontario. Nous désirons particulièrement comprendre comment les écoles ayant différents types de populations d’élèves et différents modèles de résultats de l’OQRE se perçoivent, comment elles définissent et comprennent la réussite de l’école, et quelles stratégies elles utilisent pour appuyer la réussite de l’école. Le rendement scolaire sur les évaluations provinciales pour la 3e année et la 6e année est un indicateur de la réussite de l’école; les écoles peuvent aussi réussir d’autres façons. L’étude procurera l’occasion aux directrices, directeurs, enseignantes et enseignants des écoles participantes de souligner des domaines de réussite des écoles mais aussi, sans s’y limiter, les résultats des tests mesurant le rendement, ainsi que d’identifier les stratégies que les écoles ont élaboré pour apporter des améliorations et appuyer la réussite. L’étude portera également sur les interactions entre les écoles et leurs partenaires, y compris les parents, le conseil scolaire, le ministère et la collectivité, lesquels pourraient procurer une orientation ou de l’appui.
Avant de commencer, pourriez-‐vous nous dire depuis combien d’années vous êtes [directrice ou directeur] de cette école?
Contexte scolaire
18. 1. À votre avis, que devrions-‐nous savoir et comprendre de votre école qui est lié à sa probabilité actuelle et future de réussir? La collectivité? Le personnel? Autre?
Réussite de l’école
19. 2. Toute école veut réussir, mais ce que signifie le concept de la réussite peut varier pour les écoles différentes. Comment définissez-‐vous la réussite dans le contexte de votre travail à cette école et celui de votre personnel enseignant?
20. 3. Quels sont les plus grands domaines de réussite de votre école?
21. 4. Quelles sont les principaux obstacles à la réussite continue de votre école?

229
Leadership dans l’école
22. 5. Quelles sont les principales concentrations ou cibles pour l’amélioration à l’école? De quelle façon ont-‐elles été déterminées? [Suggestion : Par quelles mesures ou démarches s’en occupe-‐t-‐on?]
23. 6. Veuillez nous parler du leadership et de la réussite à votre école. En tant que [directrice ou directeur], comment contribuez-‐vous à la réussite de l’école? Des exemples spécifiques? [Suggestion : Quelles autres sources de leadership existent à l’intérieur ou à l’extérieur de l’école qui contribuent d’une manière signifiante aux efforts de la réussite? Comment?]
Curriculum et enseignement
7. Existe-‐t-‐il des programmes et pratiques spécifiques dans cette école pour lesquels on exige la mise en œuvre de la part du personnel enseignant pour la réussite de tous les élèves? Veuillez expliquer. Le personnel enseignant a-‐t-‐il la flexibilité de les modifiés?
8. Comment le suivi de la qualité de l’enseignement dans l’école est-‐il effectué? L’observation en salle de classe? La révision du travail des élèves? Autre? Et votre rôle?
9. Quelles stratégies existent à cette école pour appuyer et développer la capacité individuelle et collective d’enseignement productif ? Le travail en équipe? L’apprentissage professionnel? Quelques preuves d’accroissement de capacité? Et votre rôle?
10. Existe-‐t-‐il des stratégies mises en place à l’échelle de l’école visant à créer la sensibilité aux élèves dont le rendement est faible et qui ont du retard dans leur travail scolaire – en plus des processus PEI et CIPR? [Suggestion : Que faites-‐vous de ces élèves?]
11. Existe-‐t-‐il des initiatives à l’échelle de l’école qui approfondissent l’apprentissage des élèves qui atteignent ou dépassent les attentes de rendement scolaire? Veuillez expliquer.

230
Évaluation et rendement
12. De quelle façon les données contribuent-‐elles aux décisions à propos des plans d’amélioration et du progrès dans votre école? Les activités et les produits pour l’utilisation des données? Les sources d’assistance? Et votre rôle?
13. De quelle façon le personnel enseignant utilise-‐t-‐il les données pour éclairer et influencer les décisions au niveau de l’enseignement en salle de classe? Quels types de données (p. ex., évaluations formatives)? Les activités (p. ex., la notation modérée) et les produits (p. ex., murs de données) pour l’utilisation des données? Les sources d’assistance?
Élèves
14. Quelles stratégies sont utilisées pour assurer un environnement sécuritaire et positif pour les élèves, au sein duquel elles et ils se sentent appuyés?
Viabilité de la réussite
15. Si vous quittiez l’école, à quel point croyez-‐vous que les initiatives actuelles se poursuivraient? Pourquoi/comment? [Suggestion : Décrivez les stratégies que vous utilisez pour accroître la capacité et assurer la viabilité.)
Rapports à l’extérieur de l’école
16. Quelles stratégies l’école utilise-‐t-‐elle pour renforcer l’appui des parents envers l’apprentissage de leurs enfants? Quelles sont les stratégies utilisées pour évaluer les besoins des parents et leur niveau de satisfaction?
17. Est-‐ce que des organismes ou des personnes de l’extérieur de l’école jouent un rôle important dans vos efforts visant la réussite de l’école? Si oui, comment? [Demander de l’information supplémentaire si les réponses initiales à cette question répètent celles aux questions précédentes.]
a. Conseil scolaire/district? Surintendante ou surintendant de l’école? Autre personnel? b. Ministère (p. ex., le Secrétariat de la littératie et de la numératie)? c. OQRE? d. Organismes communautaires? e.
Autre?Y a-‐t-‐il autre chose que nous devrions savoir au sujet du cheminement de votre école vers la réussite?

231
Étude de l’OQRE sur la réussite des écoles élémentaires
Entrevue avec les titulaires de classe (Version A)
Experience professionelle (annees de experience comme enseignant/e et dans cette école)
Enseignement et mise sur pied du programme
1. Y a-‐t-‐il des éléments que vous aimeriez souligner au sujet de la leçon que j’ai observée? 2. De quelle façon la leçon est-‐elle cohérente dans le contexte du programme de littératie que
vous enseignez? 3. Qui a développé le programme de littératie que vous mettez sur pied? 4. Les programmes varient selon la mesure de structure et de choix qu’ils procurent aux
enseignantes et enseignants. Quelles souplesse avez-‐vous dans la mise en œuvre de votre programme de littératie?
5. Que faites-‐vous, ainsi que les autres enseignantes et enseignants, pour identifier les besoins des élèves qui éprouvent des difficultés? Au niveau de la salle de classe? Au niveau de l’école? [Suggestion : Quelles mesures sont prises?]
6. Est-‐ce que vous et les autres enseignantes et enseignants prennent des mesures précises
pour rehausser l’apprentissage des élèves qui atteignent ou dépassent les attentes du programme habituel? Veuillez expliquer.
7. En ce qui a trait à la leçon que j’ai observée, les activités d’apprentissage étaient-‐elles
différenciées de quelque façon ou autre? Veuillez expliquer.
Objectifs et attentes
8. Toutes les écoles veulent réussir. La « réussite », que signifie-‐t-‐elle pour vous dans le contexte du travail dans votre école?
9. Quels genres de besoins en matière d’apprentissage et de développement des élèves est-‐ce
que votre école réussit très bien à combler? 10. Existe-‐t-‐il d’importants besoins en matière d’apprentissage et de développement que votre
école ne comble pas de manière adéquate?

232
11. Quels facteurs ont le plus d’influence sur la qualité de l’apprentissage des élèves qui étudient dans votre école?
12. Quelles sont les principales priorités ou cibles pour l’amélioration à l’école? De quelle façon
ont-‐elles été déterminées? [Suggestion : Par quelles démarches s’en occupe-‐t-‐on?]
Leadership
13. Quel rôle la direction de votre école joue-‐t-‐elle dans l’orientation et l’appui de votre travail dans votre salle de classe? Par exemple,
⋅ fréquence/objectifs d’observation en salle de classe. ⋅ rétroaction/suggestions pour vous aider en votre enseignement. 14. Y a-‐t-‐il une autre personne dans l’école qui joue un rôle important dans l’orientation et
l’appui de votre travail dans votre salle de classe? Si tel est le cas, veuillez expliquer. [Suggestion : Par exemple, l’appui du bureau central.]
Collectivité et apprentissage professionnelle
15. De quelles façons le personnel enseignant dans votre école collabore-‐t-‐il ensemble en ce qui a trait à l’enseignement et à l’apprentissage? Contextes? Participantes et participants et processus? Exemples?
16. Quels genres d’orientation et d’aide sont fournis par la direction ou le personnel du bureau
central pour appuyer une collaboration parmi le personnel enseignant?
17. Quels genres d’appui et d’occasions de perfectionnement professionnel ont de l’influence sur vos efforts d’améliorer la qualité de l’enseignement et de l’apprentissage? Exemples de l’année scolaire en cours?
Leadership partagé et prise de décisions
18. Quel rôle et influence le personnel enseignant a-‐t-‐il par rapport à l’établissement des objectifs d’amélioration de l’école?
Rapports entre les parents et l’école
19. Que souligneriez-‐vous au sujet de la collectivité desservie par votre école? Quels besoins particuliers ou difficultés présente-‐elle?

233
20. Quelle est la participation des parents dans votre école? [Suggestion : Quelle influence ont-‐ils sur les efforts du personnel pour assurer la qualité de l’apprentissage et de la vie à l’école?]

234
Étude de l’OQRE sur la réussite des écoles élémentaires
Entrevue avec les titulaires de classe (Version B)
Experience professionelle (annees de experience comme enseignant/e et dans cette école)
Enseignement et mise sur pied du programme
1. Y a-‐t-‐il des éléments que vous aimeriez souligner au sujet de la leçon que j’ai observée? 2. De quelle façon la leçon est-‐elle cohérente dans le contexte du programme de littératie que vous enseignez? 3. Qui a développé le programme de littératie que vous mettez sur pied? 4. Les programmes varient selon la mesure de structure et de choix qu’ils procurent aux enseignantes et enseignants. Quelles souplesse avez-‐vous dans la mise en œuvre de votre programme de littératie?
5. Que faites-‐vous, ainsi que les autres enseignantes et enseignants, pour identifier les besoins des élèves qui éprouvent des difficultés? Au niveau de la salle de classe? Au niveau de l’école? [Suggestion : Quelles mesures sont prises?]
6. Est-‐ce que vous et les autres enseignantes et enseignants prennent des mesures précises pour rehausser l’apprentissage des élèves qui atteignent ou dépassent les attentes du programme habituel? Veuillez expliquer. 7. En ce qui a trait à la leçon que j’ai observée, les activités d’apprentissage étaient-‐elles différenciées de quelque façon ou autre? Veuillez expliquer.
Objectifs et attentes
8. Toutes les écoles veulent réussir. La « réussite », que signifie-‐t-‐elle pour vous dans le contexte du travail dans votre école? 9. Quels genres de besoins en matière d’apprentissage et de développement des élèves est-‐ce que votre école réussit très bien à combler? 10. Existe-‐t-‐il d’importants besoins en matière d’apprentissage et de développement que votre école ne comble pas de manière adéquate?
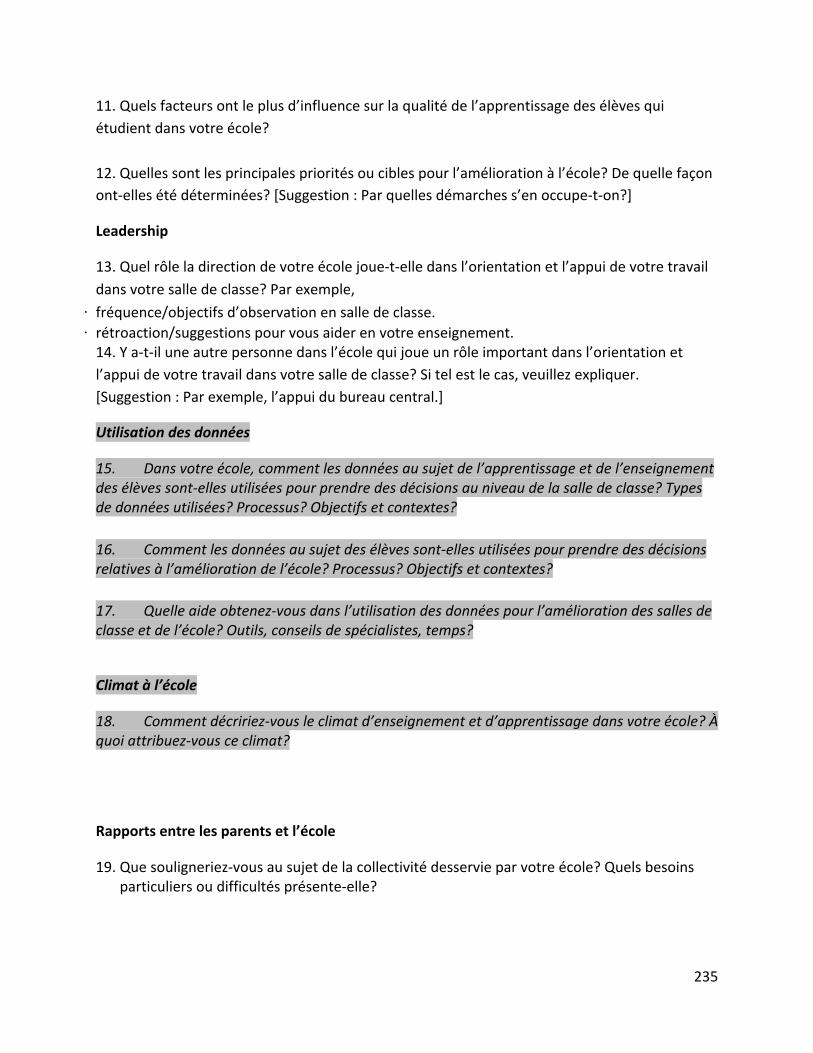
235
11. Quels facteurs ont le plus d’influence sur la qualité de l’apprentissage des élèves qui étudient dans votre école? 12. Quelles sont les principales priorités ou cibles pour l’amélioration à l’école? De quelle façon ont-‐elles été déterminées? [Suggestion : Par quelles démarches s’en occupe-‐t-‐on?]
Leadership
13. Quel rôle la direction de votre école joue-‐t-‐elle dans l’orientation et l’appui de votre travail dans votre salle de classe? Par exemple,
⋅ fréquence/objectifs d’observation en salle de classe. ⋅ rétroaction/suggestions pour vous aider en votre enseignement. 14. Y a-‐t-‐il une autre personne dans l’école qui joue un rôle important dans l’orientation et l’appui de votre travail dans votre salle de classe? Si tel est le cas, veuillez expliquer. [Suggestion : Par exemple, l’appui du bureau central.]
Utilisation des données
15. Dans votre école, comment les données au sujet de l’apprentissage et de l’enseignement des élèves sont-‐elles utilisées pour prendre des décisions au niveau de la salle de classe? Types de données utilisées? Processus? Objectifs et contextes? 16. Comment les données au sujet des élèves sont-‐elles utilisées pour prendre des décisions relatives à l’amélioration de l’école? Processus? Objectifs et contextes? 17. Quelle aide obtenez-‐vous dans l’utilisation des données pour l’amélioration des salles de classe et de l’école? Outils, conseils de spécialistes, temps?
Climat à l’école
18. Comment décririez-‐vous le climat d’enseignement et d’apprentissage dans votre école? À quoi attribuez-‐vous ce climat?
Rapports entre les parents et l’école
19. Que souligneriez-‐vous au sujet de la collectivité desservie par votre école? Quels besoins particuliers ou difficultés présente-‐elle?

236
20. Quelle est la participation des parents dans votre école? [Suggestion : Quelle influence ont-‐ils sur les efforts du personnel pour assurer la qualité de l’apprentissage et de la vie à l’école?]

237
Étude de l’OQRE sur la réussite des écoles élémentaires
Groupe de discussion sur la réussite de l’école
1. Selon vous, qu’est-‐ce qui est important que nous sachions et comprenions au sujet de votre école? Pouvez-‐vous parler de la démographie et des caractéristiques importantes de votre collectivité pour nous aider à mieux comprendre le profil de votre école?
2. Toute école veut réussir, mais ce que signifie le concept de la réussite peut varier pour les écoles différentes. Comment définissez-‐vous la réussite dans votre école?
3. Quels sont les grands domaines de réussite dans votre école? Pouvez-‐vous nous donner des exemples?
4. À quoi attribuez-‐vous ces domaines de réussite?
5. Comment votre école cherche-‐t-‐elle à amorcer et soutenir l’amélioration d’une année à l’autre?
6. Y a-‐t-‐il des domaines à améliorer que le personnel de votre école a identifiés? Pouvez-‐vous en parler, ainsi que de la façon dont vous compter apporter des améliorations?

238
Étude de l’OQRE sur la réussite des écoles élémentaires
Groupe de discussion des parents
1. Selon vous, qu’est-‐ce qui est important que nous sachions et comprenions au sujet de votre école? Quelles sont ses caractéristiques les plus importantes? Comment sont les élèves? Y a-‐t-‐il des éléments importants au sujet de la collectivité?
2. Nous croyons que toutes les écoles désirent réussir. Veuillez nous dire ce que la réussite
signifie pour vous dans le contexte du travail de votre école.
3. Selon vous, quels sont les plus importants domaines de réussite de l’école? Quelles en sont les preuves?
4. Quelle est la cause de ces domaines de réussite? 5. De quelle façon les parents contribuent-‐ils à la réussite de l’école? À la maison? À l’école? 6. Quels sont les principaux obstacles qui empêchent la réussite et l’amélioration continue? 7. Quelles mesures sont prises pour éliminer ces obstacles? Quel rôle est joué par les parents
relativement à ces efforts? 8. Quels sont les principaux obstacles empêchant la participation efficace des parents afin
d’appuyer un environnement d’apprentissage positif pour les élèves? 9. Comment obtenez-‐vous l’information relative au programme d’évaluations de l’OQRE et
aux résultats de votre école? À quel degré comprenez-‐vous cette information et les résultats?
10. Comment l’école et les parents peuvent-‐ils travailler efficacement ensemble pour utiliser les
résultats des tests de l’OQRE afin d’appuyer le rendement des élèves?

239
Étude de l’OQRE sur la réussite des écoles élémentaires
Groupe de discussion des élèves
Climat à l’école 10. 1. Si vous rendiez visite à des camarades qui venaient de l’extérieur de votre ville et qu’elles
ou ils vous posaient des questions au sujet de votre école, que leur diriez-‐ vous?
[Suggestions : Qu’aimez-‐vous le plus dans cette école? Y a-‐t-‐il des mesures que le personnel enseignant et la direction prennent pour assurer que c’est comme ça? (Demandez des exemples précis/des illustrations.)]
Y a-‐t-‐il d’autres mesures que le personnel enseignant et la direction pourrait prendre pour améliorer l’école?
Évaluation de l’apprentissage 11. 2. Comment savez-‐vous à quel point vous réussissez votre travail en classe et votre
apprentissage?
[Suggestions : Quels genres de mesures vos titulaires de classe prennent-‐ils qui vous aident à comprendre à quel point vous réussissez votre travail? (Demandez des exemples précis/des illustrations.)]
Aide par rapport aux difficultés d’apprentissage 4. Quelles choses vous aident à réussir votre travail scolaire?
5. Que font vos titulaires de classe pour découvrir si vous et les élèves dans votre classe ont de
la difficulté à comprendre et à bien faire votre travail? [Demandez des exemples précis/des illustrations.]
6. Que font vos titulaires de classe pour essayer d’aider les élèves qui ont des difficultés avec leur travail? [Demandez des exemples précis/des illustrations.]
[Suggestion : Est-‐ce que votre titulaire de classe a jamais eu à vous aider avec un travail que vous ne compreniez pas ou n’avez pas réussi la première fois? Qu’est-‐ce qu’elle ou il a fait?]
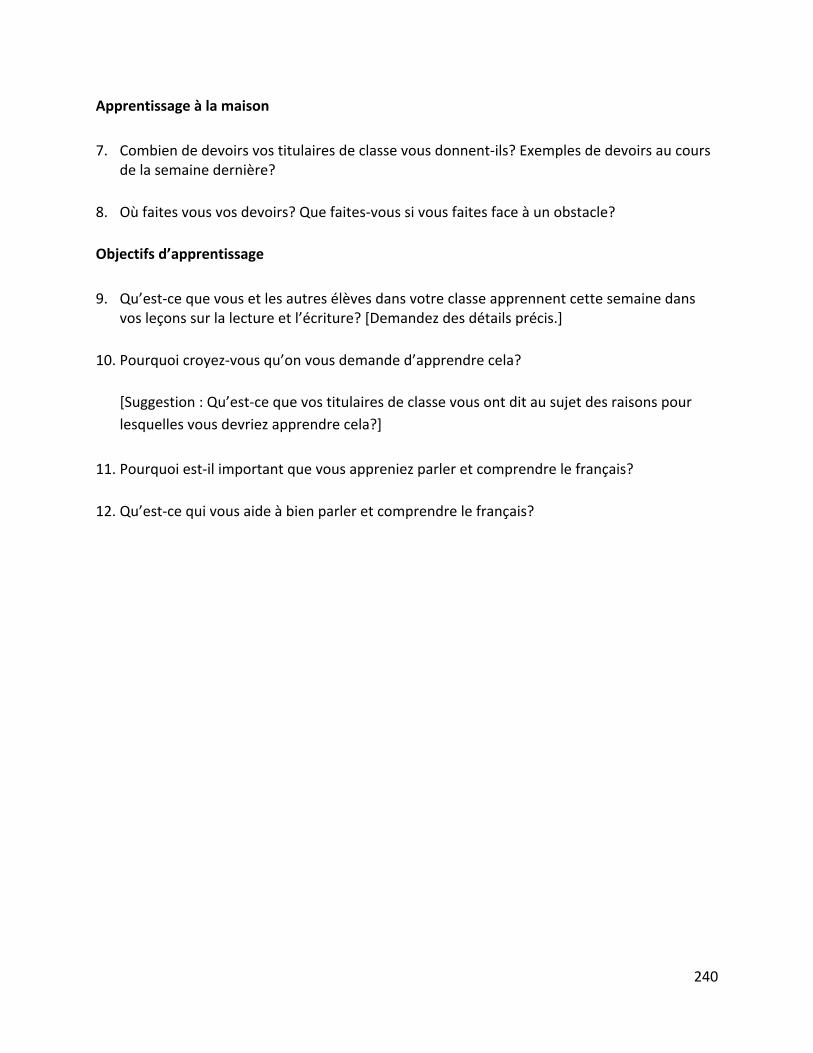
240
Apprentissage à la maison 7. Combien de devoirs vos titulaires de classe vous donnent-‐ils? Exemples de devoirs au cours
de la semaine dernière?
8. Où faites vous vos devoirs? Que faites-‐vous si vous faites face à un obstacle? Objectifs d’apprentissage 9. Qu’est-‐ce que vous et les autres élèves dans votre classe apprennent cette semaine dans
vos leçons sur la lecture et l’écriture? [Demandez des détails précis.] 10. Pourquoi croyez-‐vous qu’on vous demande d’apprendre cela?
[Suggestion : Qu’est-‐ce que vos titulaires de classe vous ont dit au sujet des raisons pour lesquelles vous devriez apprendre cela?]
11. Pourquoi est-‐il important que vous appreniez parler et comprendre le français?
12. Qu’est-‐ce qui vous aide à bien parler et comprendre le français?

241
APPENDIX D -‐ INTERVIEW CODING SYSTEM

242
NVIVO CODING MANUAL: EQAO SCHOOL SUCCESS STUDY
(Stakeholder = school personnel (principal, teachers), parents, students, and district agents interviewed)
PARENT CODE CHILD CODE DEFINITION RESEARCH QUESTION – INTERVIEW QUESTIONS
Context Community Characteristics of the community served by the school – demographic, socio-‐economic – and the influence of those characteristics on the school. These comments can refer to the parent community and/or the broader geographic community context of the school setting.
PI-‐1, SSFG-‐1,TI-‐23
School Characteristics of the school and the significance of those characteristics for the school – e.g., school facilities, school size, program structure (e.g., French Immersion), school personnel , reputation, performance.
PI-‐1, PFG-‐1
School Climate Perceived conditions of the school in relation to staff and student morale, engagement and attitudes towards school work (both staff & students), security, support, sense of community and social relations.
PI-‐14,TI-‐22, SFG-‐1
Success
Meaning Local stakeholder views about meaning or definition of “success” relative to their role in school and/or school system. May refer to focuses of success efforts and results, indicators of success, trends related to student engagement and performance, teacher professionalism, etc.
PI-‐2,SSFG-‐2, TI-‐8, PFG-‐2, DI-‐1
Supporting factors Local stakeholder accounts of key circumstances that influence the quality of student learning and other dimensions of success in the work of the school.
SSFG-‐4, TI-‐11, PFG-‐4, SFG-‐3
School strengths Stakeholder comments that highlight perceived areas or dimensions of school success, and evidence of that success.
PI-‐3, SSFG-‐3, TI-‐9, PFG-‐3, DI-‐10
School weaknesses Stakeholder comments that highlight perceived weaknesses and challenges to school success.
PI-‐4, SSFG-‐6, TI-‐10, PFG-‐6, SFG-‐1, DI-‐11
School SI Goals Current and past priorities and goals PI-‐5, TI-‐12, TI-‐21

243
Improvement: School
for school improvement defined at the school level. Also the processes for identifying and defining school level goals.
SI Strategies School Key actions enacted at the school level to mobilize, implement and support past and current school improvement.
PI-‐9, SSFG-‐5 &6, TI-‐12, PFG-‐7
SI Sustainability Key actions and conditions identified as key to continuous improvement and sustaining prior success.
PI-‐15, SSFG-‐5
School Improvement: District
DI Goals Current and past priorities and goals for school improvement defined at the district level. Also the processes for identifying and defining district wide SI goals.
DI-‐2
DI Strategies Key policies and actions enacted district-‐wide to mobilize, implement and support past and current school improvement.
DI-‐3, D-‐12, PI-‐17, TI-‐16
DI Monitoring District policies and strategies for monitoring school improvement progress and results at system/school levels.
DI-‐9, PI-‐17
External agencies Actions and influence of external agencies (e.g., Ministry, EQAO) on district-‐level goals and strategies for improvement.
DI-‐5, PI-‐17
Differentiated Support: System
Key district-‐level policies and strategies that differentiate district support for SI to schools in varying circumstances.
DI-‐4, DI-‐13
Leadership Principal Actions taken by principals to guide and support school improvement and success.
PI-‐6, TI-‐13
Other School Actions taken by school personnel other than principals (e.g., VP, teacher leaders) to guide and support school improvement and success.
PI-‐6, TI-‐14
External agencies Actions and influence of external agencies (non-‐school district) to guide and support school-‐level improvement activities.
PI-‐17 , TI-‐14
Monitoring Policies and strategies enacted at the school level by principals, teachers and others to monitor the school improvement progress and results in schools.
PI-‐8, TI-‐13
Teachers Development Policies, strategies and/or activities associated with teacher’
PI-‐9, TI-‐17

244
professional learning, and the impact of that professional learning on school improvement.
Collaboration Policies, strategies and/or activities associated with professional collaboration amongst teachers and the impact of collaboration on school improvement.
PI-‐9, TI-‐15, TI-‐16
Teaching Program Curriculum characteristics and expectations for literacy and other key program areas – developers/sources, program structure/coordination, materials, history of use, etc.
PI-‐7,TI-‐2,TI-‐3
Flexibility Reported degree of structure and flexibility for modification and innovation in program expectations and delivery.
PI-‐7,TI-‐4
Weak students Identification of and programmatic response to academically weak students
PI-‐10, TI-‐5, SFG-‐4
Strong students Programmatic actions taken at the district and/or school levels to address the needs of average and high performing students.
PI-‐11, TI-‐6, DI-‐6
Differentiated Instruction
Actions and expectations taken at the classroom/school and district levels to promote and support differentiated instruction in classrooms.
TI-‐7
Data Use District Data use at the school district level associated with defining needs, planning interventions, monitoring progress and results of school performance and ongoing needs for improvement.
DI-‐7
Data Use School Data use at the school level associated with defining needs, planning interventions, monitoring progress and results of school performance and ongoing needs for improvement.
PI-‐12,TI-‐19
Classroom Data use at the classroom level associated with defining needs, planning interventions, monitoring progress and results of school performance and ongoing needs for improvement.
PI-‐13, TI-‐18
Data support Support provided to principals and teachers to develop capacity to effectively use data to inform decisions about classroom /school
TI-‐20, DI-‐8

245
improvement. Data parents Actions taken by school or district
personnel to engage them in understanding data about school/student performance and SI plans.
PFG-‐9, PFG-‐10
Parent Involvement Parent involvement Policies and actions taken by school personnel to strengthen the awareness and contribution of parents to school improvement goals and plans. Descriptions of the status of parental involvement in schools and factors affecting that status.
PI-‐16, TI-‐24, PFG-‐5,7,8
Student Learning Purpose Student perceptions of the purposes of learning opportunities and activities presented by teachers.
SFG-‐8,9
Feedback Student reports of feedback (processes, content, value) provided by teachers about the progress and quality of their learning.
SFG-‐2,5
Homework Student reports about their teachers’ homework expectations and practices, and about habits and patterns of homework implementation.
SFG-‐10,11
Francais Francophone student views about the value of learning French and factors helping/hindering their mastery of French.
SFG-‐10,11
About the Authors Stephen Anderson is a professor in the Educational Administration Program, Ontario Institute for Studies in Education University of Toronto and co-‐Director of the Comparative, International and Development Education Centre. His research and consulting focuses on education policy and program change, school improvement, in-‐service teacher development, and education leadership in Canada, the United States, Africa, Pakistan, and Latin America. [email protected]
Joelle Rodway Macri is a Doctoral Candidate in the Educational Administration Program, Ontario Institute for Studies in Education University of Toronto. Her research focuses on the role of social networks in knowledge mobilization and sense making processes that support school improvement and educational change initiatives. In addition to this study, she has worked on projects that focused on leadership and student learning, district administrator perceptions of student success, teacher understandings of international mindedness, and the

246
knowledge mobilization practices of Canadian faculties of education. [email protected]
Anna Yashkina is an Instructor and Researcher working with the Department of Leadership, Higher and Adult Education at the Ontario Institute for Studies in Education University of Toronto. Her research interests are distributed leadership, teacher learning and leadership, and school improvement. [email protected].
Daniela Bramwell is an MA student in the Educational Administration Program and the Comparative, International and Development Education Program at the Ontario Institute for Studies in Education University of Toronto. Her thesis focuses on citizenship education and how teachers approach Ministry-‐driven curriculum changes in Ecuador. She previously worked in Ecuador as an ESL teacher, a researcher at an NGO, an academic coordinator in a university education institute and a policy analyst in the Ministry of Education. [email protected]
Recommended

![[GradNation Webinar] Achieving a 90 percent Graduation Rate: Meeting the Needs of Adolescents Who Face Poverty and Adversity](https://img.pdfslide.net/doc/110x75/5a6554c67f8b9ae13f8b4bd3/gradnation-webinar-achieving-a-90-percent-graduation-rate-meeting-the-needs.jpg)