CHARACTERIZATION OF CHANGES IN COMPOSITION AND
PHYSIOCHEMICAL PROPERTIES OF CASEIN MICELLES FROM RAW MILK
TO BUTTERMILK
A Thesis
presented to
the Faculty of California Polytechnic State University,
San Luis Obispo
In Partial Fulfillment
of the Requirements for the Degree
Master of Science in Agriculture, with Specialization in Dairy Products Technology
by
Melissa A. Looney
March 2014

ii
©2014
Melissa A. Looney
ALL RIGHTS RESERVED
iii
COMMITTEE MEMBERSHIP
TITLE: Characterization Of Changes In Composition And
Physiochemical Properties Of Casein Micelles From
Raw Milk To Buttermilk
AUTHOR: Melissa A. Looney
DATE SUBMITTED: March 2014
COMMITTEE CHAIR: Rafael Jimenez-Flores, PhD
Professor of Dairy Science
COMMITTEE MEMBER: Yves Pouliot, PhD
Professor of Food Science, Laval University, Canada
COMMITTEE MEMBER: Amy Lammert, PhD
Professor of Food Science
iv
ABSTRACT
Characterization Of Changes In Composition And Physiochemical Properties Of
Casein Micelles From Raw Milk To Buttermilk
Melissa A. Looney
It is well-documented that buttermilk has poor coagulation properties due to
changes that occur to the casein micelles during the butter-making process. These
modifications are generally attributed to the pasteurization of the cream upon which
interactions between the proteins are promoted. It was hypothesized that churning is
also a critical step for the changes that occur in composition of the casein micelles.
The objective of this work was to learn more about the interactions that occur
between casein micelles and MFGM components during the butter making process.
Raw cream was processed using a rotary churn at 18°C for approximately 30
minutes, and buttermilk was collected for analysis. Raw milk was skimmed at 10°C
by centrifuging at 3000 x g for 20 minutes. Cream, skim milk and buttermilk were
centrifuged at 60,000 x g for 40 minutes twice using imidazole buffer at pH 6.8 in
order to isolate the micellar content in the pellet. Variation in physical properties of
the casein micelles was determined using a Malvern Zetasizer. Protein profiles of UP
cream, skim milk, and buttermilk were analyzed using one and two-dimensional gel
electrophoresis technique. Experiments were performed using three different batches
of UP cream, skim milk and buttermilk. Statistical analyses showed that processing
the buttermilk significantly increased the surface charge (P<0.05) of the micelle but
had no significant effect on their size (P>0.05). Our results also indicate that
v
churning of cream promoted interactions between casein micelles and MFGM
proteins as shown by the more complex 2D-gel electrophoresis pattern obtained for
casein micelles sedimented from buttermilk. This work is significant in its focus of
better understanding the functionality changes of valuable milk components during
the churning of cream.
Keywords: Casein micelle, buttermilk, butter, MFGM proteins, phospholipids,
minerals
vi
ACKNOWLEDGMENTS
I wish to thank my committee chair and advisor, Dr. Jimenez-Flores for his guidance
and support during the last 6 years at Cal Poly. Thank you for giving me the
opportunity to learn and grow at the DPTC.
I would like to thank Dr. Yves Pouliot for his graciousness during my one-year stay at
Laval University. He allowed me to stay with Maxime while continuing my
education and figuring out where I wanted to be in my career. During that one year in
Québec City, I grew a lot as an individual, and I want to thank him for that
opportunity.
I would also like to thank Dr. Amy Lammert for her support in the last 4 years that I
have known her. Her laughter and conversation made me smile when I needed it the
most!
I would like to thank those at University Laval as well as Cal Poly who helped me run
my experiments. A big thank you to Diane Gagnon for helping me prepare my
experiments in the lab at Laval and for being my personal translator whenever she
could. Also, thank you for your conversations about cats and California. It helped me
a lot when I was home-sick during the freezing cold winter! Thank you to Andrea
Laubscher for helping me grow during the last 5 years in and outside of the lab. Your
support means a lot to me, and I’m so glad to have worked with you!
vii
I would like to thank Dr. Leanne Berning for always having her door open to talk, for
advising me in my academics, and giving me advice from my undergrad days until
today.
Thank you to my family for supporting me throughout my last 7 years away from
home. I couldn’t have done it without you, thank you for believing in me and letting
me tell you about my problems when I needed to.
Finally, a big thank you to Maxime Saffon. You changed my life and have supported
me in every way possible throughout the last few years. I honestly couldn’t have
done this without your constant love and support. Thanks for always being my
biggest fan. Also, thank you to your amazing family for believing in us and letting
life take us wherever it may. I’m very proud of you for all that you have
accomplished, and I can’t wait to be with you during our next chapter.

viii
TABLE OF CONTENTS
LIST OF TABLES x
LIST OF FIGURES xi
1. INTRODUCTION 1
2. LITERATURE REVIEW 4 2.1 Bovine Milk 4
2.1.1 Composition 4 2.1.2 Milk salt balance between soluble and colloidal phases of milk 6
2.2. Casein Micelles 7
2.2.1 Composition and Characteristics 8 2.2.2 Proposed model for internal structure 12 2.2.3 Isolation Methods of the Casein Micelle 14
2.2.3.1. Centrifugation 14 2.2.3.2. Ultrafiltration and microfiltration 15
2.3 The Milk Fat Globule 15
2.3.1 Overall composition 16 2.3.2 The milk fat globule membrane: composition and structure 17 2.3.3 Method for isolating the milk fat globule membrane 22
2.4 Separation and processing of milk fat 23
2.4.1 Centrifugal separation (principle, equipment, and products generated) 24 2.4.2 Phase inversion and butter-making 26 2.4.3 Buttermilk composition, properties and utilization 28
2.5 Interactions between casein micelles and other milk components 31
2.5.1 Whey proteins 31 2.5.2 Other minor components 33 2.5.3 Fatty acids and other lipids 35
3. MATERIALS AND METHODS 36 3.1 Materials 36
3.2 Preparation of raw cream, raw skim milk and raw buttermilk 36
3.3 Isolation of casein micelles 37
3.4 Analytical methods 38
3.4.1 Composition 38 3.4.2 Polyacrylamide gel electrophoresis 39
3.4.2.1 One-dimensional PAGE 39 3.4.2.2 Two-dimensional PAGE 39
3.4.3 Particle size distribution and zeta potential of the casein micelles 41 3.4.4 Phosphorus content of micellar pellet 42
3.4.4.1 Total Phosphorus 43 3.4.4.2 Total Phosphorus acid-soluble (esterified P, soluble+colloidal P) 44 3.4.4.3 Acid-soluble Inorganic Phosphorus (soluble+colloidal) 44
3.4.5 Freeze-drying of micellar pellet 45 3.4.6 Cation content of micellar pellet 45
ix
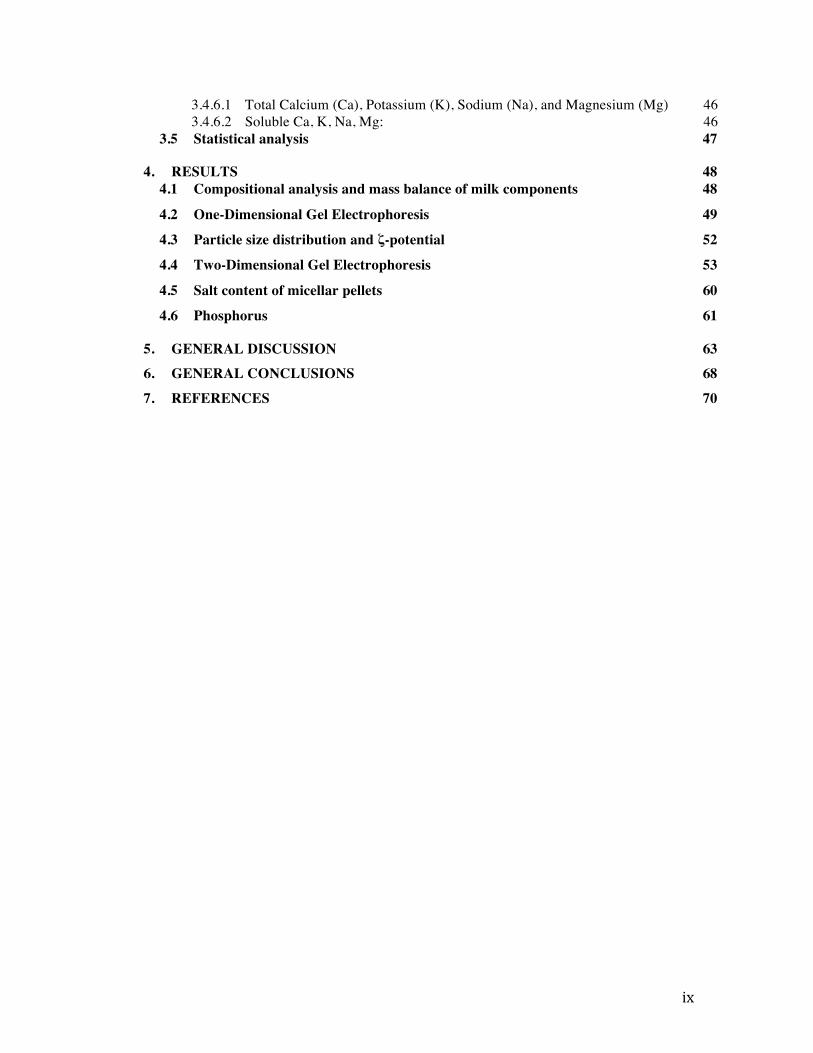
3.4.6.1 Total Calcium (Ca), Potassium (K), Sodium (Na), and Magnesium (Mg) 46 3.4.6.2 Soluble Ca, K, Na, Mg: 46
3.5 Statistical analysis 47
4. RESULTS 48 4.1 Compositional analysis and mass balance of milk components 48
4.2 One-Dimensional Gel Electrophoresis 49
4.3 Particle size distribution and ζ-potential 52
4.4 Two-Dimensional Gel Electrophoresis 53
4.5 Salt content of micellar pellets 60
4.6 Phosphorus 61
5. GENERAL DISCUSSION 63
6. GENERAL CONCLUSIONS 68
7. REFERENCES 70
x
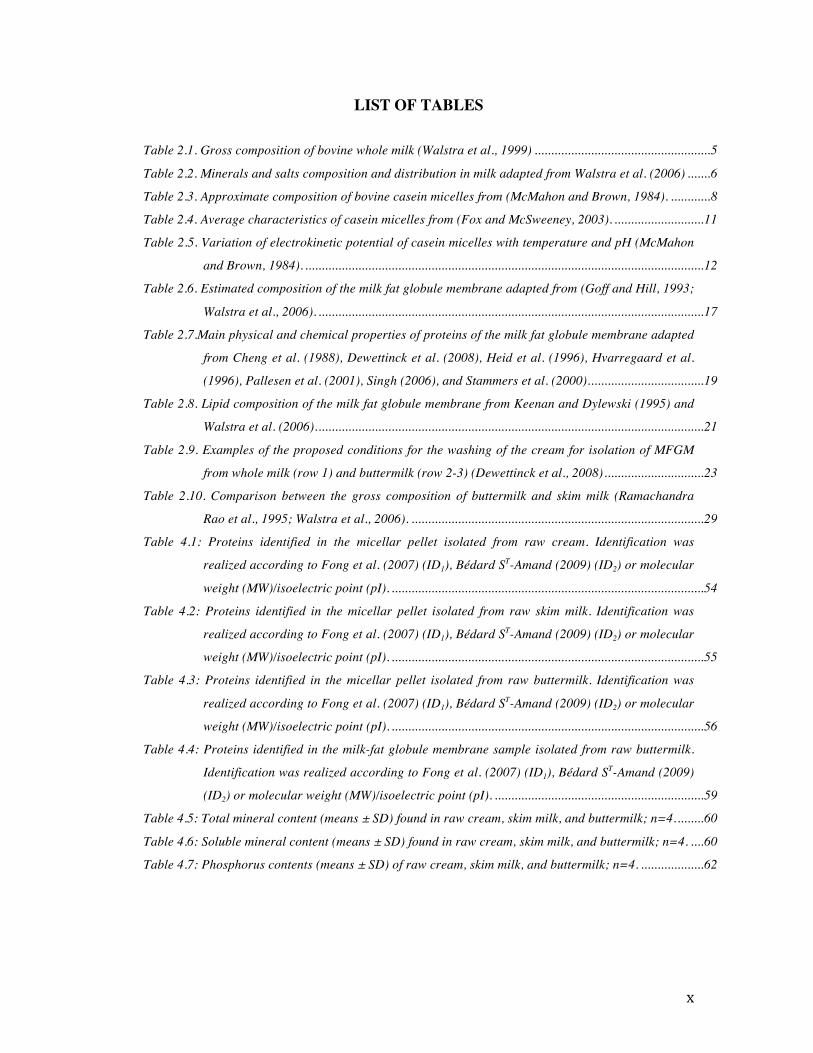
LIST OF TABLES Table 2.1. Gross composition of bovine whole milk (Walstra et al., 1999) ..................................................... 5 Table 2.2. Minerals and salts composition and distribution in milk adapted from Walstra et al. (2006) ....... 6 Table 2.3. Approximate composition of bovine casein micelles from (McMahon and Brown, 1984). ............ 8 Table 2.4. Average characteristics of casein micelles from (Fox and McSweeney, 2003). ........................... 11 Table 2.5. Variation of electrokinetic potential of casein micelles with temperature and pH (McMahon
and Brown, 1984). ........................................................................................................................ 12 Table 2.6. Estimated composition of the milk fat globule membrane adapted from (Goff and Hill, 1993;
Walstra et al., 2006). .................................................................................................................... 17 Table 2.7.Main physical and chemical properties of proteins of the milk fat globule membrane adapted
from Cheng et al. (1988), Dewettinck et al. (2008), Heid et al. (1996), Hvarregaard et al.
(1996), Pallesen et al. (2001), Singh (2006), and Stammers et al. (2000). .................................. 19 Table 2.8. Lipid composition of the milk fat globule membrane from Keenan and Dylewski (1995) and
Walstra et al. (2006). .................................................................................................................... 21 Table 2.9. Examples of the proposed conditions for the washing of the cream for isolation of MFGM
from whole milk (row 1) and buttermilk (row 2-3) (Dewettinck et al., 2008) .............................. 23 Table 2.10. Comparison between the gross composition of buttermilk and skim milk (Ramachandra
Rao et al., 1995; Walstra et al., 2006). ........................................................................................ 29 Table 4.1: Proteins identified in the micellar pellet isolated from raw cream. Identification was
realized according to Fong et al. (2007) (ID1), Bédard ST-Amand (2009) (ID2) or molecular
weight (MW)/isoelectric point (pI). .............................................................................................. 54 Table 4.2: Proteins identified in the micellar pellet isolated from raw skim milk. Identification was
realized according to Fong et al. (2007) (ID1), Bédard ST-Amand (2009) (ID2) or molecular
weight (MW)/isoelectric point (pI). .............................................................................................. 55 Table 4.3: Proteins identified in the micellar pellet isolated from raw buttermilk. Identification was
realized according to Fong et al. (2007) (ID1), Bédard ST-Amand (2009) (ID2) or molecular
weight (MW)/isoelectric point (pI). .............................................................................................. 56 Table 4.4: Proteins identified in the milk-fat globule membrane sample isolated from raw buttermilk.
Identification was realized according to Fong et al. (2007) (ID1), Bédard ST-Amand (2009)
(ID2) or molecular weight (MW)/isoelectric point (pI). ............................................................... 59 Table 4.5: Total mineral content (means ± SD) found in raw cream, skim milk, and buttermilk; n=4. ........ 60 Table 4.6: Soluble mineral content (means ± SD) found in raw cream, skim milk, and buttermilk; n=4. .... 60 Table 4.7: Phosphorus contents (means ± SD) of raw cream, skim milk, and buttermilk; n=4. ................... 62
xi
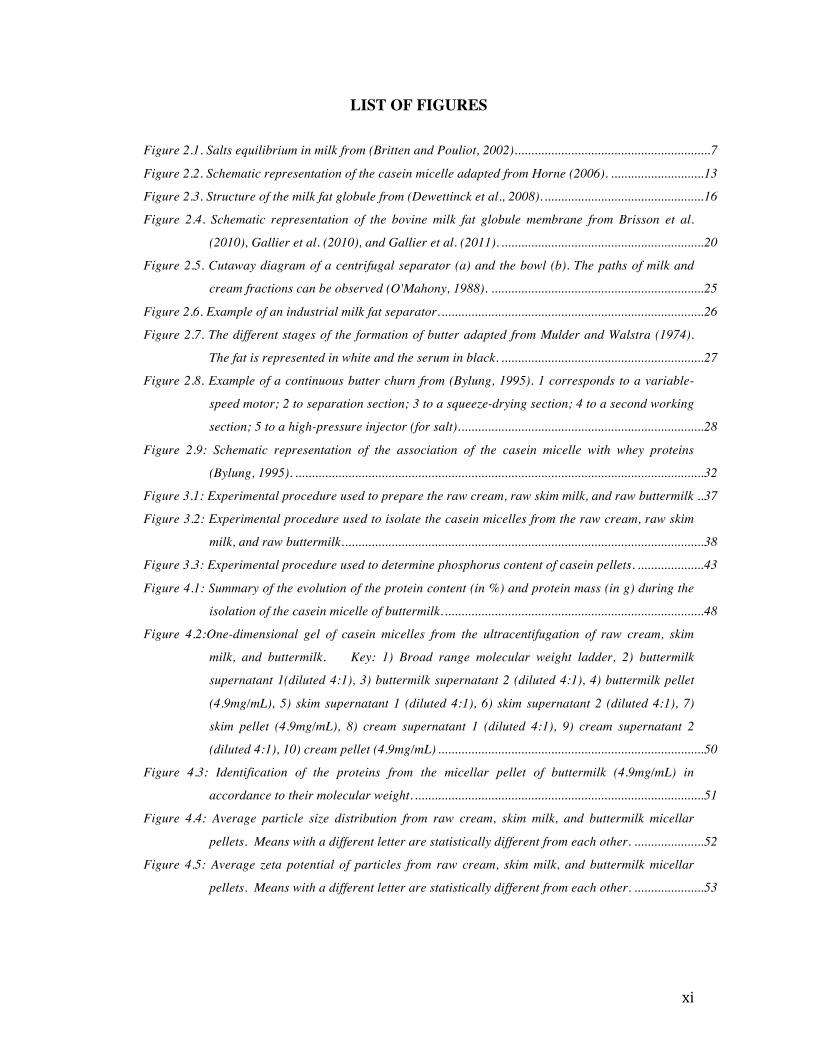
LIST OF FIGURES
Figure 2.1. Salts equilibrium in milk from (Britten and Pouliot, 2002). .......................................................... 7 Figure 2.2. Schematic representation of the casein micelle adapted from Horne (2006). ............................ 13 Figure 2.3. Structure of the milk fat globule from (Dewettinck et al., 2008). ................................................ 16 Figure 2.4. Schematic representation of the bovine milk fat globule membrane from Brisson et al.
(2010), Gallier et al. (2010), and Gallier et al. (2011). ............................................................. 20 Figure 2.5. Cutaway diagram of a centrifugal separator (a) and the bowl (b). The paths of milk and
cream fractions can be observed (O'Mahony, 1988). ................................................................ 25 Figure 2.6. Example of an industrial milk fat separator. ............................................................................... 26 Figure 2.7. The different stages of the formation of butter adapted from Mulder and Walstra (1974).
The fat is represented in white and the serum in black. ............................................................. 27 Figure 2.8. Example of a continuous butter churn from (Bylung, 1995). 1 corresponds to a variable-
speed motor; 2 to separation section; 3 to a squeeze-drying section; 4 to a second working
section; 5 to a high-pressure injector (for salt). ......................................................................... 28 Figure 2.9: Schematic representation of the association of the casein micelle with whey proteins
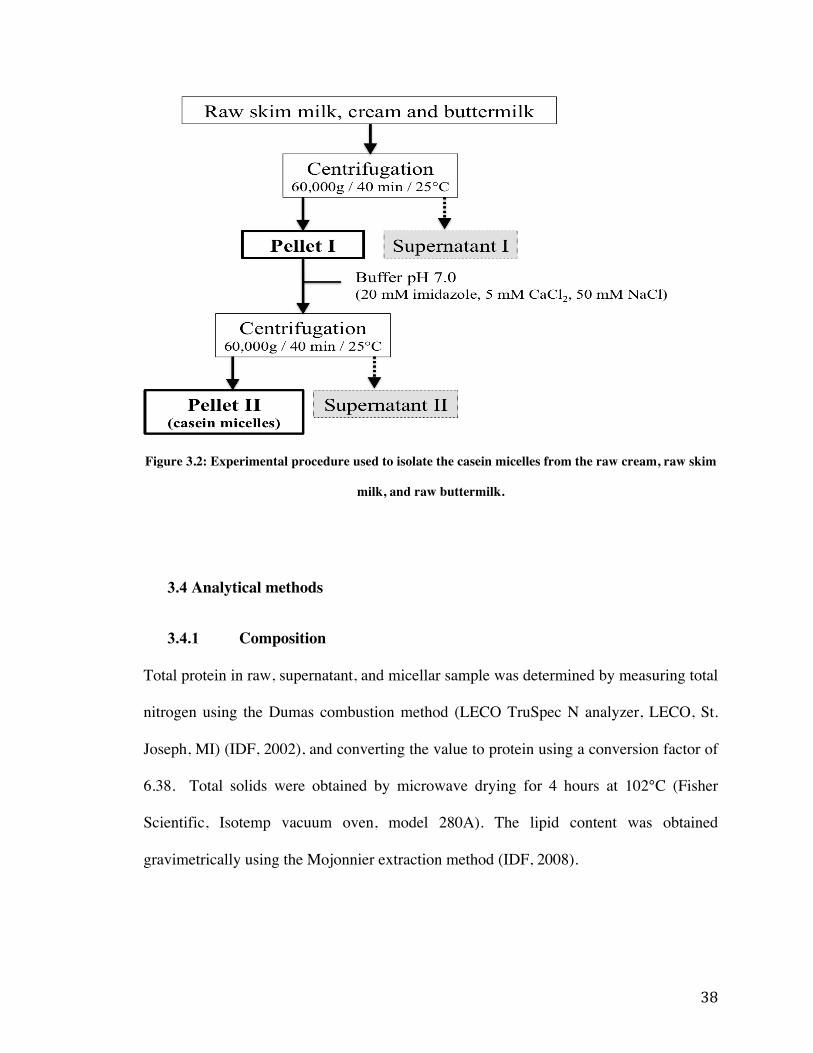
(Bylung, 1995). ........................................................................................................................... 32 Figure 3.1: Experimental procedure used to prepare the raw cream, raw skim milk, and raw buttermilk .. 37 Figure 3.2: Experimental procedure used to isolate the casein micelles from the raw cream, raw skim
milk, and raw buttermilk. ............................................................................................................ 38 Figure 3.3: Experimental procedure used to determine phosphorus content of casein pellets. .................... 43 Figure 4.1: Summary of the evolution of the protein content (in %) and protein mass (in g) during the
isolation of the casein micelle of buttermilk. .............................................................................. 48 Figure 4.2:One-dimensional gel of casein micelles from the ultracentifugation of raw cream, skim
milk, and buttermilk. Key: 1) Broad range molecular weight ladder, 2) buttermilk
supernatant 1(diluted 4:1), 3) buttermilk supernatant 2 (diluted 4:1), 4) buttermilk pellet
(4.9mg/mL), 5) skim supernatant 1 (diluted 4:1), 6) skim supernatant 2 (diluted 4:1), 7)
skim pellet (4.9mg/mL), 8) cream supernatant 1 (diluted 4:1), 9) cream supernatant 2
(diluted 4:1), 10) cream pellet (4.9mg/mL) ................................................................................ 50 Figure 4.3: Identification of the proteins from the micellar pellet of buttermilk (4.9mg/mL) in
accordance to their molecular weight. ....................................................................................... 51 Figure 4.4: Average particle size distribution from raw cream, skim milk, and buttermilk micellar
pellets. Means with a different letter are statistically different from each other. ..................... 52 Figure 4.5: Average zeta potential of particles from raw cream, skim milk, and buttermilk micellar
pellets. Means with a different letter are statistically different from each other. ..................... 53
xii
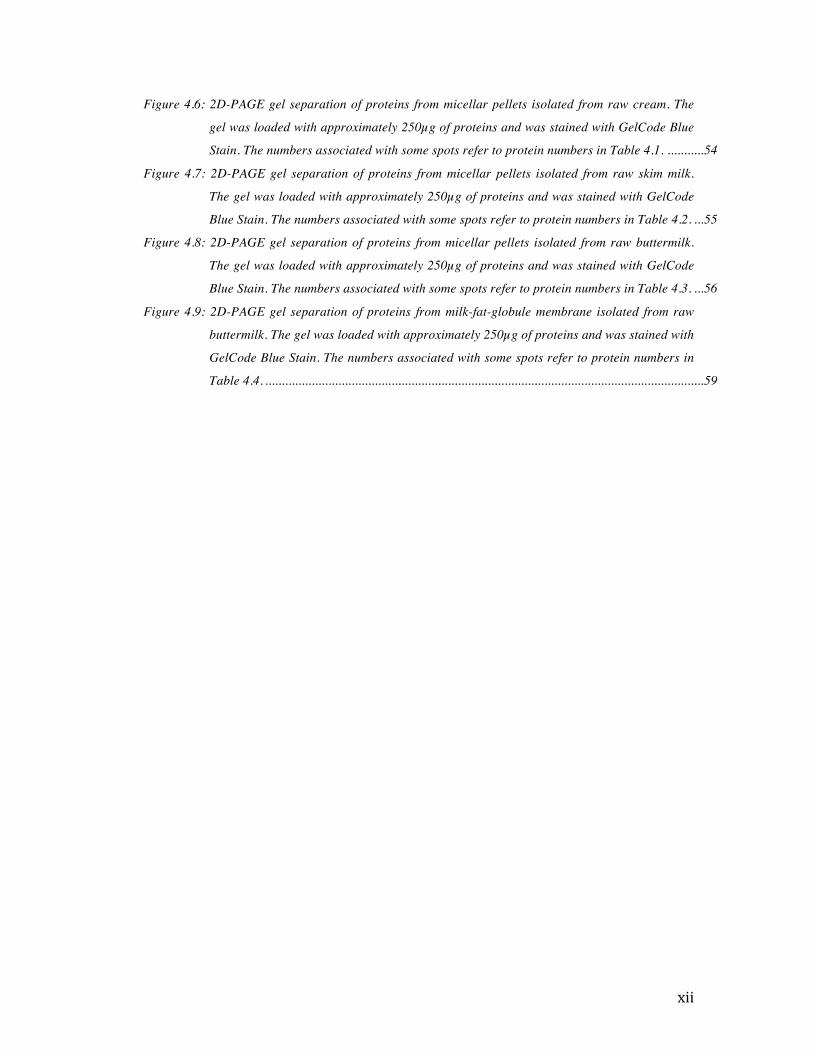
Figure 4.6: 2D-PAGE gel separation of proteins from micellar pellets isolated from raw cream. The
gel was loaded with approximately 250µg of proteins and was stained with GelCode Blue
Stain. The numbers associated with some spots refer to protein numbers in Table 4.1. ........... 54 Figure 4.7: 2D-PAGE gel separation of proteins from micellar pellets isolated from raw skim milk.
The gel was loaded with approximately 250µg of proteins and was stained with GelCode
Blue Stain. The numbers associated with some spots refer to protein numbers in Table 4.2. ... 55 Figure 4.8: 2D-PAGE gel separation of proteins from micellar pellets isolated from raw buttermilk.
The gel was loaded with approximately 250µg of proteins and was stained with GelCode
Blue Stain. The numbers associated with some spots refer to protein numbers in Table 4.3. ... 56 Figure 4.9: 2D-PAGE gel separation of proteins from milk-fat-globule membrane isolated from raw
buttermilk. The gel was loaded with approximately 250µg of proteins and was stained with
GelCode Blue Stain. The numbers associated with some spots refer to protein numbers in
Table 4.4. .................................................................................................................................... 59

1
1. INTRODUCTION In 2012, the butter production in the United States totaled 0.84 billion kilograms, which
is 2.8 percent above the production of 2011. California accounted for 35.2 percent of the
production. Due to the increase of butter production, the production of buttermilk is also
increasing. For example, the annual production of buttermilk powder in the US in 2011
was estimated to be 45 million kilograms (USDA, 2013).
Buttermilk is the aqueous phase obtained after the process of churning cream. It has a
composition similar to that of skim milk, and is predominantly made up of the water-
soluble compounds of cream such as protein, lactose and minerals (Ramachandra Rao et
al., 1995; Walstra et al., 2006). However, buttermilk is a unique product in that there are
residual fragments of the milk fat globule membrane (MFGM) as well as associated
material (proteins, phospholipids, and sphingolipids) that have been linked to positive
health benefits and nutritional aspects. Unfortunately, buttermilk has not found many
industrial applications yet due to the following limitations:
1) Buttermilk is a complex byproduct for the dairy industry because it contains low
total solids and is very sensitive to degradation and oxidation; it has to be
processed into a powder quickly in order to extend its shelf life. This often makes
it unusable for food applications, and therefore buttermilk powder is rather used
in animal nutrition (Morin, 2006).
2) Processing of cream, especially pasteurization, modifies the properties of the
soluble components found in buttermilk, such as loss of the coagulation properties
of the protein, as well as loss of the components associated with the MFGM
2
(Morin, 2006).
3) The high water holding capacity of the phospholipids found in buttermilk limits
it’s use in cheese making (Turcot et al., 2002; Turcot et al., 2001). For example,
(Mistry et al., 1996) found that it is possible to substitute milk with liquid
buttermilk without causing any textural defects if the amount of buttermilk does
not exceed 5% of the total volume. Also, it has been shown that high levels of
phospholipids in buttermilk creates a limitation in its use in cheese making
because of poor curd fusion and high humidity of cheeses (Turcot et al., 2001).
4) Isolation of its components has been shown to be difficult due to the similarity
between the size of the casein micelles and the MFGM fragments (Morin, 2006).
However, various components of buttermilk, such as caseins, could be used in many
foods applications. Caseins represent roughly 75% of the total proteins found in
buttermilk (Sodini et al., 2006). For example, caseins are responsible for the rennet-
induced coagulation of cheese or acid-type gels (yogurts). Unfortunately, the butter
churning process, and particularly the pasteurization of cream, has been shown to
affect the technological properties of these casein micelles. Moreover, from the
recent work of Zheng et al. (2013) , it has been hypothesized that the mechanical
treatments involved in the skimming of milk may affect the integrity of the external
layer of milk fat globule, and therefore release surface-active compounds in skim
milk. These contaminant molecules could in turn interact with casein micelles and
explain the poor technological properties. To our knowledge, there are no studies that
report on the effect of the physical treatment (skimming or churning) on
3
physicochemical properties of the casein micelle.
The goal of the current project was to characterize some changes that occur to the casein
micelles during the physical treatment (skimming and churning) involved during the
butter making process. In particular, the effect of skimming and churning on the
composition (protein, mineral) of the casein micelle from raw buttermilk (unpasteurized)
were investigated.
Previous studies have clearly demonstrated that pasteurization of cream affects the
functional properties of the casein micelles (Morin, 2006). The general hypothesis of this
work was that a better understanding of the effect of skimming and churning on the
properties of the casein micelle could offer new opportunities for the utilization of
buttermilk.
The objectives for this work were:
1) To develop a standardized approach for the isolation of casein micelles from raw
milk, cream and buttermilk.
2) To characterize the effect of skimming and churning on the composition (protein,
salts) of casein micelles from raw milk.
3) Relate the compositional changes (protein & salts) to changes in micellar size
and charge (zeta potential).
4
2. LITERATURE REVIEW
2.1 Bovine Milk
Milk is a white liquid secreted by all female mammals in order to fulfill the nutrition need
and immunological protection of their young. Bovine milk is by far the most produced
milk around the world (~ 83% of total milk) with a worldwide production of 606 million
tons in 2011. The United States of America is the largest bovine milk producer with
around 89 million tons produced in 2011 (FAO, 2013).
2.1.1 Composition
Bovine whole milk is mostly composed of water (87 g/100g). The solids are divided into
carbohydrates (4.6 g/100g), fat (4.0 g/100g), proteins (3.3 g/100g), salts (0.72g/100g),
and miscellaneous components as summarized in Table 2.1 (Walstra et al., 1999).
However, there are some variations in the composition of bovine whole milk depending
on the breed of the cow, stage of lactation, the season, and feed.
5
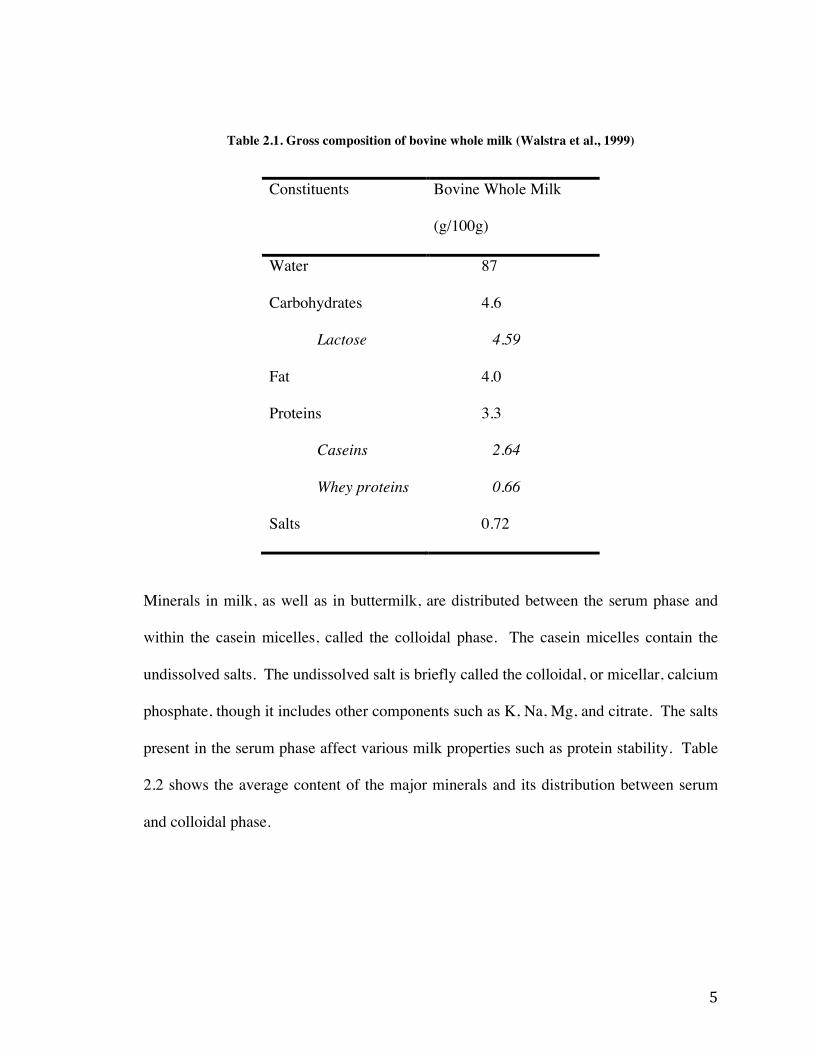
Table 2.1. Gross composition of bovine whole milk (Walstra et al., 1999)
Constituents Bovine Whole Milk
(g/100g)
Water 87
Carbohydrates 4.6
Lactose 4.59
Fat 4.0
Proteins 3.3
Caseins 2.64
Whey proteins 0.66
Salts 0.72
Minerals in milk, as well as in buttermilk, are distributed between the serum phase and
within the casein micelles, called the colloidal phase. The casein micelles contain the
undissolved salts. The undissolved salt is briefly called the colloidal, or micellar, calcium
phosphate, though it includes other components such as K, Na, Mg, and citrate. The salts
present in the serum phase affect various milk properties such as protein stability. Table
2.2 shows the average content of the major minerals and its distribution between serum
and colloidal phase.

6
Table 2.2. Minerals and salts composition and distribution in milk adapted from Walstra et al. (2006)
Components mg/100 g of Milk % Soluble phase % Colloidal phase
Na 48 95 5
K 143 94 6
Ca 117 32 68
Mg 11 66 34
Cl 110 100 0
CO3 10 ~ 100 0
SO4 10 100 0
PO4 203 53 47
Citrate 175 92 8
2.1.2 Milk salt balance between soluble and colloidal phases of milk
Salt equilibrium in milk and buttermilk are comparable. Changing external conditions of
milk may cause alterations in equilibria. For example, calcium phosphate is sensitive to
several processing parameters. Modification of the pH and temperature treatments can
affect the equilibrium of calcium phosphate. Figure 2.1 shows the equilibrium of milk
salts.
7
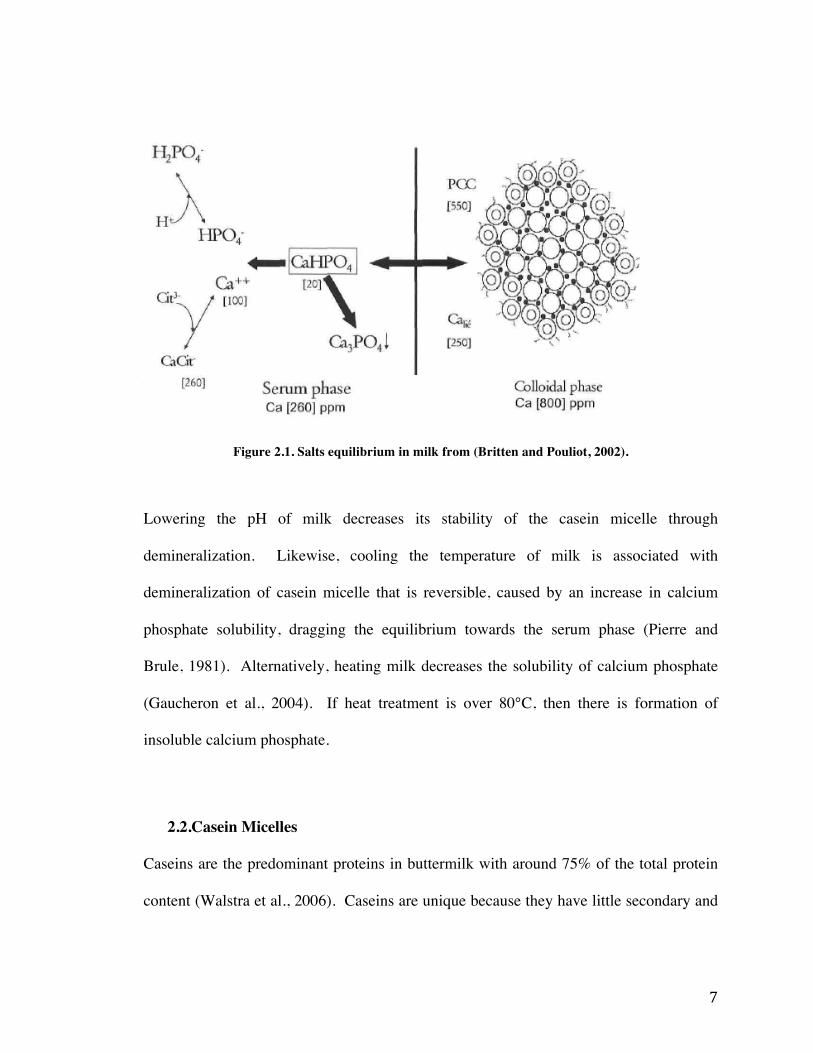
Figure 2.1. Salts equilibrium in milk from (Britten and Pouliot, 2002).
Lowering the pH of milk decreases its stability of the casein micelle through
demineralization. Likewise, cooling the temperature of milk is associated with
demineralization of casein micelle that is reversible, caused by an increase in calcium
phosphate solubility, dragging the equilibrium towards the serum phase (Pierre and
Brule, 1981). Alternatively, heating milk decreases the solubility of calcium phosphate
(Gaucheron et al., 2004). If heat treatment is over 80°C, then there is formation of
insoluble calcium phosphate.
2.2.Casein Micelles
Caseins are the predominant proteins in buttermilk with around 75% of the total protein
content (Walstra et al., 2006). Caseins are unique because they have little secondary and
8
tertiary structures. The characteristics of the casein are important in determining the
rheological properties of fermented dairy products.
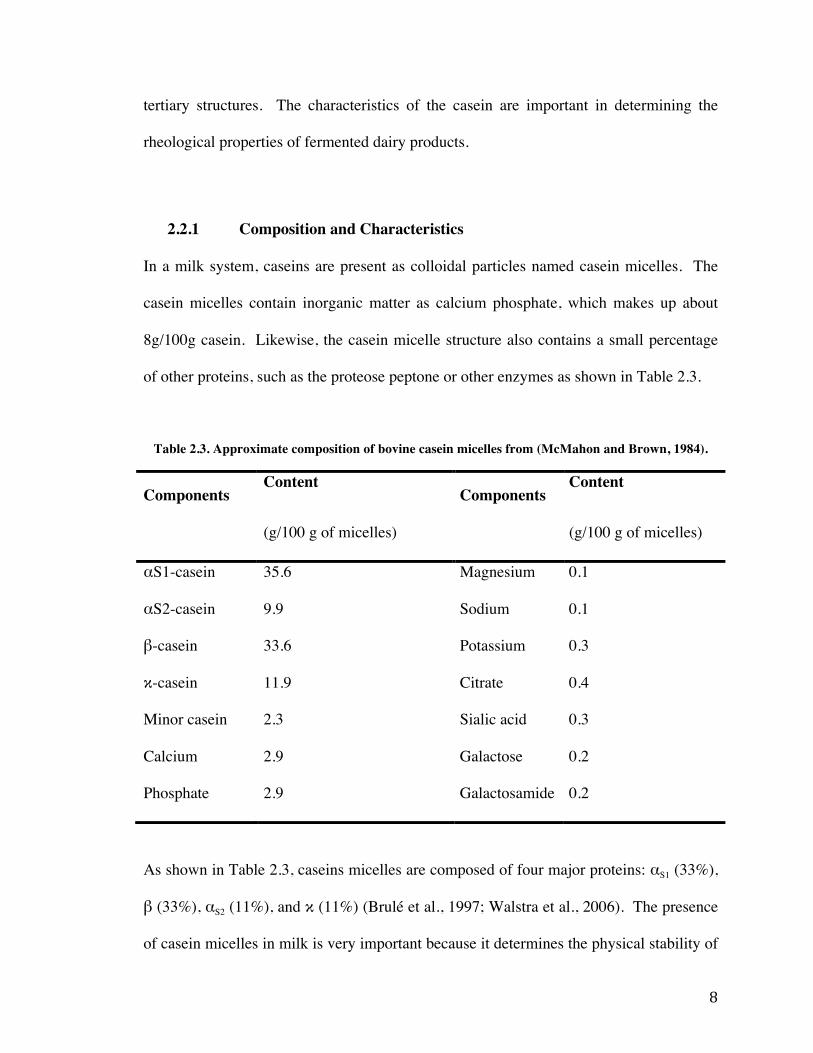
2.2.1 Composition and Characteristics
In a milk system, caseins are present as colloidal particles named casein micelles. The
casein micelles contain inorganic matter as calcium phosphate, which makes up about
8g/100g casein. Likewise, the casein micelle structure also contains a small percentage
of other proteins, such as the proteose peptone or other enzymes as shown in Table 2.3.
Table 2.3. Approximate composition of bovine casein micelles from (McMahon and Brown, 1984).
Components Content
(g/100 g of micelles)
Components Content
(g/100 g of micelles)
αS1-casein 35.6 Magnesium 0.1
αS2-casein 9.9 Sodium 0.1
β-casein 33.6 Potassium 0.3
κ-casein 11.9 Citrate 0.4
Minor casein 2.3 Sialic acid 0.3
Calcium 2.9 Galactose 0.2
Phosphate 2.9 Galactosamide 0.2
As shown in Table 2.3, caseins micelles are composed of four major proteins: αS1 (33%),
β (33%), αS2 (11%), and κ (11%) (Brulé et al., 1997; Walstra et al., 2006). The presence
of casein micelles in milk is very important because it determines the physical stability of
9
milk products during process and storage and the viscosity of products concentrated in
proteins (Walstra et al., 2006). Each protein has unique characteristics, and contributes to
the overall integrity of the micelle.
The protein αS1-casein is the predominant form of casein found, with a molar mass of
23,614 Da and 199 amino acid residues per molecule (Walstra et al., 2006). It has the
highest charge and the highest phosphate content and contains no cysteine molecules.
The protein αs2-casein is the most hydrophilic and most calcium sensitive of all the
caseins; they precipitate at a Ca2+ concentration of less than 2 mM (Walstra et al., 2006).
It contains two cysteine residues and no carbohydrate groups. Under non-reducing
conditions, αs2-caseins exist as a disulphide-linked dimer.
The most hydrophobic fraction of the caseins are β-caseins, which are less sensitive to
calcium salt, precipitating at a range of 8–15 mM Ca2+ at 37 °C (Swaisgood, 2003). It
has a large number of proline residues. The charge of β-casein is unevenly distributed,
making it comparable to a soap-like structure with a hydrophilic charged “head” toward
the center of the micelle and hydrophobic end. Below 5°C no association of β-casein
occurs and the molecule remains unfolded.
The protein fraction κ-casein differs greatly from the other caseins due to the presence of
two cysteine residues that form an intermolecular disulfide bond (Cys11-Cys88). κ-caseins
play an extremely important physiological role in maintaining the integrity of the micelle
10
structure by stabilizing the caseins in the presence of calcium ions in milk. Under a
hypothesized model proposed by Holt and Horne (1996), κ-casein forms a “hairy layer”
on the surface of micelles and is responsible for stabilizing the micelles sterically and
electrostatically from aggregation.
Casein micelles are generally spherical in shape with an average diameter of ~150 nm,
ranging from 50 to 500 nm, and an average mass of ~108 Da (Table 2.4). However, each
micelle is different, and some variation can be observed. In particular, the proportion of
κ-casein varies, which plays a large part in the overall variation in size of the casein
micelle.
11
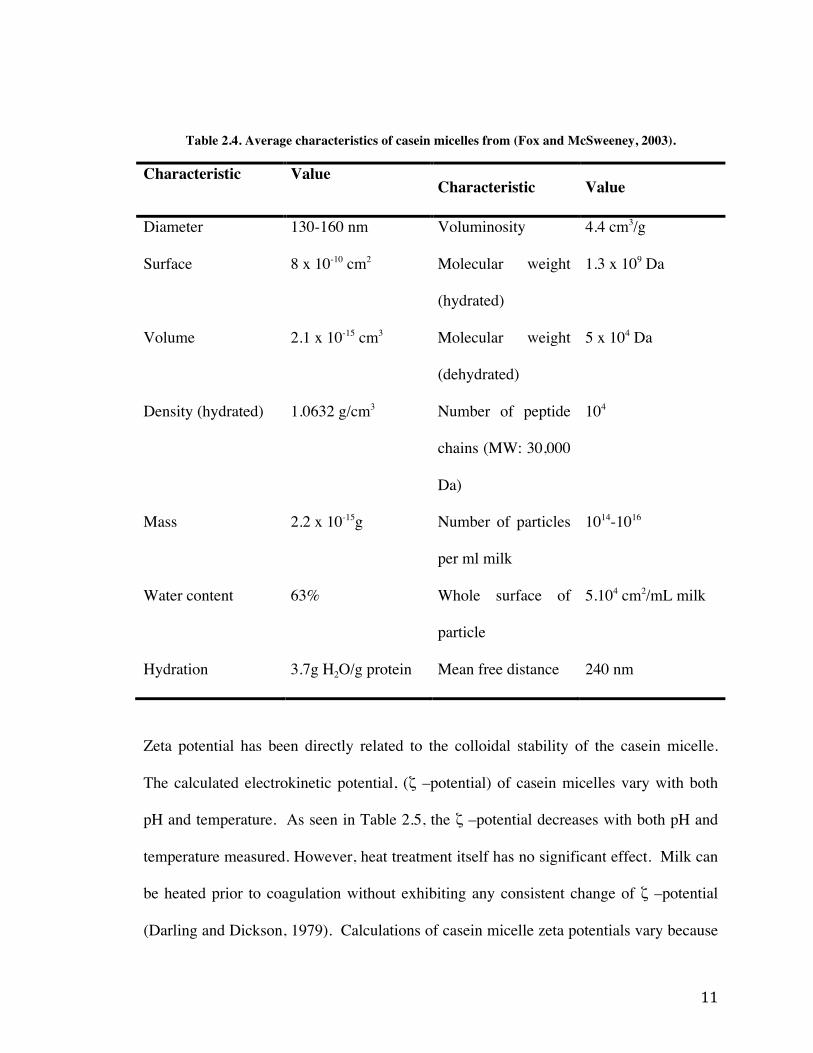
Table 2.4. Average characteristics of casein micelles from (Fox and McSweeney, 2003).
Characteristic Value Characteristic Value
Diameter 130-160 nm Voluminosity 4.4 cm3/g
Surface 8 x 10⁻¹⁰ cm2 Molecular weight
(hydrated)
1.3 x 10⁹ Da
Volume 2.1 x 10⁻¹⁵ cm3 Molecular weight
(dehydrated)
5 x 10⁴ Da
Density (hydrated) 1.0632 g/cm3 Number of peptide
chains (MW: 30,000
Da)
104
Mass 2.2 x 10⁻¹⁵g Number of particles
per ml milk
1014-1016
Water content 63% Whole surface of
particle
5.104 cm2/mL milk
Hydration 3.7g H2O/g protein Mean free distance 240 nm
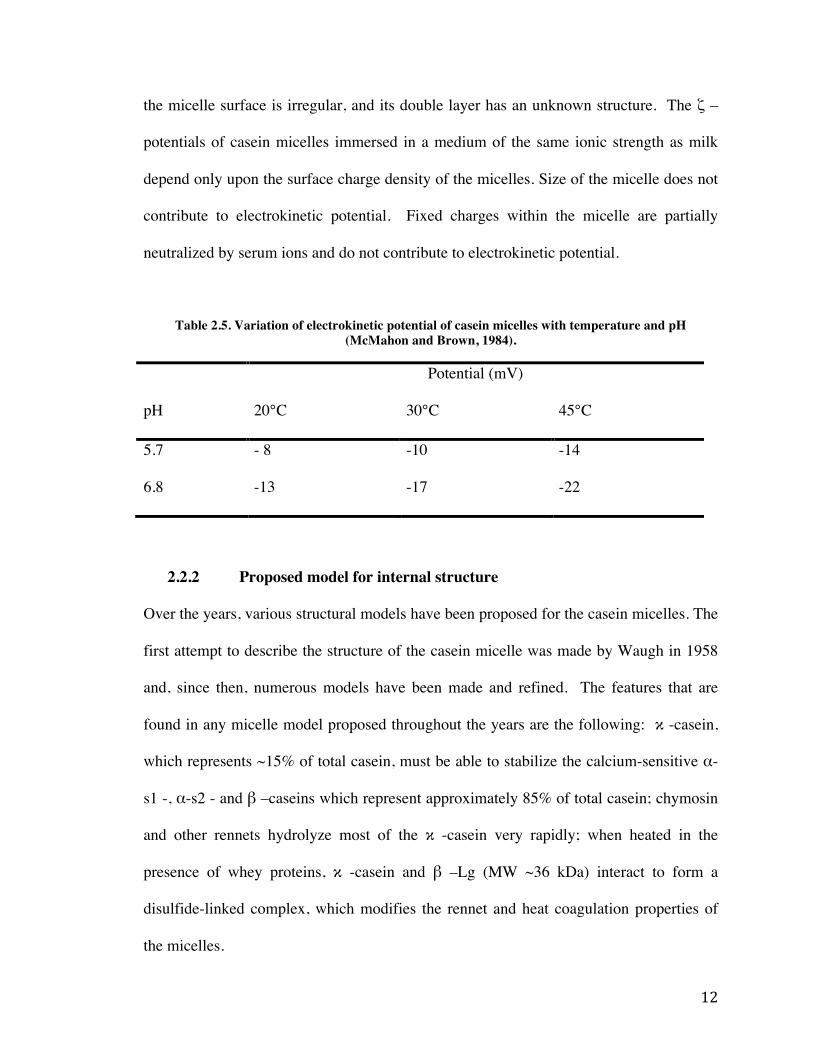
Zeta potential has been directly related to the colloidal stability of the casein micelle.
The calculated electrokinetic potential, (ζ –potential) of casein micelles vary with both
pH and temperature. As seen in Table 2.5, the ζ –potential decreases with both pH and
temperature measured. However, heat treatment itself has no significant effect. Milk can
be heated prior to coagulation without exhibiting any consistent change of ζ –potential
(Darling and Dickson, 1979). Calculations of casein micelle zeta potentials vary because
12
the micelle surface is irregular, and its double layer has an unknown structure. The ζ –
potentials of casein micelles immersed in a medium of the same ionic strength as milk
depend only upon the surface charge density of the micelles. Size of the micelle does not
contribute to electrokinetic potential. Fixed charges within the micelle are partially
neutralized by serum ions and do not contribute to electrokinetic potential.
Table 2.5. Variation of electrokinetic potential of casein micelles with temperature and pH (McMahon and Brown, 1984).
Potential (mV)
pH 20°C 30°C 45°C
5.7 - 8 -10 -14
6.8 -13 -17 -22
2.2.2 Proposed model for internal structure
Over the years, various structural models have been proposed for the casein micelles. The
first attempt to describe the structure of the casein micelle was made by Waugh in 1958
and, since then, numerous models have been made and refined. The features that are
found in any micelle model proposed throughout the years are the following: κ -casein,
which represents ~15% of total casein, must be able to stabilize the calcium-sensitive α-
s1 -, α-s2 - and β –caseins which represent approximately 85% of total casein; chymosin
and other rennets hydrolyze most of the κ -casein very rapidly; when heated in the
presence of whey proteins, κ -casein and β –Lg (MW ~36 kDa) interact to form a
disulfide-linked complex, which modifies the rennet and heat coagulation properties of
the micelles.

13
Modification of the micelle reveals some of its unique characteristics. For example,
removal of colloidal calcium phosphate (CCP) causes disintegration of the micelles into
particles of MW ~ 106 Da, which suggests that the casein molecules are held together in
the micelles by CCP. Alternatively, at low temperatures, casein, particularly β -casein,
dissociates from the micelles.
The most continuingly referred to model has been introduced by Schmidt (1980), and
consists of submicelles connected together via hydrophobic bonds and calcium phosphate
(Figure 2.2). In this submicelle model, the caseins first aggregate via hydrophobic
interactions into subunits of 20 to 25 molecules and have an average diameter that ranges
from 12 to 15 nanometers. Each submicelle contains different casein molecules, but it is
important to remember that not all submicelles have the same composition.
Figure 2.2. Schematic representation of the casein micelle adapted from Horne (2006).

14
2.2.3 Isolation Methods of the Casein Micelle
There are many methods that can be used for the isolation of the casein micelle from
bovine milk (Fox and McSweeney, 2003).
The protein fractions may be prepared from whole or skimmed milk, but the latter is
usually used because the fat is covered in isoelectric casein and interferes with further
characterization of the proteins. The fat is easily removed from milk by centrifugation
(3000 x g for 30 min). Following the removal of fat from whole milk, there are a few
methods used for separating protein fractions. Isoelectric precipitation at pH 4.6 at 20°C
is the most widely used method for separating the casein and non-casein fractions of milk
protein but several other techniques are used in certain situations (Fox and McSweeney,
2003). Highlighted below are a few methods used to separate the casein and non-casein
fractions of milk protein.
2.2.3.1. Centrifugation
In milk, the casein exists as large micelles that may be sedimented by centrifugation at
100,000 x g for 1 hour; the whey proteins are soluble and do not sediment. The pellet
obtained contains its original level of colloidal calcium phosphate, and can be dispersed
in a suitable buffer as micelles with properties essentially similar to the original micelles.
This method is ideal for maintaining the native form of the micelle and is often used in
the laboratory setting (Thompson et al., 2009).
15
2.2.3.2. Ultrafiltration and microfiltration
All the milk proteins can be retained by small pore, semi-permeable membranes and are
separated from lactose and soluble salts. Ultrafiltration is used for the industrial-scale
production of whey protein concentrates (WPCs) and to a lesser extent for the production
of total milk protein. Intermediate-pore membranes are used to separate casein micelles
from whey proteins. In microfiltration, using large-pore membranes (0.4 μ m), both the
caseins and the whey proteins are permeable, but 99.9% of bacteria and other large
particles are retained (Thompson et al., 2009).
2.3 The Milk Fat Globule
The fat globules (3 to 5% of total fat in bovine whole milk) consist of a triglyceride core
surrounded by a thin membrane called the milk fat globule membrane (MFGM). The
membrane of the fat globule (approximately 10 to 20nm in diameter) acts as an emulsifier
and protects the globules from coalescence and enzymatic degradation (Dewettinck et al.,
2008). The distribution of the globules corresponds to tiny and spherical droplets or
globules stabilized in the form of an emulsion (Singh, 2006). The diameter of a milk fat
globule varies from 0.1 µm to 20 µm with an average around 3 to 5 µm (Danthine et al.,
2000). It should be noted that the distribution and size of globules depends on the breed
of cow, stage of lactation, and feed. For example, the average size of milk fat globule
from Jersey cows’ milk is approximately 4.5 µm while it is 3.5 µm for Friesian cows’
milk (Singh, 2006). The microstructure and the size of the fat globule are essential for
the texture of dairy products such as cheese. The smaller globules are more resistant to
disruption during processing, have a higher ratio of MFGM to triacylglycerides, and will
16
yield higher retention of the membrane in cheese curds. However, the moisture of the
curd will increase due to the high water-holding capacity of the MFGM (Goudedranche
et al., 2000; Lopez, 2007).
2.3.1 Overall composition
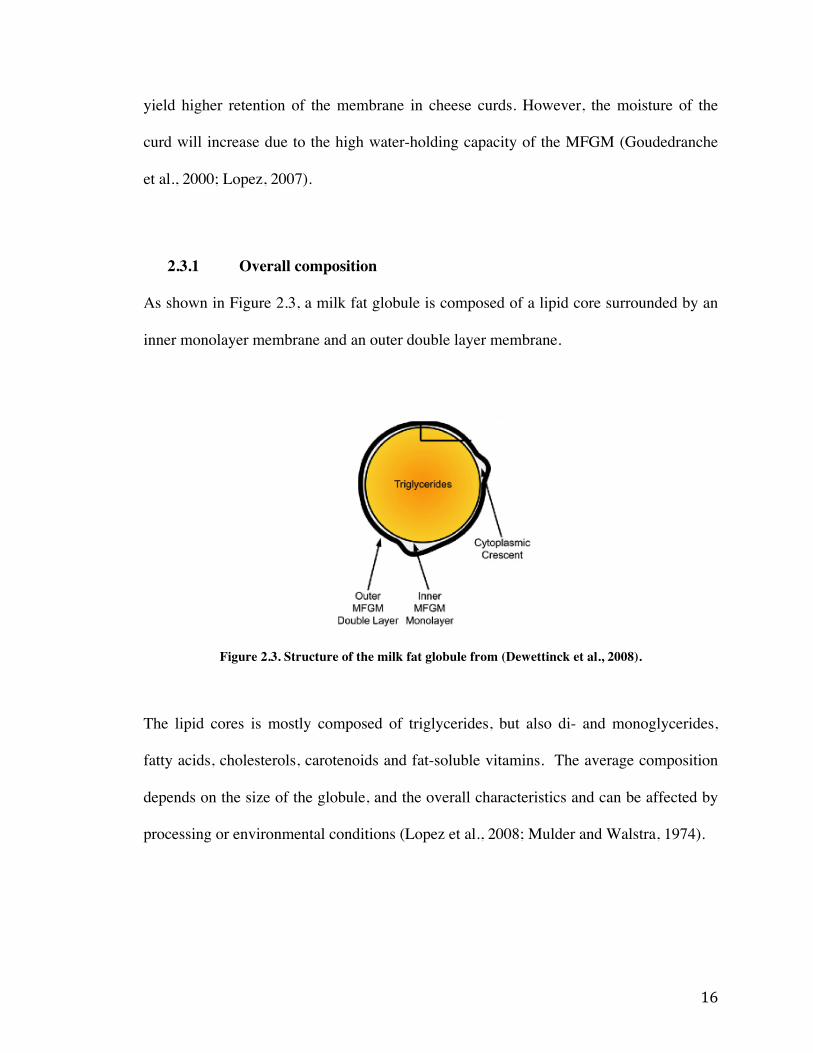
As shown in Figure 2.3, a milk fat globule is composed of a lipid core surrounded by an
inner monolayer membrane and an outer double layer membrane.
Figure 2.3. Structure of the milk fat globule from (Dewettinck et al., 2008).
The lipid cores is mostly composed of triglycerides, but also di- and monoglycerides,
fatty acids, cholesterols, carotenoids and fat-soluble vitamins. The average composition
depends on the size of the globule, and the overall characteristics and can be affected by
processing or environmental conditions (Lopez et al., 2008; Mulder and Walstra, 1974).
17
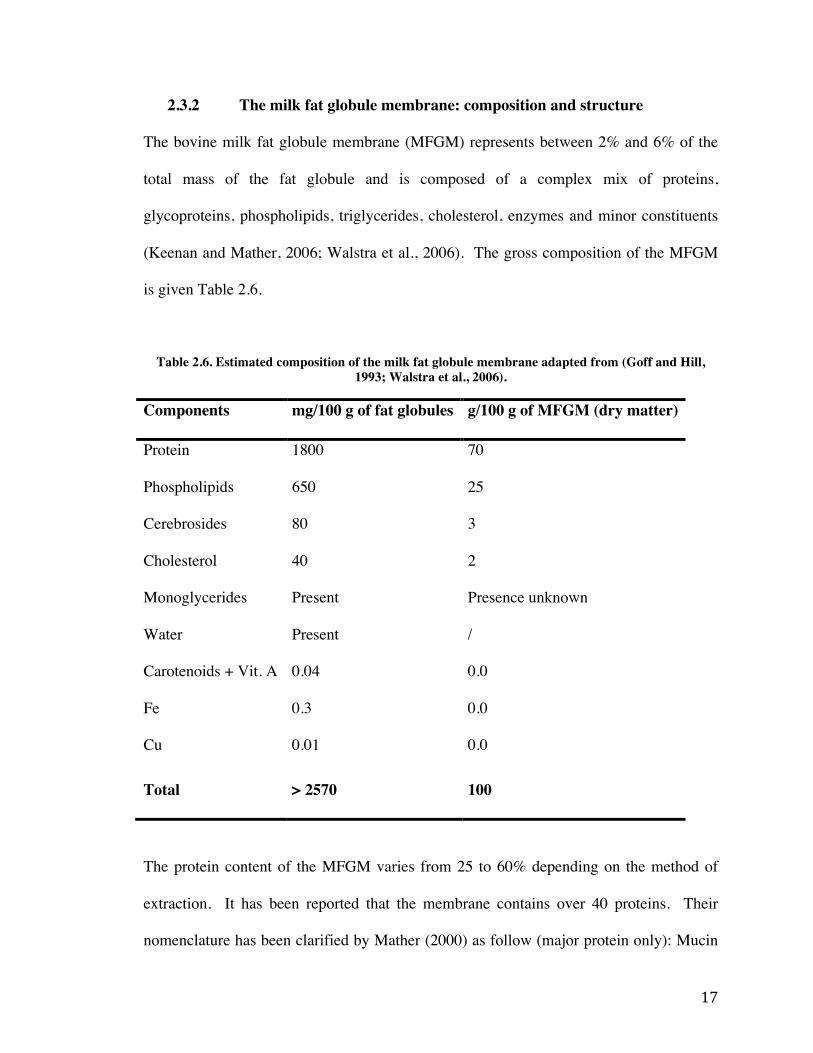
2.3.2 The milk fat globule membrane: composition and structure
The bovine milk fat globule membrane (MFGM) represents between 2% and 6% of the
total mass of the fat globule and is composed of a complex mix of proteins,
glycoproteins, phospholipids, triglycerides, cholesterol, enzymes and minor constituents
(Keenan and Mather, 2006; Walstra et al., 2006). The gross composition of the MFGM
is given Table 2.6.
Table 2.6. Estimated composition of the milk fat globule membrane adapted from (Goff and Hill, 1993; Walstra et al., 2006).
Components mg/100 g of fat globules g/100 g of MFGM (dry matter)
Protein 1800 70
Phospholipids 650 25
Cerebrosides 80 3
Cholesterol 40 2
Monoglycerides Present Presence unknown
Water Present /
Carotenoids + Vit. A 0.04 0.0
Fe 0.3 0.0
Cu 0.01 0.0
Total > 2570 100
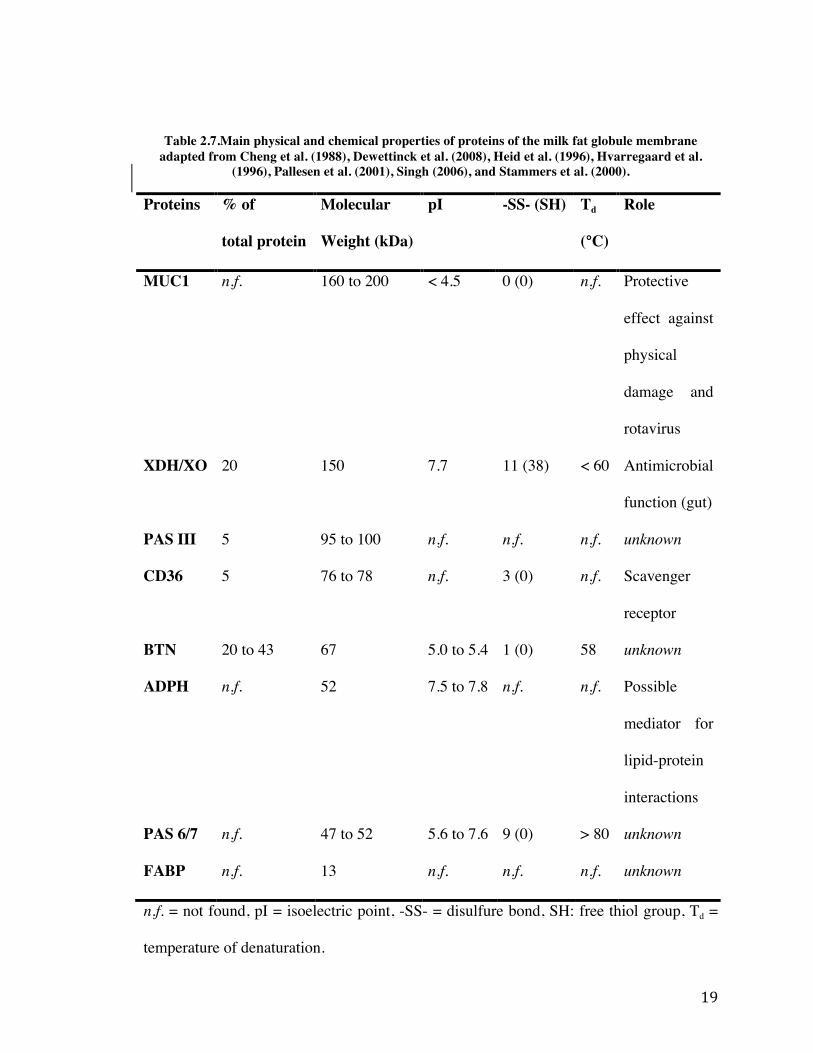
The protein content of the MFGM varies from 25 to 60% depending on the method of
extraction. It has been reported that the membrane contains over 40 proteins. Their
nomenclature has been clarified by Mather (2000) as follow (major protein only): Mucin

18
1 (MUC1), Xanthine Dehydrogenase/Oxidase (XDH/XO), Perodic Acid Schiff III (PAS
III), Cluster of Differentiation (CD36), Butyrophilin (BTN), Adipophilin (ADPH),
Periodic Acid Schiff 6/7 (PAS 6/7), and Fatty-Acid Binding Protein (FABP). The main
characteristics of these proteins are summarized in Table 2.7.
19
Table 2.7.Main physical and chemical properties of proteins of the milk fat globule membrane adapted from Cheng et al. (1988), Dewettinck et al. (2008), Heid et al. (1996), Hvarregaard et al.
(1996), Pallesen et al. (2001), Singh (2006), and Stammers et al. (2000).
Proteins % of
total protein
Molecular
Weight (kDa)
pI -SS- (SH) Td
(°C)
Role
MUC1 n.f. 160 to 200 < 4.5 0 (0) n.f. Protective
effect against
physical
damage and
rotavirus
XDH/XO 20 150 7.7 11 (38) < 60 Antimicrobial
function (gut)
PAS III 5 95 to 100 n.f. n.f. n.f. unknown
CD36 5 76 to 78 n.f. 3 (0) n.f. Scavenger
receptor
BTN 20 to 43 67 5.0 to 5.4 1 (0) 58 unknown
ADPH n.f. 52 7.5 to 7.8 n.f. n.f. Possible
mediator for
lipid-protein
interactions
PAS 6/7 n.f. 47 to 52 5.6 to 7.6 9 (0) > 80 unknown
FABP n.f. 13 n.f. n.f. n.f. unknown
n.f. = not found, pI = isoelectric point, -SS- = disulfure bond, SH: free thiol group, Td =
temperature of denaturation.

20
The overall pI of the MFGM has been determined to be around 4.8, meaning that at a
higher pH, the membrane will be charged negatively (Kanno and Kim, 1990).
As shown in Figure 2.4, the proteins are located throughout the membrane at different
positions. Most of the main proteins are trans-membrane protein of the outer layer, also
called serum-exposed side, such as MUC1, PAS III, BTN, and PAS 6/7. On the other
hand, XDH/XO is a peripheral-attached protein, CD36 is in the intracellular side of the
membrane and ADPH is in the inner polar lipid monolayer (Dewettinck et al., 2008;
Mather, 2000). MUC1, CD36, BTN, ADPH, are strongly attached to the membrane
meaning that they cannot be removed from the membrane even in the presence of
detergent or gravity (centrifugation). Oppositely, XDH/XO, PAS 6/7, and FABP are
weakly attached to the membrane.
Figure 2.4. Schematic representation of the bovine milk fat globule membrane from Brisson et al. (2010), Gallier et al. (2010), and Gallier et al. (2011). includes cooling, drying, separation, agitation, heating, and homogenization
(Michalski and Januel, 2006; Dewettinck et al., 2008; Brisson et al., 2010;Elias-Argote and Jiménez-Flores, 2010; Gallier et al., 2010b). With respectto physiological factors, Lopez et al. (2008) observed large differences in thefatty acid (FA) composition of the phospholipids in the milk from cows fed aregular diet and a diet rich in polyunsaturated FA. The latter resulted in a sig-nificant decrease in saturated FA content in milk, which enhances milk’snutrition quality (Lopez et al., 2008; Jensen, 2002½AU1" ).
p0030 In an attempt to summarize the different views of the arrangement of thelipids and proteins in the MFGM, we analyzed the properties of MFGM
PAS6/7Glycerophospholipids:
Cholesterol
PC (outer side), PE, PS, PI (inner side)
MUC1
Glycolipid
XDH/XO
BTN
PASIII
PP3
Raft: sphingolipid andcholestrol-rich domain
ADPH
Sphingolipid
CD36
Milk FatGlobule
Milk fat globulemembrane(MFGM)
n FIGURE 4.1 Diagram of the distribution ofthe phospholipids and proteins that constitutethe MFGM. Elias, Laubscher and Jiménez-Flores(2013).
Biological Origin and Current Status of Knowledge 109
10004-BOLAND-9780124046108
To protect the rights of the author(s) and publisherwe inform you that this PDF is an uncorrected proof for internal business use only by the author(s), editor(s), reviewer(s),
Elsevier and typesetter TNQBooks and Journals Pvt Ltd. It is not allowed to publish this proof online or in print. This proof copy is the copyright property of the publisher
and is confidential until formal publication.

21
In bovine milk, about 50 to 60% of the phospholipids are attached to the MFGM
(fragmented or not), and they represent 26 to 31% of the total lipid concentration of the
membrane (McPherson and Kitchen, 1983; Singh, 2006). The lipid composition of the
MFGM is presented Table 2.8.
Table 2.8. Lipid composition of the milk fat globule membrane from Keenan and Dylewski (1995)
and Walstra et al. (2006).
Constituents % of total lipids
Triglycerides 62
Diglycerides 9
Sterols 0.2 to 2.0
Free fatty acids 0.6 to 6.0
Phospholipids 26 to 31
The most common classes of phospholipids found in the MFGM are sphingomyelin
(SM), phosphatidyl choline (PC), phosphatidyl ethanolamine (PE), phosphatidyl inositol
(PI), phosphatidyl serine (PS), and lysiohosphatidyl choline. They represent 22%, 36%,
27%, 11%, 4%, and 2% of the total phospholipids in the membrane, respectively.
The phospholipids from the membrane have been largely investigated due to their
potential role in human nutrition and health. They have a wild range of actions against
colon cancer, Alzheimer’s disease, and support of the liver recovery from toxic attack
22
(Dewettinck et al., 2008; Spitsberg, 2005). It is also known that SM and PC are
important sources of choline.
2.3.3 Method for isolating the milk fat globule membrane
Different methods including membrane filtration, ultracentrifugation, etc. have been
proposed over the years to isolate the MFGM from raw milk, but only on a laboratory
scale. However, the method has been simplified and presented by Mather (2000) as a
four-step procedure in which the fat globules are separated from the whole milk or
buttermilk and washed several times with physiological buffers. The membrane is then
released from the surface of the globules due to physical and chemicals forces and
collected by centrifugation or ultracentrifugation.
First, the raw milk is skimmed using a cream separator or a centrifuge, and the cream is
collected. The cream still contains proteins, lactose and minerals and need to be washed
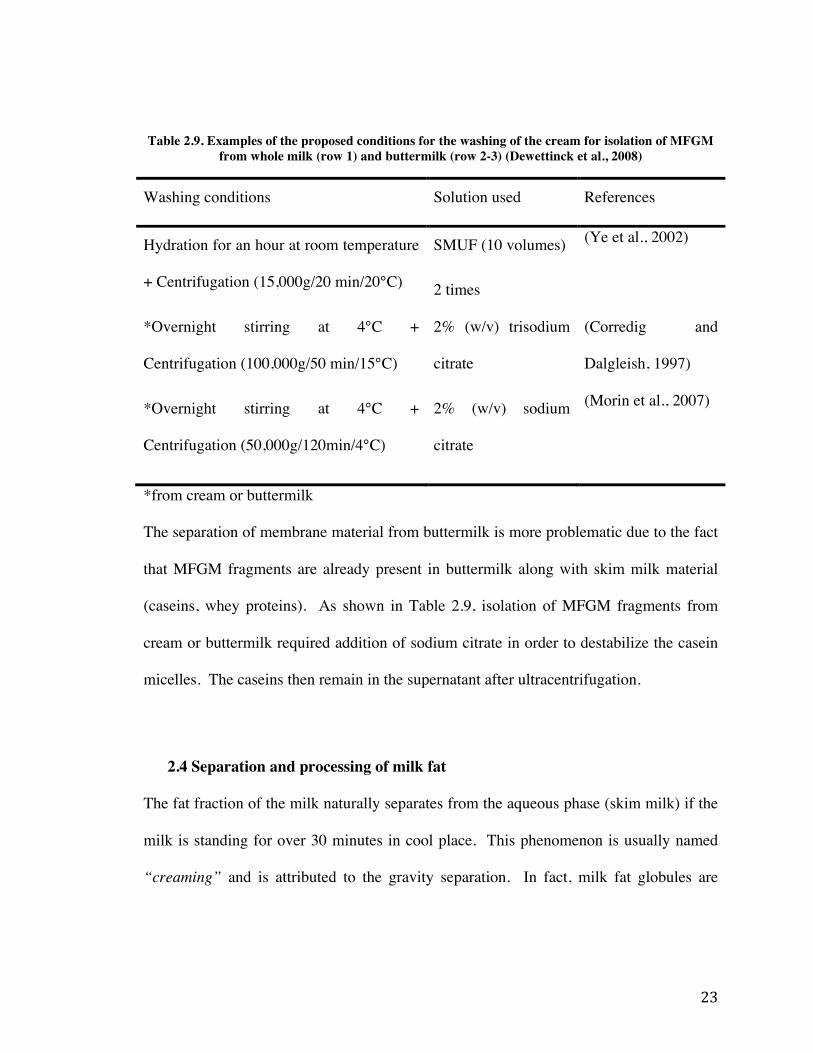
with a saline buffer in order to remove these constituents. The washing of the cream has
been extensively studied and a large range of conditions has been proposed. Table 2.9
summarized some of the most common ones (Dewettinck et al., 2008). Then, the washed
cream is destabilized either by churning, cycles of freezing-thawing, addition of detergent
(Triton X100), sonication, or polar aprotic solvents (i.e. dimethyl formamide) (Dapper et
al., 1987). Finally, an ultracentrifugation step (100,000g for 60 to 90 minutes) is
employed to recover the MFGM fragments (Patton and Keenan, 1975). The pellet can be
frozen until further experiments.
23
Table 2.9. Examples of the proposed conditions for the washing of the cream for isolation of MFGM from whole milk (row 1) and buttermilk (row 2-3) (Dewettinck et al., 2008)
Washing conditions Solution used References
Hydration for an hour at room temperature
+ Centrifugation (15,000g/20 min/20°C)
SMUF (10 volumes)
2 times
(Ye et al., 2002)
*Overnight stirring at 4°C +
Centrifugation (100,000g/50 min/15°C)
2% (w/v) trisodium
citrate
(Corredig and
Dalgleish, 1997)
*Overnight stirring at 4°C +
Centrifugation (50,000g/120min/4°C)
2% (w/v) sodium
citrate
(Morin et al., 2007)
*from cream or buttermilk
The separation of membrane material from buttermilk is more problematic due to the fact
that MFGM fragments are already present in buttermilk along with skim milk material
(caseins, whey proteins). As shown in Table 2.9, isolation of MFGM fragments from
cream or buttermilk required addition of sodium citrate in order to destabilize the casein
micelles. The caseins then remain in the supernatant after ultracentrifugation.
2.4 Separation and processing of milk fat
The fat fraction of the milk naturally separates from the aqueous phase (skim milk) if the
milk is standing for over 30 minutes in cool place. This phenomenon is usually named
“creaming” and is attributed to the gravity separation. In fact, milk fat globules are

24
lighter than the plasma phase, and hence rise to form a cream layer (O'Mahony, 1988).
The rate of rise of spherical particles in a liquid (V) can be estimated using Stokes’ Law:
Where, r is the radius of fat globules; d1 is the density of the liquid phase; d2 is the
density of the sphere; g is the acceleration due to gravity; and η is the specific viscosity
of the liquid phase.
Gravity separation is however, slow, inefficient, and hard to reproduce even if Ma and
Barbano (2000) demonstrated that the content of fat in raw milk could be reduced to
0.5% after 24 hours of standing at 4°C.
2.4.1 Centrifugal separation (principle, equipment, and products
generated)
In opposition to gravity separation, centrifugal separation is quicker and more efficient.
Generally, the concentration of fat in skimmed milk is less that 0.1% after centrifugal
separation (O'Mahony, 1988). Moreover, the centrifugal force is between 5,000 to
10,000 times greater than the gravitational force. In consequence, this process is widely
used in the dairy industry and different models have been developed. Centrifugal
separation is based on the fact that “when liquids of different specific gravities revolve
around the same center at the same distance with the same angular-velocity, a greater
centrifugal force is exerted on the heavier liquid that on the lighter one” (O'Mahony,
1988). This principle is applied to milk where the two liquids of different gravities are
V=r2 d1 ×d2( )g( )
gη

25
the serum and the fat. The most common type of centrifugal separator is presented in
Figure 2.5.
Figure 2.5. Cutaway diagram of a centrifugal separator (a) and the bowl (b). The paths of milk and cream fractions can be observed (O'Mahony, 1988).
As shown in the Figure 2.5, the milk enters in the system by the bowl, and then in the
rotating vessel. There, the whole milk is introduced into separation channels at the outer
edge of the disc stack and flows inwards. On the way through the channels, solid
impurities are separated from the milk and thrown back along the undersides of the discs
to the periphery of the separator bowl, where they are collected in the sediment space. As
the milk passes along the full radial width of the discs, the time passage allows even
small particles to be separated. The cream is less dense that the skim milk and therefore
settles inwards in the channels towards the axis of rotation and passes to an axial outlet.
The skim milk moves outwards to the space outside the disc stack and then through a
26
channel between the top of the disc stack and the conical hood of the separator bowl
(O'Mahony, 1988).
The efficiency of the separation of the fat from the aqueous phase depends on the speed
of the bowl, the residence time in the bowl, the density differential between the fat and
the liquid phase, and the size of the fat globules (O'Mahony, 1988).
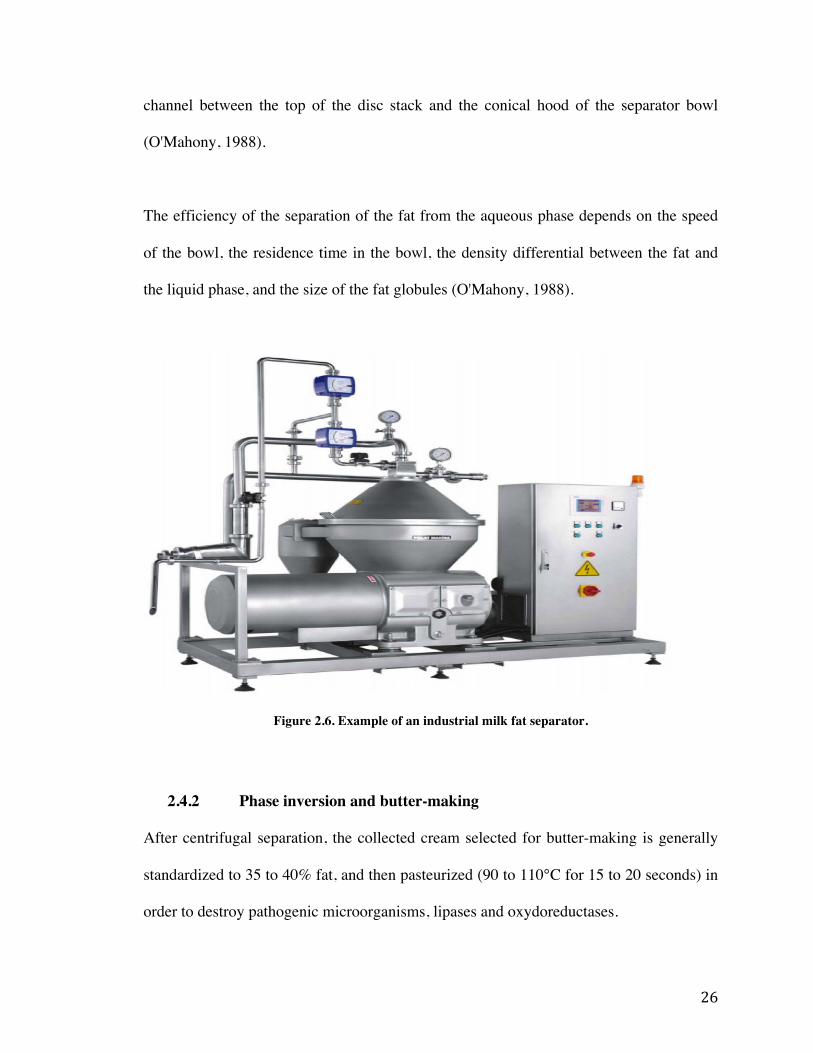
Figure 2.6. Example of an industrial milk fat separator.
2.4.2 Phase inversion and butter-making
After centrifugal separation, the collected cream selected for butter-making is generally
standardized to 35 to 40% fat, and then pasteurized (90 to 110°C for 15 to 20 seconds) in
order to destroy pathogenic microorganisms, lipases and oxydoreductases.

27
The pasteurized cream is then subject to ripening (or maturation) to destabilize the fat
globule. A physical ripening aims to manage the milk fat crystallization to reduce lipid
losses during churning and to shape the butter texture (leads to sweet buttermilk, also
called commercial buttermilk) (Vanderghem et al., 2010). Biological ripening consists of
the addition of ferments to the cream (Lactococcus lactis subsp. cremonis and
Lactococcus lactis biovar.) to lower acidity and develop butyric aromas (leads to cultured
buttermilk). A whey cream can be obtained by skimming whey from cheese making
(leads to whey buttermilk). This product is richer in MFGM materials and contains only
residual caseins.
However, complete destabilization of the cream is obtained by mechanical churning that
consists of the reversion of an oil-in-water emulsion into a water-in-oil emulsion. As air
is incorporated during the churning, proteins (β-lactoglobulin, α-lactalbumin, and β-
casein) from the cream unfold and form unstable foam with the air bubbles. Upon
mechanical stress, the foam is destabilized, resulting of fat clumping and phase inversion.
Butter becomes solid while the water and soluble particles form the buttermilk (Boudreau
and St-Amant, 1984). The formation of butter is represented in Figure 2.7.
Figure 2.7. The different stages of the formation of butter adapted from Mulder and Walstra (1974).
The fat is represented in white and the serum in black.
Working
Milk Cream Smallgrains
Largegrains
Butter
Figure 2.4 Stages in formation of butterWhite represents milk fat and black represents the sérum (adapted from Mulder &
Walstra (1974)).
The mechanical stress caused by churning also induces MFGM to rupture and liberate the
crystallized lipid content of the globules. Upon further churning the foam is destabilized,
fat dumping and phase inversion occurs leaving a mass of butter and the resulting
aqueous phase, buttermilk. Most of the MFGM material, skim milk proteins, minerais,
lactose and water are recovered in the buttermilk. However, a certain proportion of the
water and MFGM remains trapped in the butter in the form of small droplets. As butter is
mechanically worked, the water droplets are dispersed evenly in the butter mass (Figure
2.4).
Ail the phenomena discussed above apply to batch churning of cream (Frede &
Buchheim, 1994) but nowadays butter is mainly manufactured by the Fritz or continuous
process (Figure 2.5). In the Fritz process, cream (40-50% milk fat) is fed into a churning
cylinder fitted with beaters driven by a variable-speed motor (1). Phase inversion takes
place very rapidly, with the butter grains and buttermilk passing on to the séparation
section (2). Butter working begins in this section while the butter is being conveyed by
the screw conveyor to the squeeze-drying section (3). In the squeeze-drying section, the
butter passes through a conical channel and perforated plate to remove any remaining
buttermilk. The butter grains continue to the second working section (4), which opérâtes
28
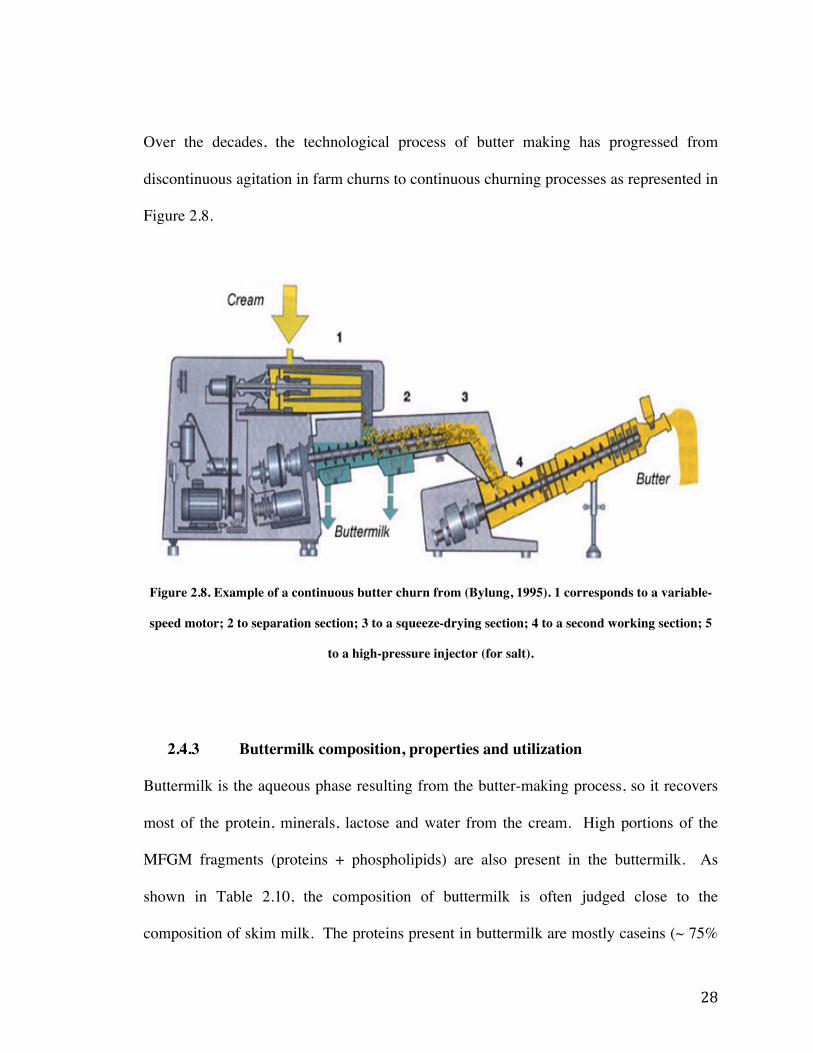
Over the decades, the technological process of butter making has progressed from
discontinuous agitation in farm churns to continuous churning processes as represented in
Figure 2.8.
Figure 2.8. Example of a continuous butter churn from (Bylung, 1995). 1 corresponds to a variable-
speed motor; 2 to separation section; 3 to a squeeze-drying section; 4 to a second working section; 5
to a high-pressure injector (for salt).
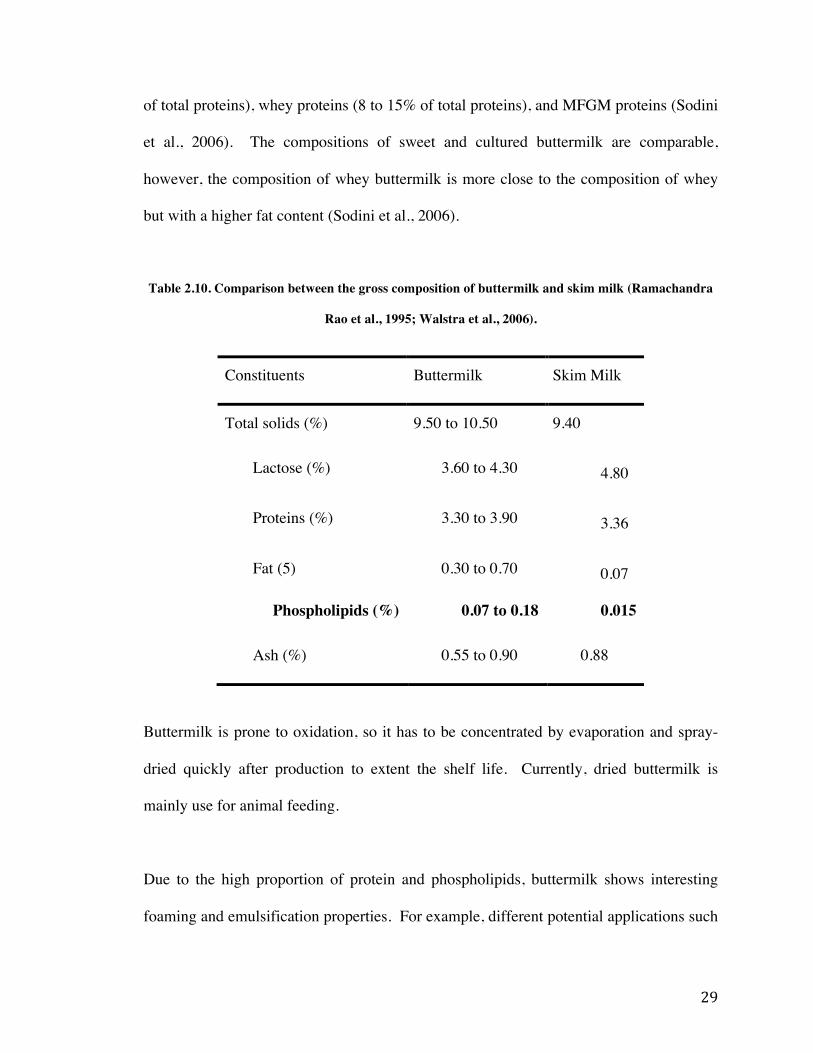
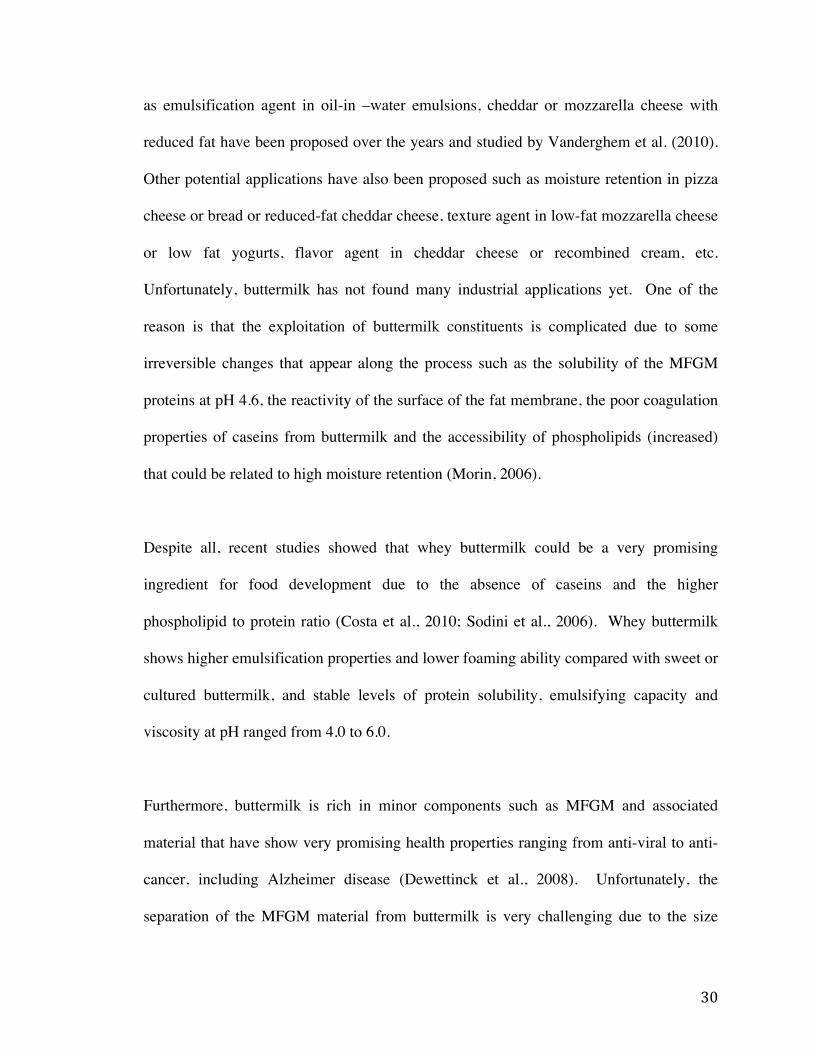
2.4.3 Buttermilk composition, properties and utilization
Buttermilk is the aqueous phase resulting from the butter-making process, so it recovers
most of the protein, minerals, lactose and water from the cream. High portions of the
MFGM fragments (proteins + phospholipids) are also present in the buttermilk. As
shown in Table 2.10, the composition of buttermilk is often judged close to the
composition of skim milk. The proteins present in buttermilk are mostly caseins (~ 75%
29
of total proteins), whey proteins (8 to 15% of total proteins), and MFGM proteins (Sodini
et al., 2006). The compositions of sweet and cultured buttermilk are comparable,
however, the composition of whey buttermilk is more close to the composition of whey
but with a higher fat content (Sodini et al., 2006).
Table 2.10. Comparison between the gross composition of buttermilk and skim milk (Ramachandra
Rao et al., 1995; Walstra et al., 2006).
Constituents Buttermilk Skim Milk
Total solids (%) 9.50 to 10.50 9.40
Lactose (%) 3.60 to 4.30 4.80
Proteins (%) 3.30 to 3.90 3.36
Fat (5) 0.30 to 0.70 0.07
Phospholipids (%) 0.07 to 0.18 0.015
Ash (%) 0.55 to 0.90 0.88
Buttermilk is prone to oxidation, so it has to be concentrated by evaporation and spray-
dried quickly after production to extent the shelf life. Currently, dried buttermilk is
mainly use for animal feeding.
Due to the high proportion of protein and phospholipids, buttermilk shows interesting
foaming and emulsification properties. For example, different potential applications such
30
as emulsification agent in oil-in –water emulsions, cheddar or mozzarella cheese with
reduced fat have been proposed over the years and studied by Vanderghem et al. (2010).
Other potential applications have also been proposed such as moisture retention in pizza
cheese or bread or reduced-fat cheddar cheese, texture agent in low-fat mozzarella cheese
or low fat yogurts, flavor agent in cheddar cheese or recombined cream, etc.
Unfortunately, buttermilk has not found many industrial applications yet. One of the
reason is that the exploitation of buttermilk constituents is complicated due to some
irreversible changes that appear along the process such as the solubility of the MFGM
proteins at pH 4.6, the reactivity of the surface of the fat membrane, the poor coagulation
properties of caseins from buttermilk and the accessibility of phospholipids (increased)
that could be related to high moisture retention (Morin, 2006).
Despite all, recent studies showed that whey buttermilk could be a very promising
ingredient for food development due to the absence of caseins and the higher
phospholipid to protein ratio (Costa et al., 2010; Sodini et al., 2006). Whey buttermilk
shows higher emulsification properties and lower foaming ability compared with sweet or
cultured buttermilk, and stable levels of protein solubility, emulsifying capacity and
viscosity at pH ranged from 4.0 to 6.0.
Furthermore, buttermilk is rich in minor components such as MFGM and associated
material that have show very promising health properties ranging from anti-viral to anti-
cancer, including Alzheimer disease (Dewettinck et al., 2008). Unfortunately, the
separation of the MFGM material from buttermilk is very challenging due to the size

31
similarity with casein micelles (Morin, 2006). However, they demonstrated that the
separation could be improved with the addition of a cream-washing step prior to the
microfiltration. Moreover, (Costa et al., 2010) proposed an approach to produce
buttermilk powder containing 73% of proteins (% of total solids) and 21% of lipids (% of
total solids) of which 61% where phospholipids using whey buttermilk and CO2-
supercritical fluid extraction.
2.5 Interactions between casein micelles and other milk components
Proteins generally tend to aggregate (or interact) under a variety of environmental
conditions through three main pathways such as: 1) aggregation through unfolding
intermediates and unfolded states, 2) aggregation through protein self-association or
chemical linkages, and 3) aggregation through chemical degradations (Wang et al.,
2010). The extent of aggregation depends on intrinsic factors like the structure of the
protein (primary, secondary, tertiary, or quaternary) or extrinsic factors such as the
environment of the proteins or the processing conditions. Aggregated proteins may
present less desirable characteristics like the poor coagulation properties of the casein
from buttermilk.
2.5.1 Whey proteins
Interactions between casein micelles and whey proteins have been extensively studied
starting a systematic series of studies since 1963 (Sawyer et al., 1963) and these studies
have dealt with mainly heat-induced interactions. However, very limited information is
available for physical and shear interactions.
32
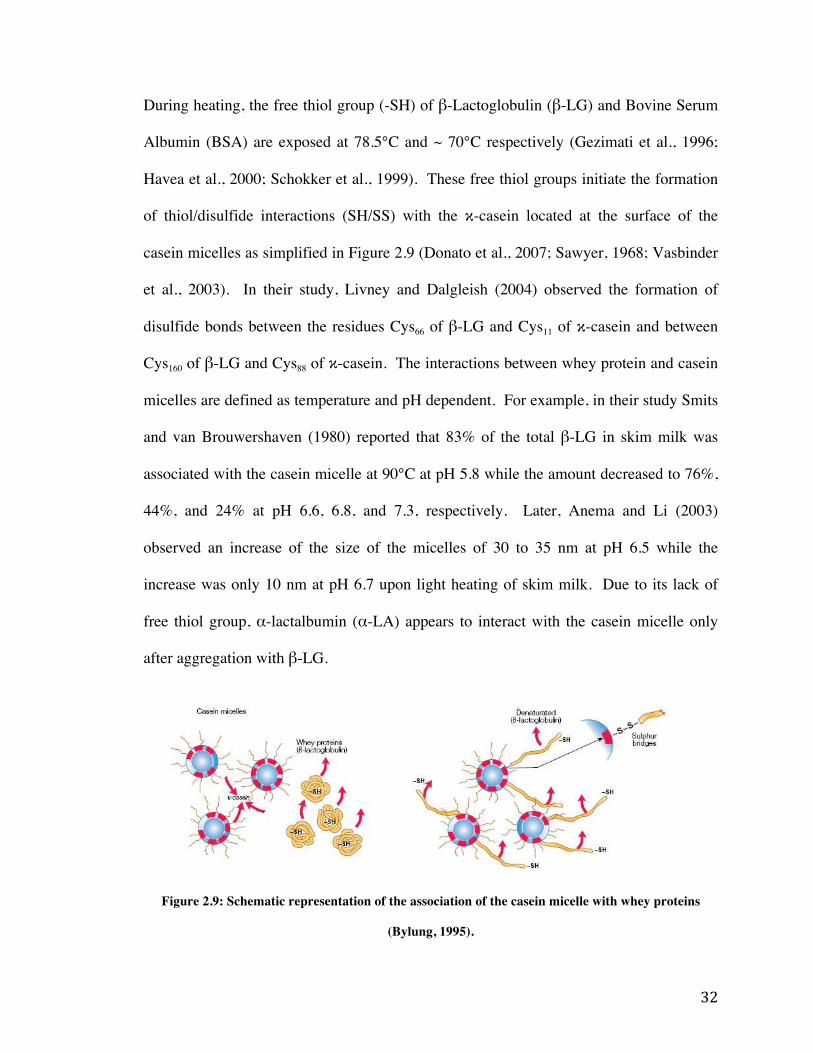
During heating, the free thiol group (-SH) of β-Lactoglobulin (β-LG) and Bovine Serum
Albumin (BSA) are exposed at 78.5°C and ~ 70°C respectively (Gezimati et al., 1996;
Havea et al., 2000; Schokker et al., 1999). These free thiol groups initiate the formation
of thiol/disulfide interactions (SH/SS) with the κ-casein located at the surface of the
casein micelles as simplified in Figure 2.9 (Donato et al., 2007; Sawyer, 1968; Vasbinder
et al., 2003). In their study, Livney and Dalgleish (2004) observed the formation of
disulfide bonds between the residues Cys66 of β-LG and Cys11 of κ-casein and between
Cys160 of β-LG and Cys88 of κ-casein. The interactions between whey protein and casein
micelles are defined as temperature and pH dependent. For example, in their study Smits
and van Brouwershaven (1980) reported that 83% of the total β-LG in skim milk was
associated with the casein micelle at 90°C at pH 5.8 while the amount decreased to 76%,
44%, and 24% at pH 6.6, 6.8, and 7.3, respectively. Later, Anema and Li (2003)
observed an increase of the size of the micelles of 30 to 35 nm at pH 6.5 while the
increase was only 10 nm at pH 6.7 upon light heating of skim milk. Due to its lack of
free thiol group, α-lactalbumin (α-LA) appears to interact with the casein micelle only
after aggregation with β-LG.
Figure 2.9: Schematic representation of the association of the casein micelle with whey proteins
(Bylung, 1995).
9
Figure 3: Interaction entre la micelle de caséine et la β-lactoglobuline à une température de 90°C
[13] Cette association limite l’insolubilisation mais entraine une modification de la micelle de caséine. Tout d’abord, cette association induit une augmentation du volume de la micelle de caséines provocant une possible perte de stabilité de la micelle lors des traitements thermiques à haute température. Cette association entraine également une augmentation de la viscosité du lait. Pour finir, il semblerait que la fixation de la β-lactoglobuline pourrait masquer le site d’action de la chymosine (détaillée en 4.1), provocant ainsi une perte de l’aptitude du lait (aussi appelée «rennet hysteresis») à la transformation fromagère. [33]
4 Utilisation des protéines de lactosérum en fromagerie Le lait présente une grande variabilité dans sa composition selon la race, le mode de lactation, la saison. Tous ces facteurs jouent un rôle dans l’aptitude à la transformation fromagère. Les industriels ont la possibilité de standardiser le taux protéiques des laits entre 30 et 42 g.L-1 à l’aide des techniques d’élimination d’eau (osmose inverse, ultrafiltration, etc.) afin d’optimiser l’aptitude à la coagulation, le rendement fromager et la qualité des fromages.
4.1 Caractéristiques d’un réseau fromager (caillé présure) Le caillé présure est obtenu suite à l’action d’une enzyme protéolytique d’origine animale, végétale ou microbienne qui va transformer le lait à l’état liquide en un gel. L’enzyme la plus souvent utilisée est la chymosine. Le mécanisme d’action de la présure se divise en trois phases. La phase primaire ou enzymatique (Figure 4) correspond à l’hydrolyse de la caséine κ au niveau de la liaison PHE105-MET106 par l’enzyme. Cette coupure de la chaîne peptidique provoque la formation de deux segments, la paracaséine-κ (1-105) qui reste liée à la micelle de caséine et le caséinomacropeptide (CMP ; 106-169) qui passe dans le lactosérum. La libération du CMP entraine une diminution du degré d’hydratation et de la charge électrique ce qui provoque une perte de la stabilité de la micelle de caséine.
33
Despite all the evidence found during the last fifty years, the mechanism of heat-induced
interaction between casein micelle and whey proteins is uncertain. It is still not clear if
the whey proteins self-aggregate prior to the association with the micelle or if the whey
proteins self-associate at the surface of the casein micelle (Donato and Guyomarc'h,
2009). On the other hand, it is clear that the κ-casein plays an important role in the
interaction with the whey proteins, but there are still questions remaining such as when
the κ-casein dissociate from the micelle.
The understanding of the association of whey proteins with the casein micelle during
processing is important because it will help to limit possible irregularities in the
production of cheese or help to better use dairy by-products such as buttermilk.
2.5.2 Other minor components
Interactions of the MFGM proteins with other milk proteins have not been fully
understood yet. So far, it is known that some of the MFGM protein such as XO, BTN,
PAS 6 can interact with each other under heating and at low temperatures (~60°C) (Appel
et al., 1982; Ye et al., 2002). Later, (Ye et al., 2004b; Ye et al., 2004c) proposed
mechanisms of heat-induced association of whey proteins with MFGM proteins where
the interactions are initiated by the free thiol groups of the MFGM proteins and the
complex is stabilized by SH/SS exchanges with the whey proteins. For example, XO has
38 free thiol groups with 4 available in the native form of the protein (Cheng et al., 1988).
34
Even if there is not much proof of interactions of MFGM proteins with the casein
micelle, it is easy to hypothesize that the MFGM proteins can initiate interactions with κ-
casein through their free thiols as β-lactoglobulin does. Houlihan et al. (1992) concluded
that κ-casein may interact directly with MFGM components and that the interactions
increased with time. Later, Corredig and Dalgleish (1996a) found that some casein were
present in fat globule isolates only after heating whole milk by direct steam injection.
Their result suggests that the interactions are strong due to the isolation method (urea
treatment). However, these studies do not permit to conclude if it is individual caseins or
the casein micelles that interact with the MFGM proteins. However, Ye et al. (2004c)
reported the presence of κ-casein and other caseins in the MFGM material. These
observations strongly suggest that the casein micelles associate with the MFGM via
SH/SS exchanges between κ-casein and MFGM proteins.
Association between the casein micelles and the MFGM proteins does not only appear
under heating. Ye et al. (2004a) showed that caseins also appear to interact with the
caseins under high pressures through SH/SS exchange between κ-casein and the MFGM
proteins. Needs et al. (2000) concluded that high pressures (250 to 600 MPa) disrupted
the micelles into smaller fragments that are likely to be absorbed at the surface of the fat
globules.
Houlihan et al. (1992) proposed that the milk proteins could associate with the MFGM
material through the membrane lipids. During processing, the MFGM proteins may be
lost while the hydrophobic regions of the membrane phospholipids become more

35
accessible. Morin (2006) showed that buttermaking process modifies the surface of the
fat membrane and increase the accessibility of phospholipids. More recently, Saffon
(2013) showed that protein aggregates were formed during processing of buttermilk
including caseins, whey proteins, MFGM proteins, and phospholipids.
2.5.3 Fatty acids and other lipids
According to Barratt et al. (1974), interactions between proteins and lipids are possible in
a “water-based” mixture if the free energy lost by the protein is greater than the free
energy lost by its association with the lipid. As a general trend, the association is
initiated by ionic interaction between charged amino acid residues in the protein (lysine
or arginine) and the polar head groups (phosphate or carboxylic) of the lipid to position
the lipid. Then, the complex is stabilized by hydrophobic interactions between the
hydrophobic side of the protein and the hydrocarbon chain of the lipid (Dufourcq and
Faucon, 1977; Ong et al., 1981).
Barratt et al. (1974) demonstrated that αS1-casein was able to interact with synthetic
lecithins and lysolecithins in their system while β-casein and κ-casein were not found to
interact with the phospholipids. Their results showed that long-chain lipids formed stable
lipid-protein complex while the short-chain lipids formed were not stable. Overall,
Barratt et al. (1974) found αS1-casein could bond with 30 to 35 molecules phospholipids
(lysolecithin in that case).
36
3. MATERIALS AND METHODS
3.1 Materials
Raw whole fresh milk and fresh cream were collected from the bulk of a local dairy
(Natrel, Quebec City, QC, Canada). Reactants for the polyacrylamide gel electrophoresis
techniques were from Bio-Rad (Bio-Rad laboratories Ltd., Hercules, CA, USA) and all
other reagents were from Fisher Scientific (Fair Lawn, NJ, USA).
3.2 Preparation of raw cream, raw skim milk and raw buttermilk
After the addition of 0.02% sodium azide (w/v), the raw milk was skimmed at 10°C by
centrifuging at 2400 x g for 20 minutes in a 5804 R Eppendorf preparative centrifuge
with A-4-44 rotor (Eppendorf, 5894R Westbury, NY, USA). The raw skimmed milk was
collected and approximately 250 mL of fresh cream was taken from stock prior to
churning.
A total volume of 5L of raw cream was churned in a rotary churn at 30 rpm and 18°C and
was broken down within an average of 30 minutes of churning. The buttermilk was
recovered from the churn in a stainless steel panel, and butter was discarded.
Samples of cream, skim milk, and buttermilk were stored at 4°C overnight. The overall
process used for the preparation of the ingredients is summarized in Figure 3.1.

37
Figure 3.1: Experimental procedure used to prepare the raw cream, raw skim milk, and raw
buttermilk
3.3 Isolation of casein micelles
Casein micelles were separated from raw cream, skim milk, and buttermilk according to
the method described by Corredig and Dalgleish (1996b) using a Beckman preparative
ultracentrifuge (L8-M, rotor 50.Ti) at 60000 x g for 40 minutes at 25°C. The supernatant
was decanted and the micellar pellet was resuspended in buffer pH 7.0, containing 20mM
imidazole, 5mM CaCl2, and 50mM NaCl. After a second ultracentrifugation under the
same conditions, the micellar pellet was collected, drained on Whatman No. 1 filter
paper, and frozen until further analysis under the following names: SM, CR, and BM for
the casein micelles of raw skim milk, cream, and buttermilk, respectively. The overall
process for the isolation of the casein micelles is summarized in Figure 3.2.
38
Figure 3.2: Experimental procedure used to isolate the casein micelles from the raw cream, raw skim
milk, and raw buttermilk.
3.4 Analytical methods
3.4.1 Composition
Total protein in raw, supernatant, and micellar sample was determined by measuring total
nitrogen using the Dumas combustion method (LECO TruSpec N analyzer, LECO, St.
Joseph, MI) (IDF, 2002), and converting the value to protein using a conversion factor of
6.38. Total solids were obtained by microwave drying for 4 hours at 102°C (Fisher
Scientific, Isotemp vacuum oven, model 280A). The lipid content was obtained
gravimetrically using the Mojonnier extraction method (IDF, 2008).
39
3.4.2 Polyacrylamide gel electrophoresis
3.4.2.1 One-dimensional PAGE
The analyses were performed according to the method described by Laemmli (1970). A
weighed amount of the ultracentrifuged micellar fraction (about 15mg) was resuspended
in 10mL of deionized water and vortexed. Next, 10µL of the solution was mixed with
20µL of a solution of 95% Laemmli buffer (Bio-Rad Laboratories Ltd.) and 5% 2-
mercaptoethanol. Supernatant fractions were diluted 4:1 with Laemmli buffer and 2-
mercaptoethanol. All samples were vortexed and boiled for 5 minutes in a water bath.
Aliquots (10µL) of denatured protein samples were loaded onto hand cast 12.5% Tris-
HCL polyacrylamide gels. Electrophoresis was conducted using a Mini Protean® II gel
kit (Bio-Rad) at 90V for approximately 60 minutes, in 5X SDS-PAGE running buffer
containing Tris, glycine, and SDS. Following electrophoresis, gels were stained in
Coomassie blue (50% methanol, 10% glacial acetic acid and 0.25% Coomassie brilliant
blue), overnight on a shaker plate at room temperature. Subsequently, gels were destained
in a 80% deionized water, 10% methanol, and 10% glacial acetic acid solution for two
hours. Gels were then photographed using a Bio-Rad ChemiDoc.
3.4.2.2 Two-dimensional PAGE
The sample preparation for 2D electrophoresis was adapted from the method of Fortunato
et al. (2003) with minor modifications. Briefly, casein micellar pellets (250 µg) were
solubilized in 250 µL of deionized water, and were then precipitated and defatted with 1 mL
of methanol, chloroform, and deionized water in a ratio of 500:125:375 (v:v:v). Suspensions
were then centrifuged at 10,000 x g for 10 min. The upper layer was removed and 500 µL of
40
methanol was added to the lower layer. Suspensions were centrifuged at 10,000 x g for 10
min and pellets were dried by evaporation of solvents. The pellets were then solubilized
in 250 µL of an electrophoretic sample buffer consisting of 7 M urea, 2 M thiourea, 4%
(w/v) CHAPS, 1 % (v/v) Triton-X-100, 20 mM Tris, 0.5% (v/v) IPG buffer pH 3-10
(Amersham Biosciences, Baie d'Urfé, Quebec, Canada), and 60 mM dithiothreitol (DTT)
(Sigma-Aldrich, Oakville, Ontario, Canada). Approximately 250 µg of protein was
loaded onto an 18 cm pH 3–10 immobilized pH gradient (IPG) strip (GE Healthcare) and
was actively rehydrated over 18 h using a Step-n-hold setting. The rehydrated IPG strips
were focused in an IPGphor (Amersham Pharmacia Biotech) at 30V for 12 hours,
followed by 1 hour at 100V, 1 hour at 500V, 1 hour at 1000V, 1 hour at 5000V and 2
hours at 8000V to achieve a total of 16000 Vh. The focused IPG strips were equilibrated
with a 2% sodium dodecyl sulfate (SDS) buffer containing 1% DTT, 50mM Tris-HCl,
30% glycerol and 6M Urea for 15 minutes. The focused and equilibrated IPG strips were
embedded with 0.5% agarose on top of a 5-15% Tris-HCl SDS-polyacrylamide gel
electrophoresis (PAGE) gel. Electrophoresis was performed on a Protean II
electrophoresis unit (BioRad) at a constant current per gel of 25 mA for 20 minutes
followed by 30 mA for approximately 4 hours, until the bromophenol blue dye front
reached the bottom edge of the gel. Proteins were fixed on the gel overnight in a fixation
solution containing 50% ACS Methanol, 40% deionized water, and 10% glacial acetic
acid. The next morning, the fixation solution was replaced for one hour, and the gel was
rinsed with deionized water before the addition of Gel CodeBlue stain overnight. Finally,
the gel was washed for 2 hours before imaging on a BioRad ChemiDoc.
41
The milk fat globule membrane proteins (MFGM proteins) were separated from the pellet
II fraction of the samples, as proposed by Corredig and Dalgleish (1997). Briefly, the
pellets were dispersed in a sodium citrate buffer (5% w/v) and stirred overnight. The
solutions were centrifuged for 2 hours at 50,000 g at 4°C, the supernatant was discarded,
and the pellet was dispersed in a PBS buffer (containing 1% (w/v) of Triton X-100). The
solutions were centrifuged for 2 hours at 50,000 g at 4°C, the supernatant was discarded,
and the pellet was drained on Whatman No. 1 filter paper with 25 mL of deionized water.
Finally, the pellet was dispersed in 25 mL of deionized water. The protein profile was
determined using the two-dimensional PAGE procedure described above.
3.4.3 Particle size distribution and zeta potential of the casein micelles
Particle size and zeta potential measurements were made by photon correlation
spectroscopy using a Malvern Zetasizer 4 instrument and a glass cuvette with round top
particle sizing cell (Malvern Instruments Ltd, Worcestershire, UK) (Malvern Instrument
SA, 2009). A weighed amount of the ultracentrifuged micellar fraction (about 0.02g) was
resuspended in 10 mL of deionized water using a stir plate overnight at 4°C. The
temperature of the cell was maintained at 25 ± 0.5 °C for the duration of the experiments.
Each sample had a total of 5 measurements. Measurements of the dynamics of the
scattered light were collected at a 173° scattering angle. The rates of change of intensity
of light were translated into average particle diameters using the Stokes-Einstein
relationship for spheres.

42
A weighed amount of the ultracentrifuged micellar fraction (about 0.02g) was
resuspended in 10 mL of deionized water using a stir plate overnight at 4°C. Each
measurement was performed at 25 ° C the following morning using a universal dip cell.
Each sample was measured a total of 5 times.
The Zetasizer software calculates the electrophoretic mobility by measuring the speed of
movement of the charges through the application of electric current particles. The zeta
potential is then estimated from the electrophoretic mobility by the Henry equation:
( )aκ f ε 2η U3 z E=
Where,
Z= zeta potential
UE= electrophoretic mobility
η= viscosity of the solution
ε= dielectric constant
f(κa)= function of Henry. The term κa measures the ratio between the radius of the
particle and the thickness of the double electric layer (Debye layer).
3.4.4 Phosphorus content of micellar pellet
Phosphorus determinations were performed colorimetrically using the method of Allen
(1940). Sample preparation enabled to estimate all the forms of phosphorus (esterified,
mineral, etc.) in the pellets. (See Figure 3.3)

43
Figure 3.3: Experimental procedure used to determine phosphorus content of casein pellets.
3.4.4.1 Total Phosphorus
A sample of 40mg of micellar pellet was weighed on nitrogen-free weighing paper and
was added to a micro-kjeldahl flask with glass beads and 10mL of 70% Nitric acid. The
tubes were heated on a heating block to ≥165°C until 2-3mL of liquid remained. 6mL of
60% Perchloric acid was added to the tubes, and the solution was boiled at ≥210°C for
one hour or until the color changed became clear and transparent. The tubes were cooled
to room temperature, and 0.5mL of hydrogen peroxide was added. After, the tubes were
heated slowly to ≥165°C until all chloride and peroxide were removed (~15 minutes).
The tubes were then cooled to room temperature and were washed and transferred to a 50
mL volumetric flask with ~30 mL of deionized water. The molybdate method was then
Sample (40 mg)
Heating (≥ 165°C)
+ HNO3 (10 mL) Boiling (60 min)
+ perchloric acid (60%; 6 mL)
Cooling
+ hydrogen peroxide (30%; 0.5 mL)
Heating (≥ 165°C)
Mixing (50 mL; 30 min)
+ amidol (4 mL) + NH4 molybdate (2 mL)
Absorbance (750 nm)
Molybdate method
Soluble + colloidal esterified phosphorus
bound to casein
Filtrating Whatman #40
Mixing (50 mL; 30 min)
+ H2O (~ 30 mL) + perchloric acid (4 mL) + amidol (4 mL) + NH4 molybdate (2 mL)
Absorbance (750 nm)
Soluble + colloidal phosphorus
Soluble + colloidal esterified phosphorus
1 (mL) 1 (mL)
Sample (400 mg)
Stirring (30 min; 21°C)
+ H2O (2 mL)
Stirring (overnight)
+ TCA (8 mL)
44
carried out by adding 4 mL of an amidol solution, 2 mL of Ammonium molybdate, and
filled to the line with deionized water. Between 15 and 30 minutes after the addition of
ammonium molybdate, the absorbance was read at 750nm using a spectrophotometer.
3.4.4.2 Total Phosphorus acid-soluble (esterified P, soluble+colloidal P)
Approximately 400 mg of sample was solubilized in 2 mL deionized water overnight at
4°C. The following day, the samples were transferred to a 10 mL volumetric flask and 8
mL of 10% Trichloroacetic acid (TCA) was added. The sample was mixed well and left
to sit at room temperature for 30 minutes. Next, the samples were filtered on a Whatman
No. 40 filter paper, allowing the first few drops to be discarded. One mL of the filtrate
was added to a micro-Kjeldahl tube and the same digestion method was carried out as the
total phosphorus. Finally, the molybdate method was then carried out by adding 4 mL of
an amidol solution, 2 mL of ammonium molybdate, and filled to the line with deionized
water. Between 15 and 30 minutes after the addition of ammonium molybdate, the
absorbance was read at 750nm using a spectrophotometer.
3.4.4.3 Acid-soluble Inorganic Phosphorus (soluble+colloidal)
One mL of the filtrate from the total phosphorus acid-soluble (esterified P,
soluble+colloidal P) was added to a 50mL volumetric flask immediately after filtration.
To the flask was added: 30 mL deionized water, 4 mL perchloric acid, 4 mL amidol
solution, and 2 mL ammonium molybdate. After 15 minutes, the absorbance of the
sample was read at 750nm using a spectrophotometer.
45
From the phosphate stock solution, 3 standards were made (0.05, 0.16 and 0.3 mg/50
mL). The digestion process was completed as normal, and the required volume of the
stock solution was added to the volumetric flask just before the addition of 4 mL
perchloric acid, 4 mL of amidol solution, and 2 mL of ammonium molybdate. After 15
minutes, the absorbance of the sample was read at 750 nm using a spectrophotometer. A
standard curve was created with the average values of the duplicate samples, and a best-
fit line was added to find the slope and intercept of the line.
3.4.5 Freeze-drying of micellar pellet
Between 0.9 and 1.5 g of sample were placed in an 1.5 mL centrifuge tube was were
frozen for 24 hours at -80°C. The centrifuge tubes were opened and parafilm was placed
over the opening and were punctured with a sterile needle. The vacuum and refrigeration
of the freeze-drying system (LABCONCO, LyphLock 4.5, Kansas City, MO, USA) was
equilibrated at -45°C, and the samples were freeze-dried for 24 hours and placed in a
desiccator until further use.
3.1 Cation content of micellar pellet
Sodium, Magnesium, Potassium, and Calcium content of the micellar pellet from cream,
skim milk, and buttermilk were measured using atomic absorption methods of Brooks et
al. (1970).
46
3.4.6.1 Total Calcium (Ca), Potassium (K), Sodium (Na), and Magnesium (Mg)
Approximately 100 mg of freeze-dried micellar pellet was placed in a pre-conditioned
crucible. The crucible was then ashed overnight (~18 hours) at 550°C. The following
morning, the sample was weighed and the ashes were dissolved in 1 mL of a nitric acid
solution. The dissolved ashes were transferred to a 25 mL flask, and rinsed with a small
amount of HPLC water and filled to the line. After the sample was mixed thoroughly, it
was filtered on Whatman No. 42 filter paper. The mineral content of the sample was
determined using atomic absorption with flame (Perkin-Elmer 3300 atomic absorption
spectrometer, Uberlingen, Germany) at 422.7 nm for calcium, 766.5 nm for potassium,
589.0 nm for sodium, and 285.2 nm for magnesium.
3.4.6.2 Soluble Ca, K, Na, Mg:
Approximately 150 mg of freeze-dried micellar pellet was reconstituted overnight at 4°C
in 10 mL of HPLC water. The following morning, the sample was transferred to a 50 mL
volumetric flask, and the beaker was rinsed with a few milliliters of HPLC water. 25 mL
of 24% TCA was added to the flask and was filled to the line with HPLC water. After
mixing, the sample was filtered and Whatman No. 40 filter paper. The mineral content of
the sample was determined using atomic absorption with flame (Perkin-Elmer 3300
atomic absorption spectrometer, Uberlingen, Germany) at 422.7 nm for calcium, 766.5
nm for potassium, 589.0 nm for sodium, and 285.2 nm for magnesium.

47
3.5 Statistical analysis
All experiments were performed on four different lots of whole fresh milk
(unpasteurized) and fresh cream (unpasteurized), so each value represents the mean of
four measurements. Statistical analysis was carried out using SAS software (SAS
Institute Inc., Cary, NC, USA). Mean comparisons were performed using a Tukey test.
Results were considered significantly different when P < 0.05.

48
4. RESULTS
4.1 Compositional analysis and mass balance of milk components
The lipid composition for raw cream, raw skim milk, and raw buttermilk was found to be
43.0 ± 2.7%, 0.14 ± 0.01%, and 3.28 ± 0.1%, respectively. Total solids measurements
were found to be 48.43 ± 2.3%, 9.15 ± 0.4%, and 12.12 ± 0.4%, respectively for raw
cream, raw skim milk, and raw buttermilk. The evolution of the protein content from
fresh raw cream to buttermilk micellar pellet is presented in Figure 4.1.
Figure 4.1: Summary of the evolution of the protein content (in %) and protein mass (in g) during
the isolation of the casein micelle of buttermilk.

49
Results showed that 76.3% of the protein from fresh cream to raw buttermilk was
recovered after churning. The moisture content of the micellar pellet of the buttermilk
was 69.9 ± 1.1% and the protein content was 22.4 ± 0.98%. The protein content in the
pellets represents 74.2% ± 3.0%, 82.4 ± 2.8%, and 78.3% ± 1.4% of the total solids, for
raw cream, skim milk, and buttermilk, respectively. Dalgleish and Corredig reported,
“casein is the major protein component of bovine milk, comprising approximately 80%
of the total milk protein”, which follows the trend seen in the above results (Dalgleish
and Corredig, 2012). The protein content of micellar pellets from raw cream and skim
milk after ultracentrifugation was found to be 22.2 ± 1.1% and 23.4 ± 2.1%, respectively.
4.2 One-Dimensional Gel Electrophoresis
One-dimensional SDS-PAGE gels were run in order to confirm that the isolation of the
casein micelles from ultracentrifugation was efficient (Figure 4.2).
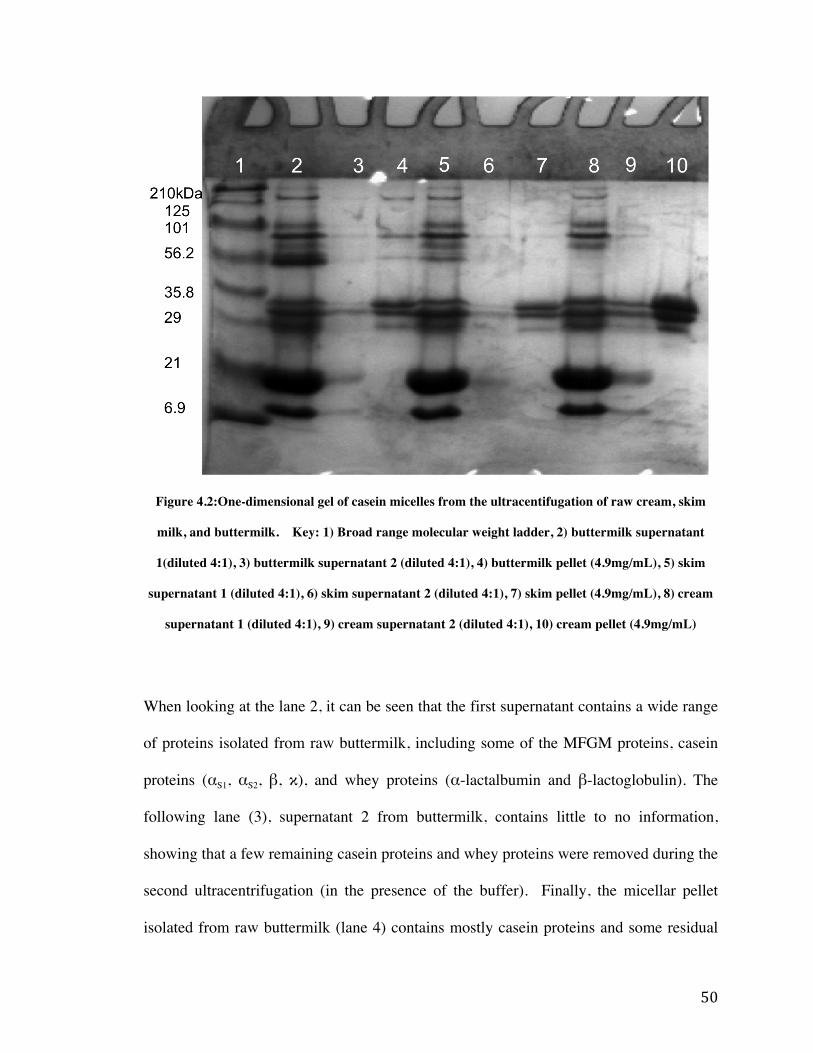
50
Figure 4.2:One-dimensional gel of casein micelles from the ultracentifugation of raw cream, skim
milk, and buttermilk. Key: 1) Broad range molecular weight ladder, 2) buttermilk supernatant
1(diluted 4:1), 3) buttermilk supernatant 2 (diluted 4:1), 4) buttermilk pellet (4.9mg/mL), 5) skim
supernatant 1 (diluted 4:1), 6) skim supernatant 2 (diluted 4:1), 7) skim pellet (4.9mg/mL), 8) cream
supernatant 1 (diluted 4:1), 9) cream supernatant 2 (diluted 4:1), 10) cream pellet (4.9mg/mL)
When looking at the lane 2, it can be seen that the first supernatant contains a wide range
of proteins isolated from raw buttermilk, including some of the MFGM proteins, casein
proteins (αS1, αS2, β, κ), and whey proteins (α-lactalbumin and β-lactoglobulin). The
following lane (3), supernatant 2 from buttermilk, contains little to no information,
showing that a few remaining casein proteins and whey proteins were removed during the
second ultracentrifugation (in the presence of the buffer). Finally, the micellar pellet
isolated from raw buttermilk (lane 4) contains mostly casein proteins and some residual
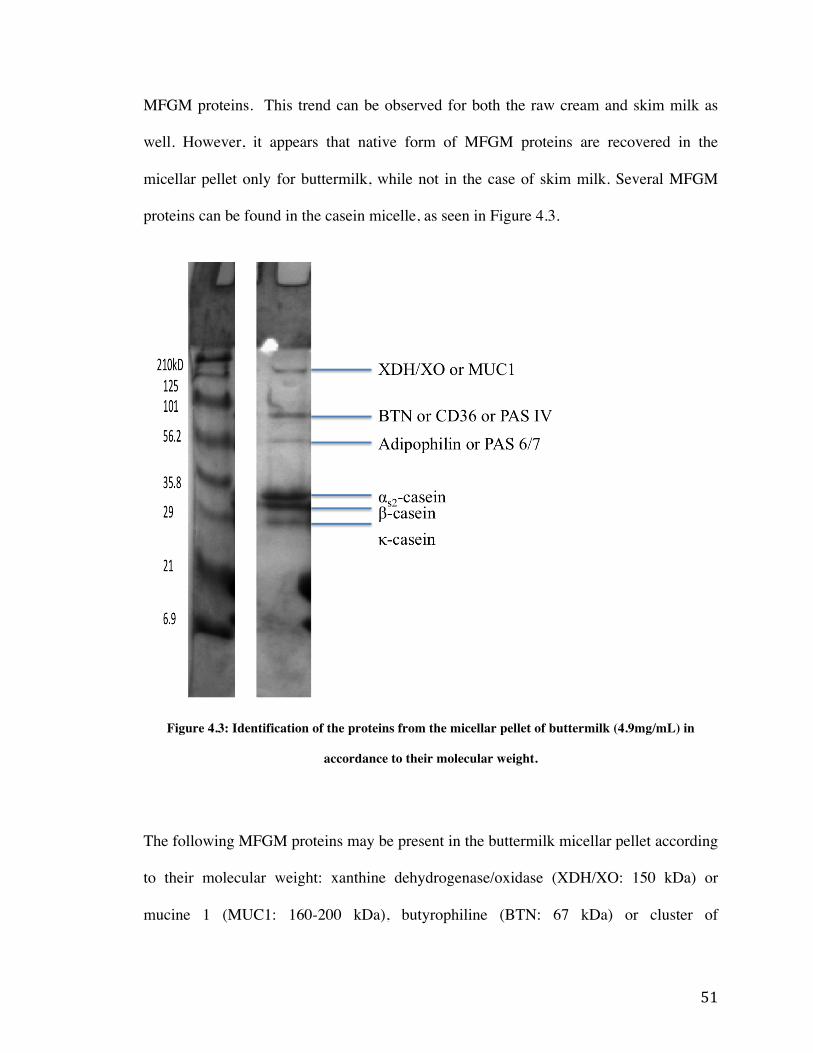
51
MFGM proteins. This trend can be observed for both the raw cream and skim milk as
well. However, it appears that native form of MFGM proteins are recovered in the
micellar pellet only for buttermilk, while not in the case of skim milk. Several MFGM
proteins can be found in the casein micelle, as seen in Figure 4.3.
Figure 4.3: Identification of the proteins from the micellar pellet of buttermilk (4.9mg/mL) in
accordance to their molecular weight.
The following MFGM proteins may be present in the buttermilk micellar pellet according
to their molecular weight: xanthine dehydrogenase/oxidase (XDH/XO: 150 kDa) or
mucine 1 (MUC1: 160-200 kDa), butyrophiline (BTN: 67 kDa) or cluster of
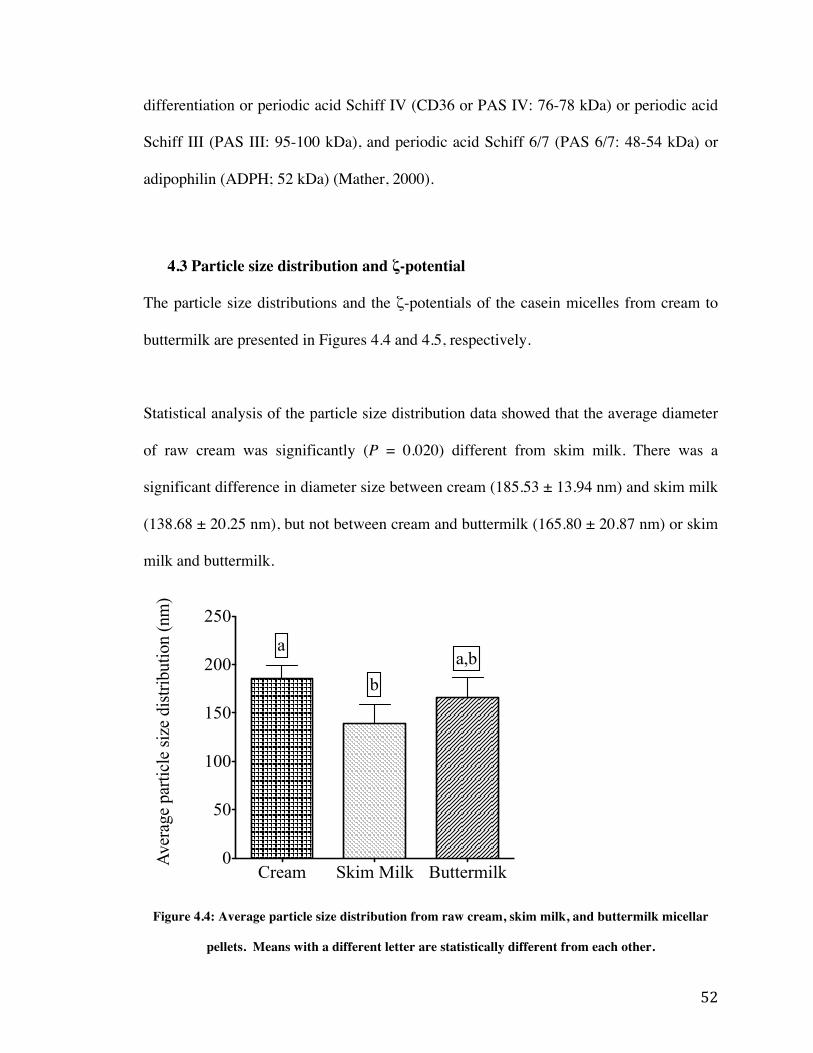
52
differentiation or periodic acid Schiff IV (CD36 or PAS IV: 76-78 kDa) or periodic acid
Schiff III (PAS III: 95-100 kDa), and periodic acid Schiff 6/7 (PAS 6/7: 48-54 kDa) or
adipophilin (ADPH; 52 kDa) (Mather, 2000).
4.3 Particle size distribution and ζ-potential
The particle size distributions and the ζ-potentials of the casein micelles from cream to
buttermilk are presented in Figures 4.4 and 4.5, respectively.
Statistical analysis of the particle size distribution data showed that the average diameter
of raw cream was significantly (P = 0.020) different from skim milk. There was a
significant difference in diameter size between cream (185.53 ± 13.94 nm) and skim milk
(138.68 ± 20.25 nm), but not between cream and buttermilk (165.80 ± 20.87 nm) or skim
milk and buttermilk.
Figure 4.4: Average particle size distribution from raw cream, skim milk, and buttermilk micellar
pellets. Means with a different letter are statistically different from each other.
Cream Skim Milk Buttermilk0
50
100
150
200
250
Ave
rage
par
ticle
size
dis
tribu
tion
(nm
)
a,ba
b

53
Statistical analysis of the ζ-potentials data showed that there were no significant
differences (P = 0.1377) between the samples. ζ-potentials of the casein micelles were
-22.81 ± 3.59 mV, -18.96 ± 1.45 mV, and -20.08 ± 1.29 mV, respectively for cream, skim
milk, buttermilk. Fox et al report that the average ζ-potential of the casein micelle is -20
mV.
Figure 4.5: Average zeta potential of particles from raw cream, skim milk, and buttermilk micellar
pellets. Means with a different letter are statistically different from each other.
4.4 Two-Dimensional Gel Electrophoresis
Two-dimensional gels were run to observe the protein profiles of micellar pellets
obtained from raw cream, skim milk, and buttermilk as shown in Figure 4.6 to 4.9.
Cream Skim Milk Buttermilk
-30
-20
-10
0
Ave
rage
zet
a po
tent
ial (
mV
)
a a
a

54
Figure 4.6: 2D-PAGE gel separation of proteins from micellar pellets isolated from raw cream. The
gel was loaded with approximately 250µg of proteins and was stained with GelCode Blue Stain. The numbers associated with some spots refer to protein numbers in Table 4.1.
Table 4.1: Proteins identified in the micellar pellet isolated from raw cream. Identification was
realized according to Fong et al. (2007) (ID1), Bédard ST-Amand (2009) (ID2) or molecular weight (MW)/isoelectric point (pI).
Spot ID ID1 ID2 Possible match MW (kDa) pI 1-2 BTN or MUC1 BTN 59 or 82 5.3 or 5.1 3 BTN BTN or BSA 59 or 71 5.3 or 5.8 4 Actin β-actin 41 5.3 5 PAS 6/7 40.8 8.2 6 XDH/XO 7 Lactoperoxidase 80.6 8.8 8 Caseins (αS1,
αS2, β, κ) 24 to 25 4.9 to 5.9
9-11 αS2 casein 24.5 8.54 12 PP3 17.1 6.3 13 β-Lactoglobulin 18.3 4.9 14 β-Lactoglobulin β-Lactoglobulin 18.3 4.9 15 β-LG or α-LA 16 α-LA α-LA 14.2 4.5 17 FABP 14.6 6.3 18 FABP FABP 14.6 6.3 19-20 unknown 21-23 PP
11101#cr#
210 kDa!
6.9!
21!
29!
35.8!
56.2!
101!125!
pH 3! pH 10!
cream&
1 2
3
4 5
6
7
8 9 10 11
12
13 14
15 16
17 18
19 20 21
23 22
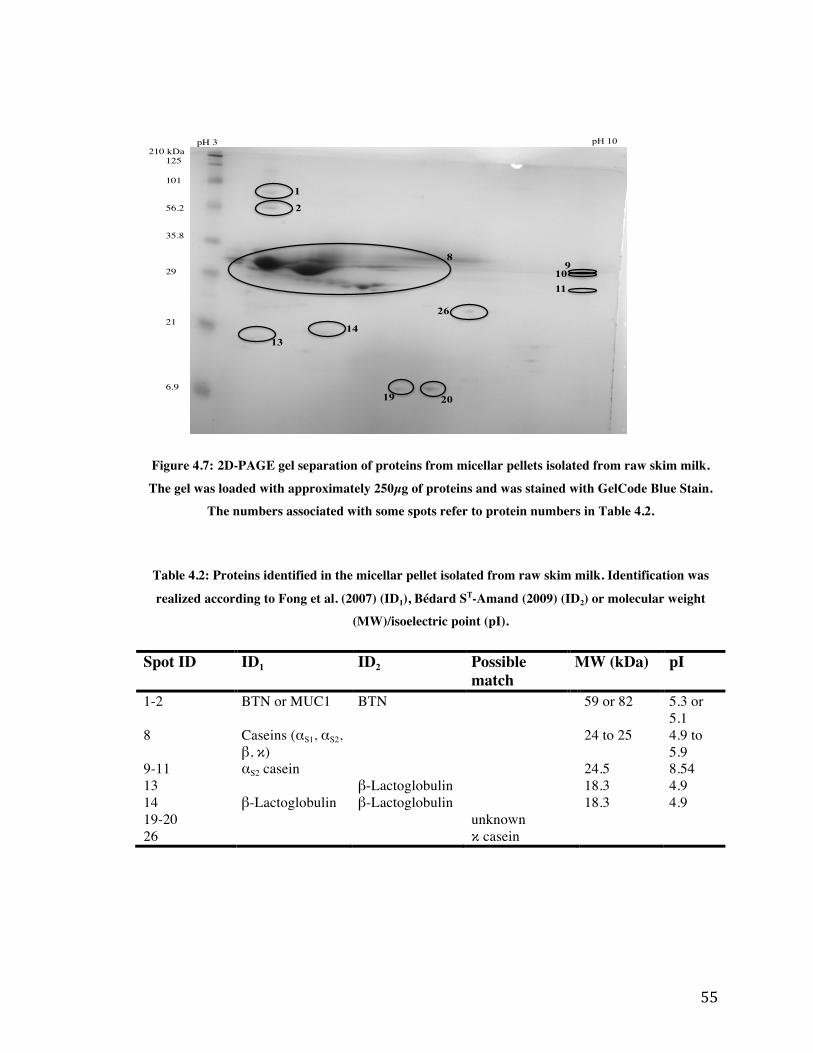
55
Figure 4.7: 2D-PAGE gel separation of proteins from micellar pellets isolated from raw skim milk.
The gel was loaded with approximately 250µg of proteins and was stained with GelCode Blue Stain. The numbers associated with some spots refer to protein numbers in Table 4.2.
Table 4.2: Proteins identified in the micellar pellet isolated from raw skim milk. Identification was
realized according to Fong et al. (2007) (ID1), Bédard ST-Amand (2009) (ID2) or molecular weight (MW)/isoelectric point (pI).
Spot ID ID1 ID2 Possible match
MW (kDa) pI
1-2 BTN or MUC1 BTN 59 or 82 5.3 or 5.1
8 Caseins (αS1, αS2, β, κ)
24 to 25 4.9 to 5.9
9-11 αS2 casein 24.5 8.54 13 β-Lactoglobulin 18.3 4.9 14 β-Lactoglobulin β-Lactoglobulin 18.3 4.9 19-20 unknown 26 κ casein
SK#February#19,#2013#11096#pH 3! pH 10!
210 kDa!
6.9!
21!
29!
35.8!
56.2!
101!
125!
pH 10
SKIM%from%Daniel%(Use%for%Thesis)%
1
2
8 9
10 11
13 14
19 20
26
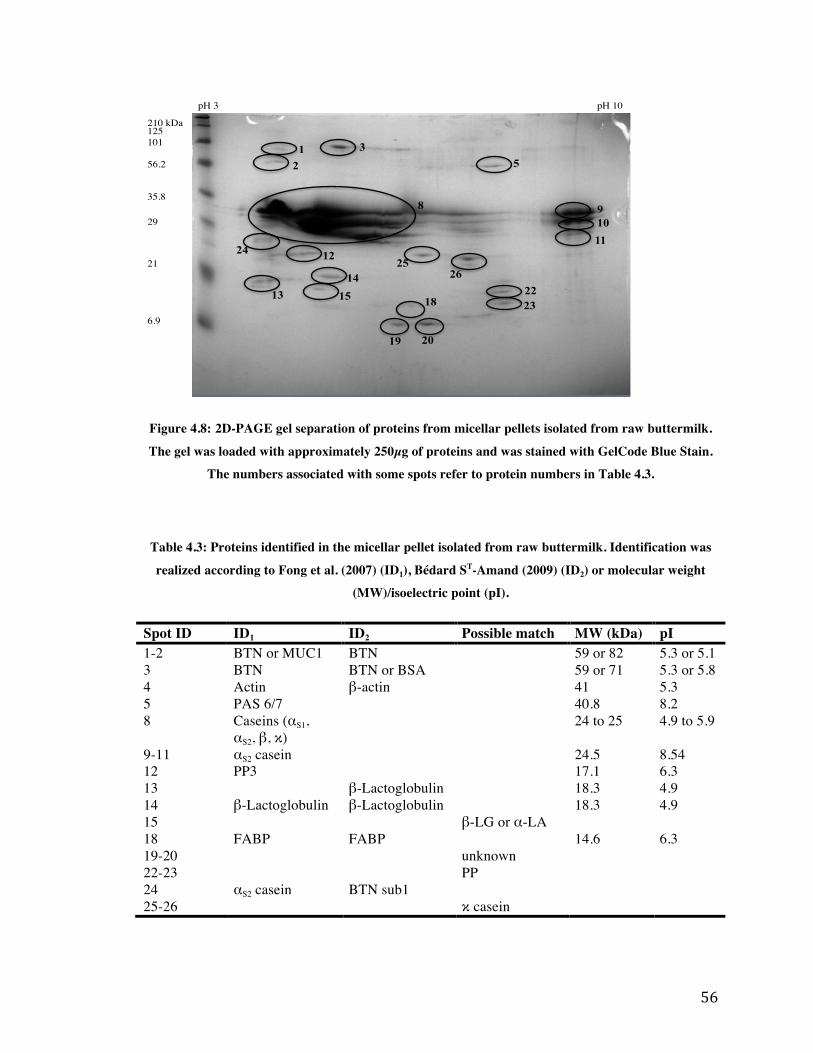
56
Figure 4.8: 2D-PAGE gel separation of proteins from micellar pellets isolated from raw buttermilk.
The gel was loaded with approximately 250µg of proteins and was stained with GelCode Blue Stain. The numbers associated with some spots refer to protein numbers in Table 4.3.
Table 4.3: Proteins identified in the micellar pellet isolated from raw buttermilk. Identification was
realized according to Fong et al. (2007) (ID1), Bédard ST-Amand (2009) (ID2) or molecular weight (MW)/isoelectric point (pI).
Spot ID ID1 ID2 Possible match MW (kDa) pI 1-2 BTN or MUC1 BTN 59 or 82 5.3 or 5.1 3 BTN BTN or BSA 59 or 71 5.3 or 5.8 4 Actin β-actin 41 5.3 5 PAS 6/7 40.8 8.2 8 Caseins (αS1,
αS2, β, κ) 24 to 25 4.9 to 5.9
9-11 αS2 casein 24.5 8.54 12 PP3 17.1 6.3 13 β-Lactoglobulin 18.3 4.9 14 β-Lactoglobulin β-Lactoglobulin 18.3 4.9 15 β-LG or α-LA 18 FABP FABP 14.6 6.3 19-20 unknown 22-23 PP 24 αS2 casein BTN sub1 25-26 κ casein
210 kDa!125!101!
56.2!
35.8!
29!
21!
6.9!
pH 3! pH 10!
BM#February#8,#2013#11102#
1 2
3 5
9 10 11
23 22
20 19
18 15 14
13
12 24 25
26
8
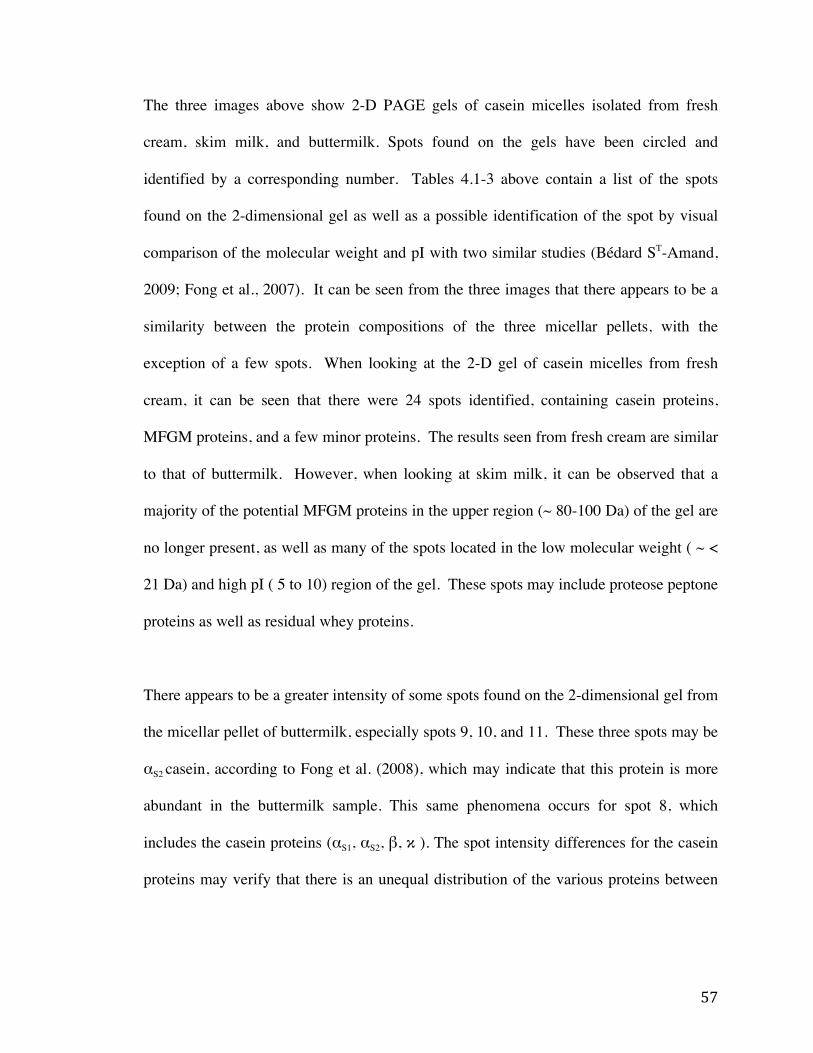
57
The three images above show 2-D PAGE gels of casein micelles isolated from fresh
cream, skim milk, and buttermilk. Spots found on the gels have been circled and
identified by a corresponding number. Tables 4.1-3 above contain a list of the spots
found on the 2-dimensional gel as well as a possible identification of the spot by visual
comparison of the molecular weight and pI with two similar studies (Bédard ST-Amand,
2009; Fong et al., 2007). It can be seen from the three images that there appears to be a
similarity between the protein compositions of the three micellar pellets, with the
exception of a few spots. When looking at the 2-D gel of casein micelles from fresh
cream, it can be seen that there were 24 spots identified, containing casein proteins,
MFGM proteins, and a few minor proteins. The results seen from fresh cream are similar
to that of buttermilk. However, when looking at skim milk, it can be observed that a
majority of the potential MFGM proteins in the upper region (~ 80-100 Da) of the gel are
no longer present, as well as many of the spots located in the low molecular weight ( ~ <
21 Da) and high pI ( 5 to 10) region of the gel. These spots may include proteose peptone
proteins as well as residual whey proteins.
There appears to be a greater intensity of some spots found on the 2-dimensional gel from
the micellar pellet of buttermilk, especially spots 9, 10, and 11. These three spots may be
αS2 casein, according to Fong et al. (2008), which may indicate that this protein is more
abundant in the buttermilk sample. This same phenomena occurs for spot 8, which
includes the casein proteins (αS1, αS2, β, κ ). The spot intensity differences for the casein
proteins may verify that there is an unequal distribution of the various proteins between
58
the three samples. For example, the two-dimensional gel for the micellar pellet of raw
skim milk shows the lesser intensity of the three samples.
Sample preparation involved an extraction with chloroform and methanol, and the
dissolution of proteins into aqueous solution. Therefore, some intrinsic proteins may
have been lost due to their precipitation during the extraction step or their difficulty to get
into solution prior to the isoelectric focusing. Despite these drawbacks, the method was
found to be appropriate for this kind of material; 2-D gels obtained (above, figure 4.6 to
4.8) were mostly free from streaking from residual lipids or salts.

59
Figure 4.9: 2D-PAGE gel separation of proteins from milk-fat-globule membrane isolated from raw
buttermilk. The gel was loaded with approximately 250µg of proteins and was stained with GelCode Blue Stain. The numbers associated with some spots refer to protein numbers in Table 4.4.
Table 4.4: Proteins identified in the milk-fat globule membrane sample isolated from raw buttermilk.
Identification was realized according to Fong et al. (2007) (ID1), Bédard ST-Amand (2009) (ID2) or molecular weight (MW)/isoelectric point (pI).
Spot ID ID1 ID2 Possible match MW (kDa) pI 1 BTN or MUC1 BTN 59 or 82 5.3 or 5.1 3 BTN BTN or BSA 59 or 71 5.3 or 5.8 5 PAS 6/7 40.8 8.2 8 Caseins (αS1,
αS2, β, κ) 24 to 25 4.9 to 5.9
19-20 unknown
MFGM proteins were isolated from the buttermilk micellar pellets in order better identify
their presence after churning with two-dimensional gel electrophoresis. When looking at
Figure 4.9, it can be seen that mostly all casein proteins have been removed successfully
(spot 8), with minimal residual protein left. Also, it can be observed in the upper region
of the gel (i.e spots 1 and 3) that there remain MFGM proteins that were previously seen
pH 3! pH 10!210 kDa!
6.9!
21!
29!
35.8!
56.2!
101!
125!
Bu#ermilk*from*MFGM*protocol*June*2013*
3
5
19 20
8
1
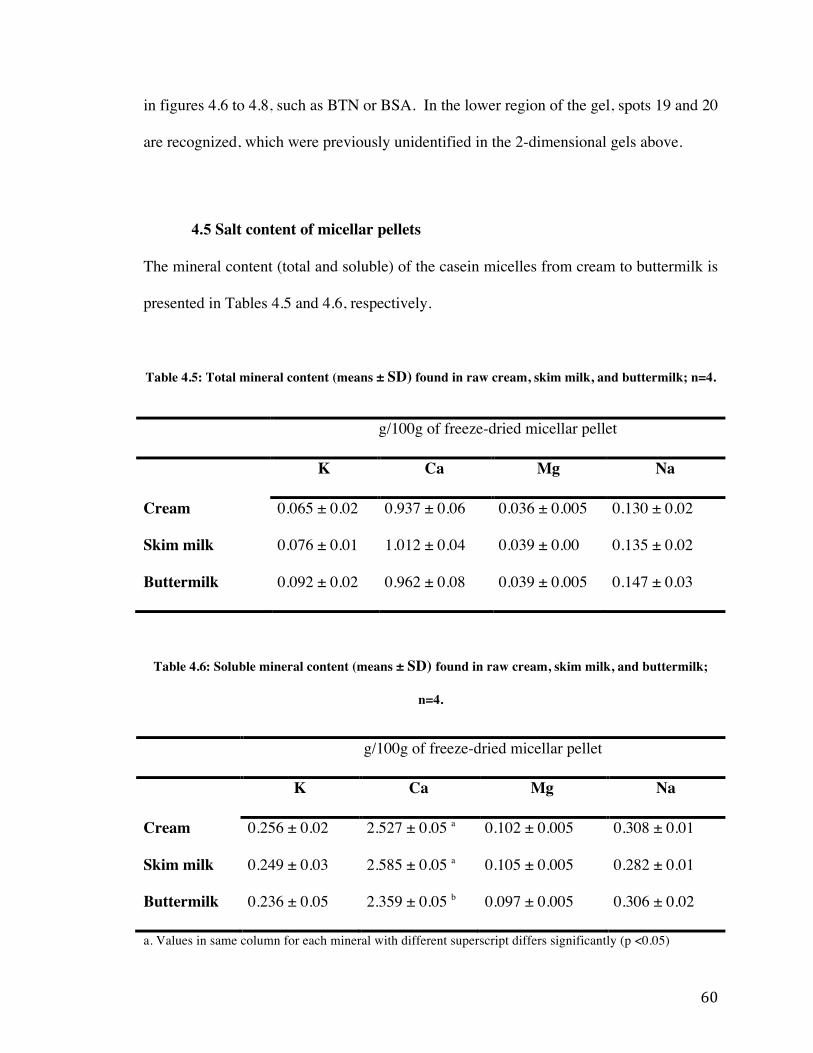
60
in figures 4.6 to 4.8, such as BTN or BSA. In the lower region of the gel, spots 19 and 20
are recognized, which were previously unidentified in the 2-dimensional gels above.
4.5 Salt content of micellar pellets
The mineral content (total and soluble) of the casein micelles from cream to buttermilk is
presented in Tables 4.5 and 4.6, respectively.
Table 4.5: Total mineral content (means ± SD) found in raw cream, skim milk, and buttermilk; n=4.
g/100g of freeze-dried micellar pellet
K Ca Mg Na
Cream 0.065 ± 0.02 0.937 ± 0.06 0.036 ± 0.005 0.130 ± 0.02
Skim milk 0.076 ± 0.01 1.012 ± 0.04 0.039 ± 0.00 0.135 ± 0.02
Buttermilk 0.092 ± 0.02 0.962 ± 0.08 0.039 ± 0.005 0.147 ± 0.03
Table 4.6: Soluble mineral content (means ± SD) found in raw cream, skim milk, and buttermilk;
n=4.
g/100g of freeze-dried micellar pellet
K Ca Mg Na
Cream 0.256 ± 0.02 2.527 ± 0.05 a 0.102 ± 0.005 0.308 ± 0.01
Skim milk 0.249 ± 0.03 2.585 ± 0.05 a 0.105 ± 0.005 0.282 ± 0.01
Buttermilk 0.236 ± 0.05 2.359 ± 0.05 b 0.097 ± 0.005 0.306 ± 0.02
a. Values in same column for each mineral with different superscript differs significantly (p <0.05)
61
Statistical analysis of data showed that soluble calcium of buttermilk micellar pellets was
statistically different (P = 0.0001) from cream and skim milk. There was a significant
difference between the content of soluble calcium in the micellar pellet of buttermilk
(2.359 ± 0.05 g/100 g of freeze-dried micellar pellet) and the soluble calcium content in
cream and skim milk micellar pellet (2.527 ± 0.05 and 2.585 ± 0.05 g/100 g of freeze-
dried micellar pellet, respectively)
4.6 Phosphorus
The phosphorus content of the micellar pellets was determined in order to identify
possible interactions between casein micelles and phospholipids due to processing. The
phosphorus content of the casein micelles from cream to buttermilk is presented in Table
4.7.
There are two types of phosphorus measured: one in which is involved in the casein
micelle structure through the colloidal calcium phosphate bonds (CCP), identified as
casein bound phosphorus. The other type observed is involved in the structure of
phospholipids, which includes the three sub-categories below: Total inorganic
phosphorus; soluble+colloidal, esterified; and soluble+colloidal. Statistical analysis of
data showed that the soluble+colloidal phosphorus content of the micellar pellet of
buttermilk was almost significantly different from cream and skim milk (P = 0.058).
There was no significant difference for casein bound phosphorus of the micellar pellets
measured (P>0.05).
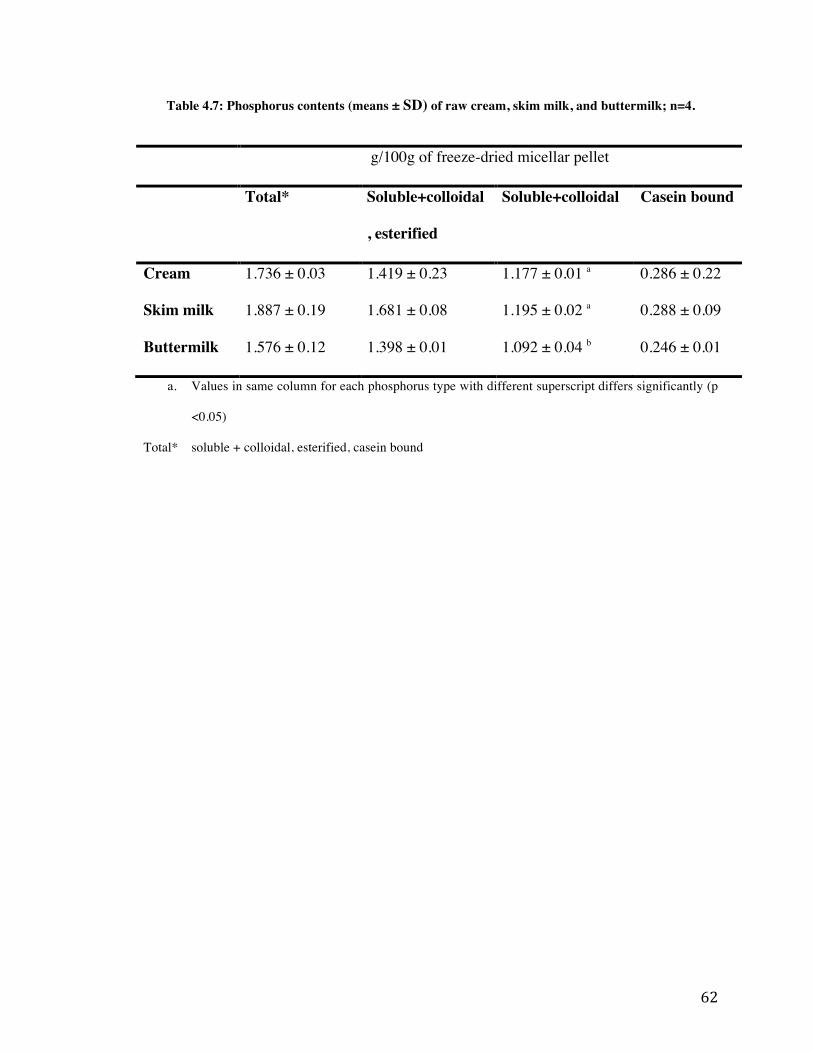
62
Table 4.7: Phosphorus contents (means ± SD) of raw cream, skim milk, and buttermilk; n=4.
g/100g of freeze-dried micellar pellet
Total*
Soluble+colloidal
, esterified
Soluble+colloidal Casein bound
Cream 1.736 ± 0.03 1.419 ± 0.23 1.177 ± 0.01 a 0.286 ± 0.22
Skim milk 1.887 ± 0.19 1.681 ± 0.08 1.195 ± 0.02 a 0.288 ± 0.09
Buttermilk 1.576 ± 0.12 1.398 ± 0.01 1.092 ± 0.04 b 0.246 ± 0.01
a. Values in same column for each phosphorus type with different superscript differs significantly (p
<0.05)
Total* soluble + colloidal, esterified, casein bound

63
5. GENERAL DISCUSSION With a composition similar to skim milk, buttermilk has a strong potential of protein
recovery usable in the manufacture of food formulation and more specifically, in the
cheese industry. Buttermilk represents an appealing source of casein to fortify cheese
milk because of its relatively low value and the presence of phospholipids in buttermilk
that can help improve the texture of low fat cheeses (Turcot et al., 2001). However, as
presented in the literature review, there are some changes that occur to the casein
micelles that limit its industrial potential.
The first objective of the study was to find a method to isolate the casein micelle from
raw cream, skim milk, and buttermilk, while preserving the native form of the micelle as
much as possible. There have been many protocols that have been proposed, and one
was chosen in order to fit the needs of the present work. The method used by Corredig
and Dalgleish (1996b) was followed because the buffer used allowed to stabilize the
micellar material and to observe it in its native state while washing away any
uncomplexed whey proteins from the micellar pellet. The one-dimensional gels showed
that a majority of the caseins were recovered in the micellar pellet. According to
(Dalgleish and Corredig, 2012), 80% of the casein proteins are present in the micellar
form. This fact could explain the loss of casein proteins during the first
ultracentrifugation of the isolation protocol. The choice of buffer was maintained
throughout the experiment due to successful isolation. In consequence, the micellar
pellets could be used to understand the effect of the butter-making process on the casein
micelle physiochemical properties.
64
Physical properties of the casein micelle were measured in order to determine the impact
of skimming and churning on the size distribution and zeta potential. The particles in the
buttermilk or cream micellar pellets were composed of two different species with two
different size ranges (peaks). Most of the particles were present in the peak corresponding
to the smallest average diameters (140 to 200 nm) and were consistent to the average size
of casein micelles (Fox and McSweeney, 2003). Small proportions (<1%) of large
particles (≥ 4,000 nm) formed a second peak in both cream and buttermilk samples,
which corresponded to residual fat from centrifugation of cream and buttermilk (Fox and
McSweeney, 2003).
Overall, it can be seen that skimming and churning did not modify the size of the
particles and the zeta potential of the casein micelles. It is of interest to note that the zeta
potential did slightly increase for the buttermilk sample when compared to cream. The
most probable reason why the zeta potential increased is due a contamination on the
surface of the casein micelle though the attachment of other proteins. The modification of
the physical properties of the casein micelles after skimming or churning could be due to
changes in the protein or salt distribution.
Calcium content was measured in order to determine if the effect of physical properties of
the micelle was due to changes in the salt distribution. Results showed a significantly
lower amount of soluble Calcium in the micellar pellet of buttermilk when compared to
cream or skim milk samples. Calcium is important in the overall structure of the

65
colloidal calcium phosphate of the casein micelle, which then allows it to play an
interesting role in the rheological properties of milk. These results are comparable to the
work done by Bédard ST-Amand (2009), in which it was observed that the soluble salt
content of buttermilk is decreased after HTST pasteurization, indicating the poor
coagulation properties. O'Connel and Fox (2000) have reported that the lower amount of
calcium in buttermilk was relatively responsible for the longer rennet coagulation time, as
compared to skim milk. However, because soluble Calcium was found to be the only
significant salt constituent in buttermilk, it is known that the size difference found was
not due to the structural bonds of the micelle.
Similarly, the phosphorus content of the micellar pellet was measured to observe if the
phospholipid content was changed during the skimming or churning process. One of the
hypotheses in the current work was that churning of cream promotes an interaction
between the micelle and phospholipids. For soluble+colloidal phosphorus, it is likely
that the colloidal phosphorus is associated with the casein bound phosphorus, and the
soluble phosphorus is that which is able to be in solution. Because there is no significant
difference for casein bound phosphorus, it is likely that there is not a difference in the
phospholipid content of the micellar pellet obtained from buttermilk versus cream or
skim milk. It appears from the results that there are less phospholipids found in the
micellar pellet of buttermilk, but in the same proportion bound as found in the cream
before churning. The interactions that may have occurred can be better known by
observing the composition of the micellar pellet with two-dimensional gel
electrophoresis.
66
Two-dimensional gels allowed for a better identification of the protein composition in the
micellar pellet after mechanical treatment was applied. It was found that there were some
residual MFGM proteins present in the buttermilk sample in both the one and two-
dimensional gels. This could be explained by the fact that during the churning process of
cream, the fat globules are broken down and MFGM proteins are released.
Some minor proteins were present in the 2-dimensional gel of the buttermilk sample,
which may indicate possible interactions that occurred after the skimming and before the
end of the churning process. These proteins were not identified with certainty, but it is
suspected that they may be κ-casein and/or FABP due to their molecular weight and
isoelectric point. It has been hypothesized that during the churning process of cream, the
inner membrane of the fat globules are exposed to milk serum, which may induce
possible interactions or dislocation of the MFGM (Morin et al., 2007). It is known from
literature that there are hydrophobic interactions that occur between the casein micelle
and MFGM proteins (Morin, 2006). Interactions with these minor proteins appeared to
be strong, as they were able to withstand the ultracentrifugation and washing steps of the
isolation of the micellar pellet. The experiments done by Bédard ST-Amand (2009)
yielded stronger significance because the changes that occurred were during the
pasteurization process. However, it was found in the current results that mechanical
forces also impact the constituents of the micelle. The most noted change is the
appearance of proteins in the micellar pellet of buttermilk. It is more likely that churning
released some Butyrophilin (spot 24), proteose peptone (spot 22-23), and even some κ-
67
casein because they were not present in the micellar pellet of cream. On the other hand,
Izmiroglu (2010) concluded that the MFGM proteins (specially BTN) were more
abundant in the micellar pellet of buttermilk after a heat treatment. Unfortunately, the
results from Izmiroglu do not permit to distinguish if this phenomenon is due to the
heating alone or the combination of heating and churning.
Moreover, caseins were present in the MFGM isolate material suggesting strong
interactions between both. Bédard ST-Amand (2009) showed that interactions between
MFGM proteins and whey proteins or caseins became more important as a function of the
heating temperature.
Overall, results of the current work showed that the modifications of the casein
micelle are not solely attributed to the pasteurization of cream or skim milk, but also to
the physical treatment applied during the processing steps of cheese or butter (such as
churning or skimming). The remaining challenge is to find which form of treatment,
either heat or physical, attributes to the most important changes of the micelle. With this
information, more will be known about ways in which to better use the casein micelle
from buttermilk.

68
6. GENERAL CONCLUSIONS The goal of the work presented in this thesis was to characterize the changes of physical
treatment on the composition and physiochemical properties of casein micelles from
cream to buttermilk. The general hypothesis of this thesis was that casein micelles
separated from buttermilk reveal differences in composition resulting from interactions
with MFGM components and minor lipids.
The work carried out allowed us to validate our hypothesis. Skimming and churning
modified both the structure and properties of the casein micelle from buttermilk, such as
a smaller size and decrease in soluble Calcium. Finally, results showed the presence of
possible interactions with between micellar proteins and MFGM components.
To our knowledge, the work presented in this thesis will be the first investigation of the
effect of physical treatment on the casein micelle recovered from buttermilk. Many
conclusions have been made about the changes occurring due to pasteurization of the
milk. It is, however, likely that some of the changes are occurring due to physical
treatment as well.
The results presented in this thesis are expected to have an impact in various facets of the
dairy industry. A better understanding of the changes that occur to the casein micelle
during butter making allow us to learn more about how to improve the potential of
buttermilk for food formulation.
69
However, it appears to be difficult to minimize the changes that occur, particularly
because of the industry-wide standards for pasteurization and churning methods. More
can be done on a pilot scale in order to determine if there is a speed or temperature point
at which these interactions and physical changes can be reduced. Moreover, further
investigating of structural changes with confocal microscopy may provide insight into the
way in which physical treatment of milk alters the overall structure of the casein micelle.
Investigating changes in rheological properties may also be of interest in the dairy
industry because it will lead to a better understanding of the cheese-making properties of
buttermilk.
70
7. REFERENCES
Allen, R.J.L., (1940). The Estimation of Phosphorus. Biochemical Journal 34(6), 858-
865.
Anema, S.G., Li, Y., (2003). Association of denatured whey proteins with casein
micellesin heated reconstituted skim milk and its effect on casein micelle size. Journal of
Dairy Research 70(73-83).
Appel, K.C., Keenan, T.W., Low, P.S., (1982). Differential scanning calorimetry of milk
fat globule membranes. Biochimica et Biophysica Acta 690, 243-250.
Barratt, M.D., Austin, J.P., Whitehurst, R.J., (1974). The influence of the alkyl chain
length of Lecithins and Lysolecithins on their interaction with αs1-casein. Biochimica et
Biophysica Acta 34, 126-135.
Bédard ST-Amand, J., (2009). Effet de la pasteurisation haute du babeurre sur sa
composition minérale et celle des constituants protéiques des fragments de la membrane
du globule gras du lait, Department of Food Science and Nutrition Université Laval,
Quebec City, p. 119.
Boudreau, A., St-Amant, L., (1984). Beurre. Sciences et technologie du lait , 213-240.
71
Brisson, G., Payken, H.K., Sharoe, J.P., Jiménez-Flores, R., (2010). Characterization of
Lactobacillus reuteri interaction with milk fat globule membrane components in dairy
products. Journal of Agricultural and Food Chemistry 58(9), 5612-5619.
Britten, M., Pouliot, Y., (2002). Rôles fonctionnels du calcium en industrie laitière,
Résumé de cours-séminaire, Agriculture et Agroalimentaire Canada.
Brooks, I.B., Luster, G.A., Easterly, D.B., (1970). A procedure for the rapid
determination of the major cations in milk by atomic absorption spectrophotometry.
Atomic Absorption Newsletter 9, 93.
Brulé, G., Lenoir, J., Remeuf, F., (1997). La micelle de caséine et la coagulation du lait
(3 ed). Tec doc.
Bylung, G., (1995). Dairy processing handbook. Tetra Pak Processing Systems AB.
Cheng, S.G., Koch, U., Brunner, J.R., (1988). Characteristics of putrified cows ' milk
Xanthine oxydase and its submolecular characteristics. Journal of Dairy Science 71(4),
901-916.
Corredig, M., Dalgleish, D.G., (1996a). Effect of different heat treatment on the strong
binding interactions between whey proteins and milk fat globules in whole milk. Journal
of Dairy Research 63, 441-449.
72
Corredig, M., Dalgleish, D.G., (1996b). Effect of temperature and pH on the interactions
of whey proteins with casein micelles in skim milk. Food Research International 29(1),
49-55.
Corredig, M., Dalgleish, D.G., (1997). Isolates from industrial buttermilk: Emulsifying
properties of materials derived from the milk fat globule membrane. Journal of
Agricultural and Food Chemistry 45, 4595-4600.
Costa, M.R., Elias-Argote, X.E., Jiménez-Flores, R., Gigante, M.L., (2010). Use of
ultrafiltration and supercritical fluid extraction to obtain a whey buttermilk powder
enriched in milk fat globule membrane phospholipids. International Dairy Journal 20,
598-602.
Dalgleish, D.G., Corredig, M., (2012). The structure of the casein micelle of milk and its
changes during processing. The Annual Review of Food Science and Technology 3, 449-
467.
Danthine, S., Blecker, C., Paquot, M., Innocente, N., Deroanne, C., (2000). Progress in
milk fat globule membrane research: A review. Lait 80, 209-222.
Dapper, C.H., Valivullah, H.M., Keenan, T.W., (1987). Use of polar aprotic-solvents to
release membranes from milk lipid globules. Journal of Dairy Science 70(4), 760-765.
73
Darling, D.F., Dickson, J., (1979). The determination of the ζ-potential of casein
micelles. Journal of Dairy Research 46, 329.
Dewettinck, K., Rombaut, R., Thienpont, N., Le, T.T., Messens, K., Van Camp, J.,
(2008). Nutritional and technological aspects of milk fat globule membrane material.
International Dairy Journal 18, 436-457.
Donato, L., Guyomarc'h, F., (2009). Formation and properties of the whey protein/K-
casein complexes in heated skim milk -A review. Dairy Science and Technology 89, 3-
29.
Donato, L., Guyomarc'h, F., Amiot, S., Dalgleish, D.G., (2007). Formation of whey
protein-k-casein complexes in heated milk : Preferential reaction of whey protein with k-
casein in the casein micelles. International Dairy Journal 17, 1161-1167.
Dufourcq, J., Faucon, J.F., (1977). Intrinsic fluorescence study of lipid-protein
interactions in membrane models. Binding of melittion, an amphipathic peptide, to
phospholipid vesicles. Biochimica et Biophysica Acta 467, 1-11.
FAO, (2013). World milk production, http://www.dairyco.org.uk/market-
information/supply-production/milk-production/world-milk-production/ -
.UonlJ6WKT88.
74
Fong, B.Y., Norris, C.S., MacGibbon, A.K.H., (2007). Protein and lipid composition of
bovine milk gat globule membrane. International Dairy Journal 17, 275-288.
Fong, B.Y., Norris, C.S., Palmano, K.P., (2008). Fractionation of bovine whey proteins
and characterisation by proteomic tecniques. International Dairy Journal 18(1), 23-46.
Fortunato, D., Giuffrida, M.G., Cavaletto, M., Garoffo, L.P., Dellavalle, G., Napolitano,
L., Giunta, C., Fabris, C., Bertino, E., Coscia, A., Conti, A., (2003). Structural proteome
of human colostral fat globule membrane proteins. Proteomics 3, 897-905.
Fox, P.F., McSweeney, P.L.H., (2003). Advances in dairy chemistry - Proteins. Kluwer
Academic/Plenum Publisher, New York.
Gallier, S., Gordon, K.C., Jiménez-Flores, R., Everett, D.W., (2011). Composition of
bovine milk fat globules by confocal Raman microscopy. International Dairy Journal
21(6), 402-412.
Gallier, S., Gragson, D., Cabral, C., Jiménez-Flores, R., Everett, D.W., (2010).
Composition and fatty acid distribution of bovine milk phospholipids from processed
milk products. Journal of Agricultural and Food Chemistry 58, 10503-10511.
Gaucheron, F., Le Graët, Y., Schuck, P., (2004). Equilibres minéraux et conditions
physicochimiques. Edition Tec & Doc, Lavoisier, Paris, France.
75
Gezimati, J., Singh, H., Creamer, L.K., (1996). Heat-induced interactions and gelation of
mixtures of bovine β-lactoglobulin and serum albumin. Journal of Agricultural and Food
Chemistry 44, 804-810.
Goff, H.D., Hill, A.R., (1993). Chemistry and physics. VCH Publishers, New York, NY.
Goudedranche, H., Fauquant, J., Maubois, J.L., (2000). Fractionation of globular milk fat
by membrane microfiltration. Lait 80(1), 93-98.
Havea, P., Singh, H., Creamer, L.K., (2000). Formation of new protein structures in
heated mixtures of BSA and α-lactalbumin. Journal of Agricultural and Food Chemistry
48, 1548-1556.
Heid, H.S., Schnölzer, M., Keenan, T.W., (1996). Adipocyte differentiation-related
protein is secreted into milk as a constituent of milk lipid globule membrane.
Biochemistry Journal 320, 1025-1030.
Holt, C., Horne, D.S., (1996). The hairy casein micelle: evolution of the concept and its
implication for dairy technology. Netherlands Milk and Dairy Journal 50, 85-111.
Horne, D.S., (2006). Casein micelle structure: Models and muddles. Current Opinion in
Colloid & Interface Science 11, 148-153.
76
Houlihan, A.V., Goddard, P.A., Nottingham, S.M., Kitchen, B.J., Masters, C.J., (1992).
Interactions between the bovine milk fat globule membrane and skim milk components
on heating whole milk. Journal of Dairy Research 59, 187-195.
Hvarregaard, J., Andersen, M.K., Berglund, L., Rasmussen, J.T., Petersen, T.E., (1996).
Characterization of glycoprotein PAS-6/7 from membranes of bovine milk fat globules.
European Journal of Biochemistry 240, 628-636.
IDF, (2002). Determination of nitrogen content routine method using combustion
according to the Dumas principle. IDF 186 Brussels(Belgium).
IDF, (2008). Skim milk, whey and buttermilk. Determination of fat content - Gravimetric
method (Reference method). International Dairy Federation, Brussels, Belgium Standard
22.
Izmiroglu, S., (2010). Effet de la pasteurisation sur les interactions entre les protéines de
la membrane de globule de gras laitier et les micelles de caséine du babeurre. Université
Laval, Quebec City.
Kanno, C.M., Kim, D.H., (1990). A simple procedure for the ppreparation of bovine-milk
fat globule membrane and a comparison of its composition, enzymatic-activities, and
77
electrophoretic properties with those prepared by other methods. Agricultural and
Biological Chemistry 54, 2845-2854.
Keenan, T.W., Dylewski, D.P., (1995). Intracellular origin of milk lipid globules and the
nature of structure of milk fat globule membrane, in: Fox, P.F. (Ed.), Advanced dairy
chemistry Lipids, vol. 2. Chapman & Hall, London.
Keenan, T.W., Mather, I.H., (2006). Intracellular origin of milk fat globules and the
nature of the milk fat globule membrane, in: Birkhäuser (Ed.), Advanced Dairy
Chemistry: Lipids. P.F.Fox, P.L.H. McSweeney, pp. 137-170.
Laemmli, U.K., (1970). Cleavage of structural proteins during the assembly of the head
of bacteriophage T4. Nature 227(5259), 680-685.
Livney, Y.D., Dalgleish, D.G., (2004). Specificity of disulfide bond formation during
thermal aggregation in solution of beta-lactoglobulin B and kappa-casein A. Journal of
Agricultural and Food Chemistry 52, 5527-5532.
Lopez, C., (2007). The composition, supramolecular organisation and thermal properties
of milk fat: a new challenge for the quality of food products. Lait 87, 317-336.
Lopez, C., Briard-Bion, V., Menard, O., Rousseau, F., Pradel, P., Besle, J.M., (2008).
Phospholipids, sphingolipid, and fatty acid compositions of the milk fat globule
78
membrane are modified by diet. Journal of Agricultural and Food Chemistry 56(13),
5226-5236.
Ma, Y., Barbano, D.M., (2000). Gravity separation of raw bovine milk: Fat globule size
distribution and fat content of milk fractions. Journal of Dairy Science 83, 1719-1727.
Malvern Instrument SA, (2009). Zetasizer nano user manual, in:
http://malvern.com/en/support/resource-center/user-manuals/MAN0485EN.aspx (Ed.).
Mather, I.H., (2000). A review and proposed nimenclature for major proteins of the milk-
fat globule membrane. Journal of Dairy Science 83, 203-247.
McMahon, D.J., Brown, R.J., (1984). Composition, structure, and integrity of casein
micelles: A review. Journal of Dairy Science 67(3), 499-512.
McPherson, A.V., Kitchen, B.J., (1983). Review of the progress of dairy science: the
bovine milk fat globule membrane- its formation and secretion of fat globules and origin
of MFGM. Journal of Dairy Research 50, 107-133.
Mistry, V.V., Metzger, L.E., Maubois, J.l., (1996). Use of Ultrafiltered sweet buttermilk
in the manufacture of reduced fat cheddar cheese. Journal of Dairy Science 79, 1137-
1145.
79
Morin, P., (2006). On the fractionation of buttermilk by microfiltration membranes,
Department of Food Science and Nutrition Université Laval, Quebec City, p. 155.
Morin, P., Jiménez-Flores, R., Pouliot, Y., (2007). Effect of processing on the
composition and microstructure of butermilk and its milk fat globule membranes.
International Dairy Journal 17, 1179-1187.
Mulder, H., Walstra, P., (1974). The milk fat globule emulsion science as applied to milk
products and comparable foods. PUDOC, Wageningen, The Netherlands.
Needs, E.C., Capellas, M., Bland, A.P., Manoj, P., Macdougal, D., Paul, G., (2000).
Comparison of heat and pressure treatments of skim milk, fortified with whey protein
concentrate, for set yogurt preparation: effects on milk proteins and gel structure. Journal
of Dairy Research 67, 329-348.
O'Connel, J.E., Fox, P.F., (2000). Heat stability of Buttermilk. Journal of Dairy Science
83, 1728-1732.
O'Mahony, F., (1988). Rural dairy technology - Experiences in Ethiopia, in: Africa,
D.T.U.-I.L.C.f. (Ed.),
http://www.ilri.org/InfoServ/Webpub/fulldocs/ilca_manual4/Toc.htm - TopOfPage. P.O.
Box 5689, Addis Ababa, Ethiopia.
80
Ong, R.L., Marchesi, V.T., Prestegard, J.H., (1981). Small unilamellar vesicles
containing Glycophorin A. Chemical characterization and proton nuclear magnetic
resonance studies. Biochemistry 20(15), 4283-4292.
Pallesen, L.T., Andersen, M.H., Nielsen, R.L., Berglund, L., Petersen, T.E., Rasmussen,
L.K., Rasmussen, J.T., (2001). Purification of MUC1 from bovine milk-fat globules and
characterization of a corresponding full-length cDNA clone. Journal of Dairy Science 84,
2591-2598.
Patton, S., Keenan, T.W., (1975). Milk-fat globule membrane. Biochemica et Biophysica
Acta 415(3), 273-309.
Pierre, A., Brule, G., (1981). Mineral and protein equilibria between the colloidal and
soluble phases of milk at low-temperature. Journal of Dairy Research 48(3), 417-428.
Ramachandra Rao, H.G., Lewi, M.J., Grandison, A.S., (1995). Effect of pH on flux
during ultrafiltration of sweet whey and buttermilk. Journal of Dairy Research 62, 441-
449.
Saffon, M., (2013). Development of a new dairy ingredient for the utilization of
buttermilk constituents, Department of Food Science and Technology. Laval University,
Quebec City.
81
Sawyer, W.H., (1968). Heat denaturation of bovine beta lactoglobulins and relevance of
disulfide aggregation. Journal of Dairy Science 51(3), 323-329.
Sawyer, W.H., Coulter, S.T., Jenness, R., (1963). Role of sulfhydryl groups in the
interaction ok kappa- casein and beta- lactoglobulin. Journal of Dairy Science 46(6), 564-
565.
Schmidt, D., (1980). Colloidal aspects of casein. Netherlands milk ans dairy journal
34(1), 42-64.
Schokker, E.P., Singh, H., Pinder, D.N., Norris, G.E., Creamer, L.K., (1999).
Characterization of intermediates formed during heat-induced aggregation of beta-
lactoglobulin AB at neutral pH. International Dairy Journal 9, 791-800.
Singh, H., (2006). The milk fat globule membrane - A biophysical system for food
applications. Current Opinion in Colloid & Interface Science 11, 154-163.
Smits, P., van Brouwershaven, J.H., (1980). Heat-induced association of beta-
lactoglobulin and casein micelles. Journal of Dairy Research 47, 313-325.
Sodini, I., Morin, P., Olabi, A., Jiménez-Flores, R., (2006). Compositional and Functional
Properties of Buttermilk : A comparison between sweet, sour, and whey buttermilk.
Journal of Dairy Science 89, 525-536.

82
Spitsberg, V.L., (2005). Invited Review: Bovine milk fat globule membrane as a potential
nutraceutical. Journal of Dairy Science 88(7), 2289-2294.
Stammers, M., Rowen, L., Rhodes, D., Trowsdale, J., Beck, S., (2000). BTL-II: a
polymorphic locus with homology to the butyrophilin gene family, located at the border
of the major histocompatibility complex class II and class III regions in human and
mouse. Immunogenetics 51(373-382).
Swaisgood, H.E., (2003). Chemistry of the caseins, Advanced Dairy Chemistry 1:
Proteins. Kluver Academic/Plenum Press, New York, N.Y., USA.
Thompson, A., Boland, M., Singh, H., (2009). Milk proteins: from expression to food.
Elsevier, Amsterdam.
Turcot, S., St.Gelais, D., Turgeon, S.L., (2002). Affinage de fromages allégés de type
Cheddar fabriqués à partir de laits enrichis en phospholipides. Lait 82, 209-223.
Turcot, S., Turgeon, S.L., St.Gelais, D., (2001). Effet de la concentration en
phospholipides de babeurre dans le lait de fromagerie sur la production et la composition
de fromages allégés de type Cheddar. Le lait 81, 429-442.
USDA, (2013). Dairy Products - 2012 Summary, National Agriculture Statistics Service.

83
Vanderghem, C., Bodson, P., Danthine, S., Paquot, M., Deroanne, C., Blecker, C.,
(2010). Milk fat globule membrane and buttermilks: from composition to valorization.
Biotechnology, Agronomy, Society and Environment 14(3), 485-500.
Vasbinder, A.J., Alting, A.C., De Kruif, K.G., (2003). Quantification of heat-induced
casein-whey protein interactions in milk and its relation to gelation kinetics. Colloids and
Surfaces B: Biointeraces(31), 115-123.
Walstra, P., Geurts, T.J., Noomen, A., Jellema, A., van Boekel, M.A.J.S., (1999). Dairy
technology - Principles of milk properties and processes. Marcel Dekker AG, New York,
NY.
Walstra, P., Wouters, J.T.M., Geurts, T.J., (2006). Dairy Science and Technology
Handbook Second Edition.
Wang, W., Nema, S., Teagarden, D., (2010). Protein aggregation - Pathways and
influencing factors. International Journal of Pharmaceutics 390, 89-99.
Ye, A., Anema, S.G., Singh, H., (2004a). High-pressure-induced interactions between
milk fat globule membrane proteins and skim milk proteins in whole milk. Journal of
Dairy Science 87, 4013-4022.

84
Ye, A., Singh, H., Oldfield, D.J., Anema, S., (2004b). Kinetics of heat-induced
association of β-lactoglobulin and α-lactalbumin with milk fat globule membrane in
whole milk. International Dairy Journal 14, 389-398.
Ye, A., Singh, H., Taylor, M.J., Anema, S., (2002). Characterization of protein
components of natural and heat-treated milk fat globule membranes. International Dairy
Journal 12, 393-402.
Ye, A., Singh, H., Taylor, M.W., Anema, S., (2004c). Interactions of whey proteins with
milk fat globule membrane proteins during heat treatment of whole milk. Lait 84, 269-
283.
Zheng, H., Jiménez-Flores, R., Everett, D.W. (2013). Centrifugal washing processes
reveal lipid organization of bovine milk fat globule membrane (MFGM) ADSA,
Indianapolis, IN.
Recommended