Chemical simulation of greywaterAbeda, SH and Scholz, M
http://dx.doi.org/10.1080/09593330.2015.1123301
Title Chemical simulation of greywater
Authors Abeda, SH and Scholz, M
Type Article
URL This version is available at: http://usir.salford.ac.uk/39272/
Published Date 2016
USIR is a digital collection of the research output of the University of Salford. Where copyright permits, full text material held in the repository is made freely available online and can be read, downloaded and copied for noncommercial private study or research purposes. Please check the manuscript for any further copyright restrictions.
For more information, including our policy and submission procedure, pleasecontact the Repository Team at: [email protected].

For Peer Review O
nly
Chemical simulation of greywater
Journal: Environmental Technology
Manuscript ID TENT-TENT-2015-1182.R1
Manuscript Type: Original Article
Date Submitted by the Author: n/a
Complete List of Authors: Abed, Suhail; The University of Salford, Scholz, Miklas ; The University of Salford,
Keywords: Sustainability, Ecosystem, Greywater, Synthetic greywater, Contamination
URL: http:/mc.manuscriptcentral.com/tent
Environmental Technology

For Peer Review O
nly
1
Chemical simulation of greywater
Suhail Najem Abed, Miklas Scholz*
Civil Engineering Research Group, School of Computing, Science and Engineering, The
University of Salford, Newton Building, Salford M5 4WT, England, United Kingdom.
* Corresponding author. Tel.: +44 161 2955921; fax: +44 161 2955575. Email:
[email protected] (Miklas Scholz).
Email: [email protected] (Suhail N. Abed).
Page 1 of 50
URL: http:/mc.manuscriptcentral.com/tent
Environmental Technology
123456789101112131415161718192021222324252627282930313233343536373839404142434445464748495051525354555657585960

For Peer Review O
nly
2
Chemical simulation of greywater
Sustainable water resources management attracts considerable attention in
today’s world. Recycling and reuse of both wastewater and greywater are
becoming more attractive. The strategy is to protect ecosystem services by
balancing the withdrawal of water and the disposal of wastewater. In the present
study, a timely and novel synthetic greywater composition has been proposed
with respect of the composition of heavy metals, nutrients and organic matter.
The change in water quality of the synthetic greywater due to increasing storage
time was monitored to evaluate the stability of the proposed chemical formula.
The new greywater is prepared artificially using analytical grade chemicals to
simulate either low (LC) or high (HC) pollutant concentrations. The
characteristics of the synthetic greywater were tested (just before starting the
experiment, after two days and a week of storage under real weather conditions)
and compared to those reported for real greywater. Test results for both synthetic
greywater types showed great similarities with the physiochemical properties of
published findings concerning real greywater. Furthermore, the synthetic
greywater is relatively stable in terms of its characteristics for different storage
periods. However, there was a significant (p<0.05) reduction in 5-day
biochemical oxygen demand (BOD5) for both low (LC) and high (HC)
concentrations of greywater after two days of storage with reductions of 62% and
55%, respectively. A significant (p<0.05) change was also noted for the reduction
(70%) of nitrate‒nitrogen (NO3‒N) concerning HC greywater after seven days of
storage.
Keywords: Sustainability; Ecosystem; Greywater; Synthetic greywater;
Contamination
Introduction
Background
Researchers estimate that one-third of the world population could have insufficient
water resources by 2025 [1]. Therefore, recycling of wastewater for non-portable
purposes has been considered as a new strategy to conserve conventional water
Page 2 of 50
URL: http:/mc.manuscriptcentral.com/tent
Environmental Technology
123456789101112131415161718192021222324252627282930313233343536373839404142434445464748495051525354555657585960

For Peer Review O
nly
3
resources [2]. The most common practises of recycling treated wastewater and
greywater can be found in the agricultural, industrial, urban and environmental sectors
[3].
Greywater is a major proportion of domestic wastewater (around 50 to 80%) [4],
which is generated from all household wastewater streams, except toilet discharge
[2,4,5]. However, some literature has excluded the flow contributions of kitchen sinks,
garbage disposal units and/or dishwashers from greywater [6,7,8,9]. High fluctuations
in quality and a considerable overlap in characteristics between black and grey
wastewater have been reported [4]. The compounds present in greywater vary from
source to source, and depend on different lifestyles, customs and installations as well as
on the use of chemical household products [6]. Furthermore, there could be chemical
and biological degradation of the chemical compounds within the transportation
network and during storage affecting physical and chemical parameters [4,10,11].
Reported physiochemical parameters of particular relevance for greywater are
summarized in Table 1. Food particles and raw animal fluids from kitchen sinks, soil
particles as well as hair and fibres from laundry wastewater are examples of sources of
solid material in greywater [4]. High temperatures may be unfavourable since they
enhance microbial growth and could induce precipitation in supersaturated solutions [7].
Measurements of turbidity and suspended solids provide some information
concerning the overall content of particles and colloids that could induce clogging of
installations such as the piping used for greywater transportation as well as sand filters
and constructed wetlands used for subsequent treatment [4]. Measurements of the
traditional wastewater parameters 5-day biochemical oxygen demand (BOD5), chemical
oxygen demand (COD) and nutrients such as nitrogen (N) and phosphorus (P) in form
of ammonia–nitrogen (NH4-N), nitrate–nitrogen (NO3-N) and ortho-phosphate-
Page 3 of 50
URL: http:/mc.manuscriptcentral.com/tent
Environmental Technology
123456789101112131415161718192021222324252627282930313233343536373839404142434445464748495051525354555657585960

For Peer Review O
nly
4
phosphorus (PO4-P) also give valuable information about the chemistry of greywater
[18]. Ramona et al. [14] argued that wastewater would be better classified as a function
of pollution load rather than origin, and hence suggesting the notion of low (bath,
shower and washbasin) and high (kitchen, washing machine and dishwasher) strength
greywater.
A major difficulty when treating greywater is the considerable variation in its
composition. Reported mean values of, for example, COD and BOD5, vary from 40 to
371 mg/l and from 33 to 466 mg/l, respectively, between sites and with similar
variations arising at an individual site [4,6,14,20]. This has been attributed to changes
arising in the quantity and type of detergent products employed during washing.
Moreover, significant chemical changes may take place over time periods of only a few
hours [2]. Among other pollutants, trace elements and heavy metals have been reported
as important components to take into consideration for treatment, storage and recycling
purposes as indicated in Tables 2 and 3 [16,19].
Storage of greywater
The BOD5 and dissolved oxygen (DO) concentrations decrease during the
sedimentation period when greywater is stored. Evidence has shown that 50% removal
of BOD5 could be achieved when greywater is stored over a four-hour-period [2].
However, extended storage may lead to the risk of odour increases and possibly health
issues due to enhanced microorganism growth [22]. Furthermore, the BOD5
concentration in, for example, greywater washing hand basins has been reported as
being slightly lower than the one generated from mixed resources as well it varies with
different discharge patterns [6].
Page 4 of 50
URL: http:/mc.manuscriptcentral.com/tent
Environmental Technology
123456789101112131415161718192021222324252627282930313233343536373839404142434445464748495051525354555657585960

For Peer Review O
nly
5
There has been considerable research into the quality processes of raw greywater
occurring during the storage stage [23]. For example, Dixon et al [24] indicated
improvements in greywater quality during complex storage processes.
Reported synthetic greywater
In general, recycling of greywater is widely accepted compared to blackwater due to the
lack of urine and faeces in the former [25]. So, the pathogens and nutrients occurring in
greywater are present in much lower concentrations than in blackwater [4].
Greywater does not contain the right nutrient and trace element ratio required for
standard biological treatment or advanced treatment by membrane bioreactor [6,10,22].
Furthermore, low concentrations of trace elements have been linked to greywater [4].
Some synthetic greywaters have been created by mixing different recipes of chemical
products that household use and/or analytical grade chemicals known to be present in
real greywater. Consequently, these chemicals are expected to control the characteristics
of the generated greywater in terms of water quality [26].
Nghiem et al. [17] investigated the feasibility of submerged ultrafiltration
technology applied for greywater recycling. The synthetic greywater solution contained
kaolin, cellulose, humic acid, sodium hypochlorite, calcium chloride electrolyte and a
sodium bicarbonate buffer. These materials were also used in combination with sodium
dodecyl sulphate to represent synthetic greywater proposed by Schäfer et al. [26].
Nazim and Meera [27] studied the treatment ability of a synthetic greywater by
adding different concentrations of an enzyme protein solution to examine the reduction
of chemical variables including nutrients. The mixture of synthetic greywater contained
glucose, sodium acetate trihydrate, ammonium chloride, disodium hydrogen phosphate,
potassium dihydrogen phosphate, magnesium sulphate and cow dung.
Page 5 of 50
URL: http:/mc.manuscriptcentral.com/tent
Environmental Technology
123456789101112131415161718192021222324252627282930313233343536373839404142434445464748495051525354555657585960

For Peer Review O
nly
6
Diaper et al. [28] introduced a synthetic greywater recipe to simulate combined
laundry and bathroom greywater from an Australian residential dwelling. The
constituents of the greywater included a variety of personal hygiene and household
products, some laboratory grade chemicals (sodium dodecyl sulphate, sodium hydro
carbonate, sodium phosphate, boric acid, and lactic acid), and secondary sewage
effluent sourced from a local wastewater treatment plant.
Fenner and Komvuschara [29] described a new approach to model the effect of
factors influencing ultraviolet disinfection efficiency of real and synthetic greywaters. A
range of synthetic greywater recipes has been developed for both soft and hard waters to
ensure they were representative of the properties of real greywater samples. A typical
synthetic greywater recipe comprised dextrin, ammonia chloride (NH3Cl), yeast extract,
soluble starch, sodium carbonate (Na2CO3), monosodium phosphate (NaH2PO4),
potassium phosphate (K2PO4) and an Escherichia coli culture mixed with distilled
water.
Surendran and Wheatley [3] proposed a biological treatment process for
greywater obtained from large buildings. The synthetic greywater used comprised a
known amount of soap, detergent, starch yeast extract and cooking oil. Settled sewage
was also added to provide appropriate bacteria counts.
Jefferson et al. [22] dosed synthetic and real greywater with nutrient
supplements. The synthetic greywater recipe comprised synthetic soap, hair shampoo,
sunflower oil and tertiary effluent.
Gross et al. [30] have developed a new small-scale vertical-flow constructed
wetland for decentralized treatment of greywater. The removal of indicator and
pathogenic microorganisms was investigated to assess the reuse of treated greywater for
irrigation purposes. The focus was on the removal dynamics of Escherichia coli,
Page 6 of 50
URL: http:/mc.manuscriptcentral.com/tent
Environmental Technology
123456789101112131415161718192021222324252627282930313233343536373839404142434445464748495051525354555657585960

For Peer Review O
nly
7
Staphylococcus aureus and Pseudomonas aeruginosa in three different synthetic
greywaters.
Each greywater was made by combining three waste stocks representing
laundry, bath and kitchen wastes [30]. The composition of synthetic greywater for each
stock contained laundry soap, shampoo, cooking oil, and kitchen effluent (comprising
one egg and one tomato). All greywater types were supplemented with raw sink effluent
from a large dining room. This effluent, which contained an inoculum of E. coli and
other bacteria, was added in a small enough volume not to affect the composition of the
synthetic greywater [31].
In a controlled study, a recirculating vertical-flow constructed wetland has been
investigated to assess the effect of irrigation with treated greywater on soil properties
[32]. The greywater was prepared according to a similar recipe used by Gross et al.
[31]. However, pulverized bar soap was applied instead of shampoo in the synthetic
greywater.
Gross et al. [20] developed an economically sound, low-tech and easily
maintainable combined vertical-flow constructed wetland and trickling filter system for
greywater treatment and subsequent recycling. The greywater was prepared artificially
by mixing laundry detergent, boric acid and raw kitchen effluents into tap water.
Comino et al. [33] proposed a functional hybrid phytoremediation pilot platform
for the treatment of greywater. The pilot plant was tested with and without vegetation
for different design specifications as well as for various organic and hydraulic loads of
synthetic greywater. This study by Comino et al. [33] followed one by Gross et al. [20]
in terms of preparation of artificial greywater.
Glasshouse experiments were conducted by Pinto et al. [34] to understand the
effects of greywater reuse for irrigation of plants. Changes in soil pH, electric
Page 7 of 50
URL: http:/mc.manuscriptcentral.com/tent
Environmental Technology
123456789101112131415161718192021222324252627282930313233343536373839404142434445464748495051525354555657585960

For Peer Review O
nly
8
conductivity and nutrient content (total nitrogen and total phosphorus) due to greywater
irrigation were assessed. Synthetic greywater was prepared by mixing a commonly
available local detergent with potable water.
Winward et al. [35] evaluated the three treatment technologies constructed
wetlands, membrane bioreactors and membrane chemical reactors for indicator
microbial removal and greywater reuse potential under conditions of low and high
strength greywater influents. A high strength supplementary solution together with real
greywater was pumped to the treatment systems. Real greywater was referred to as low
or high strength solution based on a mixture of locally sourced shampoo diluted by tap
water.
Chemicals used in greywater simulation
The increased focus on the treatment and reuse of highly variable real greywater has
driven some researchers to create greywater with stable properties artificially as
indicated in Table 4a [36]. The concentrations of the corresponding greywater
pollutants (e.g., organic strength, nitrogen, phosphorus, surfactants and metals) as a
result of mixing the ingredients listed have been published in the references shown in
Table 4a. Table 4b shows the corresponding water quality. However, most recipes
cannot be reproduced accurately, because the environmental boundary conditions are
variable or unreported. Moreover, some ingredients such as cow dung, shampoo and
kitchen effluent is unspecified. A reproduction of the published water quality data is
therefore of little use to the readers of this paper. Nevertheless, a review of the most
common chemicals used for artificial greywater recipes is summarized below.
Kaolin is a common clay mineral composed of alternating sheets of aluminium
hydroxide and silicate [38]. It is frequently selected as an artificial greywater
Page 8 of 50
URL: http:/mc.manuscriptcentral.com/tent
Environmental Technology
123456789101112131415161718192021222324252627282930313233343536373839404142434445464748495051525354555657585960

For Peer Review O
nly
9
component to represent suspended organic and inorganic solids in greywater, which
may originate from natural clay containing various mineral components. These solids
are often generated from kitchen and laundry effluents [4]. Kaolin is also used in
synthetic wastewater recipes [17,26,39,40].
Cellulose is the principal structural component of plant cells and leaves.
Furthermore, the majority of the carbohydrates found in soils are derived from
cellulose, which is one of many polymers found in nature [38]. Cellulose is frequently
chosen to mimic organic fibres in greywater, since kitchen sinks and dishwashers are
common sources of organic fibres [17,26].
All natural waters contain humic [38] constituents as the result of biodegradation
of animal and plant matter or might form in situ due to the presence of soils, nutrients,
and cellulosic substrates for microbial action in the waste [41]. Humic acid is often used
to represent dissolved organic matter in greywater [17,26].
Boric acid is frequently applied to represent boron ions in greywater. One source
of boron is natural and the other is a result of human activities (e.g., extraction plant,
industry and detergent containing sodium perborate). It follows that many water sources
and wastewaters may contain boron in variable concentrations [20,28].
The following salts have been previously suggested as possible ingredients in
synthetic greywater: Sodium chloride (dissolved monovalent salt) is found as a common
ingredient of soap solutions and dyes [42,43]. Sodium hydrogen carbonate (natural
buffer) and sodium dodecyl sulphate are mainly used for the manufacture of detergents.
Their greatest cleaning application is as filler in powdered home laundry detergents
[43,44]. Sodium hydrogen carbonate, sodium dodecyl sulphate and sodium phosphate
are important in the manufacture of textiles by reducing negative charges on fibres, so
Page 9 of 50
URL: http:/mc.manuscriptcentral.com/tent
Environmental Technology
123456789101112131415161718192021222324252627282930313233343536373839404142434445464748495051525354555657585960

For Peer Review O
nly
10
that dyes can penetrate evenly [45]. Some of these salts have previously been used in
synthetic grey and municipal wastewater recipes [3,17,26,28,37,40].
Calcium nitrate and calcium chloride have been suggested as components in
synthetic greywater. Calcium salts are chosen to provide calcium ions to artificial
greywater. Previous research used calcium salts in synthetic greywater [17,26].
Laboratory grade chemicals such as potassium nitrate, mono-potassium phosphate and
magnesium sulphate have been chosen in previous studies [27,37] to resemble real
greywater in terms of nutrients and macronutrients generated from laundry and kitchen
effluents. Low suspended solids and turbidity linked to greywater indicates that a large
proportion of pollutants are dissolved. Although organics present in greywater are
relatively similar to domestic greywater, their chemical natures are quite different. So,
the deficiency of nutrients and low values of biodegradable organic matter are limiting
the effectiveness of biological treatment of greywater [6].
Iron(III) chloride, manganese(II) chloride, chromium(III) nitrate, zinc sulphate,
copper sulphate, cadmium oxide, nickel oxide, and lead(II) oxide are commonly
selected to provide heavy metals to artificial greywater, as discussed in publications
reported in Table 3. Sources of heavy metals in real greywater may be from cosmetics
[16], other products such as skin emulsions (creams, lotion and jelly), soap, shampoo,
hair cream, henna dye [46,47] and from body parts such as hair, nails and died skin cells
[4,48].
Ammonium molybdate tetrahydrate is used to provide molybdenum in artificial
greywater. Molybdate is also known to enhance the biological treatment of wastewater
[22]. Sodium hydroxide and hydrochloride acid are widely used as buffers to adjust the
pH value of a chemical solution.
Page 10 of 50
URL: http:/mc.manuscriptcentral.com/tent
Environmental Technology
123456789101112131415161718192021222324252627282930313233343536373839404142434445464748495051525354555657585960

For Peer Review O
nly
11
Small quantities of secondary or tertiary effluent obtained from predominantly
domestic wastewater treatment plants is frequently recommended as an additive to
synthetic greywater to provide a source of pathogens and microorganisms in general
[28,31,36,37,40]. However, the addition of microbes might not be necessary for
experiments in non-sterile environments such as outdoor trials where a microbial
population adjusted to the system tested will establish naturally eventually. One target
of this study is to evaluate the stability of chemical compositions of artificial greywater
through specific storage time experiments, without the contribution of biological
treatment, which is offered by micro-organism. There are numerous papers in the peer-
reviewed literature indicating greywater recipes that have no artificially introduced
micro-organism in the list of ingredients [17,26].
Rationale, aim, objectives and scope
There is a need to develop standard synthetic greywater recipes to allow for the easy
comparison of similar experiments in the future. Original experiments and a detailed
literature review have been performed to support the development of reasonably stable
generic synthetic greywater recipes for both low and high concentrations.
The aim of this article is to propose practical recipes to be used for the
simulation of greywater, which can be used with confidence to assess different
treatment technologies. The objectives are (a) to review previous greywater recipes and
corresponding components, (b) to evaluate the quality of the new synthetic greywater
and compare it with recipes found in the literature, (c) to examine the stability of
synthetic greywater as a function of time, and (d) to show that water quality changes are
not caused by internal reactions of used chemicals.
Page 11 of 50
URL: http:/mc.manuscriptcentral.com/tent
Environmental Technology
123456789101112131415161718192021222324252627282930313233343536373839404142434445464748495051525354555657585960

For Peer Review O
nly
12
The scope of this paper is limited to weak and strong standard synthetic
greywater recipe proposals being prepared under non-sterile conditions. It follows that
specific greywater types, which are often a function of geographical region, cultural and
religious practices as well as guidelines and legislation, are beyond the scope of this
article.
Materials and methods
Synthetic greywater
Household greywater was created artificially by using analytical grade chemicals (Table
5) purchased from Fisher Scientific Co. Ltd. (Bishop Meadow Road, Loughborough,
UK). The synthetic greywater was prepared under non-sterile conditions as a stock
solution by mixing the selected chemicals with de-chlorinated public mains tap water at
a temperature of around 25°C. The following water quality parameters of greywater
were simulated: biochemical oxygen demand, chemical oxygen demand, ammonia-
nitrogen, nitrate-nitrogen, ortho-phosphate-phosphorus, pH, redox potential, turbidity,
total suspension solids and electronic conductivity. The resultant key pollutants of the
proposed recipes are summarised in Table 6.
Two stock solutions were mixed separately to represent low (LC) and high (HC)
greywater strengths, and stirred by a magnetic stirrer (3.0 cm long and 0.5 cm wide)
with rounded edges for one hour at 1200 rpm [26]. The two solutions were stored
overnight at 4°C, and stirred for a further 30 minutes before the start of subsequent
experiments. The concentration levels of the proposed synthetic greywater are shown in
Table 6. These concentrations were subject to environmental conditions typical for
Greater Manchester (temperate and oceanic climate) between November and May.
Page 12 of 50
URL: http:/mc.manuscriptcentral.com/tent
Environmental Technology
123456789101112131415161718192021222324252627282930313233343536373839404142434445464748495051525354555657585960

For Peer Review O
nly
13
Sodium hydroxide (NaOH) and hydrochloride acid (HCl) were used to adjust the
pH value of the solution [17]. A wide range for pH values for real greywater has been
reported in literature (Table 1). However, in this experiment, the pH values for both low
and high strength greywaters were adjusted at pH ranges of around 5 to 7 and 7 to10,
respectively.
Experimental set-up
The set-up design includes two groups of black plastic buckets (volumes of 14 litres
each) selected to store 10 litres of the prepared greywater for two days and seven days
residence storage times. The storage times selected represent typical ones reported in
literature (Tables 1 to 4). Moreover, there are rather practical considerations of regular
feeding of experimental set-ups avoiding weekends. Each group has two bucket
replicates; the first group was used for storing low concentration greywater and the
second for keeping high strength greywater.
The buckets were subjected to real weather conditions at a quiescent place on
University grounds from 1st of November 2014 to 30
th of April 2015. Samples were
collected manually after the specific storage time (2 and 7 days) to conduct several
analytical tests as outlined in the next section.
Water quality
Water quality sampling was carried out according to APHA [49], unless stated
otherwise, to monitor the properties of synthetic greywater. The spectrophotometer DR
2800 (Hach Lange, Rechnungen, Germany) was used for standard water quality analysis
concerning variables including chemical oxygen demand (COD, mg/l), ammonia-
nitrogen (NH4-N, mg/l), nitrate-nitrogen (NO3-N, mg/l), ortho-phosphate-phosphorus
(PO4-P, mg/l), total suspension solids (TSS, mg/l) and colour (Pa/Co).
Page 13 of 50
URL: http:/mc.manuscriptcentral.com/tent
Environmental Technology
123456789101112131415161718192021222324252627282930313233343536373839404142434445464748495051525354555657585960

For Peer Review O
nly
14
The 5-day biochemical oxygen demand (BOD5, mg/l) was determined in all
water samples with the OxiTop IS 12-6 system, a mono-metric measurement device,
supplied by the Wissenschaftlich–Technische Werkstätten (Weilheim, Germany).
Turbidity was measured with a Turbicheck Turbidity Meter (Lovibond Water Testing,
Tintometer Group, Dortmund, Germany). The redox potential (redox) was measured
with a sensION+benchtop multi-parameter meter (Hach Lange, Düsseldorf, Germany).
The electric conductivity (EC, µs/cm) was determined by a conductivity Meter entitled
METTLER TOLEDO FIVE GOTM (Keison Products, Chelmsford, Essex, England,
UK). Dissolved oxygen (DO, mg/l) for all samples was measured by an HQ30d Flexi
meter (Hach Lange, Düsseldorf, Germany).
Data analysis
Microsoft Excel has been used for the general data analysis (e.g., mean, standard
deviation, minimum and maximum values). The non-parametric Mann–Whitney test
was computed using IBM SPSS Statistics Version 20 and applied to compare the
variance in test results of two (unmatched) independent samples. Since, all sample data
were not normally distributed.
Results and discussion
Synthetic greywater characteristics
The inflow water parameters in Table 6 refer to characteristics of prepared synthetic
greywater just before utilisation in the experiment. These parameters were compared
and discussed with published results of real greywater constituents obtained from
previous research studies (Table 1).
The figures shown in Table 6 are based on outside (greywater systems exposed
Page 14 of 50
URL: http:/mc.manuscriptcentral.com/tent
Environmental Technology
123456789101112131415161718192021222324252627282930313233343536373839404142434445464748495051525354555657585960

For Peer Review O
nly
15
to the elements) experiments. The data variability is therefore high, resulting in some
unexpected findings, which are, however, not statistically (p>0.05) significant. For
example, the mean COD of inflow (LC greywater) was 25.2 mg/l. After two days of
storage, the average outflow COD was 27.9 mg/l. Furthermore, the corresponding
standard deviations are relatively high and the sample numbers of both data sets are
different.
There are very few reported data regarding colour of real greywater. The test
results of synthetic greywater have shown ranges of colour from 26.0 to 332.0 Pa/Co
and from 787.0 to 2499.0 Pa/Co for LC and HC greywater concentrations, respectively.
The temperature was around 6.5‒37.0°C for both types of proposed greywater, which
was similar to figures reported by Eriksson et al. [4] and Christova-Boal et al. [7].
Depending on the sources of greywater, there is a wide range of pH for real greywater.
Most of these waters were simulated by using LC synthetic greywater with a pH
between 6.0 and7.9, while the pH values for HC greywater were between 5.4 and 11.5,
representing those real discharges, which were commonly generated from laundries
[4,7,10,17].
The reported ranges for turbidity and total suspended solids (TSS) as shown in
Table 1 were successfully simulated particularly by the ingredient kaolin (Table 5) for
both greywater strengths (Table 6). Those values for simulated HC greywater (mean of
318 mg/l and range between 190 mg/l and 473 mg/l; Table 6) are particularly
represented by the solids in the discharges from laundry, kitchen and mixed greywater
sources as shown in Table 1 [4,7,10,12], while the simulated LC greywater (mean of 40
mg/l and range between 10 mg/l and 87 mg/l; Table 6) is linked to waters from hand
basins, showers and similar mixed greywater sources as indicated in Table 1
[6,13,14,15,16]. Electric conductivity data for real greywater in literature have
Page 15 of 50
URL: http:/mc.manuscriptcentral.com/tent
Environmental Technology
123456789101112131415161718192021222324252627282930313233343536373839404142434445464748495051525354555657585960
For Peer Review O
nly
16
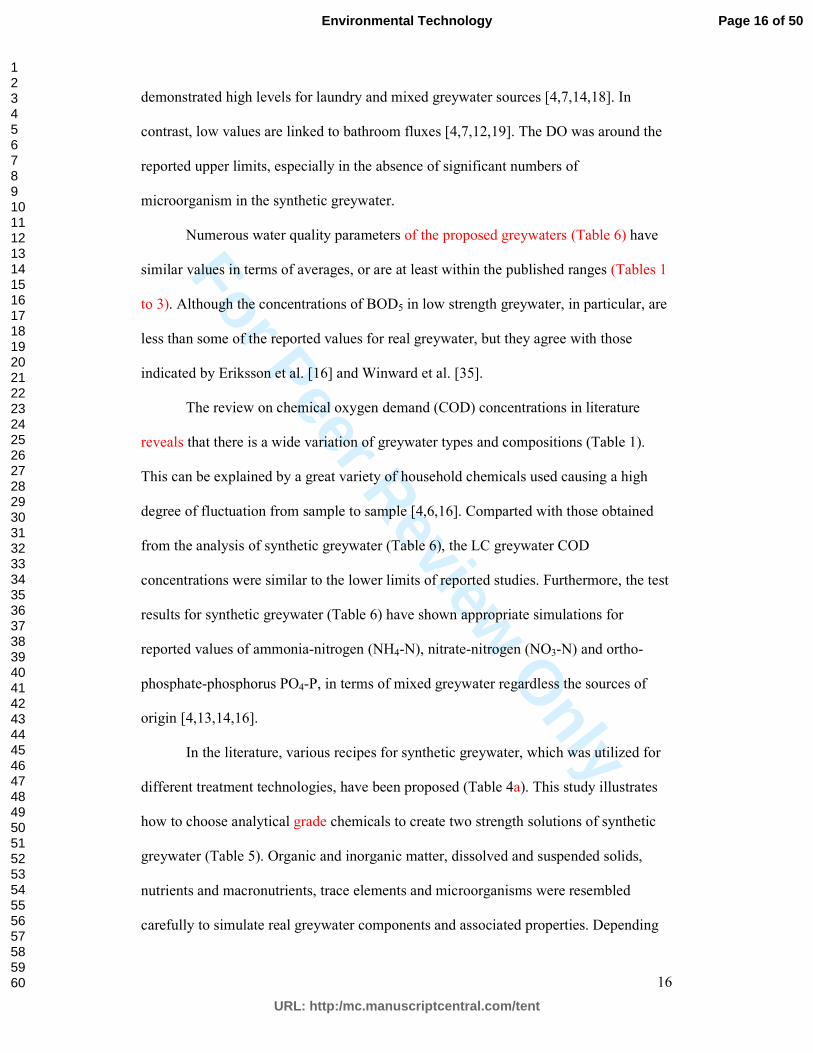
demonstrated high levels for laundry and mixed greywater sources [4,7,14,18]. In
contrast, low values are linked to bathroom fluxes [4,7,12,19]. The DO was around the
reported upper limits, especially in the absence of significant numbers of
microorganism in the synthetic greywater.
Numerous water quality parameters of the proposed greywaters (Table 6) have
similar values in terms of averages, or are at least within the published ranges (Tables 1
to 3). Although the concentrations of BOD5 in low strength greywater, in particular, are
less than some of the reported values for real greywater, but they agree with those
indicated by Eriksson et al. [16] and Winward et al. [35].
The review on chemical oxygen demand (COD) concentrations in literature
reveals that there is a wide variation of greywater types and compositions (Table 1).
This can be explained by a great variety of household chemicals used causing a high
degree of fluctuation from sample to sample [4,6,16]. Comparted with those obtained
from the analysis of synthetic greywater (Table 6), the LC greywater COD
concentrations were similar to the lower limits of reported studies. Furthermore, the test
results for synthetic greywater (Table 6) have shown appropriate simulations for
reported values of ammonia-nitrogen (NH4-N), nitrate-nitrogen (NO3-N) and ortho-
phosphate-phosphorus PO4-P, in terms of mixed greywater regardless the sources of
origin [4,13,14,16].
In the literature, various recipes for synthetic greywater, which was utilized for
different treatment technologies, have been proposed (Table 4a). This study illustrates
how to choose analytical grade chemicals to create two strength solutions of synthetic
greywater (Table 5). Organic and inorganic matter, dissolved and suspended solids,
nutrients and macronutrients, trace elements and microorganisms were resembled
carefully to simulate real greywater components and associated properties. Depending
Page 16 of 50
URL: http:/mc.manuscriptcentral.com/tent
Environmental Technology
123456789101112131415161718192021222324252627282930313233343536373839404142434445464748495051525354555657585960

For Peer Review O
nly
17
on data shown in Table 2 and 3, synthetic greywater solutions represent reality
reasonably well. The recipe was based on the molar weight of the chemical composition
multiplied by the percentage of the specific element in that chemical. For example, 100
mg of Iron (III) chloride provides 34 mg/l of iron (Table 5).
Stability of synthetic greywater
Table 6 shows all water quality results of LC and HC synthetic greywaters after two and
seven days of storage. For LC greywater, the pH has increased from 6.9 to 7.2 for a
two-day storage period. There was no significant (p>0.05) change after seven days of
storage. However, data show a reduction in colour, turbidity and total suspended solids
for the outflow of two-day storage experiments by 22.0%, 5.5% and 23.4%,
respectively. The percentages concerning the outflow for the seven-day storage
experiments were 14.2%, 11.1%, and 22.9%, respectively. The number of colloids and
particles is likely to reduce over time as physical (e.g., coagulation and flocculation)
processes reduce turbidity and suspended solids. However, biochemical processes such
as biodegradation will lead to an increase in microorganisms and debris contributing to
an increase in turbidity and fine material [4,7,10,20,24,30].
A statistical analysis has shown no significant (p>0.05) changes in colour, pH,
turbidity and total suspended solids, when both synthetic greywaters are stored for two
or seven days. This confirms previous findings [28,36] showing that suspended solids
and insoluble particle concentrations of chemical greywaters are highly stability,
possibly, because they originate from inert materials.
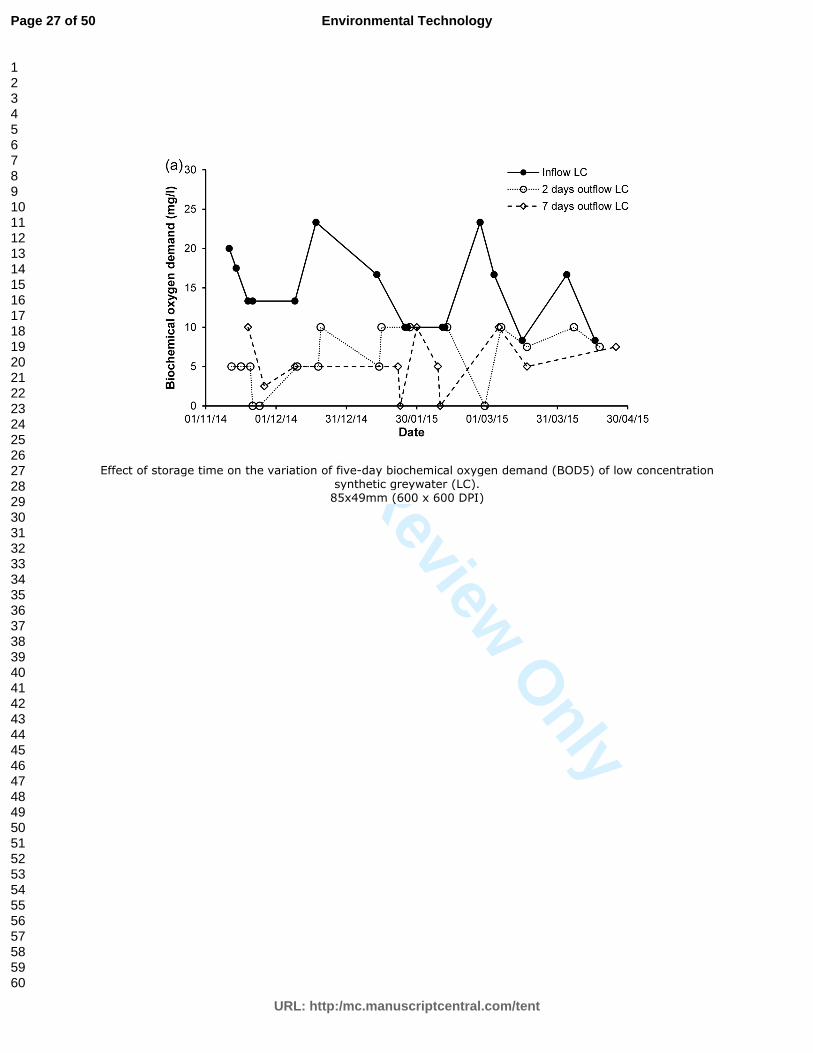
Figure 1(a) and (b) illustrate the variations in BOD5 concentrations for both LC
and HC synthetic greywater, respectively. The values for LC greywater have shown
significant (p<0.05) reductions in the averages from 15.2 mg/l to 5.7 mg/l and to 7.0 at
Page 17 of 50
URL: http:/mc.manuscriptcentral.com/tent
Environmental Technology
123456789101112131415161718192021222324252627282930313233343536373839404142434445464748495051525354555657585960

For Peer Review O
nly
18
two and seven days of storage time, respectively (Table 6 and Figure 2(a)). While for
HC greywater, the biochemical oxygen demand has dropped significantly (p<0.05) form
32.3 mg/l to 14.5 mg/l after two days of storage with a reduction of 55.2%, and it was
stable at around 14.7 mg/l for outflow water after seven days (Table 6, Figure 2(a)).
This change has been confirmed by comparing available data evidence, which was
reported by Jefferson et al. [2]. Microbial contamination is the likely reason for the drop
in organic strength [50,51].
The chemical oxygen demand in the LC greywater increased from 25.2 mg/l to
27.9 mg/l (not statistically significant (p>0.05); see also above) for the two-day storage
time experiment. However, it decreased to 19.6 mg/l for the seven-day storage time test
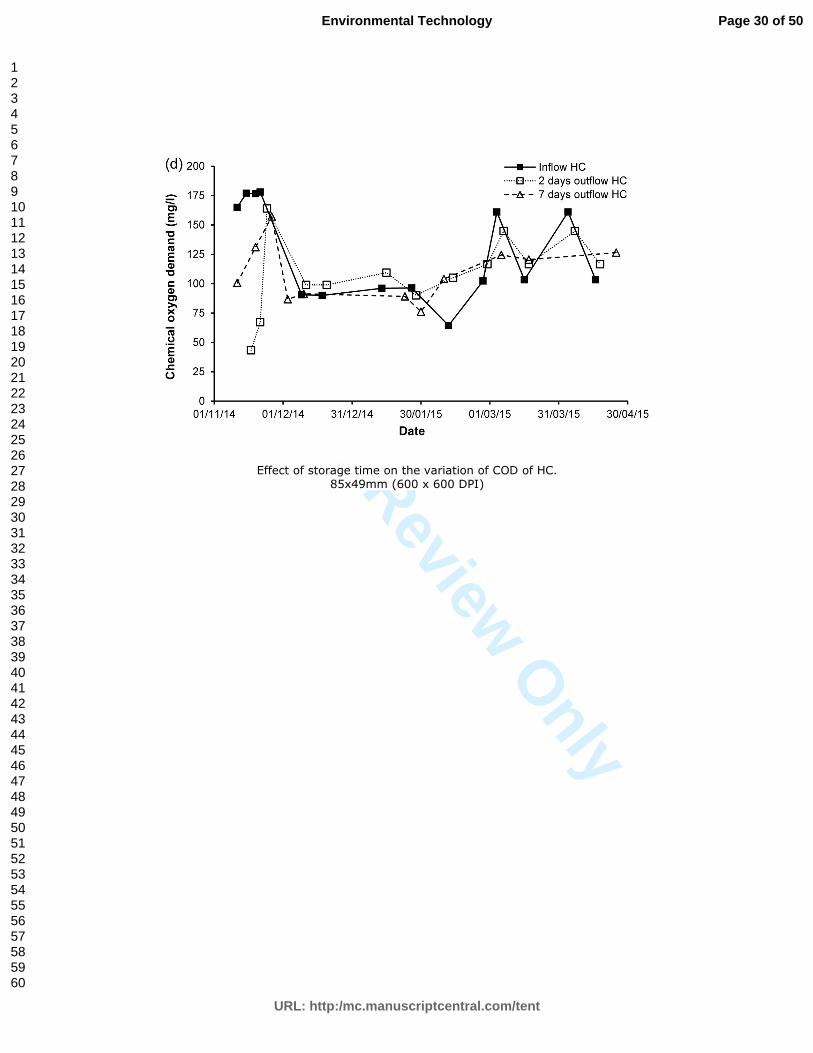
(Figure 2(b)). In contrast, the chemical oxygen demand for HC greywater dropped from
115.4mg/l to 110.7m/l (reduction by 4.1%) and to 108.3 mg/l (reduction by 6.2%) for
two-day and seven-day storage times, respectively. The variations in test results are
shown in Figures 1(c) and (d) in that order. Some of the COD data variations can be
attributed to both experimental variability (see discussion in the previous section) and
biodegradation of the fraction of the COD, which is biodegradable [29,38].
For HC greywater, the averages of ammonia-nitrogen show a stable behaviour
with values of around 0.4 mg/l without change through storage (Figures 1(e) and (f)).
The corresponding values for LC greywater have decreased from 0.2 m/l to 0.1 mg/l
after two days of storage. The results show no change for seven days outflow (Figure
2(c)). The measured values for ammonia-nitrogen are close to the detection limit.
Therefore, the transformation of ammonia to nitrite and subsequently to nitrate cannot
be evidence in this experiment [38].
A considerable change was observed for the average values of nitrate-nitrogen
after both storage times. The values dropped from 9.2 mg/l to 6.2 mg/l and 2.8mg/l after
Page 18 of 50
URL: http:/mc.manuscriptcentral.com/tent
Environmental Technology
123456789101112131415161718192021222324252627282930313233343536373839404142434445464748495051525354555657585960

For Peer Review O
nly
19
storage times of tow and seven days, respectively (Table 6, Figure 1(h)). However, a
significant (p<0.05) reduction was noted for two days of storage regarding HC synthetic
greywater. In contrast, the nitrate-nitrogen values of LC greywater decreased slightly
from 1.4 mg/l to 1.3 and to 1.1 mg/l after two and seven days of storage time in this
order (Figures 1(g) and 2(d)). The reduction of nitrate-nitrogen can be explained by
denitrification [38].
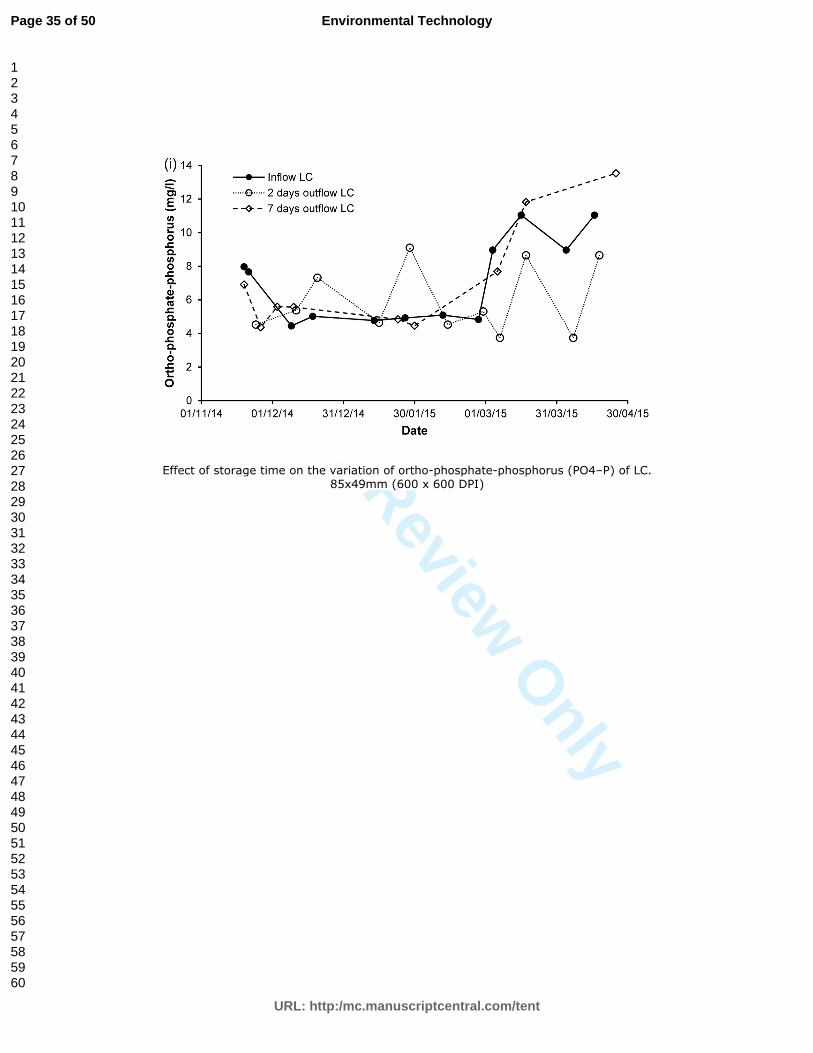
Also, there are no significant (p>0.05) changes in the reduction of ortho-
phosphate-phosphorus for both storage times (Figures 1(i) and (j)). They decreased
from 50.6 mg/l to 46.5 mg/l (reduction of 8.2%) for two-day storage, and decreased to
45.8 mg/l (reduction of 26.4%) for seven-day storage of HC greywater. The ortho-
phosphate-phosphorus concentrations also decreased from 6.3 mg/l to 5.6 mg/l for two-
day storage experiments, and to 8.2 mg/l for seven-day storage of LC greywater (Figure
2(e)). Phosphorus is likely to be taken up by microbes developing in the outside systems
[51]. However, considering that microbes were not deliberately added to the greywater
recipe, microbial biomass development is rather slow. Therefore, changes in phosphorus
concentrations were small.
Conclusions and recommendations
The proposed new synthetic greywater recipes mimic real greywater well in both
composition and properties. Furthermore, they provide a good matrix for
microorganisms to survive and contain compounds in detectable concentrations
identified as having a potentially detrimental environmental impact.
The suggested recipes for LC and HC greywater loadings are easy to prepare
and replicate by others in the future. All selected materials were of chemical analytical
Page 19 of 50
URL: http:/mc.manuscriptcentral.com/tent
Environmental Technology
123456789101112131415161718192021222324252627282930313233343536373839404142434445464748495051525354555657585960

For Peer Review O
nly
20
grade. High quantity stock solutions can be prepared and stored at 4°C without major
concern.
Throughout monitoring of the synthetic greywater properties during storage, the
water quality parameters concerning their average values are chemically relatively
stable. It has been noticed that only significant (p<0.05) fluctuations in the BOD5 for
both greywater concentrations may occur. In addition, it is not recommended to store
the synthetic greywater for more than two days to avoid depletion of dissolved oxygen
due to development of microorganisms. Furthermore, significant changes in nitrate-
nitrogen content might be noticed after two days of storage.
Page 20 of 50
URL: http:/mc.manuscriptcentral.com/tent
Environmental Technology
123456789101112131415161718192021222324252627282930313233343536373839404142434445464748495051525354555657585960

For Peer Review O
nly
21
Figure 1. Effect of storage time on the variation of (a) five-day biochemical oxygen
demand (BOD5) of low concentration synthetic greywater (LC), (b) BOD5 of high
concentration synthetic greywater (HC), (c) chemical oxygen demand (COD) of LC, (d)
COD of HC, (e) ammonia-nitrogen (NH4‒N) of LC, (f) NH4‒N of HC, (g) nitrate-
nitrogen (NO3‒N) of LC, (h) NO3‒N of HC, (i) ortho-phosphate-phosphorus (PO4‒P) of
LC, and (j) PO4‒P of HC greywater.
Figure 2. Effect of storage time on the synthetic greywater characteristics (a) five-day
biochemical oxygen demand, (b) chemical oxygen demand, (c) ammonia-nitrogen, (d)
nitrate-nitrogen, and (e) ortho-phosphate-phosphorus.
Page 21 of 50
URL: http:/mc.manuscriptcentral.com/tent
Environmental Technology
123456789101112131415161718192021222324252627282930313233343536373839404142434445464748495051525354555657585960

For Peer Review O
nly
22
Table 1. Characteristics of real greywater (GW).
Table 2. Trace element concentrations (mg/l) of real greywater (GW).
Table 3. Heavy metal concentrations (mg/l) of real greywater (GW).
Table 4a. Recipes reported for different synthetic greywater.
Table 4b. Characteristics of different synthetic greywaters proposed in Table 4a.
Table 5. Proposed ingredients for low and high strength synthetic greywaters.
Table 6. Water quality parameters after two and seven days of storage time.
Page 22 of 50
URL: http:/mc.manuscriptcentral.com/tent
Environmental Technology
123456789101112131415161718192021222324252627282930313233343536373839404142434445464748495051525354555657585960

For Peer Review O
nly
23
References
[1] FAO, Food and Agriculture Organization of the United Nations. Coping with
water scarcity: Challenge of the twenty first century: Cairo, Egypt: FAO
Regional Office for the Near East; 2007.
[2] Jefferson B, Laine A, Parsons S, et al. Technologies for domestic wastewater
recycling. Urban Water. 2000;1:285‒292.
[3] Surendran S, Wheatley A. Grey‐water reclamation for non‐potable re‐use. Water
Environ J. 1998;12:406‒413.
[4] Eriksson E, Auffarth K, Henze M, et al. Characteristics of grey wastewater.
Urban Water. 2002;4:85‒104.
[5] Jeppesen B. Domestic greywater re-use: Australia’s challenge for the future.
Desalination. 1996;106:311‒315.
[6] Al-Jayyousi OR. Greywater reuse: towards sustainable water management.
Desalination. 2003;156:181‒192.
[7] Christova-Boal D, Eden RE, McFarlane S. An investigation into greywater reuse
for urban residential properties. Desalination. 1996;106:391‒397.
[8] Emmerson G. Every drop is precious: Greywater as an alternative water source.
Queensland Parliamentary Library: Brisbane; 1998.
[9] WHO, World Health Organization. Overview of greywater management health
considerations. Regional Office for the Eastern Mediterranean Centre for
Environmental Health Activities: Amman, Jordan; 2006.
[10] Li F, Wichmann K, Otterpohl R. Review of the technological approaches for
grey water treatment and reuses. Sci Total Environ. 2009;407:3439‒3449.
[11] Nolde E. Greywater reuse systems for toilet flushing in multi-storey buildings –
over ten years experience in Berlin. Urban Water. 2000;1:275‒284.
[12] Al-Hamaiedeh H, Bino M. Effect of treated grey water reuse in irrigation on soil
and plants. Desalination. 2010;256:115–119.
[13] Pidou M, Avery L, Stephenson T, et al. Chemical solutions for greywater
recycling. Chemosphere. 2008;71:147–155.
[14] Ramona G, Green M, Semiat R., et al. Low strength greywater characterization
and treatment by direct membrane filtration. Desalination. 2004;170:241‒250.
[15] March JG, Gual M, Orozco F. Experiences on greywater re-use for toilet
flushing in a hotel (Mallorca Island, Spain). Desalination. 2004;164:241‒247.
Page 23 of 50
URL: http:/mc.manuscriptcentral.com/tent
Environmental Technology
123456789101112131415161718192021222324252627282930313233343536373839404142434445464748495051525354555657585960
For Peer Review O
nly
24
[16] Eriksson E, Srigirisetty S, Eilersen AM. Organic matter and heavy metals in
grey-water sludge. Water SA. 2010;36:139‒142.
[17] Nghiem LD, Oschmann N, Schäfer AI. Fouling in greywater recycling by direct
ultrafiltration. Desalination. 2006;187:283‒290.
[18] Houshia OJ, Abueid M, Daghlas A, et al. Characterization of grey water from
country-side decentralized water treatment stations in northern Palestine. J
Environ Earth Sci. 2012;2:1‒8.
[19] Leal LH, Soeter AM, Kools SE, et al. Ecotoxicological assessment of greywater
treatment systems with Daphnia magna and Chironomus riparius. Water Res.
2012;46:1038‒1044.
[20] Gross A, Shmueli O, Ronen Z, et al. Recycled vertical flow constructed wetland
(RVFCW) ‒ a novel method of recycling greywater for irrigation in small
communities and households. Chemosphere. 2007;66:916‒23.
[21] Kariuki FW, Ngàng VG, Kotut K. Hydrochemical characteristics, plant nutrients
and metals in household greywater and soils in Homa Bay town. The Open
Environ Eng J. 2012;5:103‒109.
[22] Jefferson B, Burgess JE, Pichon A, et al. Nutrient addition to enhance biological
treatment of greywater. Water Res. 2001;35:2702‒2710.
[23] Liu S, Butler D, Memon FA, et al. Impact of residence time during storage on
potential of water saving for grey water recycling system. Water Res.
2010;44:267‒277.
[24] Dixon A, Butler D, Fewkes A, et al. Measurement and modelling of quality
changes in stored untreated grey water. Urban Water. 1999;1:293‒306.
[25] Domenech L, Sauri D. Socio‒technical transitions in water scarcity contests:
Public acceptance of greywater reuse technologies in the Metropolitan Area of
Barcelona. Resour Conservation Recycling. 2010;55:53‒62.
[26] Schäfer AI, Nghiem LD, Oschmann N. Bisphenol A retention in the direct
ultrafiltration of greywater. J Membr Sci. 2006;283:233‒243.
[27] Nazim F, Meera V. Treatment of synthetic greywater using 5% and 10%
garbage enzyme solution. Bonfring Int J Ind Eng Manag Sci. 2013;3:111‒117.
[28] Diaper C, Toifl M, Storey M. Greywater technology testing protocol. CSIRO:
Water for a Healthy Country National Research Flagship; 2008.
Page 24 of 50
URL: http:/mc.manuscriptcentral.com/tent
Environmental Technology
123456789101112131415161718192021222324252627282930313233343536373839404142434445464748495051525354555657585960

For Peer Review O
nly
25
[29] Friedler E, Kovalio R, Galil NI. On-site greywater treatment and reuse in multi-
storey buildings. Water Sci Technol. 2005;51:187‒194.
[30] Gross A, Kaplan D, Baker K. Removal of microorganisms from domestic
greywater using a recycling vertical flow constructed wetland (RVFCW). Proc
Water Environ Fed. 2006;6:6133-6141.
[31] Gross A, Kaplan D, Baker K. Removal of chemical and microbiological
contaminants from domestic greywater using a recycled vertical flow bioreactor
(RVFB). Ecological Eng. 2007;31:107‒114.
[32] Travis MJ, Wiel-Shafran A, Weisbrod N, et al. Greywater reuse for irrigation:
Effect on soil properties. Sci Total Environ. 2010;408:2501‒2508.
[33] Comino E, Riggio V, Rosso M. Grey water treated by a hybrid constructed
wetland pilot plant under several stress conditions. Ecological Eng.
2013;53:120‒125.
[34] Pinto U, Maheshwari BL, Grewal HS. Effects of greywater irrigation on plant
growth, water use and soil properties. Resour Conservation Recycling.
2010;54:429‒435.
[35] Winward GP, Avery LM, Frazer-Williams R, et al. A study of the microbial
quality of grey water and an evaluation of treatment technologies for reuse.
Ecological Eng. 2008;32:187‒197.
[36] Hourlier F, Masse A, Jaouen P, et al. Formulation of synthetic greywater as an
evaluation tool for wastewater recycling technologies. Environ Technol.
2010;31:215‒223.
[37] Fenner RA, Komvuschara K. A new kinetic model for ultraviolet disinfection of
greywater. J Environ Eng, ASCE. 2005;131:850‒864.
[38] Essington ME. Soil and water chemistry: An integrative approach: CRC press;
2004.
[39] Marfil-Vega R, Suidan MT, Mills MA. Abiotic transformation of oestrogens in
synthetic municipal wastewater: an alternative for treatment. Environ Pollut.
2010;158:3372‒3377.
[40] Fitria D, Scholz M, Swift GM, Hutchinson SM. Impact of sludge floc size and
water composition on dewaterability. Chem Eng Technol. 2014;37:471‒477.
[41] Wall NA, Choppin GR. Humic acids coagulation: influence of divalent cations.
Appl Geochemistry. 2003;18:1573‒1582.
Page 25 of 50
URL: http:/mc.manuscriptcentral.com/tent
Environmental Technology
123456789101112131415161718192021222324252627282930313233343536373839404142434445464748495051525354555657585960

For Peer Review O
nly
26
[42] McBain WJ, Cornish VE, Bowden CR. CCXV‒Studies of the constitution of
soap in solution: sodium myristate and sodium laurate. J Chem Soc Trans.
1912;101:2042‒2056.
[43] Myers D. Surfactant Science and Technology. VCH Publishers Inc.: New York,
NY, USA; 1988.
[44] Zhu SN, Wang C, Yip ACK, et al. Highly effective degradation of sodium
dodecyl benzene sulphonate and synthetic greywater by Fenton-like reaction
over zero valent iron-based catalyst. Environ Technol. 2015;36:1423‒1432.
[45] Syafalni S, Abustan I, Dahlan I, et al. Treatment of dye wastewater using
granular activated carbon and zeolite filter. Mod Appl Sci. 2012;6:37-51.
[46] Chauhan AS, Bhadauria R, Singh AK, et al. Determination of lead and cadmium
in cosmetic products. J Chem Pharm Res. 2010;2:92‒97.
[47] Bocca B, Pino A, Alimonti A, et al. Toxic metals contained in cosmetics: a
status report. Regul Toxicol Pharmacol. 2014;68:447‒67.
[48] Chjnacka K, Saeid A, Michalak I, et al. Effects of local industry on heavy metals
contents in human hair. Pollut J Environ Stud. 2012;21:1563‒1570.
[49] APHA, AWWA. Standard methods for the examination of water and
wastewater. 21st ed. Washington, DC: American Water Works Association, and
Water and Environment Federation; 2005.
[50] Maiga Y., Moyenga D., Nikiema BC, et al. Designing slanted soil system for
greywater treatment for irrigation purposes in rural area of arid regions. Environ
Technol. 2014;35:3020‒3027.
[51] Friedler E., Kovalio R., Ben-Zvi A. Comparative study of the microbial quality
of greywater treated by three on-site treatment systems. Environ Technol.
2006;27:653‒663.
Page 26 of 50
URL: http:/mc.manuscriptcentral.com/tent
Environmental Technology
123456789101112131415161718192021222324252627282930313233343536373839404142434445464748495051525354555657585960
For Peer Review O
nly
Effect of storage time on the variation of five-day biochemical oxygen demand (BOD5) of low concentration synthetic greywater (LC).
85x49mm (600 x 600 DPI)
Page 27 of 50
URL: http:/mc.manuscriptcentral.com/tent
Environmental Technology
123456789101112131415161718192021222324252627282930313233343536373839404142434445464748495051525354555657585960

For Peer Review O
nly
Effect of storage time on the variation of BOD5 of high concentration synthetic greywater (HC). 85x49mm (600 x 600 DPI)
Page 28 of 50
URL: http:/mc.manuscriptcentral.com/tent
Environmental Technology
123456789101112131415161718192021222324252627282930313233343536373839404142434445464748495051525354555657585960

For Peer Review O
nly
Effect of storage time on the variation of chemical oxygen demand (COD) of LC. 85x49mm (600 x 600 DPI)
Page 29 of 50
URL: http:/mc.manuscriptcentral.com/tent
Environmental Technology
123456789101112131415161718192021222324252627282930313233343536373839404142434445464748495051525354555657585960
For Peer Review O
nly
Effect of storage time on the variation of COD of HC. 85x49mm (600 x 600 DPI)
Page 30 of 50
URL: http:/mc.manuscriptcentral.com/tent
Environmental Technology
123456789101112131415161718192021222324252627282930313233343536373839404142434445464748495051525354555657585960

For Peer Review O
nly
Effect of storage time on the variation of ammonia-nitrogen (NH4‒N) of LC. 85x49mm (600 x 600 DPI)
Page 31 of 50
URL: http:/mc.manuscriptcentral.com/tent
Environmental Technology
123456789101112131415161718192021222324252627282930313233343536373839404142434445464748495051525354555657585960

For Peer Review O
nly
Effect of storage time on the variation of NH4‒N of HC. 85x49mm (600 x 600 DPI)
Page 32 of 50
URL: http:/mc.manuscriptcentral.com/tent
Environmental Technology
123456789101112131415161718192021222324252627282930313233343536373839404142434445464748495051525354555657585960

For Peer Review O
nly
Effect of storage time on the variation of nitrate-nitrogen (NO3‒N) of LC. 85x49mm (600 x 600 DPI)
Page 33 of 50
URL: http:/mc.manuscriptcentral.com/tent
Environmental Technology
123456789101112131415161718192021222324252627282930313233343536373839404142434445464748495051525354555657585960

For Peer Review O
nly
Effect of storage time on the variation of NO3‒N of HC. 85x49mm (600 x 600 DPI)
Page 34 of 50
URL: http:/mc.manuscriptcentral.com/tent
Environmental Technology
123456789101112131415161718192021222324252627282930313233343536373839404142434445464748495051525354555657585960
For Peer Review O
nly
Effect of storage time on the variation of ortho-phosphate-phosphorus (PO4‒P) of LC. 85x49mm (600 x 600 DPI)
Page 35 of 50
URL: http:/mc.manuscriptcentral.com/tent
Environmental Technology
123456789101112131415161718192021222324252627282930313233343536373839404142434445464748495051525354555657585960

For Peer Review O
nly
Effect of storage time on the variation of PO4‒P of HC greywater. 85x49mm (600 x 600 DPI)
Page 36 of 50
URL: http:/mc.manuscriptcentral.com/tent
Environmental Technology
123456789101112131415161718192021222324252627282930313233343536373839404142434445464748495051525354555657585960

For Peer Review O
nly
Effect of storage time on the synthetic greywater characteristics five-day biochemical oxygen demand. 70x58mm (600 x 600 DPI)
Page 37 of 50
URL: http:/mc.manuscriptcentral.com/tent
Environmental Technology
123456789101112131415161718192021222324252627282930313233343536373839404142434445464748495051525354555657585960

For Peer Review O
nly
Effect of storage time on the synthetic greywater characteristics chemical oxygen demand. 70x58mm (600 x 600 DPI)
Page 38 of 50
URL: http:/mc.manuscriptcentral.com/tent
Environmental Technology
123456789101112131415161718192021222324252627282930313233343536373839404142434445464748495051525354555657585960

For Peer Review O
nly
Effect of storage time on the synthetic greywater characteristics ammonia-nitrogen. 70x58mm (600 x 600 DPI)
Page 39 of 50
URL: http:/mc.manuscriptcentral.com/tent
Environmental Technology
123456789101112131415161718192021222324252627282930313233343536373839404142434445464748495051525354555657585960

For Peer Review O
nly
Effect of storage time on the synthetic greywater characteristics nitrate-nitrogen. 70x59mm (600 x 600 DPI)
Page 40 of 50
URL: http:/mc.manuscriptcentral.com/tent
Environmental Technology
123456789101112131415161718192021222324252627282930313233343536373839404142434445464748495051525354555657585960

For Peer Review O
nly
Effect of storage time on the synthetic greywater characteristics ortho-phosphate-phosphorus. 70x59mm (600 x 600 DPI)
Page 41 of 50
URL: http:/mc.manuscriptcentral.com/tent
Environmental Technology
123456789101112131415161718192021222324252627282930313233343536373839404142434445464748495051525354555657585960

For Peer Review Only
Table1. Characteristics of real greywater (GW).
Reference Greywater source Temp.
(°C)
pH
(–)
Turbidity
(NTU)
TSS
(mg/l)
EC
(µS/cm)
DO
(mg/l)
BOD5
(mg/l)
COD
(mg/l)
NH4–N
(mg/l)
NO3–N
(mg/l)
PO4–P
(mg/l)
Eriksson et al. [4] Bathroom GW 29 6.4–8.1 60–240 54–200 82–250 76–200 100–633 ≤0.1 to 15.0 0.28–6.30 0.94–48.80
Laundry GW 28–32 8.1–10.0 14–296 120–280 190–1400 48–380 12.8–725.0 0.04–11.30 0.4–2.0 4–171
Kitchen GW 27–38 6.3–7.4 235–720 2.2–5.8 1040–1460 3.8–1380 0.002–23.0 0.3–5.8 12.7–32.0
Mixed GW 18–38 5.0–8.7 15.3 to ≥200.0 320–20000 90–360 13–549 0.03–25.40 0.0–4.9 4–68
Al-Jayyousi [6] Hand basin 109 263 9.6
Combined 69 121 371 1
Single person 14 110 256
Single family 76.5 0.74
Block of flats 20 33 40 10
College 59 80 146 10
Large college 57 96 168 0.8
Christova-Boal et al. [7] Bathroom GW 25 6.4–8.1 60–240 48–120 82–250 76–200 ≤0.1 to 15.0
Laundry GW 25 9.3–10.0 50–210 88–250 190–1400 48–290 ≤0.1 to 1.9
Li et al. [10] Bathroom GW 6.4–8.1 44–375 7–505 50–300 100–633
Laundry GW 7.1–10.0 50–444 68–465 48–472 231–2950
Kitchen GW 5.9–7.4 298 134–1300 536–1460 26–2050
Mixed GW 6.3–8.1 29–375 25–183 47–466 100–700
Al-Hamaiedeh and Bino [12] Real GW range 6.9–7.8 23–358 157–200 110–1240 92–2263 0.44–0.93
Real GW average 7.2 275 183 942 1712 0.68
Pidou et al. [13] Mixed GW LC 6.6–7.6 35 39 144 0.7 3.9 0.5
Shower GW HC 7.3–7.8 42 166 575 1 7.5 1.3
Real Raw GW 46.6 205 791 1.2 6.7 1.66
Ramona et al. [14] Shower GW1 7.5 23 29.8 1317 78 170 1.5–3.0 0.05–1.70 0.02–0.19
March et al. [15] Raw GW 7.3–8.0 5–62 39–441
Eriksson et al. [16] Raw GW 1 7.7–8.1 51–135 2.5–4.5 18–68 0.36–4.40 0.02–2.20
Raw GW 2 8.2–8.3 67–390 9.3–9.5 ≤3 0.07–0.13 0.25–0.28
Nghiem et al. [17] Real GW 5.0–10.9 33–1460 3.8–1380.0
Houshia et al. [18] Raw GW 6.1 1500 126.6 38
Leal et al. [19] Raw GW 7.24 74.4 1476 ≤0.10 2.97
Notes: Temp. = temperature, NTU = nephelometric turbidity unit, TSS = total suspended solids, EC = electric conductivity, DO = dissolved oxygen, BOD5 = 5-day
biochemical oxygen demand, COD = chemical oxygen demand, NH4–N = ammonia–nitrogen, NO3–N = nitrate–nitrogen, and PO4–P = ortho–phosphate–phosphorus.
Page 42 of 50
URL: http:/mc.manuscriptcentral.com/tent
Environmental Technology
123456789101112131415161718192021222324252627282930313233343536373839404142434445464748495051525354555657585960

For Peer Review Only
Table 2. Trace element concentrations (mg/l) of real greywater (GW).
Reference Greywater Source Aluminium Boron Calcium Potassium Magnesium Sodium Sulphur Silicon Phosphorus
Eriksson et al. [4] Bathroom GW ≤0.1 ≤0.1 3.5‒7.9 1.5‒5.2 1.4‒2.3 7.4‒18.0 1.2‒3.3 3.2‒4.1
Laundry GW ≤1.0‒21 0.1‒0.5 3.9‒14.0 1.1‒17.0 1.1‒3.1 44‒480 9.5‒40.0 3.8‒49.0
Kitchen GW 0.67‒1.8 13‒30 19‒59 3.3‒7.3 29‒180
Mixed GW 0.10‒3.55 11‒35 6.6 1.5‒19.0 21‒230
Christova-Boal et al. [7] Bathroom GW ≤1.0 3.5‒7.9 1.5‒5.2 1.4‒2.3 7.4‒18.0 1.2‒3.3 3.2‒4.1 0.11‒1.80
Laundry GW ≤1.0‒21.0 3.9‒12.0 1.1‒17.0 1.1‒2.9 49‒480 9.5‒40.0 3.8‒49.0 0.062‒
42.000
Li et al. [10] Bathroom GW 2.44 33.8 8.1 5.74 23.7
Laundry GW 0.49 60.79 11.20‒
23.28 6.15 19
Kitchen GW 0.003 47.9 5.79 5.29 16.3
Ramona et al. [14] Shower GW 0.03 0.14 71.0‒93.6 9.8‒12.4 43.2‒50.0 93.0‒142.7
Nghiem et al. [17] Real GW 3.6‒200.0
Houshia et al. [18] Raw GW 89.5 37.3 132.2
Leal et al. [19] Raw GW 42.8 14.5 11.6 128
Kariuki et al. [21] Kitchen GW1 4.9 23.4 4.8 15.38
Laundry GW1 1.3 26.9 2.54 39.23
Bath GW2 0.96 10 0.27 6.15
Kitchen GW2 0.93 16.9 0.28 9.89
Laundry GW2 0.32 31.8 1.14 35.38
Jefferson et al. [22] Real GW 0.003 47.9 5.79 5.29 16.3
Page 43 of 50
URL: http:/mc.manuscriptcentral.com/tent
Environmental Technology
123456789101112131415161718192021222324252627282930313233343536373839404142434445464748495051525354555657585960

For Peer Review Only
Table 3. Heavy metal concentrations (mg/l) of real greywater (GW).
Reference Greywater
source Cadmium Chromium Copper Iron Manganese Nickel Lead Zinc Molybdenum
Eriksson et al. [4] Bathroom GW
0.00054‒
0.01000 0.06‒0.12 0.34-1.10 0.003
0.059‒
6.300
Laundry GW 0.00036‒
0.03800 ≤0.025 ≤0.050‒0.322 0.29-1.00 0.029 ≤0.028 0.033 to ≤0.063 0.09‒0.44
Kitchen GW 0.00052‒
0.00700 ≤0.025‒0.130 0.05‒0.26 0.6-1.2 0.031‒0.075 ≤0.025 0.005‒0.140
0.096‒
1.800
Mixed GW ≤0.006‒0.030 ≤0.01026‒
0.05000 0.018‒0.230 <0.05-4.37 0.014‒0.075 ≤0.015‒0.050 ≤0.01‒0.15
≤0.01‒
1.60
Christova-Boal et al. [7] Bathroom GW ≤0.01 0.06‒0.12 0.34‒1.10 0.2‒6.3
Laundry GW ≤0.01 ≤0.05‒0.27 0.29‒1.00 0.09‒0.32
Li et al. [10] Bathroom GW 0.0618 0.36 0.0121 0.0644
Laundry GW 0.08 0.11 ≤0.05 0.00 ≤0.05
Kitchen GW 0.006 0.017 0.04 0.03 0.00
Al-Hamaiedeh and Bino
[12]
GW Range 1.00‒1.31
GW Average 0.008 1.19
Ramona et al. [14] Shower GW 1 ≤0.02 ≤0.02 ≤0.02 0.19 ≤0.02 ≤0.02 ≤0.02 0.18 ≤0.02
Shower GW 2 ≤0.02 ≤0.02 ≤0.02 0.06 ≤0.02 ≤0.02 ≤0.02 0.03 ≤0.02
Eriksson et al. [16] Raw GW 1 0.0001 0.0087‒0.0110 0.007‒0.039 0.0025‒0.0031
Raw GW 2 ≤ 0.0001‒
0.0090 0.0085‒0.0250 0.0055‒0.0079 0.0018‒0.0032
Leal et al. [19] Raw GW 0.0906 0.29 ≤0.010
Kariuki et al. [21] Kitchen GW1 5.5 16.1 0.9 1.9 1.4 0.9 6.6
Laundry GW1 7 0.9 1 3.6 0.4 0.8 0.4
Bath GW2 10.7 11.1 2.6 3.8 0.3 0.2 0.2
Kitchen GW2 10 11.3 2.3 9.7 0.2 0.3 0.1
Laundry GW2 11.2 16.1 2.9 17.5 0.3 0.0 0.7
Page 44 of 50
URL: http:/mc.manuscriptcentral.com/tent
Environmental Technology
123456789101112131415161718192021222324252627282930313233343536373839404142434445464748495051525354555657585960

For Peer Review Only
Table 4a. Recipes reported for different synthetic greywaters.
Reference Surendran and Wheatley [3] Diaper et al. [28] Nazim and Meera [27] Fenner and Komvuschara [37]
Country UK Australia India UK
Treatment
approach
Multi-stage bio-filter - Biological with suspended media
- Chemical flocculants, ultraviolet
disinfection and filtration
- Settling, biological with fixed media
Using garbage enzyme after filtration Ultraviolet disinfection system
Dextrin 85 mg/l Sunscreen or
moisturiser
15 or
10 mg/l
Glucose 300 mg/l Dextrin 85 mg/l
Ammonium chloride 75 mg/l Toothpaste 32.5 mg/l Sodium acetate trihydrate 400 mg/l Ammonium chloride 75 mg/l
Yeast extract 70 mg/l Deodorant 10 mg/l Ammonium chloride 225 mg/l Yeast extract 70 mg/l
Soluble starch 55 mg/l Sodium sulphate 35 mg/l Sodium dihydrogen phosphate 150 mg/l Soluble starch 55 mg/l
Sodium carbonate 55 mg/l Sodium hydrogen carbonate 25 mg/l Potassium dihydrogen phosphate 75 mg/l Sodium carbonate 55 mg/l
Washing powder 30 mg/l Sodium phosphate 39 mg/l Magnesium sulphate 50 mg/l Sodium dihydrogen phosphate 11.5 mg/l
Sodium dihydrogen phosphate 11.5 mg/l Clay (unimin) 50 mg/l Cow dung 225 ml/l Potassium phosphate 4.5 mg/l
Potassium sulphate 4.5 mg/l Vegetable oil 0.7 mg/l Escherichia coli culture 15 ml/l
Settled sewage 10 ml/l Shampoo/hand wash 720 mg/l
Shampoo 0.1 ml/l Laundry 150 mg/l
Cooking oil 0.1 ml/l Boric acid 1.4 mg/l
Biochemical oxygen demand approx. 200 ml/l Lactic acid 28 mg/l
Secondary effluent 20 ml/l
Reference Gross et al. [20]/Comino et al. [33] Nghiem et al. [17] Jefferson et al. [22] Hourlier et al. [36]
Country Israel/Italy Australia UK France
Treatment
Approach
Vertical-flow constructed wetland/
Hybrid constructed wetland
Submerged ultrafiltration membranes Membrane bioreactors and activated sludge
systems
Direct membrane nano-filtration
Laundry detergent 20 g Humic Acid 20 mg/l Synthetic soap 0.64g Lactic acid 100 mg/l
Boric acid 0.86 g Kaolin 50 mg/l Hair shampoo 8.0 ml Cellulose 100 mg/l
Kitchen effluent 400 ml Cellulose 50 mg/l Sunflower oil 0.1 ml Sodium dodecyl sulphate 50 mg/l
Tap water 150 l Calcium chloride 0.5 mM Tertiary effluent 24 ml Glycerol 200 mg/l
Sodium chloride 10 mM Tap water 10 l Sodium hydrogen carbonate 70 mg/l
Sodium hydrogen carbonate 1 mM Sodium sulphate 50 mg/l
Septic effluent 10 mg/l
Page 45 of 50
URL: http:/mc.manuscriptcentral.com/tent
Environmental Technology
123456789101112131415161718192021222324252627282930313233343536373839404142434445464748495051525354555657585960

For Peer Review Only
Table 4b. Characteristics of different synthetic greywaters proposed in Table 4a.
Notes: NTU = nephelometric turbidity unit.
Parameter Unit Surendran and
Wheatley [3]
Diaper et al.
[28]
Nazim and
Meera [27]
Gross et al.
[20]
Comino et al.
[33]
Nghiem et al.
[17]
Hourlier et al.
[36]
Biochemical oxygen demand mg/l 215 146.7 192 28.0‒688 58‒75
Chemical oxygen demand mg/l 276.7 290 702‒984 77.4 391‒505
Ammonia-nitrogen mg/l 11 9.6 0.1‒0.5
Nitrate-nitrogen mg/l <0.2 0.0‒5.8
Nitrite‒nitrogen mg/l <0.003 0.0‒1.0
Total nitrogen mg/l 25.0‒45.2
Ortho-phosphate-phosphorus mg/l 4.9 110
Total phosphorus mg/l 17.8 17.2‒27.0
pH ‒ 7.4 6.16 6.3‒7.0 7.3 7.5‒8.0 6.29‒7.29
Redox potential mV
Turbidity NTU 72 52.1 140 4‒42
Total dissolved solids mg/l 12.3 563 247.4
Total suspension solid mg/l 196 59 85‒285 41‒87
Total organic carbon mg/l 81.8 62.2
Dissolved organic carbon mg/l 106-149
Electronic conductivity µs/cm 322.2 1000‒1300 495.1 159‒212
Dissolved oxygen mg/l
Aluminium mg/l 1.6
Boron mg/l 1.4‒1.7
Calcium mg/l 7.6
Magnesium mg/l 1.3
Sodium mg/l 65.3
Surfactants mg/l 4.7‒15.6 33.5‒69.8
Salinity ‒ 0.1
Page 46 of 50
URL: http:/mc.manuscriptcentral.com/tent
Environmental Technology
123456789101112131415161718192021222324252627282930313233343536373839404142434445464748495051525354555657585960

For Peer Review Only
Table 5. Proposed ingredients for low and high strength synthetic greywaters.
Item Chemical name Chemical
formula
Molar mass
(g/mol)
Low
concentration
(mg/l)
High
concentration
(mg/l)
Composition percentages
1 Kaolin Al2Si2O5(OH)4 258.16 15 100 Al (20.90%), H (1.56%), O (55.78%) and Si (21.76%)
2 Cellulose (C6H10O5) n 162.14 15 100 C (44.45%), H (6.22%) and O (49.34%)
3 Humic acid C187H186O89N9S1 4015.55 5 20 C (55.90%), H (4.67%), O (35.46%), N (4.67%) and S
(0.80%)
4 Sodium chloride NaCl 58.44 10 120 Cl (60.66%) and Na (39.34%)
5 Sodium hydrogen carbonate NaHCO3 84.01 10 85 C (14.30%), H (1.20%), Na (27.37%) and O (57.14%)
6 Calcium chloride CaCl2 147.02 10 55 Ca (36.11%) and Cl (63.89%)
7 Potassium nitrate KNO3 101.10 0 90 K (38.67%), N (13.85%) and O (47.48%)
8 Calcium nitrate Ca(NO3)2 164.09 0 150 Ca (24.43%), N (17.07%) and O (58.50%)
9 Magnesium sulphate MgSO4 120.37 2 240 Mg (20.19%), S (26.64%) and O (53.17%)
10 Monopotassium phosphate KH2PO4 136.09 13 85 H (1.48%), K (28.73%), O (47.03%) and P (22.76%)
11 Iron(III)chloride FeCl3 162.20 0.3 50.0 Fe (34.43%) and Cl (65.57%)
12 Boric acid H3BO3 61.83 0.6 3.0 H (4.89%), B (17.48%) and O (77.63%)
13 Manganese(II)chloride MnCl2 125.84 0.03 3.20 Cl (56.34%) and Mn (43.66%)
14 Zinc sulphate ZnSO4 161.44 0.25 15.00 O (39.64%), S (19.86%) and Zn (40.50%)
15 Copper sulphate CuSO4 159.61 0.025 7.000 Cu (39.81%), O (40.10%) and S (20.09%)
16 Ammonium molybdate
tetrahydrate
(NH4)6Mo7O24 1163.94 0.35 0.35 H (2.08%), Mo (57.71%), N (7.22%) and O (32.99%)
17 Cadmium oxide CdO 128.41 0.02 12.50 Cd (87.54%) and O (12.46%)
18 Nickel oxide NiO 74.69 0.02 0.06 Ni (78.58%) and O (21.42%)
19 Chromium(III)nitrate CrN3O9 99.99 0.045 70.000 Cr (21.85%), N (17.65%) and O (60.50%)
20 Sodium sulphate Na2SO4 142.04 2.60 25.00 Na (32.37%), O (45.06%) and S (22.57%)
21 Sodium phosphate monobasic H2NaPO4 119.98 0.00 250.00 H (1.68%), Na (19.16%), O (53.34%) and P (25.82%)
22 Lead(II)oxide Pb3O4 685.60 0.16 1.40 Pb (90.67%) and O (9.33%)
23 Secondary treatment effluent
with microbial content (ml/l)
– – 20.00 100.00 –
Note: Al = aluminium, H = hydrogen, O = oxygen, Si = silicon, C = , N = nitrogen, S = sulphur, Cl = chlorine, Na = sodium, Ca = calcium, K = potassium, Mg = magnesium,
P = phosphorus, Fe = iron, B = boron, Mn = manganese, Zn = zinc, Cu = copper, Mo = molybdenum, Cd = Cadmium, Ni = nickel, Cr = chromium, Pb = lead, and item 23
was not considered in this study.
Page 47 of 50
URL: http:/mc.manuscriptcentral.com/tent
Environmental Technology
123456789101112131415161718192021222324252627282930313233343536373839404142434445464748495051525354555657585960

For Peer Review O
nly
Table 6. Water quality parameters after two and seven days of storage time. Parameter Unit Number Mean Standard deviation Minimum Maximum Reduction (%)
Inflow (LC)
Biochemical oxygen demand mg/l 33 15.2 7.45 5.0 30.0 na
Chemical oxygen demand mg/l 31 25.2 9.99 8.2 48.3 na
Ammonia-nitrogen mg/l 30 0.2 0.11 0.0 0.5 na
Nitrate-nitrogen mg/l 32 1.4 1.61 0.1 7.6 na
Ortho-phosphate-phosphorus mg/l 31 6.3 2.35 3.8 12.0 na
pH ‒ 33 6.9 0.37 6.0 7.9 na
Redox potential mV 33 15.7 53.07 -190.2 65.7 na
Turbidity NTU 33 22.6 7.95 9.8 41.6 na
Total suspension solids mg/l 33 40.2 18.70 10.0 87.0 na
Electronic conductivity µs/cm 33 150.8 61.89 98.7 452.0 na
Dissolved oxygen mg/l 33 10.1 1.53 7.7 12.2 na
Colour Pa/Co 24 199.9 71.30 26.0 332.0 na
Temperature °C 33 17.3 6.37 6.7 27.0 na
2-day outflow (LC)
Biochemical oxygen demand mg/l 21 5.7 3.96 0.0 10.0 62.3
Chemical oxygen demand mg/l 21 27.9 10.26 2.7 41.9 -10.8
Ammonia-nitrogen mg/l 19 0.1 0.09 0.0 0.3 45.2
Nitrate-nitrogen mg/l 19 1.3 0.80 0.1 3.1 10.4
Ortho-phosphate-phosphorus mg/l 19 5.6 2.04 3.5 10.9 11.4
pH ‒ 48 7.2 0.70 6.3 10.1 na
Redox potential mV 48 17.5 30.68 -116.1 51.0 na
Turbidity NTU 48 21.3 7.81 2.9 35.4 5.5
Total suspension solids mg/l 48 30.8 12.92 13.0 76.0 23.4
Electronic conductivity µs/cm 48 128.4 23.57 79.0 215.0 na
Dissolved oxygen mg/l 48 10.7 0.94 8.8 12.6 -6.3
Colour Pa/Co 36 156.0 51.13 34.0 265.0 22.0
Temperature °C 48 16.0 4.85 5.3 21.8 na
7-day outflow (LC)
Biochemical oxygen demand mg/l 15 7.0 6.21 0.0 20.0 54.0
Chemical oxygen demand mg/l 22 19.6 9.83 6.0 36.7 22.2
Ammonia-nitrogen mg/l 18 0.1 0.07 0.0 0.3 45.2
Nitrate-nitrogen mg/l 17 1.1 1.27 0.0 4.0 21.4
Ortho-phosphate-phosphorus mg/l 17 8.2 6.03 2.6 25.7 -29.4
pH ‒ 44 7.2 0.60 6.4 8.9 na
Redox potential mV 44 18.3 26.66 -56.4 53.2 na
Turbidity NTU 44 20.1 5.71 12.6 34.1 11.1
Total suspension solids mg/l 44 31.0 9.52 18.0 56.0 22.9
Electronic conductivity µs/cm 48 143.0 38.83 97.7 263.0 na
Dissolved oxygen mg/l 48 11.5 0.84 10.4 14.3 -13.9
Colour Pa/Co 36 171.5 33.14 128.0 258.0 14.2
Temperature °C 48 14.1 3.87 6.7 20.0 na
Inflow (HC)
Biochemical oxygen demand mg/l 33 32.3 12.81 10.0 60.0 na
Chemical oxygen demand mg/l 30 115.4 39.57 63.9 189.0 na
Ammonia-nitrogen mg/l 30 0.4 0.18 0.1 0.8 na
Nitrate-nitrogen mg/l 32 9.2 7.81 0.2 29.8 na
Ortho-phosphate-phosphorus mg/l 30 50.6 13.06 30.7 92.6 na
pH ‒ 33 8.1 1.93 5.4 11.5 na
Redox potential mV 33 -29.3 89.61 -182.1 97.9 na
Turbidity NTU 33 184.6 50.34 18.3 285.0 na
Total suspension solids mg/l 33 317.5 54.73 190.0 473.0 na
Electronic conductivity µs/cm 33 936.8 156.16 617.0 1180.0 na
Dissolved oxygen mg/l 33 10.0 1.69 6.9 12.6 na
Colour Pa/Co 27 1427.3 444.54 787.0 2499.0 na
Temperature °C 33 17.6 6.58 6.5 27.8 na
Page 48 of 50
URL: http:/mc.manuscriptcentral.com/tent
Environmental Technology
123456789101112131415161718192021222324252627282930313233343536373839404142434445464748495051525354555657585960

For Peer Review O
nly
Table 6 (cont.) 2-day outflow (HC)
Biochemical oxygen demand mg/l 19 14.5 8.48 0.0 30.0 55.2
Chemical oxygen demand mg/l 21 110.7 28.63 43.3 164.0 4.1
Ammonia-nitrogen mg/l 19 0.4 0.26 0.0 0.9 6.8
Nitrate-nitrogen mg/l 20 6.2 4.18 0.5 15.0 32.8
Ortho-phosphate-phosphorus mg/l 20 46.5 14.37 23.7 70.1 8.2
pH ‒ 48 8.3 1.35 5.6 9.8 na
Redox potential mV 48 -28.4 60.63 -107.6 88.6 na
Turbidity NTU 48 215.7 49.45 111.0 341.0 -16.9
Total suspension solid mg/l 48 345.0 48.49 229.0 447.0 -8.7
Electronic conductivity µs/cm 48 948.3 105.86 627.0 1196.0 na
Dissolved oxygen mg/l 48 10.3 0.78 9.0 12.1 -3.0
Colour Pa/Co 36 1697.0 292.83 1121.0 2311.0 -18.9
Temperature °C 48 17.0 4.94 6.0 21.5 na
7-day outflow (HC)
Biochemical oxygen demand mg/l 15 14.7 6.40 5.0 30.0 54.5
Chemical oxygen demand mg/l 24 108.3 24.47 67.2 159.5 6.2
Ammonia-nitrogen mg/l 16 0.4 0.19 0.0 0.8 0.01
Nitrate-nitrogen mg/l 18 2.8 2.24 0.4 9.3 69.6
Ortho-phosphate-phosphorus mg/l 17 45.8 18.23 20.3 79.4 9.5
pH ‒ 48 8.1 1.20 5.9 9.8 na
Redox potential mV 48 -27.4 57.02 -108.3 78.1 na
Turbidity NTU 48 209.3 38.14 122.0 281.0 -13.4
Total suspension solid mg/l 48 322.5 73.45 3.1 434.0 -1.6
Electronic conductivity µs/cm 48 1105.6 351.09 668.0 2460.0 na
Dissolved oxygen mg/l 48 10.9 0.72 9.4 12.0 -9.0
Colour Pa/Co 36 1882.8 409.34 1119.0 2889.0 -31.9
Temperature °C 48 15.7 3.49 8.4 20.8 na
Notes: LC = low concentration synthetic greywater, NTU = nephelometric turbidity unit, na = not applicable, HC = high concentration
synthetic greywater.
Page 49 of 50
URL: http:/mc.manuscriptcentral.com/tent
Environmental Technology
123456789101112131415161718192021222324252627282930313233343536373839404142434445464748495051525354555657585960

For Peer Review O
nly
Concentrations of Proposed Synthetic Greywater Parameters Unit Synthetic greywater
Low: range (mean) High: range (mean)
Biochemical oxygen demand mg/l 5‒30 (15.2) 10‒60 (32.3) Chemical oxygen demand mg/l 8‒48 (25.2) 64‒189 (115.4) Ammonia-nitrogen mg/l 0.0‒0.5 (0.2) 0.1‒0.8 (0.4) Nitrate-nitrogen mg/l 0.1‒7.6 (1.4) 0.2‒29.8 (9.2) Ortho-phosphate-phosphorus mg/l 3.8‒12.0 (6.3) 30‒92 (50.6) pH ‒ 6‒8 (6.9) 5‒12 (8.1) Redox potential mV -190‒66 (15.7) -182‒98 (-29.3) Turbidity NTU* 10‒42 (22.6) 18‒285 (184.6) Total suspension solids mg/l 10‒87 (40.2) 190‒473 (317.5) Electronic conductivity µs/cm 99‒452 (150.8) 617‒1180 (936.8) Dissolved oxygen mg/l 8‒12 (10.1) 7‒13 (10) Colour Pa/Co 26‒332 (200) 787‒2499 (1427.3) *nephelometric turbidity unit.
Page 50 of 50
URL: http:/mc.manuscriptcentral.com/tent
Environmental Technology
123456789101112131415161718192021222324252627282930313233343536373839404142434445464748495051525354555657585960
Recommended