PROPOSED DATE:
JUNE 1, 2020
SUBMITTED TO:
CITY COUNCIL
PROPOSED BUDGET
BUDG
ET 20/21CITY OF HIGH POINT

Annual Budget
Fiscal Year 2020-2021
Presented to the City Council on
June 1, 2020

ANNUAL BUDGETFISCAL YEAR 2020-2021
TABLE OF CONTENTSPage
BUDGET MESSAGE MM-1
1
2
4
5
Where the Municipal Dollar Originates 6
Estimated Changes in Fund Balance 7
Analysis of Revenues Sources 8
Tax Values, Rates & Collections 11
Where the Municipal Dollar Goes 12
Analysis of Expenditures 13
Summary of Personnel Complement 18
Debt Service Policies & Overview 22
Assessed Values & Debt Limitations 24
Debt Outstanding & Maturities 25
26
27
28
Water-Sewer Revenue & Expense Summary 29
Electric Revenue & Expense Summary 30
Parking Revenue & Expense Summary 31
Summaries & Analysis Introduction
Department: Public Services
ELECTRIC FUND
PARKING FUNDDepartment: Transportation
SUMMARIES/ANALYSIS
2020-2021 Summary of Revenues & Expenditures & Estimated Fund Balances
Personnel Information
Debt Information:
Total Government Spending By Function
Total Government Revenues by Source
Revenue Data:
Property Tax Information:
Expense Data:
General Debt Service Fund Summary
GENERAL CAPITAL PROJECTS FUNDGeneral Capital Projects Fund Summary
GENERAL FUNDRevenue & Expense Summary
GENERAL DEBT SERVICE FUND
WATER-SEWER FUND
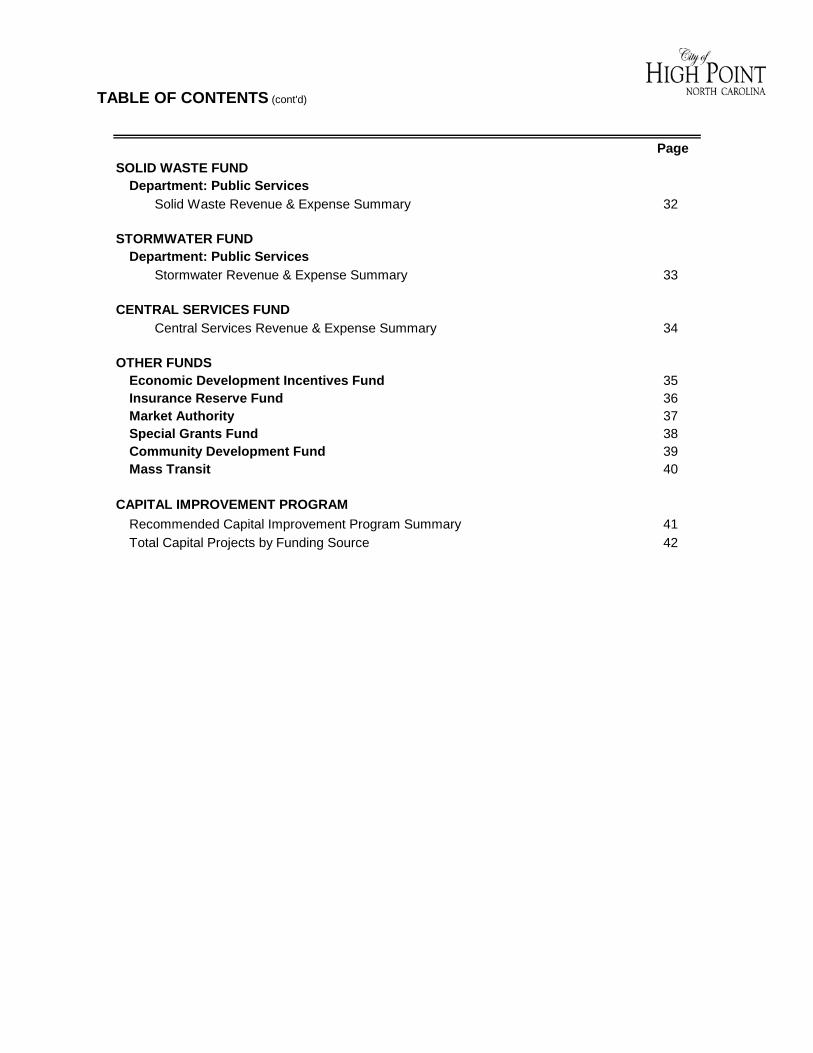
TABLE OF CONTENTS (cont'd)
Page
Solid Waste Revenue & Expense Summary 32
Stormwater Revenue & Expense Summary 33
Central Services Revenue & Expense Summary 34
35
36
37
38
39
40
Recommended Capital Improvement Program Summary 41
42
CAPITAL IMPROVEMENT PROGRAM
Insurance Reserve FundMarket AuthoritySpecial Grants Fund Community Development Fund Mass Transit
Department: Public Services
STORMWATER FUNDDepartment: Public Services
CENTRAL SERVICES FUND
OTHER FUNDS
SOLID WASTE FUND
Total Capital Projects by Funding Source
Economic Development Incentives Fund

City of High Point, North Carolina—FY 2020-21 Annual Budget
MM-1
June 1, 2020
Honorable Mayor and Members of the City Council City of High Point, North Carolina
The City Manager’s proposed budget for fiscal year 2020-21 has been tremendously difficult to
draft. Typically, I would use the City Council’s Strategic Plan to guide the way. While the
strategic plan continues to be a guiding document, the COVID-19 pandemic has created an
atmosphere of uncertainty about the financial status of the city.
There is so much uncertainty about revenues, including sales tax, property tax collection rates,
registered motor vehicle taxes, utility collections and other sources that it makes it extremely
difficult to budget expenditures. Staff has taken a conservative approach, but we acknowledge
that there are unknown impacts of this pandemic that may affect us in ways we have not
considered. The upcoming fiscal year will be one in which we monitor and report on our fiscal
health on a monthly basis, so that we can address shortfalls as they occur. We will also be in a
position to restore funding to programs if economic factors are better than projected.
• 1 cent tax rate increase
• No electric rate increase
• No garbage collection fee increase
• No stormwater fee increase
• No motor vehicle fee increase
• 2% water and sewer fee increase,
effective October 1.
• Included 1% mid year cost of living ad-
justment
• Eliminates 1% city match for 401k
contributions
• Adds 1 full time Diversity, Equity and
Inclusion Specialist position and 2 Fleet
Maintenance apprentice positions
• Includes a targeted hiring freeze for the
first six months
• Closure of the High Point Museum
• Eliminates the city employee holi-
day bonus
• Eliminates outside agency funding
• Closure of the Morehead Recrea-
tion Center
• Continues partnership with For-
ward High Point but reduces contri-
bution by 10%
• Continues fleet replacement pro-
gram to replace large equipment
and light duty vehicles but reduces
investment by 10%
• Reduces employee training budgets
• Reduces fleet fuel budgets
• Reflects phone system efficiency
upgrades
• Reduces Community Development
blight reduction budget

City of High Point, North Carolina—FY 2020-21 Annual Budget
MM-2
TOTAL FY 2020-21 BUDGET OF ALL FUNDS
This budget was prepared in accordance with the provisions of the North Carolina General
Statutes and the policies of the North Carolina Local Government Commission. This budget is
balanced and reflects the City Council’s commitment to responsible fiscal management, while
continuing to provide services that improve the quality of life for the citizens of High Point.
Funds included in the budget are adequate to continue providing the services that are expected
by our citizens. The budget funds the critical elements of the City Council’s Strategic Plan while
looking forward to the needs of the future.
The total FY 2020-21 budgeted expenditures for the City of High Point amount to
$414,221,928. This is an increase of $16,051,815 or 4.0% from the FY 2019-20 Budget. The
majority of the increase is due to a planned use of fund balance for the Water/Sewer capital
projects program.
Below is a chart of total 2020-21 budgeted revenues and expenditures compared to the 2019-
20 Adopted Budget:

City of High Point, North Carolina—FY 2020-21 Annual Budget
MM-3
FY 2020-21 MAJOR REVENUES CHALLENGES
The effects of COVID-19 on local government revenues in North Carolina and across the nation
are not fully known at this time. City staff has constantly monitored guidance from the State of
North Carolina, the North Carolina League of Municipalities, the North Carolina School of
Government and other local governments. The conventional wisdom is that the majority of
revenue decreases will be seen in sales tax collections. The pandemic slowed the economy
quickly and has decreased retail sales.
The initial projections suggest a 20% decrease in sales tax collections for the fourth quarter of
the previous fiscal year (April-June, 2020) and for the first quarter of the new fiscal year (July-
September 2020). On an annualized basis, this is projected as a 5.3% decrease for the fiscal
year. Due to the two month lag time between when sales tax is collected and when it is
reported and distributed to local governments, the actual impact is not known right away.
Property tax collections have historically been budgeted at 99.0%. Due to the economic climate
staff has reduced the collection rate to 98.4%. Additionally, the State has allowed registered
motor vehicle tax payments to be deferred for 5 months, which could cause these revenues to
drop as well. These revenues have not been waived, so the revenue will be recognized at some
point, it is just not known when the bills will be paid.
Other impacts to revenue are thought to be a decrease in electric and water usage, due to
business and industrial customers that have limited or ceased operation. The proposed budget
projects minimal decreases in usage and collection rates. These metrics will be measured on a
monthly basis throughout the fiscal year.
FY 2020-21 MAJOR REVENUES RECOMMENDATIONS
In order to address the budget challenges, the proposed budget requests a 1.0 cent property
tax rate increase, to 65.75 cents. This tax rate increase will increase taxes on a house with an
average home value of $136,831 by $13.68 annually, from $885.98 to $899.66 annually.
There is no rate increase for electric service, stormwater fees, garbage collection fees, or motor
vehicle fees. There are three proposed changes to fees in the proposed budget. A water-sewer
rate increase is proposed at 2.0%, effective October 1. This increase is designed to fund future
debt service needs for the long range bond financing plan for upgrades and improvements to
the water and sewer system. There are also changes to the landfill tipping fee schedule, which
are designed to recover costs associated with continuing to operate the landfill facility. The final
fee increase is the charge for insufficient funds in customer service, which is proposed to
increase from $25 to $35, in order to match industry standards.

City of High Point, North Carolina—FY 2020-21 Annual Budget
MM-4
FY 2020-21 EXPENDITURE CHALLENGES
Due to the decrease in revenues and the need to balance the budget, there are a number of
expenditure reductions that had to be made. The proposed budget includes recommendations
that were very difficult to make. The priority in any budget are public safety, services that we
are mandated to provide by state statute, addressing deferred maintenance, ensuring the fiscal
welfare of the City.
It is always difficult to recommend any type of change that results in a reduction in force for
employees. However, as a service organization in which the majority of our costs are from
personnel, managing through the current budget realities would be impossible without affecting
personnel.
The recommendation in this proposed budget is to close the High Point Museum and the
Morehead Recreation Center effective June 30, 2020. This is a difficult recommendation to
make, but both these facilities have very little use by the public. This budget also recommends
the closure of City Lake Pool for two seasons. These closures will result in the reduction of
force of 11 full time and 23 part time positions. These are the only positions that are
recommended to be eliminated in the proposed budget. Details of cost savings and other
expenditures are outlined below.
FY 2020-21 EXPENDITURE RECOMMENDATIONS
The needs, priorities and details of each fund are highlighted in detail throughout this
document. Below are the major expenditure recommendations included in the FY 2020-21
Proposed Budget:
• Closure of the High Point Museum and a reduction in force of nine full time and eight part time positions. The identified first year budget savings is $550,000.
• Closure of the Morehead Recreation Center and a reduction in force of 2 full time and 1 part time position for a savings of $230,000.
• Closure of City Lake Pool for two seasons due to uncertainty regarding the current pandemic and to facilitate redevelopment plans at the facility, saving $106,000 annually.
• Suspends the City’s 0%-4% Pay for Performance Program. Due to budgetary restrictions, this program is being replaced with a 1.0% cost of living adjustment effective mid year. The cost of this pay plan is approximately $520,000 citywide.
• Adds three full time positions citywide, a Diversity, Equity and Inclusion Specialist position and two apprentice positions at Fleet Maintenance to fulfill a commitment to the Guilford Apprentice Partners program.
• Decreases funding for redevelopment and blight removal efforts from $800,000 to $500,000.
• Elimination of the 1.0% 401k match that was established last year, at a savings of approximately $400,000.
• Elimination of the holiday bonus program for employees, which saves $223,507 annually.

City of High Point, North Carolina—FY 2020-21 Annual Budget
MM-5
FY 2020-21 EXPENDITURE RECOMMENDATIONS (continued)
• Targeted hiring freeze for the first six months of the fiscal year, which is anticipated to save approximately $1.16 million.
• Elimination of outside agency funding for a savings of $332,188.
• Reduction to citywide training budgets by $300,000.
• Reduction in fuel budgets to reflect lower fuel costs ($217,000) and a reduction in fleet vehicle replacements ($332,000).
• Defers the third year repayment of the twenty-year internal loan for the Catalyst Project land purchases. The deferred amount is $443,323.
• Eliminates outside agency funding amount of $349,688.
• Reduces Market Authority funding by $300,000 ($60,000 in FY 20 and $240,000 in FY 21).
• Reduced funding for Forward High Point downtown development group by $25,000, from $250,000 to $225,000.
• Continued investment of $2.45 million for neighborhood street resurfacing.
• Replaces $5.87 million in vehicles funded with a combination of pay-as-you-go funding ($4.0 million) and lease purchase funding ($1.845 million) from the Fleet division of the Central Services Fund. Planned fleet purchases include three dump trucks, a landfill compactor, two wheel loaders, one streetsweeper, ten police patrol cars, three automated refuse trucks, one rear loader refuse truck, one underground electric truck, and other necessary mid-sized sedan and light duty pickup truck replacements.
2020-21 MAJOR FUND SUMMARIES GENERAL FUND The 2020-21 General Fund Budget of $110,457,886 is $1,632,995 or 1.5% less than the
adopted 2019-20 budget of $112,090,881. The FY 2020-21 General Fund Budget is balanced
with current revenues. There is no use of appropriated fund balance for the proposed budget.
General Fund revenues and expenditures are summarized on the next page:

City of High Point, North Carolina—FY 2020-21 Annual Budget
MM-6
GENERAL FUND REVENUES Below is a summary of major General Fund revenue changes:
• Property tax revenues represent 56.5% or $62,459,148 of the total General Fund revenues. Property tax collections are projected to increase approximately $643,388 or 1.0%. The projected collections are based on a 1.0 cent change to the tax rate, from 64.75 cents to 65.75 cents, offset by a decrease in collections rates, from 99.4% to 99.0%.
• Sales tax revenues represent 26.0% or $28,692,077 of General Fund revenues and are projected to decrease approximately $1,567,923 or 5.2% due to retail sales tax declines associated with stay at home orders and business closures due to the COVID 19 pandemic.
• License and permit fees are projected to decrease $196,800 or 5.9% due primarily to decreased building activity.
• Charges for Services are decreasing approximately $109,884 or 2.3% due to anticipated Theatre and Parks and Recreation program closures.
• Miscellaneous Revenues decreasing $444,770 from the previous fiscal year due to decreased interest income.

City of High Point, North Carolina—FY 2020-21 Annual Budget
MM-7
TAX RATE AND COLLECTIONS
The proposed FY 2020-21 tax rate is 65.75 cents, a 1.0 cent increase from the Fiscal Year
2019-20 rate. This is the first proposed tax rate increase in eight years. The value of one cent in
tax rate will produce approximately $1.0 million of revenue. The total adopted tax rate is
divided between the General Fund and the General Debt Service Fund. The General Fund
receives 62.35 cents, and the General Debt Service Fund receives 3.4 cents.
A collection rate of 98.4% is planned for the proposed tax year collections. This has been
lowered from 99.0% due to the uncertainty with the economic impact of the COVID virus.
ASSESSED PROPERTY VALUES The combined total assessed valuation estimates for our four County taxing authorities are
$9.997 billion for FY 2020-21, for a 1.5% increase over our previous year estimates. Below is
a chart of our historic assessed value history:
City of High Point, North Carolina—FY 2020-21 Annual Budget
MM-8
SALES TAX The sales tax category includes sales tax related to retail sales, utility sales tax, Room
occupancy tax and rental vehicle tax. Due to the current economic climate related to the
pandemic, FY 2020 sales taxes are expected to decline by 3.9% or $1.19 million from budget,
and FY 2021 sales taxes are projected to decline 5.2% or $1.57 million from the current fiscal
year budget. Below is a chart of our historic sales tax history:
GENERAL FUND EXPENDITURES Below is a summary of major General Fund expenditure changes:
• Personnel services are increasing $883,396 or 1.1% to fund a 1% mid year cost of living increase, a 5.72% mid-year increase to city funded health insurance premiums. The General Fund budget includes one new position, a Diversity, Equity and Inclusion Specialist.
• There were a number of personnel reductions in the General Fund budget, including a reduction in force due to the closure of the High Point Museum, Morehead Recreation Center and closure of City Lake Pool for 2 seasons, the elimination of the 1% 401k matching program, elimination of the employee holiday bonus, a 6 month targeted hiring freeze.
• Operating expenditures are decreasing $1,781,100 or 8.0%, primarily due to a elimination of outside agency funding, reductions in fleet replacement and fuel budgets, and reductions to training budgets.
• Capital outlay is budgeted at $72,933, a decrease of $52,000 from the previous year.
• Debt service related to short term operating financing for capital equipment is decreasing by $13,446 or 1.3%.

City of High Point, North Carolina—FY 2020-21 Annual Budget
MM-9
WATER AND SEWER FUND The $71,084,978 Water and Sewer Fund Budget for 2020-21 represents a 27.2% or
$15,193,393 increase from the 2019-2020 adopted budget, as summarized below:
WATER AND SEWER FUND REVENUES Below is a summary of Water and Sewer revenue changes:
• Charges for Services are proposed to increase $2,263,676 or 4.2% due to a water and sewer rate increase of 2.0% on October 1, 2020 and projected increases in budgeted usage.
• Miscellaneous revenues are projected to increase $400,890 or 47.2% due to installation of generators in facilities and peak shaving rebates.
• Intergovernmental revenue decreasing due to refunding of bonds that previously received a Federal subsidy.
• The large increase in fund balance appropriation is in line with the long range capital financing plan to cash fund $15,233,000 in projects with available fund balance, rather than debt funding.

City of High Point, North Carolina—FY 2020-21 Annual Budget
MM-10
WATER AND SEWER RATES
The 2020-21 Water and Sewer Fund includes a 2.0% water and sewer rate increase effective
October 1, 2020. This rate increase is lower than what is outlined in the long-range capital
financing plan that has been developed by Davenport & Company. This plan calls for annual
rate increases between the 3.0% to 5.0% range to pay for this critical infrastructure
development. This strategy was adopted in the early 2000s to avoid some of the 15-22% rate
increases that were needed due to lack of proper long range planning.
Below is a history of water and sewer rate increases: Water and sewer revenue rates are a critical component of funding the operation, maintenance
and needed capital improvements for water treatment facilities and distribution lines, and for
wastewater collection lines and treatment systems. Property taxes are not used to finance
water and sewer utility services.
WATER AND SEWER FUND EXPENDITURES Below is a summary of Water and Sewer Fund expenditures:
• Personnel Services is increasing $384,236 or 3.7% due to a 1% mid year cost of living increase, a retirement system mandatory increase and a 5.72% mid year health insurance rate increase.
• Operating expenses are increasing $400,401 or 3.1% primarily due to increased electric,
chemical and supply costs. • Pay as you go capital is increasing by $14,208,330 due to a planned draw down of excess
fund balance to cash fund capital projects.

City of High Point, North Carolina—FY 2020-21 Annual Budget
MM-11
ELECTRIC FUND
The 2020-21 Electric Fund Budget of $133,426,560 represents a 1.4% or $1,815,8072 increase
from the 2019-20 adopted budget. There is no change planned to the current rate structure with
the proposed budget, but a rate study will soon be completed and will guide the city in
determining future rates.
Wholesale power cost for FY 2020-21 is budgeted at $96,037,800, which is the single largest
expense in the Electric Fund and citywide budget.
The budget plan continues to invest funds to maintain electric infrastructure, and includes
$11,561,500 in major capital projects. These routine capital investments are necessary to
maintain efficient and ongoing operation of the Electric System.

City of High Point, North Carolina—FY 2020-21 Annual Budget
MM-12
CAPITAL IMPROVEMENT PROGRAM
Capital investments and reinvestments are critical elements in the City’s total financial program.
Capital improvements are financed by one of four basic methods.
The first method involves the issuance of voter approved general obligation bonds generally
backed and paid by property taxes. The second method is a slight variation of the first, and
allows the City to issue small amounts of what are known as two-thirds general obligation
bonds from time-to-time that do not require tax increases or voter approval. The third method
involves revenue bonds, backed and paid by revenues from our water and sewer and our
stormwater system. Revenue bonds do not require voter approval. Both general obligation and
revenue bond financing involve principal, interest and cost of issuance expenses. The fourth
method is pay-as-we-go capital financing. The pay-as-we-go alternative, developed and
expanded in the past ten years, allows us to finance needed capital improvements from current
revenues, grants and other funds, thereby avoiding the additional and higher cost associated
with the issuance and financing of long-term debt.
The City has engaged Davenport & Company, LLC of Richmond, Virginia as our financial
advisor since 2003. Davenport has assisted the City with general obligation and revenue bond
planning and modeling, financial policies, rating agency strategies and interactions, bond
issuance, investment analysis, and bond refunding analysis.
Capital investments are necessary for a city to replace existing infrastructure and to invest in
new infrastructure. Debt financing of this infrastructure is a sound financial strategy as long as
the borrowing is done in a strategic and conservative manner. Local policies are in place to
ensure that borrowing is done responsibly, and oversight of our borrowing practices are in place
through the Local Government Commission. The City is well prepared to address replacement
of existing infrastructure to meet and provide for future growth and development.
GENERAL OBLIGATION BONDS General obligation bonds are a common type of municipal bond that are secured by the full faith
and credit of the tax rate to repay bond holders. This debt instrument was used to fund the
2004 bond authorization, and will be used to fund the $50.0 million authorization that was
approved by voters in 2019. The authorization is for the following uses:
• Streets and Sidewalks - $22,000,000
• Parks and Recreation - $21,500,000
• Housing - $6,500,000 These bonds will be issued in the coming fiscal years.

City of High Point, North Carolina—FY 2020-21 Annual Budget
MM-13
TWO–THIRDS GENERAL OBLIGATION BONDS
Two-thirds bonds are State authorized General Obligation bonds that may be issued without
voter approval. The statute allows a local government to issue up to 2/3 of the amount of GO
bonds that were paid off in the previous year. These bonds can be used for any other general
obligation purpose other than the financing of auditoriums, coliseums, arenas, stadiums, civic
centers or convention centers, art galleries, museums, historic properties, public transportation
systems, cable television systems or redevelopment projects.
WATER/SEWER REVENUE BONDS
Revenue bonds are municipal bonds that finance income-producing projects that are secured
by a specified revenue source, such as water and sewer or stormwater rates. Revenue bonds
are issued by the government agency for operations that run in the manner of a business, with
operating revenues and expenses, such as our Water & Sewer Fund. The pledge to repay the
bond is guaranteed by the rates of the Water & Sewer Fund.
Over the next five years, staff has identified an estimated $139.8 million in additional major
water and wastewater bond projects. The capital improvement plan anticipates cash funding of
$53.3 million and debt funding $86.5 million in water and sewer projects.
BOND AGENCY RATINGS
The City’s capacity to finance and pay for needed improvements is evaluated from time to time
by the following rating agencies: Moody’s Investment Services, Standard & Poor’s, and Fitch
Ratings. Protecting and enhancing our bond ratings is one of our highest priorities.
The City has seen a series of bond rating upgrades since 2003, including the addition of a AAA
bond rating assignment by Standard & Poor’s. The City’s bond ratings were re-affirmed in
conjunction with our bond sale in October 2018, and Moody’s re-affirmed their ratings in May
2019.
City of High Point, North Carolina—FY 2020-21 Annual Budget
MM-14
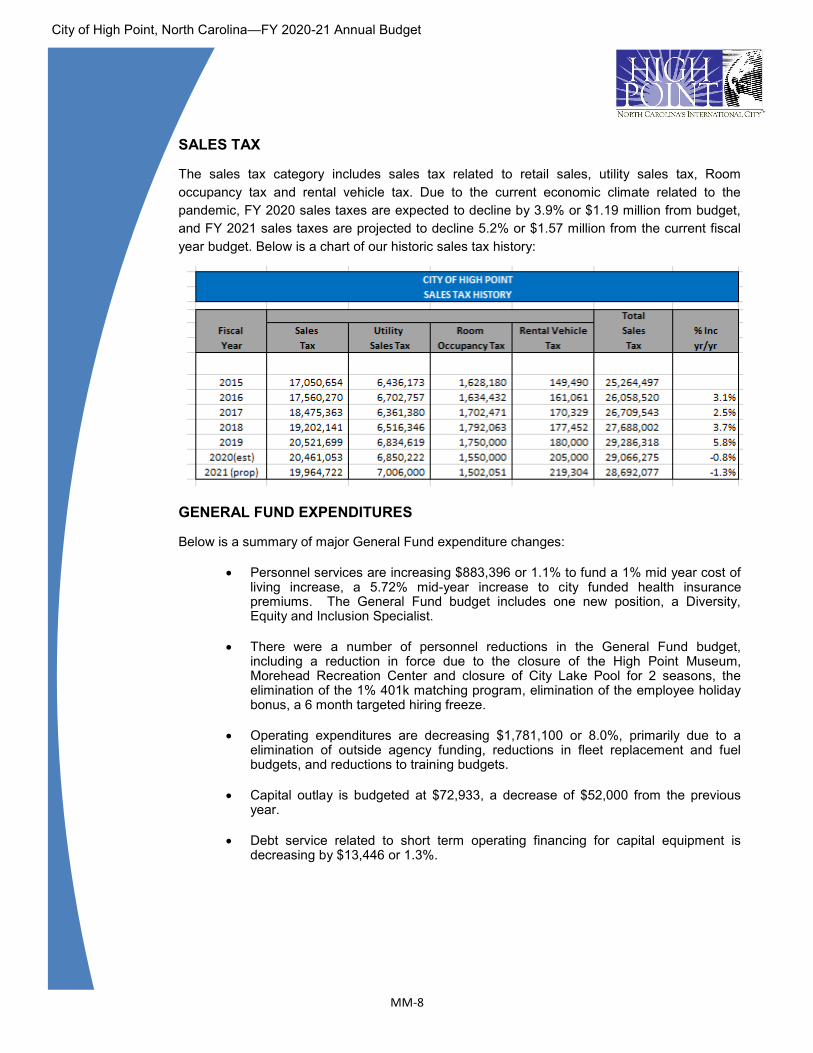
PAY-AS-WE-GO FINANCING The City has made a commitment to fund a healthy level of pay-as-we-go financing for routine
improvements, infrastructure maintenance, and grant matches of capital projects funded from
state and federal grant programs. Below is a summary of pay-as-we-go projects in each fund.
GENERAL FUND PAY-AS-WE-GO General Fund pay-as-we-go capital investments for FY 2020-21 are budgeted at 4,055,563.
The pay-as-we-go investments in the General Fund include:
Street Resurfacing $2,517,630 Fire Station Generators 66.933 Oak Hollow Lake Bulkheads 257,000 Appling Way improvements 1,000,000 Batter’s Eye at Stadium 130,000 Stadium bridge hydraulics 84,000
General Fund Total $4,055,563
WATER AND SEWER PAY-AS-WE-GO Water and Sewer pay-as-we-go capital reinvestments are budgeted at $7,660,000. A list of
2020-21 Water and Sewer pay-as-we-go investments are shown below:
Replace Obsolete Neighborhood Water Lines $820,000 Replace Obsolete Neighborhood Sewer Lines 1,500,000 Catalyst project 1,150,000 Appling Way 300,000 Pre-heat Burner 500,000 Burton Road 2,160,000 Arc Flash 100,000 Watershed Protection Plan 150,000 Eastside Catwalks 300,000 Eastside UV System Upgrade 380,000 Alum Sludge Removal 200,000 Water System Improvements 50,000 Sewer System Improvements 50,000
Water & Sewer Total $7,660,000
There is an additional $15,000,000 in appropriated fund balance being transferred from the
Water and Sewer operating fund to the capital projects fund in conjunction with the capital
financing long range plan.

City of High Point, North Carolina—FY 2020-21 Annual Budget
MM-15
ELECTRIC PAY-AS-WE-GO The Electric pay-as-we-go projects are budgeted at $7,667,500. Projects include:
Triangle Lake widening 750,000
Automated Meter Reading 1,500,000 S. Main/Bus. 85 project 300,000
Deep River transformer 1,457,500 Fairfield transformer 750,000 Outdoor Lighting 200,000 Downtown underground 200,000 Underground subdivision replacement 600,000 Street lighting 300,000 Technology conversion 310,000 Fiber replacement 500,000 Washington Street project 150,000 Breaker replacement 550,000 Overhead conversion 100,000 Electric Capital Total $7,667,500
SOLID WASTE PAY-AS-WE-GO
The Solid Waste pay-as-we-go budget is $2,896,000. The projects planned are:
Truck Wash $175,000 Landfill land purchase 50,000 Kersey Valley Landfill Ph VI expansion 1,000,000 MRF Ongoing maintenance 50,000 KV Phase I-IV reserve 171,000 Landfill Capital Total $1,446,000
OTHER PAY-AS-WE-GO The $5,244,965 in other 2020-21 pay-as-we-go investments includes the scheduled
replacement of vehicles, normal computer and radio replacements, routine stormwater projects,
and others outlined below:
Fleet Replacement Program $4,028,000 Fleet shop equipment 21,550 Parking Facility improvements 175,000 Stormwater routine projects 450,000 Stormwater – Catalyst area 450,000 Computer System Replacements 120,415 Other Capital Total $ 5,244,965

City of High Point, North Carolina—FY 2020-21 Annual Budget
MM-16
FUND BALANCES/RETAINED EARNINGS
Fund balances and retained earnings are critical, but often misunderstood and overlooked part
of the Annual Budget. Fund balances and retained earnings consist of unencumbered and
unappropriated monies. They are essential for maintaining our strong bond ratings as well as
maintaining positive year-round and year-to-year cash flows. Strong fund balances are
essential as we plan ahead for subsequent budgets.
The North Carolina Local Government Commission recommends maintaining an 8.0% balance
in each fund. This is necessary for maintaining positive year-round cash flows, reducing the
need for short term borrowing, and assisting in maintaining investment grade bond rating.
The High Point City Council adopted Fiscal Policy calls for a minimum 10.0% fund balance of
estimated expenditures as a signal of financial strength and fiscal stability. The City of High
Point applies the policy to all operating funds except the Water-Sewer Fund, which calls for a
50% fund balance, and the Economic Development, General Debt, and General Capital Project
funds, which are covered by more specific strategic plans.
The table below summarizes changes in annual fund balances/retained earnings, including
early estimates for June 30, 2020:

City of High Point, North Carolina—FY 2020-21 Annual Budget
MM-17
STRATEGIC PLAN
In March of 2016, the City Council developed a strategic plan, which has been reaffirmed and
expanded by the current City Council. The strategic plan has guided the last several budgets,
but the fiscal realities related to the current economic crisis have limited the amount of funding
we can devote to these activities. As a reminder, the initial goals are below:
• Increase the population of active, engaged, and entrepreneurial and working young
professionals living in High Point by 25%
• 100% proactive enforcement of codes
• Create a downtown catalyst project that produces:
• 500 private sector jobs
• 15-20 new restaurants and shops
• 250 additional housing units
• A centralized gathering place
The City Council met in February, 2020 and added three new short term goals:
• Design a marketing campaign focused on diverse groups, events and quality of life
• Select target neighborhood and coordinate necessary city departments to implement
holistic strategy
• Recruit 50 new office jobs and 5 new investors for catalyst project
The hope is that the economic climate rebounds quickly, so more time and resources can be
focused on these short term goals.
CONCLUSION
This has been a tremendously difficult budget to prepare, and I hope that we can reconvene
sometime in the near future with better economic news and the ability to restore funding to
some of the programs that had to be reduced or eliminated. I hope that all citizens understand
that the recommendations within this budget were made with understanding of the impact to
people’s lives and the impact to providing services to our citizens.
I want to acknowledge all of the staff members who assist in the preparation of this policy
document. The efforts and professionalism of Eric Olmedo, Greg Ferguson, Bobby Fitzjohn,
Laura Altizer, Roslyn McNeill, Linda Price, Cindy Smith, Amy Meyers and the rest of our
executive team are appreciated. I also thank the Mayor and City Council for your leadership
and commitment to the City of High Point.
Respectfully submitted,
Randy McCaslin Interim City Manager
The Summaries/Analysis section contains charts, graphs, summary tables, and discussions of the City's revenues and expenses for fiscal year 2020-2021 with historical data for comparison purposes.
The Consolidated Summary of Revenues and Expenditures that begins this section is a summary of total revenues and expenses by fund by major revenue and expense category. Following this summary, the section is divided into revenue and expense information, personnel summaries, and outstanding debt information.
- 1 -
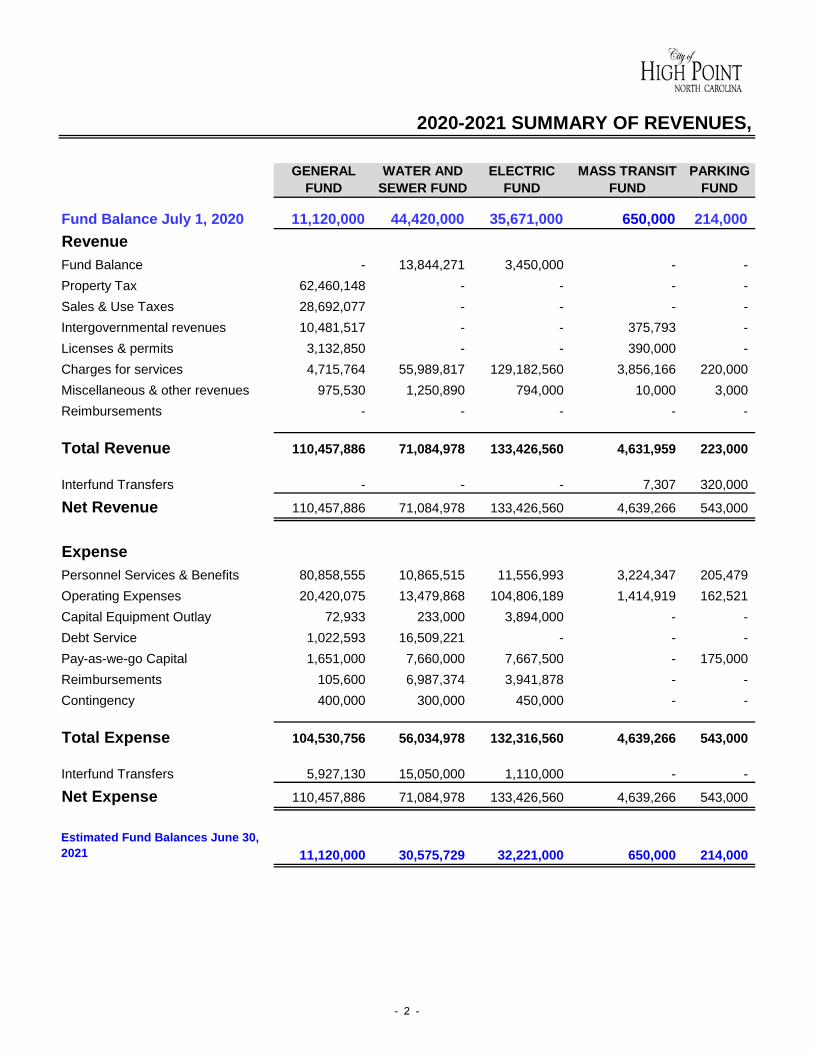
GENERAL WATER AND ELECTRIC MASS TRANSIT PARKINGFUND SEWER FUND FUND FUND FUND
Fund Balance July 1, 2020 11,120,000 44,420,000 35,671,000 650,000 214,000 RevenueFund Balance - 13,844,271 3,450,000 - -
Property Tax 62,460,148 - - - -
Sales & Use Taxes 28,692,077 - - - -
Intergovernmental revenues 10,481,517 - - 375,793 -
Licenses & permits 3,132,850 - - 390,000 -
Charges for services 4,715,764 55,989,817 129,182,560 3,856,166 220,000
Miscellaneous & other revenues 975,530 1,250,890 794,000 10,000 3,000
Reimbursements - - - - -
Total Revenue 110,457,886 71,084,978 133,426,560 4,631,959 223,000
Interfund Transfers - - - 7,307 320,000
Net Revenue 110,457,886 71,084,978 133,426,560 4,639,266 543,000
ExpensePersonnel Services & Benefits 80,858,555 10,865,515 11,556,993 3,224,347 205,479
Operating Expenses 20,420,075 13,479,868 104,806,189 1,414,919 162,521
Capital Equipment Outlay 72,933 233,000 3,894,000 - -
Debt Service 1,022,593 16,509,221 - - -
Pay-as-we-go Capital 1,651,000 7,660,000 7,667,500 - 175,000
Reimbursements 105,600 6,987,374 3,941,878 - -
Contingency 400,000 300,000 450,000 - -
Total Expense 104,530,756 56,034,978 132,316,560 4,639,266 543,000
Interfund Transfers 5,927,130 15,050,000 1,110,000 - -
Net Expense 110,457,886 71,084,978 133,426,560 4,639,266 543,000
Estimated Fund Balances June 30, 2021 11,120,000 30,575,729 32,221,000 650,000 214,000
2020-2021 SUMMARY OF REVENUES,
- 2 -

Fund Balance July 1, 2020RevenueFund Balance
Property Tax
Sales & Use Taxes
Intergovernmental revenues
Licenses & permits
Charges for services
Miscellaneous & other revenues
Reimbursements
Total Revenue
Interfund Transfers
Net Revenue
ExpensePersonnel Services & Benefits
Operating Expenses
Capital Equipment Outlay
Debt Service
Pay-as-we-go Capital
Reimbursements
Contingency
Total Expense
Interfund Transfers
Net Expense
Estimated Fund Balances June 30, 2021
SOLID WASTE STORMWATER SPECIAL OTHER TOTAL FUND FUND REVENUE FUNDS ALL FUNDS
5,034,000 4,570,000 - 18,463,000 120,142,000
- 411,369 - 1,291,535 18,997,175
- - - 3,381,700 65,841,848
83,000 - - 400,000 29,175,077
- - 5,591,578 88,000 16,536,888
- - - 1,700,000 5,222,850
16,736,500 5,273,950 - 29,815,345 245,790,102
91,000 125,000 798,630 6,265,308 10,313,358
- - - - -
16,910,500 5,810,319 6,390,208 42,941,888 391,877,298
221,000 - 534,273 21,262,050 22,344,630
17,131,500 5,810,319 6,924,481 64,203,938 414,221,928
5,943,334 1,660,434 932,652 20,618,037 135,865,346
7,818,086 1,295,793 5,895,983 12,110,800 167,404,234
17,000 - - 6,014,965 10,231,898
- 1,255,423 95,846 10,791,636 29,674,719
446,000 1,130,000 - 14,668,500 33,398,000
1,100,300 315,669 - - 12,450,821
- - - - 1,150,000
15,324,720 5,657,319 6,924,481 64,203,938 390,175,018
1,806,780 153,000 - - 24,046,910
17,131,500 5,810,319 6,924,481 64,203,938 414,221,928
5,034,000 4,158,631 - 17,171,465 101,144,825
EXPENDITURES & ESTIMATED FUND BALANCES
- 3 -

Fiscal Year
General Government
Public Safety
Public Services
Cultural & Recreation
Gen. Debt Service Total
Percent Change
80,023,517
2010 27,751,705 41,856,008 22,144,426 20,049,626 9,697,452 121,499,217 4%
2011 26,245,111 41,942,128 17,674,426 18,348,122 11,250,426 115,460,213 -5%
2012 24,112,637 43,019,604 20,704,623 18,917,317 11,102,319 117,856,500 2%
2013 26,268,525 44,632,915 25,697,647 19,230,604 10,641,678 126,471,369 7%
2014 25,809,635 45,525,308 21,738,446 18,653,916 10,856,610 122,583,915 -3%
2015 20,393,051 45,682,145 11,974,234 18,601,744 9,709,082 106,360,256 -13%
2016 20,720,943 49,384,806 14,388,862 19,526,652 9,473,311 113,494,574 7%
2017 22,280,382 50,213,647 13,952,788 24,915,589 9,831,397 121,193,803 7%
2018 30,293,885 53,167,743 17,359,525 43,824,221 8,670,500 153,315,874 27%
2019 29,129,832 56,755,318 16,481,731 53,386,599 9,657,959 165,411,439 8%
Source: The above statistics are from the City of High Point Comprehensive Annual Financial Report
TOTAL GOVERNMENT SPENDING BY FUNCTION
Includes General, Special Revenue, Capital Projects, and Debt Service Funds; excludes Other Financing Uses
-
20
40
60
80
100
120
140
160
180
2010 2011 2012 2013 2014 2015 2016 2017 2018 2019
Mill
ions
Trends in General Government Expenditures
General Government Public Safety Public Services Cultural & Recreation Gen. Debt Service
- 4 -
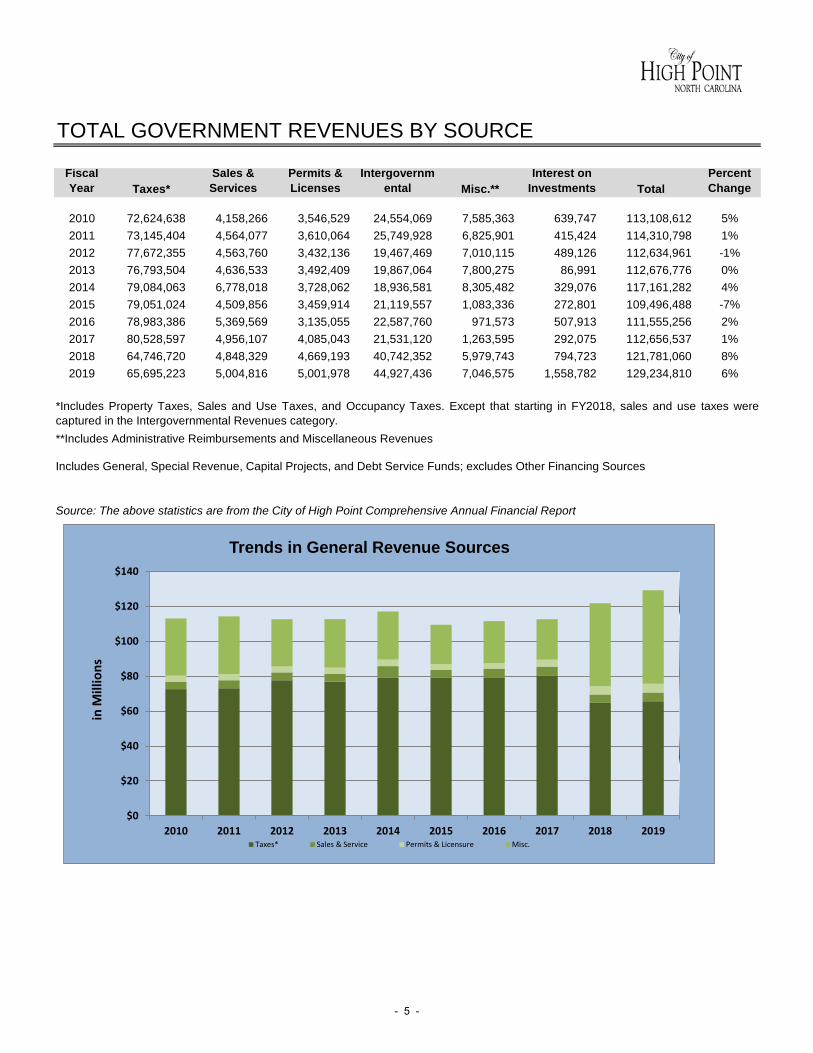
Fiscal Year Taxes*
Sales & Services
Permits & Licenses
Intergovernmental Misc.**
Interest on Investments Total
Percent Change
2010 72,624,638 4,158,266 3,546,529 24,554,069 7,585,363 639,747 113,108,612 5%
2011 73,145,404 4,564,077 3,610,064 25,749,928 6,825,901 415,424 114,310,798 1%
2012 77,672,355 4,563,760 3,432,136 19,467,469 7,010,115 489,126 112,634,961 -1%
2013 76,793,504 4,636,533 3,492,409 19,867,064 7,800,275 86,991 112,676,776 0%
2014 79,084,063 6,778,018 3,728,062 18,936,581 8,305,482 329,076 117,161,282 4%
2015 79,051,024 4,509,856 3,459,914 21,119,557 1,083,336 272,801 109,496,488 -7%
2016 78,983,386 5,369,569 3,135,055 22,587,760 971,573 507,913 111,555,256 2%
2017 80,528,597 4,956,107 4,085,043 21,531,120 1,263,595 292,075 112,656,537 1%
2018 64,746,720 4,848,329 4,669,193 40,742,352 5,979,743 794,723 121,781,060 8%
2019 65,695,223 5,004,816 5,001,978 44,927,436 7,046,575 1,558,782 129,234,810 6%
Source: The above statistics are from the City of High Point Comprehensive Annual Financial Report
TOTAL GOVERNMENT REVENUES BY SOURCE
Includes General, Special Revenue, Capital Projects, and Debt Service Funds; excludes Other Financing Sources
**Includes Administrative Reimbursements and Miscellaneous Revenues
*Includes Property Taxes, Sales and Use Taxes, and Occupancy Taxes. Except that starting in FY2018, sales and use taxes were
captured in the Intergovernmental Revenues category.
$0
$20
$40
$60
$80
$100
$120
$140
2010 2011 2012 2013 2014 2015 2016 2017 2018 2019
in M
illio
ns
Trends in General Revenue Sources
Taxes* Sales & Service Permits & Licensure Misc.
- 5 -

WHERE THE MUNICIPAL DOLLAR ORIGINATES
All Funds
Utility Fees Electric Fees, Water and Sewer Fees
Property Tax General Fund Property Tax, Bond Property Tax
Charges for Services Charges for Services from General, Central Services, Transit, Parking, SolidWaste and Stormwater Funds, and Miscellaneous Revenues
Interfund Charges Other Financing Sources
Intergovernmental Revenues
Revenues from Federal, State and other Local jurisdictions
Sales and Use Tax/Licenses and Fees
Sales Tax, Vehicle Tax, Room Occupancy Tax, Licenses, Permits, Inspections,Library Fines, and other Miscellaneous Fees
Appropriated Fund Balance Fund Balances
17% Charges for Services 4% Intergovernmental Revenues
8% Sales & Use Tax/ Licenses & Fees
45% Utility Fees
6% Interfund Charges 16% Property Tax
4% Appropriated Fund Balance
- 6 -

ESTIMATED CHANGES IN FUND BALANCES Fund Balance represents the excess of a fund's assets and revenues over its liabilities, reserves, and expenditures at the close of the fiscal year. The North Carolina Local Government Commission (LGC) recommends that units of government maintain a minimum fund balance in their operating funds of 8% of estimated expenditures. This level has been determined to be the equivalent of one month’s expenditures and is generally regarded as a minimum level to avoid cash flow interruptions, generate interest income, reduce the need for short-term borrowings, and assist in maintaining investment grade bond ratings. The High Point City Council-adopted Fiscal Policies maintain minimum fund balances at 10% of estimated expenditures as a signal of financial strength and fiscal stability. The City of High Point applies the policy to all operating funds except the Economic Development, General Debt, and General Capital Project funds as they are covered by more specific strategic plans. A summary of fund balances and estimated changes therein are shown below:
ESTIMATED ESTIMATED FUND FY 2020-21 FUND RESERVE AMOUNT ABOVEACTUAL BALANCE APPROPRIATED BALANCE BALANCE PROPOSED BALANCE % OF MINIMUM
FUND JUNE 30, 2019 JUNE 30, 2020 FY 2020-21 JUNE 30, 2021 POLICY EXPENDITURES MINIMUM EXPENDITURES FUND BALANCE
GENERAL 11,955,416 11,120,000 - 11,120,000 10% 110,457,886 11,045,789 10.1% 74,211 GENERAL DEBT 13,142,389 11,892,000 - 11,892,000 50% 9,726,260 4,863,130 122.3% 7,028,870 ECONOMIC DEV. 1,332,344 2,004,000 - 2,004,000 n/a 500,000 n/a n/a n/aCENTRAL SERVICE 5,046,844 4,567,000 904,057 3,662,943 n/a 15,917,044 n/a n/a n/aWATER & SEWER 40,948,248 44,420,000 13,844,271 30,575,729 50% 48,424,978 24,212,489 63.1% 6,363,240 ELECTRIC 33,523,270 35,671,000 3,450,000 32,221,000 10% 124,649,060 12,464,906 25.8% 19,756,094 ELECT. RATE STABIL. 19,447,152 44,041,184 - 44,041,184 n/a - - n/a n/aMASS TRANSIT 652,819 650,000 - 650,000 10% 4,639,266 463,927 14.0% 186,073 PARKING 174,376 214,000 - 214,000 10% 368,000 36,800 58.2% 177,200 SOLID WASTE 4,534,166 5,034,000 - 5,034,000 10% 15,324,720 1,532,472 32.8% 3,501,528 STORMWATER 7,436,767 4,570,000 411,369 4,158,631 10% 5,427,319 542,732 76.6% 3,615,899 TOTAL 138,193,791 164,183,184 18,609,697 145,573,487 335,434,533 55,162,245 43.4% 40,703,115
CITY OF HIGH POINTFUND BALANCE AVAILABLE FOR APPROPRIATION
- 7 -

FY 2019 FY2020 FY 2021 % BudgetACTUAL BUDGET PROPOSED CHANGE CHANGE
GENERAL FUND Taxes
Ad valorem taxes-current year 54,335,013 56,040,750 56,443,909 403,159 0.7%
Ad valorem taxes-prior years 502,982 630,000 546,435 (83,565) -13.3%
Penalty and interest 248,930 365,000 270,851 (94,149) -25.8%
Tax Rebates/discounts (187,104) (181,500) (262,939) (81,439) 44.9%
Registered Motor Vehicle Taxes 4,936,253 4,961,510 5,461,892 500,382 10.1%
Sales Taxes 20,521,699 21,075,000 19,964,722 (1,110,278) -5.3%
Utility Sales Tax 6,834,619 7,150,000 7,006,000 (144,000) -2.0%
Room Occupancy Tax 1,965,800 1,850,000 1,502,051 (347,949) -18.8%
Rental Vehicle Tax 215,076 185,000 219,304 34,304 18.5%
Total Taxes 89,373,268 92,075,760 91,152,225 (923,535) -1.0%
Intergovernmental Revenues
Utility franchise tax 584,301 715,000 500,000 (215,000) -30.1%
Beer and wine tax 481,651 535,000 486,468 (48,532) -9.1%
ABC Shared Revenue 1,799,869 1,675,000 1,850,502 175,502 10.5%
ABC mixed beverage tax 165,812 150,000 182,000 32,000 21.3%
Powell Bill 2,897,350 2,944,473 3,045,537 101,064 3.4%
Video Programming Fee 902,509 987,028 959,573 (27,455) -2.8%
Guilford County - Library 359,960 359,960 359,960 - 0.0%
County-Colfax/Deep River Fire 360,434 330,000 350,000 20,000 6.1%
Guilford County-SROs 532,240 535,000 535,000 - 0.0%
Payment in lieu of Taxes-Electric 897,139 915,892 940,922 25,030 2.7%
Other intergovernmental revenues 1,503,073 1,292,173 1,271,555 (20,618) -1.6%
Total Intergovernmental Revenues 10,484,338 10,439,526 10,481,517 41,991 0.4%
Licenses and permits
Privilege licenses 75,064 125,000 85,000 (40,000) -32.0%
Building Inspection permits 1,494,633 1,383,000 1,235,000 (148,000) -10.7%
Vehicle User Fee 1,174,056 1,250,000 1,250,000 - 0.0%
Library Fees 44,704 50,000 50,000 - 0.0%
Other licenses and fees 505,680 521,650 512,850 (8,800) -1.7%
Total Licenses and Permits 3,294,137 3,329,650 3,132,850 (196,800) -5.9%
Charges for services
Recreation programs 2,846,853 3,022,100 2,794,920 (227,180) -7.5%
Other services 2,086,640 1,803,545 1,920,844 117,299 6.5%
Total Charges for Services 4,933,493 4,825,645 4,715,764 (109,881) -2.3%
Interest income 735,208 750,000 250,000 (500,000) -66.7%
Miscellaneous revenues 1,897,039 670,300 725,530 55,230 8.2%
Installment Financing 5,155,000 - - - 0.0%
Fund balance appropriated - - - - 0.0%
Total General Fund Revenues 115,872,483 112,090,881 110,457,886 (1,632,995) -1.5%
SPECIAL GRANTS FUNDLocal, State, Federal Grants 6,389,199 3,690,869 3,542,960 (147,909) -4.0%Community Development Block Grant
Program 1,571,334 3,033,396 2,847,248 (186,148) -6.1%
Grants Interfund Transfer 789,374 420,675 534,273 113,598 27.0%
Total Special Grants Fund Revenue 8,749,907 7,144,940 6,924,481 (220,459) -3.1%
ANALYSIS OF REVENUE SOURCES
- 8 -

FY 2019 FY2020 FY 2021 % BudgetACTUAL BUDGET PROPOSED CHANGE CHANGE
ANALYSIS OF REVENUE SOURCES
ECONOMIC DEV. INCENTIVE FUNDNet Economic Development Fund 53,727 325,000 100,000 (225,000) -69.2%
Economic Development Interfund Transfer 475,000 475,000 400,000 (75,000) -15.8%
Total Economic Dev. Incentive Fund 528,727 800,000 500,000 (300,000) -37.5%
INSURANCE RESERVE FUND 17,294,776 19,691,335 20,157,134 465,799 2.4%
GENERAL DEBT SERVICE FUNDNet General Debt Service Fund 4,316,262 5,426,539 4,732,710 (693,829) -12.8%
General Debt Service Fund Transfer 793,000 4,993,550 4,993,550 - 0.0%
Total General Debt Service Fund 5,109,262 10,420,089 9,726,260 (693,829) -6.7%
GENERAL CAPITAL PROJ FUNDNet General Capital Projects Fund - - - - 0.0%
2,330,323 2,253,323 1,651,000 (602,323) -26.7%
2,330,323 2,253,323 1,651,000 (602,323) -26.7%
INTERNAL SERVICE FUNDS 17,037,154 15,046,595 15,917,044 870,449 5.8%
WATER-SEWER FUNDResidential Sales 31,703,934 32,534,239 33,995,840 1,461,601 4.5%
City Sales 493,156 539,710 563,956 24,246 4.5%
Industrial Sales 3,208,535 3,400,969 3,553,757 152,788 4.5%
Commercial Sales 12,658,780 12,845,709 13,362,655 516,946 4.0%
Irrigation Sales 1,622,579 1,670,936 1,746,004 75,068 4.5%
Other Charges for Services 2,756,676 2,734,578 2,767,605 33,027 1.2%
Miscellaneous & Other Revenues 2,434,418 1,248,689 1,250,890 2,201 0.2%
Retained Earnings Appropriated - 916,755 13,844,271 12,927,516 1410.1%
54,878,078 55,891,585 71,084,978 15,193,393 27.2%
2,699,196 8,383,550 7,660,000 (723,550) -8.6%
ELECTRIC FUNDResidential Sales 50,960,029 53,217,232 51,114,806 (2,102,426) -4.0%
Industrial Sales 16,163,566 16,346,415 16,914,191 567,776 3.5%
Commercial Sales 52,219,734 52,178,250 52,177,724 (526) 0.0%
Other Services 11,584,737 8,475,574 8,989,839 514,265 6.1%
Interest on Investments 1,306,819 1,100,000 780,000 (320,000) -29.1%
Retained Earnings Appropriated - 293,282 3,450,000 3,156,718 1076.3%
Total Electric Fund Revenue 132,234,885 131,610,753 133,426,560 1,815,807 1.4%
- 1,050,000 4,217,500 3,167,500 301.7%
MASS TRANSIT FUNDOperating Receipts 3,283,202 2,730,126 3,856,166 1,126,040 41.2%
Intergovernmental revenues 364,545 299,036 375,793 76,757 25.7%
Licenses & Permits 393,607 390,000 390,000 - 0.0%
Miscellaneous & Other Revenues 50,564 10,000 10,000 - 0.0%
Retained Earnings Appropriated - 789,475 - (789,475) -100.0%
ELECTRIC CAPITAL FUND
Total Water-Sewer Fund
WATER-SEWER CAPITAL FUND
General Capital Proj. Interfund Transfer
Total General Capital Projects Fund
- 9 -

FY 2019 FY2020 FY 2021 % BudgetACTUAL BUDGET PROPOSED CHANGE CHANGE
ANALYSIS OF REVENUE SOURCES
Total Net Mass Transit Fund Revenue 4,091,918 4,218,637 4,631,959 413,322 9.8%
Mass Transit Interfund Transfer 887,194 305,500 7,307 (298,193) -97.6%
Total Mass Transit Fund 4,979,112 4,524,137 4,639,266 115,129 2.5%
MASS TRANSIT CAPITAL FUND 801,899 570,000 110,000 (460,000) -80.7%
PARKING FUNDFees 271,561 277,000 220,000 (57,000) -20.6%
Interest on Investments 4,218 6,000 3,000 (3,000) -50.0%
Miscellaneous & Other Revenues - - - 0.0%
Retained Earnings Appropriated - - - - 0.0%
Total Net Parking Fund Revenue 275,779 283,000 223,000 (60,000) -21.2%
Parking Interfund Transfer 150,000 95,729 320,000 224,271 234.3%
Total Parking Fund Revenue 425,779 378,729 543,000 164,271 43.4%
SOLID WASTE FUNDTipping Fees 5,615,330 4,939,000 6,100,000 1,161,000 23.5%
Landfill User Fee 3,024,863 3,011,300 3,011,300 - 0.0%
Environmental Services Pick Up Fee 7,222,925 7,194,200 7,207,000 12,800 0.2%
Recycling Sales 451,901 450,000 350,000 (100,000) -22.2%
Interest on Investments 165,897 150,000 90,000 (60,000) -40.0%
Landfill State Excise Tax 82,820 71,000 83,000 12,000 16.9%
Miscellaneous Revenues 66,922 63,450 69,200 5,750 9.1%
Retained Earnings Appropriated - - - - 0.0%
Total Net Solid Waste Fund Revenue 16,630,658 15,878,950 16,910,500 1,031,550 6.5%
Solid Waste Interfund Transfer - 2,191,000 221,000 (1,970,000) -89.9%
Total Solid Waste Fund Revenue 16,630,658 18,069,950 17,131,500 (938,450) -5.2%
SOLID WASTE CAPITAL FUND - 25,000 1,175,000 1,150,000 4600.0%
STORMWATER FUNDStormwater Fees 5,225,889 5,225,998 5,239,000 13,002 0.2%
Interest on Investments 251,195 220,000 125,000 (95,000) -43.2%
Other Fees 53,716 8,956 33,950 24,994 279.1%
Miscellaneous Revenues 77,430 - 1,000 1,000 0.0%
Retained Earnings Appropriated - 1,169,292 411,369 (757,923) -64.8%
Total Net Stormwater Fund Revenue 5,608,230 6,624,246 5,810,319 (813,927) -12.3%
Stormwater Interfund Transfer - - - - 0.0%
Total Stormwater Fund Revenue 5,608,230 6,624,246 5,810,319 (813,927) -12.3%
STORMWATER CAPITAL FUND - 420,000 230,000 (190,000) -45.2%
MARKET AUTHORITY FUNDBusiness License 1,707,841 1,750,000 1,700,000 (50,000) -2.9%
Occupancy Tax 405,082 425,000 400,000 (25,000) -5.9%
Total Net Market Authority Fund Revenue 2,112,923 2,175,000 2,100,000 (75,000) -3.4%
Market Authority Interfund Transfer 1,000,000 1,000,000 760,000 (240,000) -24.0%
Total Market Authority Fund Revenue 3,112,923 3,175,000 2,860,000 (315,000) -9.9%
TOTAL REVENUE 388,293,392 398,170,113 414,221,928 16,051,815 4.0%
- 10 -

Total
Fiscal Year Residential Commercial Industrial Personal Public Service Assessed % Inc
Property Property Property Total Property Companies Value yr/yr
2006 3,481,796,314 2,491,980,410 942,275,410 6,916,052,134 1,372,316,382 117,923,262 8,406,291,778 0.9%
2007 3,615,085,429 2,530,768,578 942,311,760 7,088,165,767 1,409,442,958 122,178,728 8,619,787,453 2.5%
2008 3,778,859,150 2,729,035,922 994,596,450 7,502,491,522 1,441,055,968 131,332,066 9,074,879,556 5.3%
2009 4,231,853,123 2,408,171,911 1,005,788,880 7,645,813,914 1,452,697,393 131,984,351 9,230,495,658 1.7%
2010 4,279,155,000 2,483,747,575 1,008,165,180 7,771,067,755 1,417,186,050 131,456,290 9,319,710,095 1.0%
2011 n/a n/a n/a 7,682,834,650 1,402,419,615 129,766,404 9,215,020,669 ‐1.1%
2012 n/a n/a n/a 7,655,916,694 1,455,701,042 129,074,157 9,240,691,893 0.3%
2013 4,300,290,483 1,949,336,323 987,346,355 7,236,973,161 1,501,465,603 148,989,146 8,887,427,910 ‐3.8%
2014 4,315,429,943 2,149,860,980 969,318,600 7,434,609,523 1,489,840,190 128,387,727 9,052,837,440 1.9%
2015 4,397,388,367 1,872,215,206 977,839,178 7,247,442,751 1,555,428,785 126,857,380 8,929,728,916 ‐1.4%
2016 4,349,667,380 2,014,352,593 914,694,134 7,278,714,107 1,587,787,369 140,281,138 9,006,782,614 0.9%
2017 4,429,691,766 1,942,245,655 993,448,540 7,365,385,961 1,674,065,813 141,688,783 9,181,140,557 1.9%
2018 4,581,596,716 2,093,081,705 1,036,916,309 7,711,594,730 1,724,751,200 144,885,945 9,581,231,875 4.4%
2019 4,617,512,541 2,073,676,161 1,111,145,808 7,802,334,510 1,774,628,867 142,350,789 9,719,314,166 1.4%
2020 (est) 4,523,027,218 2,222,441,689 1,190,859,408 7,936,328,315 1,764,758,469 146,722,026 9,847,808,810 1.3%
2021 (est) 4,590,872,626 2,255,778,314 1,208,722,299 8,055,373,240 1,792,994,605 149,333,678 9,997,701,522 1.5%
Ten Largest Taxpayers - Fiscal Year Ending June 2019
Assessed % of TotalName Nature of Business Value Assessed ValueInternational Market Centers Home Furnishings Showroom 317,845,855 3.27%Ralph Lauren Distribution/Customer Service 90,906,610 0.94%Blue Ridge Companies Real Estate 68,325,468 0.70%Carolina Investment Properties Real Estate 63,485,500 0.65%Thomas Built Buses Bus Manufacturing 63,465,319 0.65%Liberty Property Trust Real Estate 62,093,557 0.64%North State Communications Communications Utility 53,339,839 0.55%EBSCO Real Estate 43,458,100 0.45%Sampson Marketing Home Furnishings Showroom 42,007,342 0.43%ThermoFisher Scientific Pharmaceutical Manufacturing 40,843,306 0.42%
TAX VALUES, RATES AND COLLECTIONSCITY OF HIGH POINT
ASSESSED VALUE HISTORY
REAL PROPERTY
- 11 -

WHERE THE MUNICIPAL DOLLAR GOES
All Funds
5% Transportation
16% Public Safety
8% Recreation/ Culture/Neighborhoods
10% General Government 25% Environmental Health
33% Electric 3% Debt Service/Other
Transfers
Electric Electric Fund
Public Safety Communications Center, Police, Fire, Building Inspections, Debt Service, Local Code Enforcement
Recreation/Culture/Neighborhoods Parks & Recreation, Library, Theatre, Outside Agencies, Debt Service, Planning & Development, Economic Development, Community Development, Market Authority
General Government Governing Body, City Management, City Attorney, Budget and Evaluation, Human Relations, Engineering, Information Technology Services, Human Resources, Financial Services, Special Appropriations, Debt Service
Transportation Transportation, Street Maintenance, Debt Service, Transit, Parking
Debt Service/Reimbursements Reimbursement, Contingency, Debt Service, Internal Service Funds, Special Grants Fund
Environmental Health Water and Sewer, Solid Waste, Stormwater, Public Services except Street Maintenance
- 12 -

FY 2019 FY 2020 FY 2021 % BUDGETACTUAL BUDGET PROPOSED CHANGE CHANGE
GENERAL FUNDGoverning Body City Council 448,754 469,538 494,408 24,870 5.3%
City Clerk 185,757 209,490 213,635 4,145 2.0%
Total Governing Body 634,511 679,028 708,043 29,015 4.3%
City Management City Manager 1,014,025 1,211,396 1,307,798 96,402 8.0%
Joblink-Idol Street Bldg. 92,377 90,850 84,456 (6,394) -7.0%
Total City Management 1,106,402 1,302,246 1,392,254 90,008 6.9%
Budget and Evaluation 313,903 317,726 294,555 (23,171) -7.3%
City Attorney 1,658,935 1,046,188 1,066,058 19,870 1.9%
Communications & Public Engagement 444,396 463,520 492,632 29,112 6.3%
Human Relations 163,288 181,777 179,541 (2,236) -1.2%
Economic Development 807,757 556,601 569,405 12,804 2.3%
Engineering Services 1,603,802 1,713,744 1,548,872 (164,872) -9.6%
Maintenance Operations Facility Maintenance 1,674,205 1,629,652 1,666,084 36,432 2.2%
Depot Maintenance 40,286 74,194 74,432 238 0.3%
Total Maintenance Operations 1,714,491 1,703,846 1,740,516 36,670 2.2%
Information Technology Services Info. Tech Services Admin 6,428,078 6,638,984 6,302,211 (336,773) -5.1%
Communications Center 2,522,471 2,571,576 2,639,502 67,926 2.6%
Total Information Technology 8,950,549 9,210,560 8,941,713 (268,847) -2.9%
Human Resources Administration 1,056,702 1,169,560 1,134,952 (34,608) -3.0%
Safety and Health 465,450 583,554 532,286 (51,268) -8.8%
Total Human Resources 1,522,152 1,753,114 1,667,238 (85,876) -4.9%
Financial Services Administration 1,023,698 1,055,605 1,052,752 (2,853) -0.3%
Accounting Financial Reporting 405,139 440,922 411,066 (29,856) -6.8%
Accounting Operations 461,833 546,790 519,104 (27,686) -5.1%
Purchasing 321,899 350,106 352,894 2,788 0.8%
Total Financial Services 2,212,569 2,393,423 2,335,816 (57,607) -2.4%
Police Administration
Chief's Office 739,935 789,631 903,396 113,765 14.4%
Major Crimes 5,995,156 6,110,085 6,514,430 404,345 6.6%
Field Operations-South 11,167,574 11,956,668 11,808,383 (148,285) -1.2%
Field Operations-North 10,687,395 10,507,372 11,253,870 746,498 7.1%
Total Police 28,590,060 29,363,756 30,480,079 1,116,323 3.8%
ANALYSIS OF EXPENDITURES
- 13 -

FY 2019 FY 2020 FY 2021 % BUDGETACTUAL BUDGET PROPOSED CHANGE CHANGE
ANALYSIS OF EXPENDITURES
Fire Administration 3,383,875 3,430,676 3,512,935 82,259 2.4%
Suppression 20,765,259 19,456,346 20,640,578 1,184,232 6.1%
Total Fire 24,149,134 22,887,022 24,153,513 1,266,491 5.5%
Transportation Administration 801,543 993,730 1,027,319 33,589 3.4%
Traffic Signs and Markings 655,337 747,578 735,668 (11,910) -1.6%
Traffic Signals 570,328 703,385 707,073 3,688 0.5%
Computerized Signal System 395,402 410,001 421,317 11,316 2.8%
Street Lighting 2,425,956 - - - 0.0%
Total Transportation 4,848,566 2,854,694 2,891,377 36,683 1.3%
Public Services Administration 448,518 448,278 471,523 23,245 5.2%
Cemeteries 249,577 263,658 285,406 21,748 8.2%
Street Maintenance 6,765,062 6,916,740 6,389,060 (527,680) -7.6%
Total Public Services 7,463,157 7,628,676 7,145,989 (482,687) -6.3%
Planning and Development Planning 1,215,554 1,238,065 1,269,948 31,883 2.6%
Building Inspections 1,659,134 1,683,913 1,622,892 (61,021) -3.6%
Development Services 445,348 424,536 458,512 33,976 8.0%
Total Planning and Dev. 3,320,036 3,346,514 3,351,352 4,838 0.1%
Community Dev. and Housing Community Dev. and Housing 841,939 690,921 695,387 4,466 0.6%
CD&H Tax Foreclosure Properties 169,486 200,000 100,000 (100,000) -50.0%
Local Code Enforcement 950,047 979,916 957,442 (22,474) -2.3%
Total Community Dev. and Housing 1,961,472 1,870,837 1,752,829 (118,008) -6.3%
Parks and Recreation Administration 1,925,047 1,721,015 1,739,108 18,093 1.1%
Programs 2,515,258 2,960,039 2,584,514 (375,525) -12.7%
Special Facilities 4,796,172 4,853,724 4,876,256 22,532 0.5%
Parks 3,057,763 3,258,342 3,183,827 (74,515) -2.3%
Total Parks and Recreation 12,294,240 12,793,120 12,383,705 (409,415) -3.2%
Library Administration 621,418 621,886 666,440 44,554 7.2%
Technical Services 304,863 328,472 326,537 (1,935) -0.6%
Building Maintenance 377,077 364,631 392,588 27,957 7.7%
Children's Services 610,250 581,292 704,253 122,961 21.2%
Library Research Services 835,769 859,506 931,083 71,577 8.3%
Information Services 285,043 317,845 335,355 17,510 5.5%
Readers' Services 701,086 722,045 794,154 72,109 10.0%
Lending Services 622,119 659,452 631,783 (27,669) -4.2%
Historical Museum 779,149 854,322 150,076 (704,246) -82.4%
Total Library 5,136,774 5,309,451 4,932,269 (377,182) -7.1%
- 14 -
FY 2019 FY 2020 FY 2021 % BUDGETACTUAL BUDGET PROPOSED CHANGE CHANGE
ANALYSIS OF EXPENDITURES
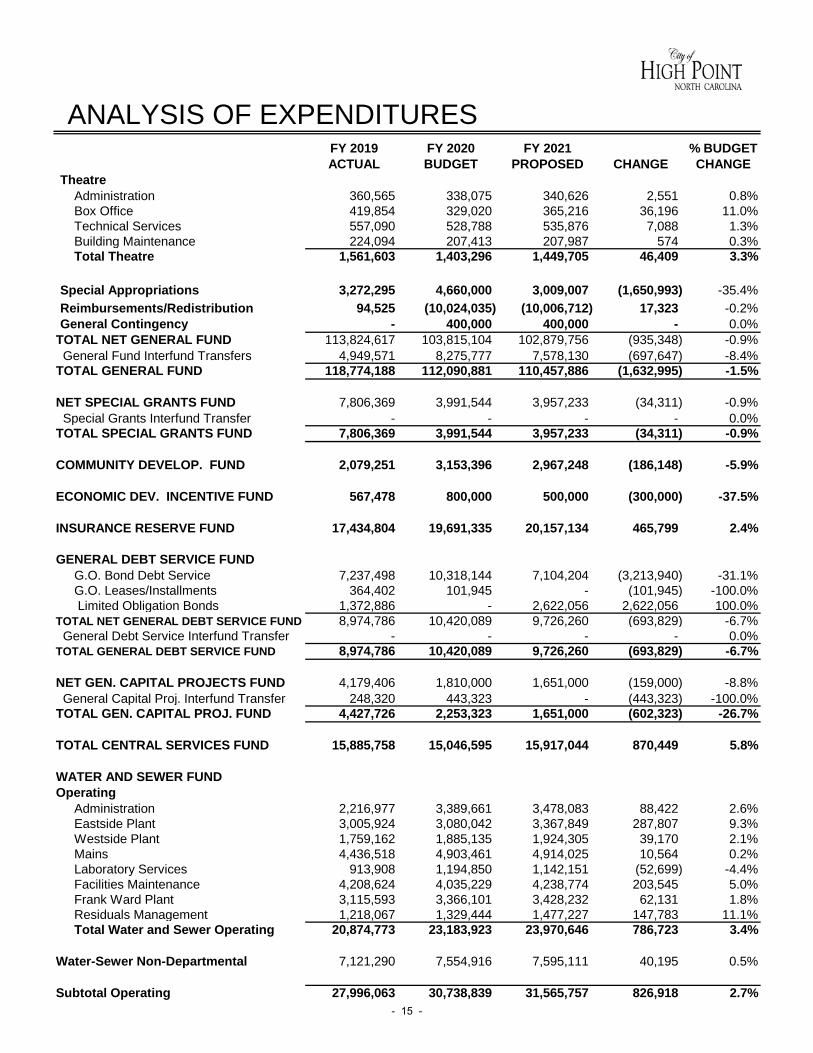
Theatre Administration 360,565 338,075 340,626 2,551 0.8%
Box Office 419,854 329,020 365,216 36,196 11.0%
Technical Services 557,090 528,788 535,876 7,088 1.3%
Building Maintenance 224,094 207,413 207,987 574 0.3%
Total Theatre 1,561,603 1,403,296 1,449,705 46,409 3.3%
Special Appropriations 3,272,295 4,660,000 3,009,007 (1,650,993) -35.4%
Reimbursements/Redistribution 94,525 (10,024,035) (10,006,712) 17,323 -0.2%
General Contingency - 400,000 400,000 - 0.0%
TOTAL NET GENERAL FUND 113,824,617 103,815,104 102,879,756 (935,348) -0.9%
General Fund Interfund Transfers 4,949,571 8,275,777 7,578,130 (697,647) -8.4%
TOTAL GENERAL FUND 118,774,188 112,090,881 110,457,886 (1,632,995) -1.5%
NET SPECIAL GRANTS FUND 7,806,369 3,991,544 3,957,233 (34,311) -0.9%
Special Grants Interfund Transfer - - - - 0.0%
TOTAL SPECIAL GRANTS FUND 7,806,369 3,991,544 3,957,233 (34,311) -0.9%
COMMUNITY DEVELOP. FUND 2,079,251 3,153,396 2,967,248 (186,148) -5.9%
ECONOMIC DEV. INCENTIVE FUND 567,478 800,000 500,000 (300,000) -37.5%
INSURANCE RESERVE FUND 17,434,804 19,691,335 20,157,134 465,799 2.4%
GENERAL DEBT SERVICE FUND G.O. Bond Debt Service 7,237,498 10,318,144 7,104,204 (3,213,940) -31.1%
G.O. Leases/Installments 364,402 101,945 - (101,945) -100.0%
Limited Obligation Bonds 1,372,886 - 2,622,056 2,622,056 100.0%
TOTAL NET GENERAL DEBT SERVICE FUND 8,974,786 10,420,089 9,726,260 (693,829) -6.7%
General Debt Service Interfund Transfer - - - - 0.0%
TOTAL GENERAL DEBT SERVICE FUND 8,974,786 10,420,089 9,726,260 (693,829) -6.7%
NET GEN. CAPITAL PROJECTS FUND 4,179,406 1,810,000 1,651,000 (159,000) -8.8%
General Capital Proj. Interfund Transfer 248,320 443,323 - (443,323) -100.0%
TOTAL GEN. CAPITAL PROJ. FUND 4,427,726 2,253,323 1,651,000 (602,323) -26.7%
TOTAL CENTRAL SERVICES FUND 15,885,758 15,046,595 15,917,044 870,449 5.8%
WATER AND SEWER FUNDOperating Administration 2,216,977 3,389,661 3,478,083 88,422 2.6%
Eastside Plant 3,005,924 3,080,042 3,367,849 287,807 9.3%
Westside Plant 1,759,162 1,885,135 1,924,305 39,170 2.1%
Mains 4,436,518 4,903,461 4,914,025 10,564 0.2%
Laboratory Services 913,908 1,194,850 1,142,151 (52,699) -4.4%
Facilities Maintenance 4,208,624 4,035,229 4,238,774 203,545 5.0%
Frank Ward Plant 3,115,593 3,366,101 3,428,232 62,131 1.8%
Residuals Management 1,218,067 1,329,444 1,477,227 147,783 11.1%
Total Water and Sewer Operating 20,874,773 23,183,923 23,970,646 786,723 3.4%
Water-Sewer Non-Departmental 7,121,290 7,554,916 7,595,111 40,195 0.5%
Subtotal Operating 27,996,063 30,738,839 31,565,757 826,918 2.7%- 15 -

FY 2019 FY 2020 FY 2021 % BUDGETACTUAL BUDGET PROPOSED CHANGE CHANGE
ANALYSIS OF EXPENDITURES
Contingency - 300,000 300,000 - 0.0%
Debt Service 16,426,552 16,419,196 16,509,221 90,025 0.5%
NET TOTAL WATER & SEWER FUND 44,422,615 47,458,035 48,374,978 916,943 1.9%
Water-Sewer Interfund Transfer 8,125,000 8,433,550 22,710,000 14,276,450 169.3%
TOTAL WATER AND SEWER FUND 52,547,615 55,891,585 71,084,978 15,193,393 27.2%
WATER/SEWER CAPITAL PROJ. FUND 16,734,629 8,383,550 7,660,000 (723,550) -8.6%
ELECTRIC FUNDOperating and Maintenance Administration 1,114,741 929,928 930,401 473 0.1%
Power Supply Expense 92,437,794 97,299,892 97,126,722 (173,170) -0.2%
Engineering 1,129,804 1,447,043 1,455,062 8,019 0.6%
Warehouse 595,740 612,729 655,368 42,639 7.0%
Structures and Stations 733,022 857,412 906,189 48,777 5.7%
Lines Maintenance 1,048,489 1,385,130 1,592,130 207,000 14.9%
Street Lighting 351,078 399,980 449,980 50,000 12.5%
Metering/Customer Installation 125,596 355,760 357,242 1,482 0.4%
System Improvements 10,525,885 11,997,085 13,113,800 1,116,715 9.3%
Customer Service Administration 331,017 432,260 423,929 (8,331) -1.9%
Meter Reading 693,600 711,758 741,454 29,696 4.2%
Revenue Collections 1,281,283 1,420,553 1,370,718 (49,835) -3.5%
Mail Room 75,041 84,455 138,374 53,919 63.8%
Telephone Center 1,082,953 1,121,310 1,197,050 75,740 6.8%
Water Meter Services 405,124 614,638 624,151 9,513 1.5%
Dispatch 422,975 412,134 426,867 14,733 3.6%
Field Services 470,788 515,191 528,341 13,150 2.6%
Total Operating and 112,824,930 120,597,258 122,037,778 1,440,520 1.2% Customer Service
Electric Non-Departmental 4,256,323 2,285,995 2,161,282 (124,713) -5.5%
Subtotal Operating 117,081,253 122,883,253 124,199,060 1,315,807 1.1%
Electric Contingency - 450,000 450,000 - 0.0%
Electric Capital Projects 5,842,833 6,117,500 3,450,000 (2,667,500) -43.6%
TOTAL NET ELECTRIC FUND 122,924,086 129,450,753 128,099,060 (1,351,693) -1.0%
Electric Interfund Transfer 1,210,000 2,160,000 5,327,500 3,167,500 146.6%
TOTAL ELECTRIC FUND 124,134,086 131,610,753 133,426,560 1,815,807 1.4%
ELECTRIC CAPITAL FUND - 1,050,000 4,217,500 3,167,500 301.7%
MASS TRANSIT FUND 3,842,416 4,524,137 4,639,266 115,129 2.5%
MASS TRANSIT CAPITAL FUND 739,836 570,000 110,000 (460,000) -80.7%
- 16 -

FY 2019 FY 2020 FY 2021 % BUDGETACTUAL BUDGET PROPOSED CHANGE CHANGE
ANALYSIS OF EXPENDITURES
PARKING FUNDParking Facilities Operating Parking Facility - Radisson 70,308 67,958 74,439 6,481 9.5%
Parking Facility - Broad St. 20,552 22,895 25,270 2,375 10.4%
Parking Facility - High W. Com 309,963 287,876 268,291 (19,585) -6.8%
Total Parking Facilities Operating 400,823 378,729 368,000 (10,729) -2.8%
Parking Capital Projects 223,292 - 175,000 175,000 0.0%
TOTAL PARKING FUND 624,115 378,729 543,000 164,271 43.4%
SOLID WASTE FUND Ingleside 663,818 729,620 735,495 5,875 0.8%
Landfill Operating 3,724,171 4,226,604 4,631,173 404,569 9.6%
Municipal Recycling Facility 1,703,768 1,980,045 2,021,743 41,698 2.1%
Environmental Services 6,730,230 7,189,648 7,365,183 175,535 2.4%
Subtotal Operating 12,821,987 14,125,917 14,753,594 627,677 4.4%
Non-Departmental Funds 19,224 163,933 125,126 (38,807) -23.7%
Capital Projects 1,247,015 2,241,000 271,000 (1,970,000) -87.9%
TOTAL NET SOLID WASTE FUND 14,088,226 16,530,850 15,149,720 (1,381,130) -8.4%
Solid Waste Interfund Transfer 1,808,733 1,539,100 1,981,780 442,680 28.8%
TOTAL SOLID WASTE FUND 15,896,959 18,069,950 17,131,500 (938,450) -5.2%SOLID WASTE CAPITAL FUND 25,639 25,000 1,175,000 1,150,000 4600.0%
STORMWATER FUNDStormwater Management Stormwater Maintenance 2,324,496 2,837,632 3,424,896 587,264 20.7%
Stormwater Non-Departmental - - - - 0.0%
Subtotal Operating 2,324,496 2,837,632 3,424,896 587,264 20.7%
Debt Service 1,322,340 1,371,329 1,255,423 (115,906) -8.5%
Capital Projects 2,123,370 1,995,285 900,000 (1,095,285) -54.9%
TOTAL NET STORMWATER FUND 5,770,206 6,204,246 5,580,319 (623,927) -10.1%Stormwater Interfund Transfer - 420,000 230,000 (190,000) -45.2%
TOTAL STORMWATER FUND 5,770,206 6,624,246 5,810,319 (813,927) -12.3%
STORM WATER CAPITAL FUND 4,948 420,000 230,000 (190,000) -45.2%
MARKET AUTHORITY FUND 3,112,923 3,175,000 2,860,000 (315,000) -9.9%
TOTAL EXPENDITURES 399,383,732 398,170,113 414,221,928 13,264,315 3.3%
- 17 -
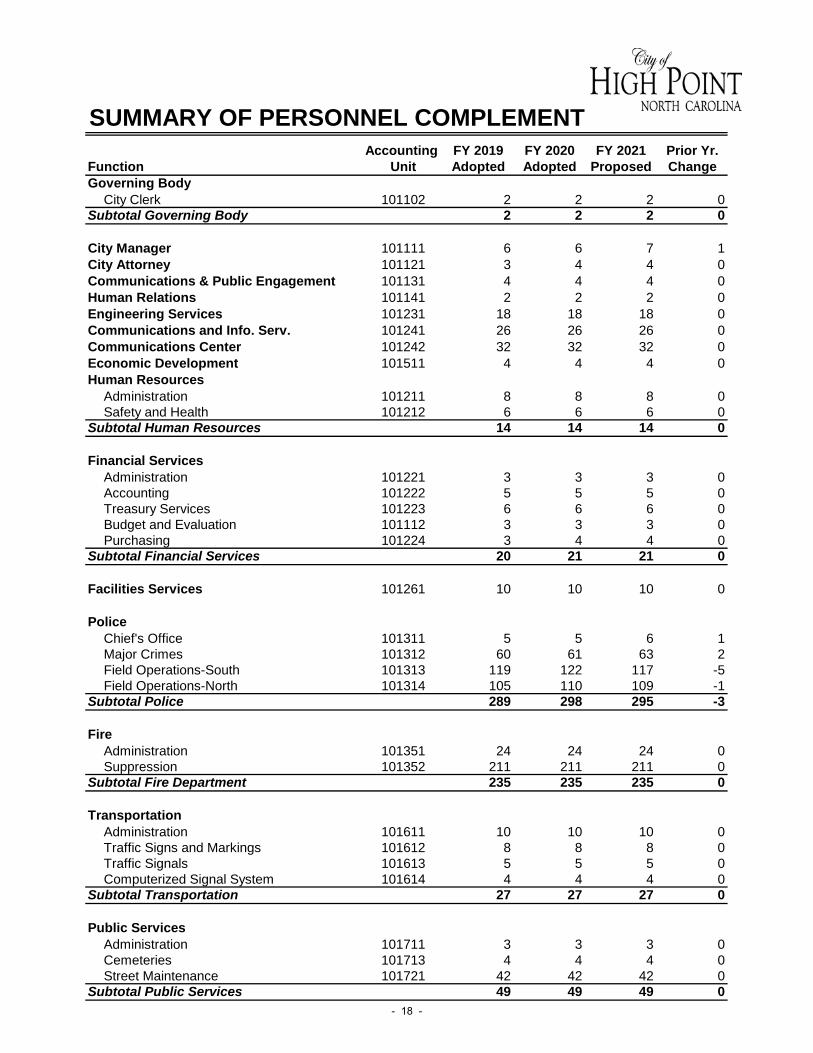
Accounting FY 2019 FY 2020 FY 2021 Prior Yr.Function Unit Adopted Adopted Proposed ChangeGoverning Body
City Clerk 101102 2 2 2 0
Subtotal Governing Body 2 2 2 0
City Manager 101111 6 6 7 1
City Attorney 101121 3 4 4 0
Communications & Public Engagement 101131 4 4 4 0
Human Relations 101141 2 2 2 0
Engineering Services 101231 18 18 18 0
Communications and Info. Serv. 101241 26 26 26 0
Communications Center 101242 32 32 32 0
Economic Development 101511 4 4 4 0
Human ResourcesAdministration 101211 8 8 8 0
Safety and Health 101212 6 6 6 0
Subtotal Human Resources 14 14 14 0
Financial ServicesAdministration 101221 3 3 3 0
Accounting 101222 5 5 5 0
Treasury Services 101223 6 6 6 0
Budget and Evaluation 101112 3 3 3 0
Purchasing 101224 3 4 4 0
Subtotal Financial Services 20 21 21 0
Facilities Services 101261 10 10 10 0
PoliceChief's Office 101311 5 5 6 1
Major Crimes 101312 60 61 63 2
Field Operations-South 101313 119 122 117 -5
Field Operations-North 101314 105 110 109 -1
Subtotal Police 289 298 295 -3
FireAdministration 101351 24 24 24 0
Suppression 101352 211 211 211 0
Subtotal Fire Department 235 235 235 0
TransportationAdministration 101611 10 10 10 0
Traffic Signs and Markings 101612 8 8 8 0
Traffic Signals 101613 5 5 5 0
Computerized Signal System 101614 4 4 4 0
Subtotal Transportation 27 27 27 0
Public ServicesAdministration 101711 3 3 3 0
Cemeteries 101713 4 4 4 0
Street Maintenance 101721 42 42 42 0
Subtotal Public Services 49 49 49 0
SUMMARY OF PERSONNEL COMPLEMENT
- 18 -

Accounting FY 2019 FY 2020 FY 2021 Prior Yr.Function Unit Adopted Adopted Proposed Change
SUMMARY OF PERSONNEL COMPLEMENT
Planning and DevelopmentPlanning 101521 12 12 12 0
Building Inspections 101522 18 17 17 0
Development Services 101523 5 6 6 0
Subtotal Planning and Development 35 35 35 0
Community Devel. and HousingCommunity Development 101534 2 2 2 0
Local Code Enforcement 101537 7 7 7 0
Subtotal Community Devel. and Housing 9 9 9 0
Parks and RecreationAdministration 101411 15 15 15 0
Parks and Recreation Programs 101421 20 20 18 -2
Parks and Recreation Special Facilities 101431 42 44 42 -2
Parks 101441 41 41 41 0
Subtotal Parks and Recreation 118 120 116 -4
LibraryAdministration 101451 4 4 4 0
Technical Services 101452 4 4 4 0
Building Maintenance 101453 4 4 4 0
Children's Services 101454 5 5 6 1
Research Services 101455 8 8 8 0
Information Services 101456 3 3 3 0
Library Readers' Services 101457 6 6 6 0
Lending Services 101459 10 10 10 0
Historical Museum 101465 9 9 3 -6
Subtotal Library 53 53 48 -5
TheatreAdministration 101471 2 2 2 0
Box Office 101472 1 1 1 0
Technical Services 101473 3 3 3 0
Subtotal Theatre 6 6 6 0
Total General Fund 962 975 964 -11
Community Development Block GrantCD Administration 1 1 1 0
Affordable Housing 6 6 6 0
Community Resource Programs 2 2 2 0
Total Community Dev. Block Grant 9 9 9 0
Water and Sewer FundAdministration 621751 9 9 9 0
Eastside Plant 621752 15 15 15 0
Westside Plant 621753 12 13 13 0
Mains 621754 48 48 46 -2
Laboratory Services 621756 10 10 10 0
- 19 -

Accounting FY 2019 FY 2020 FY 2021 Prior Yr.Function Unit Adopted Adopted Proposed Change
SUMMARY OF PERSONNEL COMPLEMENT
Maintenance Services 621757 25 27 27 0
Frank L. Ward Plant 621758 14 15 16 1
Residuals Management 621759 6 7 7 0
Total Water and Sewer Fund 139 144 143 -1
Electric FundEngineering 631232 9 10 10 0
Customer Service-Administration 631251 4 4 4 0
Customer Service-Meter Reading 631252 10 10 10 0
Customer Serv.-Revenue Collections 631253 13 14 13 -1
Cust. Serv.-Telephone Center 631256 13 11 14 3
Cust. Serv.-Water Meter Service 631257 5 5 5 0
Cust. Serv.-Dispatch 631258 7 8 7 -1
Cust. Serv.-Field Serv. Cut-Ons/Offs 631259 7 7 7 0
Administration 631781 3 3 3 0
Electric Opr. and Maint. Warehouse 631783 4 5 5 0
Operating and Maint. Dist. Exp. 631784 5 5 5 0
Electric System Improvements 631795 46 46 46 0
Total Electric Fund 126 128 129 1
Mass Transit Fund 641621 54 54 55 1
Parking FundHigh & Commerce 651633 2 2 2 0
Total Parking Fund 2 2 2 0
Solid Waste FundIngleside Compost Facility 661740 6 6 6 0
Landfill Facilities Operating 661741 16 16 17 1
Municipal Recycling Facility 661742 21 25 25 0
Environmental Services 661743 49 49 50 1
Total Solid Waste Fund 92 96 98 2
Stormwater Fund 671731 25 26 26 0
Central Services FundRadio Repair Shop 501243 4 4 4 0
Fleet Services 501271 19 20 22 2
Total Central Services Fund 23 24 26 2
Operating 1,423 1,449 1,443 -6
Grants 19 11 11 0
Total Full-Time Positions 1,442 1,460 1,454 -6
Part-Time Positions
City Management 1 1 1 0
Police 14 6 11 5
- 20 -

Accounting FY 2019 FY 2020 FY 2021 Prior Yr.Function Unit Adopted Adopted Proposed Change
SUMMARY OF PERSONNEL COMPLEMENT
Parks and Recreation 126 133 105 -28
Library 26 22 17 -5
Theatre 3 3 4 1
Transportation 0 2 2 0
Public Service--GF 5 5 5 0
Fleet 0 0 1 1
Water & Sewer 6 12 12 0
Electric 3 3 4 1
Mass Transit 6 2 5 3
Parking 7 7 7 0
Landfill 1 1 1 0
Stormwater 0 0 2 2
Total Part-time Positions 198 197 177 -20
GRAND TOTAL 1,640 1,657 1,631 -26
- 21 -
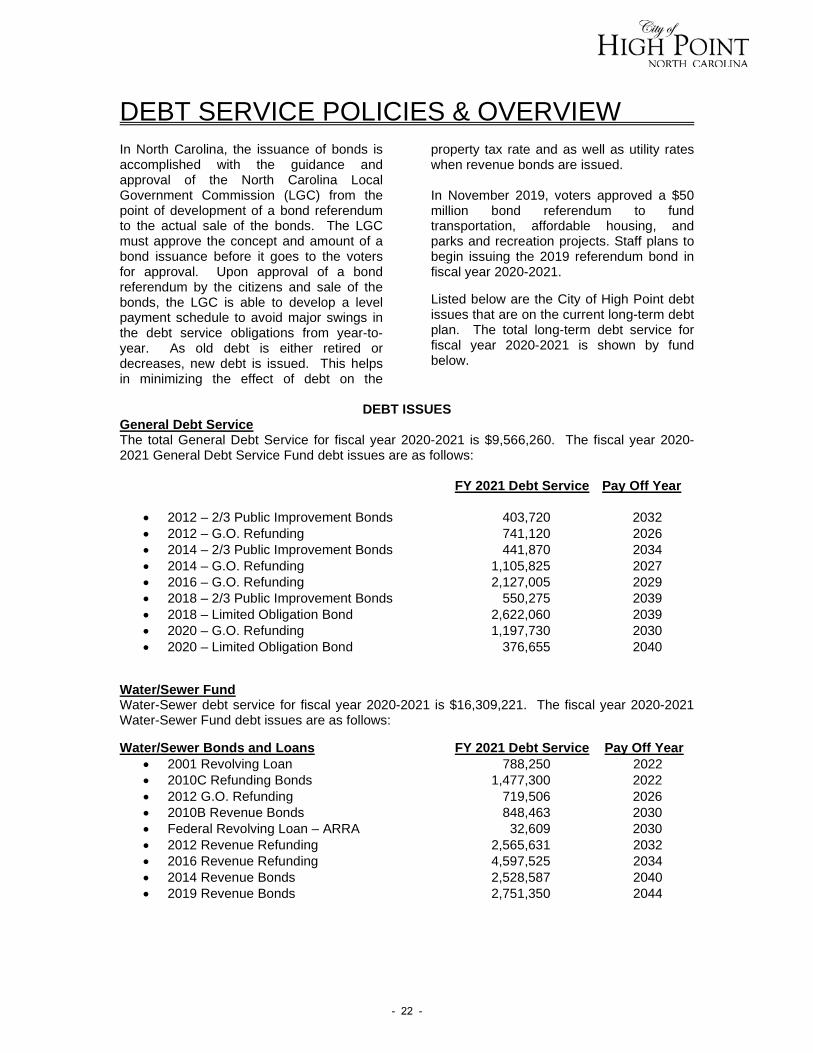
DEBT SERVICE POLICIES & OVERVIEW In North Carolina, the issuance of bonds is accomplished with the guidance and approval of the North Carolina Local Government Commission (LGC) from the point of development of a bond referendum to the actual sale of the bonds. The LGC must approve the concept and amount of a bond issuance before it goes to the voters for approval. Upon approval of a bond referendum by the citizens and sale of the bonds, the LGC is able to develop a level payment schedule to avoid major swings in the debt service obligations from year-to-year. As old debt is either retired or decreases, new debt is issued. This helps in minimizing the effect of debt on the
property tax rate and as well as utility rates when revenue bonds are issued. In November 2019, voters approved a $50 million bond referendum to fund transportation, affordable housing, and parks and recreation projects. Staff plans to begin issuing the 2019 referendum bond in fiscal year 2020-2021.
Listed below are the City of High Point debt issues that are on the current long-term debt plan. The total long-term debt service for fiscal year 2020-2021 is shown by fund below.
DEBT ISSUES
General Debt Service The total General Debt Service for fiscal year 2020-2021 is $9,566,260. The fiscal year 2020-2021 General Debt Service Fund debt issues are as follows:
FY 2021 Debt Service Pay Off Year
• 2012 – 2/3 Public Improvement Bonds 403,720 2032
• 2012 – G.O. Refunding 741,120 2026
• 2014 – 2/3 Public Improvement Bonds 441,870 2034
• 2014 – G.O. Refunding 1,105,825 2027
• 2016 – G.O. Refunding 2,127,005 2029
• 2018 – 2/3 Public Improvement Bonds 550,275 2039
• 2018 – Limited Obligation Bond 2,622,060 2039
• 2020 – G.O. Refunding 1,197,730 2030
• 2020 – Limited Obligation Bond 376,655 2040
Water/Sewer Fund Water-Sewer debt service for fiscal year 2020-2021 is $16,309,221. The fiscal year 2020-2021 Water-Sewer Fund debt issues are as follows:
Water/Sewer Bonds and Loans FY 2021 Debt Service Pay Off Year • 2001 Revolving Loan 788,250 2022
• 2010C Refunding Bonds 1,477,300 2022
• 2012 G.O. Refunding 719,506 2026
• 2010B Revenue Bonds 848,463 2030
• Federal Revolving Loan – ARRA 32,609 2030
• 2012 Revenue Refunding 2,565,631 2032
• 2016 Revenue Refunding 4,597,525 2034
• 2014 Revenue Bonds 2,528,587 2040
• 2019 Revenue Bonds 2,751,350 2044
- 22 -

DEBT OVERVIEW (cont’d) Stormwater Fund The total debt service for the Stormwater Fund in fiscal year 2020-2021 is $1,255,423. The 2004 bond referendum included $15.4 million in Stormwater projects. Stormwater debt service includes the principal and interest payment of the General Obligation portion for Stormwater Bonds. The debt on these bonds has previously been supported by property taxes dedicated to the General Obligation Bonds. A $1 per month increase in ERU fees in the Storm Water Fund was implemented in FY 2015-16 to pay for this debt service in the future. An additional $1 per month fee was approved in FY 2016-2017 to pay for future bonded debt projects. A bond sale is being planned in the future, and funds are being set aside for the impact of future debt service payments. Smaller storm water projects will continue to be funded through user fees in the Pay-As-We-Go Capital Program. The fiscal year 2020-2021 Storm Water Fund debt issue follows: FY 2021 Debt Service Pay Off Year
• 2012 – G.O. Refunding 379,827 2026
• 2014 – G.O. Refunding 153,778 2027
• 2016 – G.O. Refunding 428,121 2029
• 2020 – G.O. Refunding 293,697 2030 Long-Term Equipment Leases-Installment Contracts The City of High Point finances some equipment with installment contracts. The total lease principal and interest for fiscal year 2020-2021 is $2,087,692. There is no additional lease or installment contracts planned for FY 2021-2022. FY 2021 Debt Service Pay Off Year
• Fleet Equipment 415,988 2022
• Radio Equipment 402,336 2026
• Fire Equipment 404,937 2027
• Fire Equipment 636,790 2029
• Fleet Equipment 227,911 2029
- 23 -

DEBT OVERVIEW (cont’d)
ASSESSED VALUES and DEBT LIMITATIONS – END OF FISCAL YEAR (dollars in thousands)
Assessed Value 9,719,314$
Debt Limit (1) 8% of assessed value 777,545$
Amount of Debt Applicable to Limit
General Obligation Debt 67,045
Less: Amount available fo repayment of GO bonds 13,240 Debt outstanding for water purposes 1,650 Total Net Debt Applicable to Limit 52,155
Legal Debt Margin Available 725,390$
Total net debt applicable to the limit as a % of debt limit 6.71%
Note: Debt is presented as gross and does not include bond premiums/discounts.
Note: NC Statute GS 159-55 limits the city's outstanding debt to 8% of the appraised value of property subject to taxation. The following deductions are made from gross debt to arrive at net debt applicable to the limit: Money held for payment of principal; debt incurred for water, sewer, gas, or electric power purchase, uncollected special
*Actual results as reported in Comprehensive Annual Financial Report Fiscal Year Ending June 30,
2019
- 24 -

TOTAL SUBTOTAL SUBTOTAL ANNUAL
Principal Interest Total Principal Interest Total PRINCIPAL INTEREST DEBT SERVICE
FY 2021 6,483,831 3,082,409 9,566,240 10,591,779 6,972,866 17,564,645 17,075,609 10,055,275 27,130,884
FY 2022 7,421,936 2,820,372 10,242,308 10,335,673 6,474,507 16,810,181 17,757,609 9,294,880 27,052,489
FY 2023 7,384,543 2,568,411 9,952,954 8,957,066 5,996,927 14,953,993 16,341,609 8,565,338 24,906,947
FY 2024 7,223,410 2,306,969 9,530,380 8,985,199 5,559,735 14,544,934 16,208,609 7,866,705 24,075,314
FY 2025 7,236,409 2,065,675 9,302,084 9,322,200 5,123,243 14,445,443 16,558,609 7,188,918 23,747,527
FY 2026 7,155,802 1,839,620 8,995,422 9,592,807 4,679,601 14,272,408 16,748,609 6,519,221 23,267,830
FY 2027 6,843,422 1,625,841 8,469,263 9,612,187 4,228,374 13,840,561 16,455,609 5,854,215 22,309,824
FY 2028 6,281,434 1,438,428 7,719,862 9,949,175 3,796,937 13,746,113 16,230,609 5,235,366 21,465,975
FY 2029 5,454,036 1,262,962 6,716,998 10,197,580 3,354,334 13,551,915 15,651,616 4,617,297 20,268,913
FY 2030 4,879,072 1,115,205 5,994,278 10,499,537 2,919,135 13,418,671 15,378,609 4,034,340 19,412,949
FY 2031 3,647,000 983,445 4,630,445 10,575,000 2,499,569 13,074,569 14,222,000 3,483,014 17,705,014
FY 2032 3,687,000 869,818 4,556,818 11,000,000 2,060,319 13,060,319 14,687,000 2,930,137 17,617,137
FY 2033 3,441,000 752,268 4,193,268 7,030,000 1,684,100 8,714,100 10,471,000 2,436,368 12,907,368
FY 2034 3,481,000 641,436 4,122,436 7,330,000 1,384,400 8,714,400 10,811,000 2,025,836 12,836,836
FY 2035 3,221,000 528,097 3,749,097 4,780,000 1,142,500 5,922,500 8,001,000 1,670,597 9,671,597
FY 2036 3,261,000 422,521 3,683,521 4,955,000 962,325 5,917,325 8,216,000 1,384,846 9,600,846
FY 2037 3,306,000 315,076 3,621,076 3,780,000 810,400 4,590,400 7,086,000 1,125,476 8,211,476
FY 2038 3,356,000 205,671 3,561,671 3,930,000 661,800 4,591,800 7,286,000 867,471 8,153,471
FY 2039 3,406,000 93,551 3,499,551 4,095,000 495,675 4,590,675 7,501,000 589,226 8,090,226
FY 2040 956,000 20,554 976,554 4,270,000 322,100 4,592,100 5,226,000 342,654 5,568,654
FY 2041 1,860,000 205,500 2,065,500 1,860,000 205,500 2,065,500
Total 98,125,895$ 24,958,329$ 123,084,224$ 161,648,204$ 61,334,348$ 222,982,552$ 259,774,100$ 86,292,677$ 346,066,777$
Debt Service Expense Components
TAX SUPPORTED DEBT UTILITY SUPPORTED DEBT
DEBT OUTSTANDING AND MATURITIES
-
3,000
6,000
9,000
12,000
15,000
18,000
21,000
24,000
27,000
30,000
33,000
Thousands
INTEREST
PRINCIPAL
- 25 -
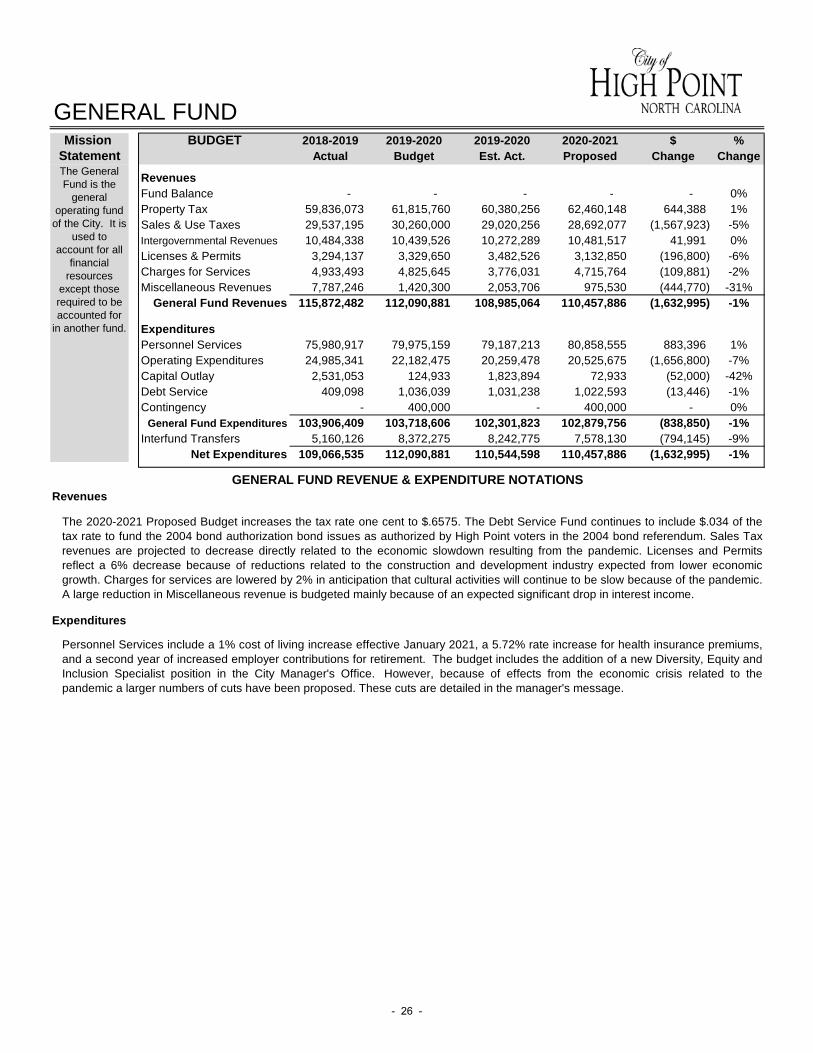
BUDGET 2018-2019 2019-2020 2019-2020 2020-2021 $ %Actual Budget Est. Act. Proposed Change Change
RevenuesFund Balance - - - - - 0%
Property Tax 59,836,073 61,815,760 60,380,256 62,460,148 644,388 1%
Sales & Use Taxes 29,537,195 30,260,000 29,020,256 28,692,077 (1,567,923) -5%
Intergovernmental Revenues 10,484,338 10,439,526 10,272,289 10,481,517 41,991 0%
Licenses & Permits 3,294,137 3,329,650 3,482,526 3,132,850 (196,800) -6%
Charges for Services 4,933,493 4,825,645 3,776,031 4,715,764 (109,881) -2%
Miscellaneous Revenues 7,787,246 1,420,300 2,053,706 975,530 (444,770) -31%
General Fund Revenues 115,872,482 112,090,881 108,985,064 110,457,886 (1,632,995) -1%
ExpendituresPersonnel Services 75,980,917 79,975,159 79,187,213 80,858,555 883,396 1%
Operating Expenditures 24,985,341 22,182,475 20,259,478 20,525,675 (1,656,800) -7%
Capital Outlay 2,531,053 124,933 1,823,894 72,933 (52,000) -42%
Debt Service 409,098 1,036,039 1,031,238 1,022,593 (13,446) -1%
Contingency - 400,000 - 400,000 - 0%
General Fund Expenditures 103,906,409 103,718,606 102,301,823 102,879,756 (838,850) -1%Interfund Transfers 5,160,126 8,372,275 8,242,775 7,578,130 (794,145) -9%
Net Expenditures 109,066,535 112,090,881 110,544,598 110,457,886 (1,632,995) -1%
GENERAL FUNDMission
StatementThe General
Fund is the
general
operating fund
of the City. It is
used to
account for all
financial
resources
except those
required to be
accounted for
in another fund.
GENERAL FUND REVENUE & EXPENDITURE NOTATIONSRevenues
The 2020-2021 Proposed Budget increases the tax rate one cent to $.6575. The Debt Service Fund continues to include $.034 of the
tax rate to fund the 2004 bond authorization bond issues as authorized by High Point voters in the 2004 bond referendum. Sales Tax
revenues are projected to decrease directly related to the economic slowdown resulting from the pandemic. Licenses and Permits
reflect a 6% decrease because of reductions related to the construction and development industry expected from lower economic
growth. Charges for services are lowered by 2% in anticipation that cultural activities will continue to be slow because of the pandemic.
A large reduction in Miscellaneous revenue is budgeted mainly because of an expected significant drop in interest income.
Expenditures
Personnel Services include a 1% cost of living increase effective January 2021, a 5.72% rate increase for health insurance premiums,
and a second year of increased employer contributions for retirement. The budget includes the addition of a new Diversity, Equity and
Inclusion Specialist position in the City Manager's Office. However, because of effects from the economic crisis related to the
pandemic a larger numbers of cuts have been proposed. These cuts are detailed in the manager's message.
- 26 -

2018-2019 2019-2020 2019-2020 2020-2021 % 2021-2022Actual Budget Est. Act. Proposed Change Projected
Revenues Fund Balance - - - - 0% 335,610
Property Tax 3,273,191 3,363,159 3,323,468 3,381,700 1% 3,483,150
Intergovernmental 256,247 239,054 188,586 - -100% -
Stadium Op. Agreement - 1,400,000 800,000 1,225,000 -13% 1,400,000
Charges for Service 200,755 101,945 101,945 - -100% -
CVB Revenue 250,000 250,000 250,000 250,000 0% 250,000
Miscellaneous 586,069 322,381 215,000 126,010 -61% 190,000
Total Revenues 4,566,262 5,676,539 4,878,999 4,982,710 -12% 5,658,760 Transfers 543,000 4,743,550 4,743,550 4,743,550 0% 4,743,550
Net Revenues 5,109,262 10,420,089 9,622,549 9,726,260 -7% 10,402,310
Expenditures Debt Service 8,974,786 10,420,089 10,420,089 9,726,260 -7% 10,402,310
Total Expenditures 8,974,786 10,420,089 10,420,089 9,726,260 -7% 10,402,310
Expenditures:
Revenues:
The General Debt Service Fund includes a dedicated 3.4 cents of the tax rate to fund the 2004 bond authorization. The budget also includes the
revenue associated with the Downtown Multi-Use Stadium project, including funds from the stadium operating agreement and the funding
commitment of $250,000 annually from the Convention and Visitors Bureau. The stadium operating agreement revenue is an estimate, it is
unknown what the impact of the Coronavirus Pandemic will be on the tenant's revenues. Any shortfall will be covered by fund balance.
The budget includes funding for all current debt service.
The General Debt Service
fund is used to account for
the accumulation of
resources for, and the
payment of general long-
term debt principal and
interest. Debt service for
proprietary funds are
found in the individual fund
summaries.
GENERAL DEBT SERVICE FUNDMission BUDGETStatement
- 27 -

2018-2019 2019-2020 2019-2020 2020-2021 %Actual Budget Est. Actuals Proposed Change
Revenues Other Funds - - 855,263 - 0%
Miscellaneous - - 34,918 - 0%
Total Revenues - - 890,181 - -100% Transfers 2,330,323 2,253,323 2,253,323 1,651,000 -27%
Net Revenues 2,330,323 2,253,323 3,143,504 1,651,000 -27%Expenditures Operating & Misc. Expenses 447,731 160,000 479,225 - -100%
Capital Outlay 3,731,675 1,650,000 3,763,105 1,651,000 0%
Total Expenditures 4,179,406 1,810,000 4,242,330 1,651,000 -9%Transfers 248,320 443,323 443,323 - -100%
Total Net Expenditures 4,427,726 2,253,323 4,685,653 1,651,000 -27%
Revenues
Expenditures
Funding for General Capital Projects comes from a transfer from the General Fund. Estimated Actuals exceed budget because
of prior year roll-overs.
A summary of funded projects is in the Capital Improvements Program on page 42. Projects this year focus around Catalyst
area projects as well as one safety-required project at Oak Hollow Golf Course. Estimated Actuals exceed budget because of
prior year roll-overs.
GENERAL CAPITAL PROJECTS FUNDMission BUDGETStatement
The General Capital Projects
Fund is used to account for
pay-as-we-go General Fund
capital projects. Resources
for these projects are used
for the acquisition or
construction of capital
facilities, other than those
financed by the enterprise
funds. Long-term general
capital projects, which are
generally financed by general
obligation bonds, can be
found in the Capital
Improvement Program
section of this document.
- 28 -

BUDGET 2018-2019 2019-2020 2019-2020 2020-2021 $ % Actual Budget Est. Act. Proposed Change Change
RevenuesFund Balance - 916,755 - 13,844,271 12,927,516 1410%
Operating Revenue 52,443,660 53,726,141 54,242,456 55,989,817 2,263,676 4%
Intergovernmental Revenue 411,211 398,689 - - (398,689) -100%
Miscellaneous Revenues 2,023,206 850,000 959,424 1,250,890 400,890 47%
Total Water-Sewer Fund 54,878,077 55,891,585 55,201,880 71,084,978 15,193,393 27%
ExpendituresPersonnel Services 9,020,345 10,481,279 9,450,241 10,865,515 384,236 4%
Water-Sewer Operating 12,329,710 13,079,467 11,476,376 13,479,868 400,401 3%
Contingency - 300,000 - 300,000 - 0%
Debt Service 16,426,553 16,419,196 15,232,946 16,509,221 90,025 1%
Water and Sewer Capital 7,975,000 8,684,670 8,643,184 22,893,000 14,208,330 164%
Reimbursements 6,646,008 6,876,973 6,876,973 6,987,374 110,401 2%
Total Water-Sewer Fund 52,397,616 55,841,585 51,679,720 71,034,978 15,193,393 27%Interfund Transfers 150,000 50,000 50,000 50,000 - 0%
Net Water-Sewer Fund 52,547,616 55,891,585 51,729,720 71,084,978 15,193,393 27%
Revenues
Expenditures
WATER AND SEWER FUND
The increase in fund balance appropriated is due to the one-time use of cash reserves for capital improvements in accordance with
the 2019 financial feasibilty study. The water and sewer rate increase of 2% effective October 1 will increase operating revenue and
will fund future debt service. Interest income has dropped drastically because of the economic crisis related to the COVID-19
pandemic. Other revenues will be collected at a slower rate but are not factored to drop precipitously. Water & sewer miscellaneous
revenues saw an increase because of peak revenues related to plant electric generator operation.
Personnel Services include a 1% cost of living increase effective in January 2021, a 5.72% increase in health insurance premiums, as
well as an increase in the employer contribution to retirement. Benefit cuts were realized by eliminating the 401K 1% match and the
holiday bonus. Water-Sewer operating expenses increased by 3 percent. As mentioned in the Revenue section, the transfer to water
and sewer capital increased to fund capital improvements with cash.
Mission Statement
WATER-SEWER FUND REVENUE & EXPENDITURE NOTATIONS
The Water and
Sewer Fund
operations come
under the direction
of the Public
Services
Department. This
fund is used to
account for the
provision of water
and sewer
services to the
residents of the
City and some
County residents.
All expenses
necessary to
provide such
services are
accounted for in
this fund as well as
debt service on
water-sewer bond
issues.
- 29 -

BUDGET 2018-2019 2019-2020 2019-2020 2020-2021 $ % Actual Budget Est. Act. Proposed Change Change
RevenuesFund Balance - 293,282 - 3,450,000 3,156,718 1076%
Operating Receipts 130,583,732 130,203,471 128,220,846 129,182,560 (1,020,911) -1%
Other Revenue 1,651,156 1,114,000 18,600,279 794,000 (320,000) -29%
Total 132,234,888 131,610,753 146,821,125 133,426,560 1,815,807 1%
ExpendituresPersonnel Services 10,006,574 10,906,611 11,124,743 11,556,993 650,382 6%
Electric Operating Budgets 9,662,877 8,633,621 8,806,293 8,768,389 134,768 2%
Wholesale Power Cost 91,410,683 96,236,000 91,650,102 96,037,800 (198,200) 0%
Contingency - 450,000 - 450,000 - 0%
Reimbursements 3,894,288 3,953,021 4,032,081 3,941,878 (11,143) 0%
Electric Capital 7,949,664 9,271,500 9,456,930 7,344,000 (1,927,500) -21%
Total 122,924,086 129,450,753 125,070,150 128,099,060 (1,351,693) -1%Interfund Transfers 1,210,000 2,160,000 2,203,200 5,327,500 3,167,500 147%
Net Electric Fund 124,134,086 131,610,753 127,273,350 133,426,560 1,815,807 1%
Revenues
Expenditures
ELECTRIC FUND
Budgeted revenues for the FY 2020-2021 budget have been reduced to reflect usage and projected actuals received as a result of the rate
decrease implemented in FY 2019-2020. With a reduction in interest on investments, and a use of fund balance for capital needs, the total
increase for the fund is 1%.
Personnel Services include a 1% cost of living increase effective January 2021, a 5.72% rate increase for health insurance premiums, and a
second year of employer contributions for retirement. Wholesale power costs are budgeted slightly lower again recognizing customer usage.
Capital expenditures are being budgeted in this fund and in the Electric Capital Fund resulting in a drop in Electric Fund capital but an increase in
the transfer to the Electric Capital Fund.
Mission Statement
ELECTRIC FUND REVENUE & EXPENDITURE NOTATIONS
The Electric Fund is used
to account for the Electric
Operations Department as
well as the Customer
Service Department.
Collectively, these
departments provide
electric services and
simple information access
to the residents and
businesses of the City of
High Point. All expenses
necessary to provide such
services are accounted for
in this fund.
- 30 -

BUDGET 2018-2019 2019-2020 2019-2020 2020-2021 $ % Actual Budget Est. Act. Proposed Change Change
RevenuesFund Balance - - - - - 0%
Operating Revenue 271,562 277,000 235,900 220,000 (57,000) -21%
Misc. & Other Revenue 4,218 6,000 5,910 3,000 (3,000) -50%
Total 275,780 283,000 241,810 223,000 (60,000) -21%Interfund Transfers 150,000 95,729 95,729 320,000 224,271 234%
Net Parking Fund 425,780 378,729 337,539 543,000 164,271 43%ExpendituresPersonnel Services 175,134 207,173 160,034 205,479 (1,694) -1%
Operating Budget 239,589 171,556 121,506 162,521 (9,035) -5%
Capital 209,392 - - 175,000 175,000 0%
Total Parking Fund 624,115 378,729 281,540 543,000 164,271 43%
Revenues
Expenditures
Personnel Services include a 1% cost of living increase effective January 2021, a 5.72% rate increase for health insurance premiums,
and a second year of employer contributions for retirement. The operating budget is lower in comparison to the previous fiscal year
because of lower usage of the parking decks. However, a capital project to upgrade the entrance gate at the Main Street Parking Deck
is budgeted.
PARKING FACILITIES FUNDMission
StatementThe Parking
Facilities Fund
operates under
the direction
of the
Transportation
Department. The
fund is used to
account for the
operation and
maintenance of
the City's various
parking facilities.
Revenues reflect decreased usage from the parking decks because of decline in usage.
PARKING FUND REVENUE & EXPENDITURE NOTATIONS
- 31 -
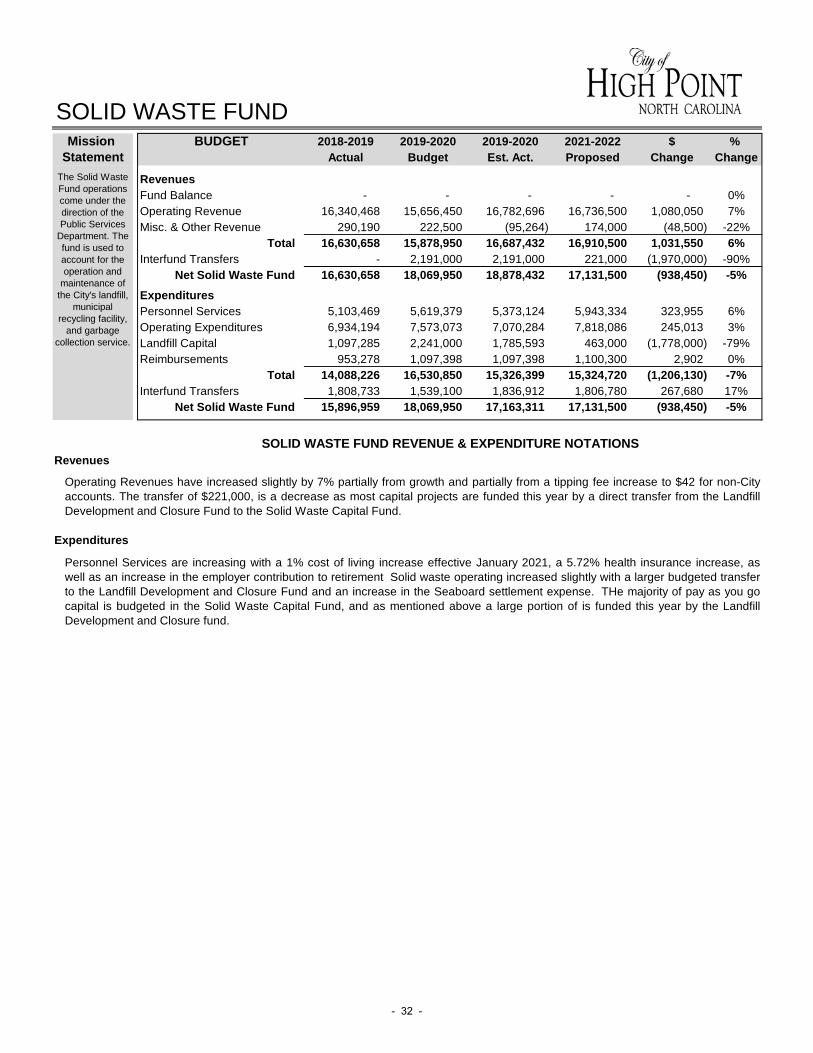
BUDGET 2018-2019 2019-2020 2019-2020 2021-2022 $ % Actual Budget Est. Act. Proposed Change Change
RevenuesFund Balance - - - - - 0%
Operating Revenue 16,340,468 15,656,450 16,782,696 16,736,500 1,080,050 7%
Misc. & Other Revenue 290,190 222,500 (95,264) 174,000 (48,500) -22%
Total 16,630,658 15,878,950 16,687,432 16,910,500 1,031,550 6%Interfund Transfers - 2,191,000 2,191,000 221,000 (1,970,000) -90%
Net Solid Waste Fund 16,630,658 18,069,950 18,878,432 17,131,500 (938,450) -5%ExpendituresPersonnel Services 5,103,469 5,619,379 5,373,124 5,943,334 323,955 6%
Operating Expenditures 6,934,194 7,573,073 7,070,284 7,818,086 245,013 3%
Landfill Capital 1,097,285 2,241,000 1,785,593 463,000 (1,778,000) -79%
Reimbursements 953,278 1,097,398 1,097,398 1,100,300 2,902 0%
Total 14,088,226 16,530,850 15,326,399 15,324,720 (1,206,130) -7%Interfund Transfers 1,808,733 1,539,100 1,836,912 1,806,780 267,680 17%
Net Solid Waste Fund 15,896,959 18,069,950 17,163,311 17,131,500 (938,450) -5%
Revenues
Expenditures
SOLID WASTE FUND
Operating Revenues have increased slightly by 7% partially from growth and partially from a tipping fee increase to $42 for non-City
accounts. The transfer of $221,000, is a decrease as most capital projects are funded this year by a direct transfer from the Landfill
Development and Closure Fund to the Solid Waste Capital Fund.
Personnel Services are increasing with a 1% cost of living increase effective January 2021, a 5.72% health insurance increase, as
well as an increase in the employer contribution to retirement Solid waste operating increased slightly with a larger budgeted transfer
to the Landfill Development and Closure Fund and an increase in the Seaboard settlement expense. THe majority of pay as you go
capital is budgeted in the Solid Waste Capital Fund, and as mentioned above a large portion of is funded this year by the Landfill
Development and Closure fund.
The Solid Waste
Fund operations
come under the
direction of the
Public Services
Department. The
fund is used to
account for the
operation and
maintenance of
the City's landfill,
municipal
recycling facility,
and garbage
collection service.
Mission Statement
SOLID WASTE FUND REVENUE & EXPENDITURE NOTATIONS
- 32 -
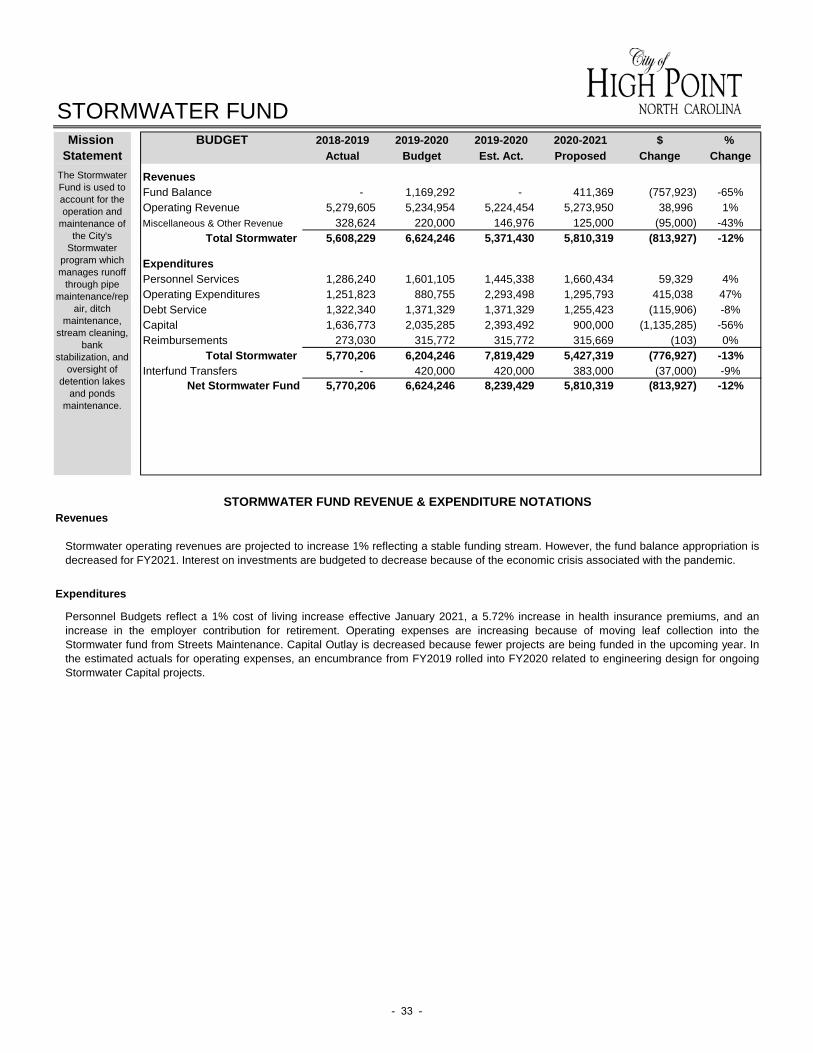
BUDGET 2018-2019 2019-2020 2019-2020 2020-2021 $ % Actual Budget Est. Act. Proposed Change Change
RevenuesFund Balance - 1,169,292 - 411,369 (757,923) -65%
Operating Revenue 5,279,605 5,234,954 5,224,454 5,273,950 38,996 1%
Miscellaneous & Other Revenue 328,624 220,000 146,976 125,000 (95,000) -43%
Total Stormwater 5,608,229 6,624,246 5,371,430 5,810,319 (813,927) -12%
ExpendituresPersonnel Services 1,286,240 1,601,105 1,445,338 1,660,434 59,329 4%
Operating Expenditures 1,251,823 880,755 2,293,498 1,295,793 415,038 47%
Debt Service 1,322,340 1,371,329 1,371,329 1,255,423 (115,906) -8%
Capital 1,636,773 2,035,285 2,393,492 900,000 (1,135,285) -56%
Reimbursements 273,030 315,772 315,772 315,669 (103) 0%
Total Stormwater 5,770,206 6,204,246 7,819,429 5,427,319 (776,927) -13%Interfund Transfers - 420,000 420,000 383,000 (37,000) -9%
Net Stormwater Fund 5,770,206 6,624,246 8,239,429 5,810,319 (813,927) -12%
Revenues
Expenditures
Personnel Budgets reflect a 1% cost of living increase effective January 2021, a 5.72% increase in health insurance premiums, and an
increase in the employer contribution for retirement. Operating expenses are increasing because of moving leaf collection into the
Stormwater fund from Streets Maintenance. Capital Outlay is decreased because fewer projects are being funded in the upcoming year. In
the estimated actuals for operating expenses, an encumbrance from FY2019 rolled into FY2020 related to engineering design for ongoing
Stormwater Capital projects.
STORMWATER FUNDMission
StatementThe Stormwater
Fund is used to
account for the
operation and
maintenance of
the City's
Stormwater
program which
manages runoff
through pipe
maintenance/rep
air, ditch
maintenance,
stream cleaning,
bank
stabilization, and
oversight of
detention lakes
and ponds
maintenance.
Stormwater operating revenues are projected to increase 1% reflecting a stable funding stream. However, the fund balance appropriation is
decreased for FY2021. Interest on investments are budgeted to decrease because of the economic crisis associated with the pandemic.
STORMWATER FUND REVENUE & EXPENDITURE NOTATIONS
- 33 -

BUDGET 2018-2019 2019-2020 2019-2020 2020-2021 $ % Actual Budget Est. Act. Proposed Change Change
RevenuesFund Balance - 848,390 - 904,057 55,667 7%
Other Financing Sources 2,214,123 - - 1,845,000 1,845,000 0%
Charges for Service 9,946,936 9,211,638 9,303,754 8,811,211 (400,427) -4%
Miscellaneous Revenues 4,876,096 4,543,244 4,475,095 4,203,776 (339,468) -7%
Reimbursements 443,323 436,673 - (443,323) -100%
Total 17,037,155 15,046,595 14,215,522 15,764,044 717,449 5%
Interfund Transfers - - - 153,000 153,000 0%
Net Cent. Service Fund 17,037,155 15,046,595 14,215,522 15,917,044 870,449 6%
ExpendituresPersonnel Services 1,706,015 1,878,381 1,897,165 2,040,950 162,569 9%
Operating Budget 6,972,111 6,689,570 6,756,466 6,795,753 106,183 2%
Capital Outlay 6,063,172 4,731,026 4,676,153 6,014,965 1,283,939 27%
Debt Service 1,144,460 1,382,701 1,361,960 1,065,376 (317,325) -23%
Contingency - 364,917 359,443 - (364,917) -100%
Net Cent. Service Fund 15,885,758 15,046,595 15,051,187 15,917,044 870,449 6%
Revenues
Expenditures
CENTRAL SERVICES FUND
The Central Services Fund
is uses to account for the
financing of goods and
services provided by one
department to other
departments on a cost
reimbursement basis.
Personnel Services include a 1% cost of living increase effective January 2021, a 5.72% rate increase for health insurance premiums, and a second year of
large employer contributions for retirement. There are two (2) new Fleet Services Apprenticeship position added to the budget. Several pieces of large
machinery, listed in the Manager's Message, are in the fleet replacement schedule for the upcoming year increasing the amount budgeted in Capital Outlay
by 27%. Debt Service obligations have dropped by 23% for the upcoming year.
Mission Statement
CENTRAL SERVICES FUND REVENUE & EXPENDITURE NOTATIONS
Revenues include Charges for Service and Miscellaneous revenues include charges departments pay for use of fleet, computers and radio equipment.
- 34 -

2018-2019 2019-2020 2019-2020 2020-2021 $ %Actual Budget Est. Actuals Proposed Change Change
Revenues Fund Balance - 300,000 - 87,478 (212,522) -71%
Interest 36,227 25,000 25,531 12,522 (12,478) -50%
Miscellaneous 17,500 - - - - 0%
Transfer - Other Funds 475,000 475,000 475,000 400,000 (75,000) -16%
Total Revenues 528,727 800,000 500,531 500,000 (300,000) -38%
Expenditures -
Contractual Services 567,478 800,000 388,286 500,000 (300,000) -38%
Total Expenditures 567,478 800,000 388,286 500,000 (300,000) -38% Transfers - - - - - 0%
Total Net Expenditures 567,478 800,000 388,286 500,000 (300,000) -38%
Revenues
Expenditures
A reduction in anticipated Economic Incentives are budgeted for the upcoming year.
For FY2021, the General Fund transfer is eliminated. There is sufficient fund balance available to fund the incentives expected for the
The Economic
Development Fund is used
at the City Council's
direction to provide for
possible incentives for
economic development
within the City of High
Point.
ECONOMIC DEVELOPMENT INCENTIVE FUNDMission BUDGETStatement
ECONOMIC DEVELOPMENT INCENTIVE FUND REVENUE & EXPENDITURE NOTATIONS
- 35 -
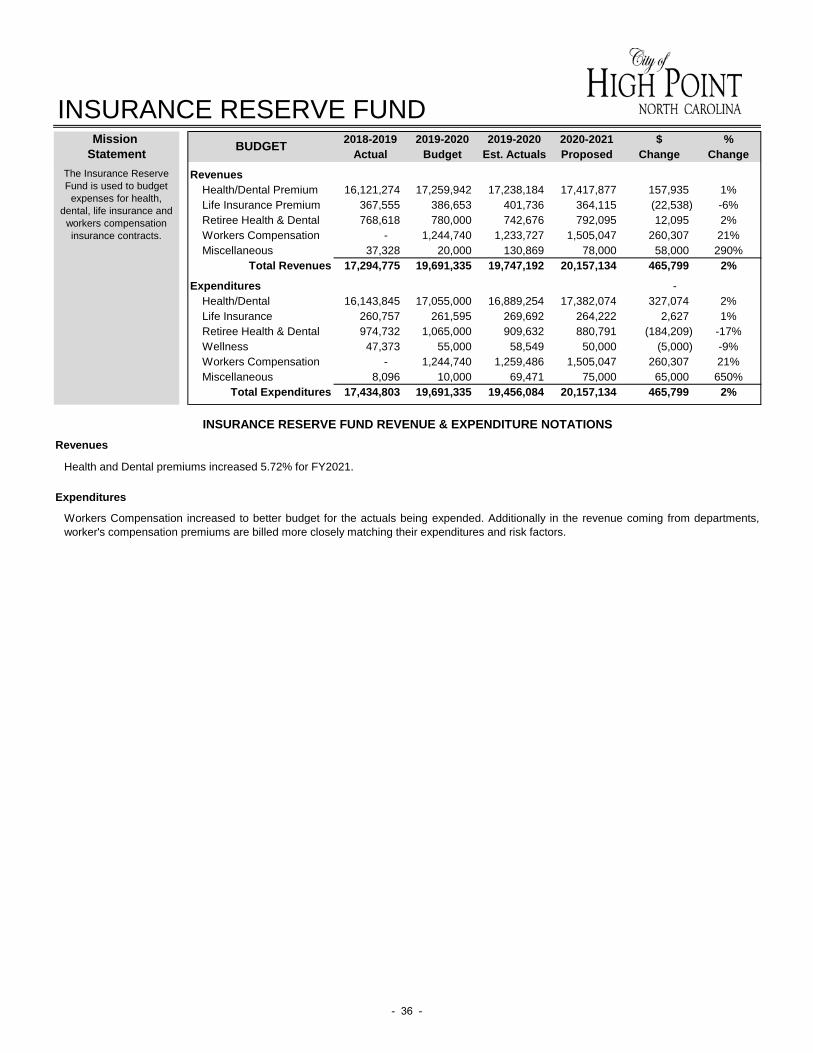
2018-2019 2019-2020 2019-2020 2020-2021 $ %Actual Budget Est. Actuals Proposed Change Change
Revenues Health/Dental Premium 16,121,274 17,259,942 17,238,184 17,417,877 157,935 1%
Life Insurance Premium 367,555 386,653 401,736 364,115 (22,538) -6%
Retiree Health & Dental 768,618 780,000 742,676 792,095 12,095 2%
Workers Compensation - 1,244,740 1,233,727 1,505,047 260,307 21%
Miscellaneous 37,328 20,000 130,869 78,000 58,000 290%
Total Revenues 17,294,775 19,691,335 19,747,192 20,157,134 465,799 2%
Expenditures -
Health/Dental 16,143,845 17,055,000 16,889,254 17,382,074 327,074 2%
Life Insurance 260,757 261,595 269,692 264,222 2,627 1%
Retiree Health & Dental 974,732 1,065,000 909,632 880,791 (184,209) -17%
Wellness 47,373 55,000 58,549 50,000 (5,000) -9%
Workers Compensation - 1,244,740 1,259,486 1,505,047 260,307 21%
Miscellaneous 8,096 10,000 69,471 75,000 65,000 650%
Total Expenditures 17,434,803 19,691,335 19,456,084 20,157,134 465,799 2%
Revenues
Health and Dental premiums increased 5.72% for FY2021.
Expenditures
Workers Compensation increased to better budget for the actuals being expended. Additionally in the revenue coming from departments,
worker's compensation premiums are billed more closely matching their expenditures and risk factors.
The Insurance Reserve
Fund is used to budget
expenses for health,
dental, life insurance and
workers compensation
insurance contracts.
INSURANCE RESERVE FUND REVENUE & EXPENDITURE NOTATIONS
INSURANCE RESERVE FUNDMission BUDGETStatement
- 36 -

2018-2019 2019-2020 2019-2020 2020-2021 $ %Actual Budget Est. Actuals Proposed Change Change
Revenues Room Occupancy Tax 405,082 425,000 325,000 400,000 (25,000) -6%
Business License Tax 1,707,841 1,750,000 1,688,256 1,700,000 (50,000) -3%
General Fund Transfer 240,000 240,000 180,000 - (240,000) -100%
Water-Sewer Fund Transfer 50,000 50,000 50,000 50,000 - 0%
Electric Fund Transfer 710,000 710,000 710,000 710,000 - 0%
Total Revenues 3,112,923 3,175,000 2,953,256 2,860,000 (315,000) -10%
Expenditures -
Market Authority Disbursements 3,112,923 3,175,000 2,953,256 2,860,000 (315,000) -10%
Total Expenditures 3,112,923 3,175,000 2,953,256 2,860,000 (315,000) -10%
Revenues
Expenditures
The City passes through the revenues received in the Market Authority Fund to the Market Authority. Therefore expenditures will match
revenues. For FY2020, Spring Furniture Market was cancelled because of the COVID-19 pandemic. The upcoming fall market is
expanded to nine days, running in three three-day segments to better space out visitors.
The Market Authority Fund
is a public-private
partnership sponsor of the
International Home
Furnishings Market to
develop strategies and
priorities to address
transportation, parking,
hospitality, promotion and
other improvements for the
annual spring and fall
markets.
MARKET AUTHORITYMission BUDGETStatement
MARKET AUTHORITY FUND REVENUE & EXPENDITURE NOTATIONS
Because of continued restrictions and economic impact from the pandemic, revenues are expected and budgeted to be lower in
FY2021.
- 37 -

2018-2019 2019-2020 2019-2020 2020-2021 $ %Actual Budget Est. Actuals Proposed Change Change
1,237,386 2,048,296 1,307,457 2,142,498 94,202 5%
333,948 985,100 1,039,057 704,750 (280,350) -28%
1,571,334 3,033,396 2,346,514 2,847,248 (186,148) -6%
120,000 120,000 120,000 120,000 - 0%
1,691,334 3,153,396 2,466,514 2,967,248 (186,148) -6%
-
693,795 723,692 707,327 752,605 28,913 4%
1,385,455 865,724 1,814,697 1,023,763 158,039 18%
- 1,563,980 - 1,190,880 (373,100) -24%
2,079,250 3,153,396 2,522,024 2,967,248 (186,148) -6%
SUMMARY OF COMMUNITY DEVELOPMENT PROJECTS
FEDERAL PROGRAM INCOME
DEVELOPMEN
T PAYMENT HOME SALES STATE CITY'S SHARE TOTAL
- - - - 65,000 65,000 130,000
- - - - 50,000 55,000 105,000
544,069 18,000 - 197,750 - - 759,819
939,549 50,000 - - - - 989,549
- 18,000 - - - - 18,000
- 71,000 - - - - 71,000
- - 27,000 - - - 27,000
- - 40,000 - - - 40,000
- - 13,880 - - - 13,880
- - 13,000 - - - 13,000
400,000 400,000 - - - - 800,000
1,883,618 557,000 93,880 197,750 115,000 120,000 2,967,248
S108 Dev Pmt - Addington
S108 Dev Pmt - Hartley
S108 Dev Pmt - Avondale
GRANT DESCRIPTION
Construction Training Program/NC Housing
Finance
Urgent Repair/NC Housing Finance
HOME 2021
CDBG 2021
Additional Grants Unanticipated
S108 Dev Pmt - Kirkwood
Total Community Development Fund:
Operating Expenses
The Community Development
Fund accounts for the receipt and
disbursement of all grants,
including federal, state and local
grants or entitlements related to
the Community Development
Block Grant program. The
budget appropriation represents
that portion of existing grants
which were not fully expended in
the prior fiscal year and which will
be reestablished in the current
year and also allowance for
grants that will be received during
the
current year.
Revenues Intergovernmental Revenue
Miscellaneous Revenues
Total RevenuesTransfers
Grants Pending
Total Expenditures
HOME Consortium - Program Income
Neighborhood Stabilization Program
Net Revenues
Expenditures Personnel Services
COMMUNITY DEVELOPMENT FUNDMission BUDGETStatement
- 38 -

2018-2019 2019-2020 2019-2020 2020-2021 $ %Actual Budget Est. Actuals Proposed Change Change
6,382,133 3,690,869 3,895,000 3,542,960 (147,909) -4%
7,067 - 5,000 - - 0%
6,389,200 3,690,869 3,900,000 3,542,960 (147,909) -4%669,374 300,675 300,675 414,273 113,598 38%
7,058,574 3,991,544 4,200,675 3,957,233 (34,311) -1%
712,803 248,209 450,000 180,047 (68,162) -27%
7,088,721 3,743,335 3,600,000 3,777,186 33,851 1%
4,845 - 100,000 - - 0%
7,806,369 3,991,544 4,150,000 3,957,233 (34,311) -1%
FEDERAL STATE LOCAL OTHER CITY'S SHARE TOTAL
- 81,538 - - - 81,538
- 30,000 60,000 90,000
10,574 3,525 14,099
266,592 45,552 21,096 333,240
1,200,000 1,200,000
551,595 551,595
12,941 12,941
48,025 16,009 64,034
24,500 24,500
47,234 141,703 188,937
129,928 129,928
62,376 62,376
50,398 50,398
46,237 46,237
406,551 135,517 542,068
205,368 205,368
4,500 4,500
219,051 100,000 36,423 355,474
1,461,325 2,006,083 45,552 30,000 414,273 3,957,233
DOJ Block Grant - Body Worn Cameras
DWI Task Force
Forfeiture Funds - Pending
State Drug Excise Tax Funds - Pending
Byrne Justice - General Purposes
Transportation Planning PL Grant
Furniture Mkt - NCDOT (pass thru)
PSAP 911 Board
COPS Hiring - Partial Year Program
NC Crime Com -Victim Advocate
P&R
P&R
DEPARTMENT
State Aid to Public Libraries
GRANT DESCRIPTION
USTA Facility Assistance Grant
Senior Center General Purpose Grant
Miscellaneous Revenues
Total Revenues
SUMMARY OF SPECIAL GRANTS PROJECTS
Library
SPECIAL GRANTS FUNDMission
Statement BUDGET
Total Expenditures
The Special Grants Fund
accounts for the receipt and
disbursement of all grants,
including federal, state and
local grants or entitlements but
excluding the Community
Development Block Grant.
The budget appropriation
represents that portion of
existing grants which were not
fully expended in the prior
fiscal year and which will be
reestablished in the current
year and also allowance for
grants that will be received
during the current year.
Expenditures Personnel Services
Operating Expenses
Capital Outlay
Transfers
Net Revenues
Revenues Intergovernmental Revenue
Transportation
Comm Dev & Housing
Police
Police
Transportation
Communications/IT
Police
Police
Police
Police
Police
Police
Police
Police Byrne Justice - Ballistic Vests & Rifle
COPS Hiring - New 2020 Start
COVID Emergency Supplemental
VITA
Additional Grants unanticipated
Fund 301 Total
- 39 -

2018-2019 2019-2020 2019-2020 2020-2021 $ %Actual Budget Est. Actuals Proposed Change Change
Revenues Fund Balance - 789,475 - - (789,475) -100%
Operating Receipts 447,480 607,700 340,475 422,800 (184,900) -30%
Intergovernmental Revenue 3,250,831 2,431,462 2,425,962 3,819,159 1,387,697 57%
Licenses & Permits 393,606 390,000 389,000 390,000 - 0%
Total Revenues 4,091,917 4,218,637 3,155,437 4,631,959 413,322 10%Transfers 887,194 305,500 305,500 7,307 (298,193) -98%
Net Revenues 4,979,111 4,524,137 3,460,937 4,639,266 115,129 3% Expenditures -
Personnel Services 2,670,517 3,052,309 2,869,300 3,224,347 172,038 6%
Operating Expenses 1,090,859 1,425,828 1,300,272 1,414,919 (10,909) -1%
Capital Outlay 81,040 46,000 435,000 - (46,000) 0%
Total Expenditures 3,842,416 4,524,137 4,604,572 4,639,266 115,129 3%
Revenues
Expenditures
MASS TRANSIT FUND REVENUE & EXPENDITURE NOTATIONS
Federal grant revenue is expected to increase, reducing the need for General Fund support. Operating receipts are expected to be
lower than normal due to the Coronavirus Pandemic.
Personnel Services include a 1% cost of living increase effective January 2021, a 5.72% rate increase for health insurance premiums,
and a second year of employer contributions for retirement.
The Public Transportation
division is responsible for
providing safe, reliable
transportation at a fair cost
to all the citizens of High
Point through the fixed
route Hi tran and door-to-
door demand responsive
Dial-A-Lift systems.
MASS TRANSITMission BUDGETStatement
- 40 -

Budget Year Budget YearInfrastructure 2020-2021 Infrastructure - Funding 2020-2021
Transportation 285,000$ Electric Revenue 7,667,500$
Utilities - Electric 7,667,500 Water-Sewer Revenue 7,660,000
Utilities - Water/Sewer 7,660,000 Solid Waste Revenue 1,446,000
Public Services 2,576,000 Stormwater Revenue 1,130,000
State/Federal Agency 88,000
18,188,500$ General Government 197,000
18,188,500$ Other Other - FundingPublic Safety - General Government 1,651,000
City Government -
Recreation & Culture 1,651,000 1,651,000$ 1,651,000$
Total FY 2020-2021 19,839,500$ Total FY 2020-2021 19,839,500$
RECOMMENDED CAPITAL IMPROVEMENT PROGRAM SUMMARYCity of High Point
Fiscal Year 2021-2025The capital budget summary shown below of $20,019,500 is the first year of a five-year capital improvement
program which is reviewed and updated annually to meet the capital needs of the community. The largest
portions are in Water & Sewer and Electric. Water & Sewer includes $1.5 for Obsolete Sewer Lines and a lesser
amount for Obsolete Water; $2.2 million for Burton Rd Improvements. Electric is funding a switch to an AMI
metering system of $1.5 million, $750,000 for Triangle Lake Widening, and $1.5 million for replacement of a
transformer at Deep River. General Capital funding is largely geared towards finalization of projects at the
Catalyst area. Parking is funding an upgrade of payment systems at the Main Street Parking Deck.
Infrastructure improvements remain a top priority of the City's long-term capital planning as the City of High Point
prepares for the present and future challenges of an aging infrastructure, safe water quality and availability of
safe waste disposal.
Expenditure By Program Funding Sources
Capital Expenditure by ProgramFY2020-2021
Transportation Utilities - Electric
Utilities - Water/Sewer Public Services
Recreation & Culture
Capital Funding SourcesFY2020-2021
State/Federal Agency Electric Revenue
Water-Sewer Revenue General Government
Landfill Revenue Stormwater Revenue
- 41 -

No. Title
2020 Approp. Budget
Current Remaining
Budget FY2021 FY2022 FY2023 FY2024 FY2025 Avail. Total
Budget 401-General Capital Projects FundGeneral Capital Fund Pay as you Go00349 Arc Flash - - - 35,000 35,000 35,000 35,000 140,000
03041 Station Upgrades and Renovations- HQ 50,000 233,756 - 265,000 250,000 250,000 250,000 1,248,756
03852 Storage Building at Training Facility - - - 60,000 - - - 60,000
00096 Fire Station #7 Replacement - Gordon St. - - - - 125,000 - - 125,000
00097 Fire Station #14< Station 26> Sandy Ridge Road - - - - 125,000 - - 125,000
00174 Fire Station #6 Replacement - 110 E. Springfield Rd. - - - 125,000 - - - 125,000
00271 Burn Facility - - - - 250,000 250,000 - 500,000
03860 Fire Station #9- Triangle Lake Rd - - - - - 125,000 - 125,000
00317 Berm at Firing Range - - - 50,000 - - - 50,000
00296 Oak Hollow Lake Bulkheads - - 257,000 276,000 - - - 533,000
00063 Park Imp/Parking Lots 75,000 1,001 - 185,000 250,000 386,000 - 822,001
00047 Playground & Equipment - -14,085 - 75,000 75,000 75,000 75,000 285,915
00312 Appling Way Catalyst Development 804,000 -980,589 1,000,000 - - - - 19,411
00316 Stadium Capital Maintenance Reserve - - 180,000 360,000 360,000 360,000 360,000 1,620,000
00345 Catalyst - Stage/Bridge Project - - 84,000 - - - - 84,000
00350 Catalyst - Batters Eye - - 130,000 - - - - 130,000
00031 Tour Boat Repl. - - - 75,000 - - - 75,000
00046 Merry-Go-Round Replacement - - - - 300,000 - - 300,000
00055 Park Impr/Outdoor Courts - - - 42,000 31,500 - - 73,500
03862 Southside Rec Center Bldg. Improvements 70,000 12,677 - 80,000 55,000 - - 147,677
03863 Morehead Rec Center Bldg. Improvements - - - 100,000 69,000 - - 169,000
03864 Oakview Rec Center Bldg. Improvements - - - 100,000 30,000 - - 130,000
00322 Restroom Buildings - - - 70,000 70,000 - - 140,000
00319 Expansion - Ann & Jim Morgan Community Room - - - 250,000 - - - 250,000
00320 LEID SmartAccess Electronic Lockers - - - 32,000 - - - 32,000
00343 Theatre Sewer Lines - - - 72,000 - - - 72,000
03832 GIS Orthoimagery Program - 2022 Project 40,000 80,001 - 44,000 44,000 - - 168,001
00309 2040 Comprehensive Plan Project - - - 100,000 100,000 150,000 - 350,000
00303 CMAQ & STIP Sidewalks - - - 75,000 - - 50,000 125,000
03835 City Sidewalk Construction 50,000 55,000 - 237,500 237,500 237,500 237,500 1,005,000
00040 Local Match for NCDOT Funded Projects 50,000 26,940 - 75,000 75,000 50,000 50,000 276,940
00017 Railroad Crossings Improvements - 25,000 - 25,000 50,000 25,000 50,000 175,000
00104 I-74/US 311 & NC 68 (Eastchester Drive) Interchange Im 50,000 242,450 - 75,000 75,000 - - 392,450
00142 Johnson Street/Sandy Ridge Road Construction - - - - - - 750,000 750,000
00143 Skeet Club Road Sidewalks - 350,000 - 75,000 75,000 - - 500,000
00332 Traffic Signal System Expansion and Upgrades 50,000 78,052 - 85,000 100,000 - - 263,052
00599 S. Main Gateway US 29-70 Interchange Improv. - - - - 75,000 75,000 75,000 225,000
03289 Mendenhall Terminal Improvements 70,000 309,455 - 250,000 250,000 - - 809,455
03858 Local Match for NCDOT Bridge projects 30,000 210,566 - 45,000 45,000 45,000 45,000 390,566
00295 Mausoleum Improvements - - - 36,500 - - - 36,500
03809 Cemetery Paving & Asphalt Road Work - - - 50,000 50,000 - - 100,000
00022 Sub-Standard Streets Maintenance - - - 50,000 50,000 50,000 50,000 200,000
Total General Capital Pay as you Go 1,339,000 630,224 1,651,000 3,475,000 3,252,000 2,113,500 2,027,500 13,149,224
General Capital Bonds (unauth)00096 Fire Station #7 Replacement - Gordon St. - - - - - 4,150,000 - 4,150,000
00097 Fire Station #14< Station 26> Sandy Ridge Rd - - - - - 4,402,735 - 4,402,735
00174 Fire Station #6 Replacement - 110 E Springfield Rd - - - - 4,274,500 - - 4,274,500
03860 Fire Station #9- Triangle Lake Rd - - - - - - 4,534,817 4,534,817
00098 Fire Station#15/Tower Site - - - - - - 8,400,000 8,400,000
00173 Fire Dept. Inspections Offices - - - 3,225,000 - - - 3,225,000
00175 Fire Station #8 Replacement - English Rd at Burton - - 4,875,000 - - - 4,875,000
03051 Fire Training Apparatus Building/Classrooms - - - - - 2,500,000 - 2,500,000
00842 Rotary at Ray Bridge Replacement - - - 1,680,000 - - - 1,680,000
00029 Dillon Rd Park Development - - - - - 2,000,000 - 2,000,000
01906 High Point Athletic Complex Phase III - - - - - 2,000,000 - 2,000,000
00299 City Lake Park Renovations (Phase II) - - - - - - 9,000,000 9,000,000
Total General Capital Bonds (unauth) - - - 9,780,000 4,274,500 15,052,735 21,934,817 51,042,052
General Capital Lease Purchase03866 ERP Upgrade - 29,281 - 3,750,000 - - - 3,779,281
Total General Capital Lease Purchase - 29,281 - 3,750,000 - - - 3,779,281
Prior Years
FY2021 - 2025 City of High Point City Manager Recommended Capital Improvement Plan Project Budget By Fiscal Year
- 42 -

No. Title
2020 Approp. Budget
Current Remaining
Budget FY2021 FY2022 FY2023 FY2024 FY2025 Avail. Total
Budget
Prior Years
FY2021 - 2025 City of High Point City Manager Recommended Capital Improvement Plan Project Budget By Fiscal Year
Total: 401-General Capital Projects Fund 1,339,000 659,505 1,651,000 17,005,000 7,526,500 17,166,235 23,962,317 67,970,557
421-Water & Sewer Capital Projects FundW & S Pay as you Go00035 Water Storage Tank Maintenance 100,000 643,337 - 100,000 100,000 100,000 100,000 1,043,337
00113 Obsolete Sewer Lines 1,500,000 1,447,269 1,500,000 1,500,000 1,500,000 1,500,000 1,500,000 8,947,269
00125 Sewer System Improvements - 239,829 50,000 125,000 125,000 125,000 125,000 789,829
00127 Water/Sewer Developer Reimbursements - 866,074 - 150,000 150,000 150,000 150,000 1,466,074
00136 Water System Improvements 125,000 521,281 50,000 125,000 125,000 125,000 125,000 1,071,281
00144 Alum Sludge Removal 250,000 969,563 200,000 375,000 375,000 375,000 375,000 2,669,563
00145 Obsolete Water Lines 1,500,000 1,733,866 820,000 1,500,000 1,500,000 1,500,000 1,500,000 8,553,866
00178 NCDOT - TIP Program (W/S Utilities) - 637,881 - 150,000 150,000 150,000 150,000 1,237,881
00292 Lasalle Siphon Improvs - W.S - - - - 286,000 - - 286,000
00294 Ward Water Plant Filters 1-4 Rebuild - - - - 600,000 - - 600,000
00305 Waterview Pump Station Upgrade - - - - 5,000,000 - - 5,000,000
00313 Appling Way Water/Sewer Lines 301,000 -197,849 300,000 - - - - 102,151
00335 Pre-Heat Burner - - 500,000 - - - - 500,000
00336 Arc Flash Project - W/S - - 100,000 100,000 - - - 200,000
00337 Watershed Protection Plan - 459,410 150,000 150,000 - - - 759,410
00339 E. Washington St (Gaylord - Downing) - - - 1,230,000 - - - 1,230,000
00340 Burton Road (Westchester to City Limits) - - 2,160,000 - - - - 2,160,000
00352 Primary Catwalks - Eastside - - 300,000 - - - - 300,000
01611 Large Water Meter Chg Out 1.5" and up - 120,954 - 150,000 150,000 150,000 150,000 720,954
02787 Eastside UV System Upgrade 400,000 277,500 380,000 1,000,000 - - - 1,657,500
02803 City Lake Dam Upgrade - - - - 200,000 - 10,000,000 10,200,000
03211 Westside Centrifuge Upgrade 100,000 100,000 - 750,000 750,000 - - 1,600,000
03253 Diffusers - Eastside - - - - 500,000 - - 500,000
03815 Johnson Street Siphon - - - - - 1,000,000 - 1,000,000
03840 Clarifier Rehabilitation - ES - - - - 360,500 - - 360,500
03843 Catalyst Water - Stadium Completion 250,000 -536,922 550,000 150,000 - - - 163,078
03844 Catalyst Sewer - Stadium Completion 250,000 -606,680 600,000 150,000 - - - 143,320
Total: 421-Water & Sewer Capital Projects Fund 4,776,000 6,675,513 7,660,000 7,705,000 11,871,500 5,175,000 14,175,000 53,262,013
W & S Revenue Bonds00027 Gallimore Dairy Road Widening (W/S Utilities) - - - - - - 800,000 800,000
00072 Ensley Outfall 2B - - - - - - 2,000,000 2,000,000
00141 Dilworth Rd / Squire Davis Loop 2,620,000 - - 1,310,000 - - - 1,310,000
00150 NW Water System Imprs Phase 3 - - - - 2,500,000 - - 2,500,000
00163 NCDOT Johnson St/Sandy Ridge Rd Widening (W/S Ut - - - - 3,400,000 - - 3,400,000
00190 Rich Fork Outfall 2A & 3 - - - - 2,400,000 - - 2,400,000
00226 NW Sewer System Improvs Future 3 - - - 1,000,000 - - - 1,000,000
00228 Registers Creek Lift Station 250,000 171,300 - - 7,500,000 - - 7,671,300
00434 Northwest Sewer Improvements - - - - - - 9,123,740 9,123,740
02803 City Lake Dam Upgrade - - - - 18,000,000 - 10,000,000 28,000,000
03810 Irbywood-E. Parris Sewer Improv (Hunter Farms) - - - - - 250,000 - 250,000
03823 East Fork Lift Station - - - - 1,100,000 - - 1,100,000
03824 NE Sewer Line Repl - Upstream of Gallimore Dairy - - - - - - 1,000,000 1,000,000
00304 Partial Expansion of Riverdale - Ph 1 - - - - 20,000,000 - - 20,000,000
00305 Waterview Pump Station Upgrade - - - - 6,000,000 - - 6,000,000
Total W & S Revenue Bonds 2,870,000 171,300 0 2,310,000 60,900,000 250,000 22,923,740 86,555,040
Total: 421-W & S Capital Projects Fund 7,646,000 6,846,813 7,660,000 10,015,000 72,771,500 5,425,000 37,098,740 139,817,053
441-Transit Capital Projects Fund02881 Hi tran Bus Fleet Replacement - - - - 500,000 - - 500,000
03833 Bus Stop Amenities (Shelters & Benches) - - - 200,000 - - - 200,000
00308 Mobile Radio Replacement - - 110,000 - - - - 110,000
00323 Five Points Transfer Hub - - - 750,000 250,000 - - 1,000,000
00329 Operators' Training Facility - - - 46,875 46,875 1,406,250 - 1,500,000
00333 Transit Maintenance Facility Renovation - - - - 50,000 700,000 - 750,000
Total: 441-Transit Capital Projects Fund - - 110,000 996,875 846,875 2,106,250 - 4,060,000
631-Electric Fund
- 43 -

No. Title
2020 Approp. Budget
Current Remaining
Budget FY2021 FY2022 FY2023 FY2024 FY2025 Avail. Total
Budget
Prior Years
FY2021 - 2025City of High Point City Manager Recommended Capital Improvement Plan
Project Budget By Fiscal Year
00026 Automated Meter Reading Initiative 1,000,000 2,667,435 1,500,000 1,500,000 1,500,000 1,500,000 200,000 8,867,435
00059 Area Outdoor Lighting 110,000 708,777 200,000 200,000 200,000 200,000 - 1,508,777
00060 Street Lighting 700,000 653,241 300,000 300,000 300,000 300,000 - 1,853,241
00061 Downtown Underground 200,000 217,642 200,000 200,000 200,000 200,000 - 1,017,642
00081 New Jackson Lake Transformer - 630,739 - - 1,400,000 1,400,000 - 3,430,739
00166 Overhead to Underground Conversion - 260,641 100,000 100,000 100,000 100,000 100,000 760,641
00194 Triangle Lake Widening - - 750,000 - - - - 750,000
00256 Phillips Substation Expansion - - - - - 1,500,000 1,500,000 3,000,000
00311 S Main St. OH to UG - B85 Bridge Replacement 300,000 300,000 300,000 - - - - 600,000
00321 UG Subdivision Cable Replacement - 377,545 600,000 600,000 600,000 600,000 600,000 3,377,545
00326 Actuate to Cognos Conversion - - 135,000 - - - - 135,000
00327 Oracle to Microsoft SQL - - 175,000 - - - - 175,000
00342 Fiber Replacement - - 500,000 500,000 - - - 1,000,000
00346 New Electric MOC-Building Construction - - - - - - 2,500,000 2,500,000
00347 Hammer to Lexington Ave Transmission - - - - - - 1,500,000 1,500,000
00348 Washington Street Project - - 150,000 - - - - 150,000
01484 Deep River Transformer 2 replacement - - 1,457,500 - - - - 1,457,500
01508 Eastchester Transformer 1 replacement - - - 1,457,500 - - - 1,457,500
01526 Medium Voltage (Outdoor) Replacement Breaker 500,000 616,648 250,000 750,000 750,000 750,000 - 3,116,648
02424 Replace Fairfield T2 Transformer 750,000 750,000 750,000 - - - - 1,500,000
03639 Deep River to Penny Rd. Transmission Line 1,000,000 910,500 - 2,000,000 2,000,000 - - 4,910,500
03827 100 kV Breakers 300,000 365,700 300,000 - - - - 665,700
03829 Replace Eastchester Transformer #2 - - - - - 500,000 500,000 1,000,000
03848 Replace Fairfield Transformer #1 - - - - 500,000 500,000 - 1,000,000
Total: 631-Electric Capital Projects 4,860,000 8,458,868 7,667,500 7,607,500 7,550,000 7,550,000 6,900,000 45,733,868
00542 Parking Facility Improvements - 4560 175,000 525,000 500,000 - - 1,204,560
Total: 651 - Parking Fund - 4,560 175,000 525,000 500,000 - - 1,204,560
661-Solid Waste Fund00122 Landfill Develop - Land Purchase 170,000 869,159 50,000 50,000 50,000 50,000 50,000 1,119,159
00301 Truck/Equipment Wash Station - Landfill - - 175,000 - - - - 175,000
00815 Kersey Valley Road Relocation 1,500,000 3,669,360 - 2,125,000 2,125,000 - - 7,919,360
01102 Kers Valley Ph I - IV Post Closure - Reserve 171,000 196,425 171,000 171,000 171,000 171,000 171,000 1,051,425
01191 Kersey Valley Landfill Ph VI Expansion - 5,100 1,000,000 2,000,000 2,000,000 - - 5,005,100
03819 Environmental Services Admin Building 25,000 25,000 - 825,000 - - - 850,000
03820 Kersey Valley Landfill Transfer Station - 269,900 - - - 200,000 200,000 669,900
03856 MRF Ongoing Maintenance 50,000 20,283 50,000 50,000 50,000 50,000 50,000 270,283
03857 Asphalt & Underlayment - Ingleside and KV Landfill 350,000 700,000 - 500,000 - - - 1,200,000
Total: 661-Solid Waste Fund 2,266,000 5,755,227 1,446,000 5,721,000 4,396,000 471,000 471,000 18,260,227
671-Storm Water Fund00134 Storm Water Projects - Routine Projects 425,000 214,878 450,000 450,000 450,000 450,000 450,000 2,464,878
03068 Ray Street (R1,2,3a,b,c,d)/Hospital 500,000 460,101 - - 1,500,000 2,960,000 4,060,000 8,980,101
00780 Jacobs Place (JP7) 500,000 860,000 - - 2,760,000 3,430,000 - 7,050,000
00192 Country Club/Rockford/Dover/Kensington - 215,005 - - 1,587,600 - - 1,802,605
03845 Catalyst Stormwater - Stadium 570,285 -407,507 450,000 - - - - 42,493
03031 Hamilton Street (M2) - CBD NE Side 250,000 250,000 - - 1,320,000 - - 1,570,000
03073 Rockford/Rotary/Farris (F1f, F2, F4, F8, F12) - - - 400,000 - - - 400,000
00314 Appling Way Stormwater 170,000 -172,281 230,000 - - - - 57,719
Total: 671-Storm Water Fund 2,415,285 1,420,196 1,130,000 850,000 7,617,600 6,840,000 4,510,000 22,367,796
651 - Parking Fund
- 44 -

Recommended