City of Los Angeles VMT Calculator
Documentation
Los Angeles Department of Transportation (LADOT) and Los Angeles Department of City Planning (DCP)
February 2019

City of Los Angeles
TABLE OF CONTENTS
Chapter 1. Executive Summary .............................................................................................. 1
1.1 Project Information ............................................................................................................. 1
1.2 Base Vehicle Trips and VMT Calculations ........................................................................... 1
1.3 Transportation Demand Management Strategies .............................................................. 3
1.4 Reporting............................................................................................................................. 3
Chapter 2. Project Information .............................................................................................. 4
2.1 Address Lookup ................................................................................................................... 4
2.2 Land Use Type ..................................................................................................................... 4
Chapter 3. Base Vehicle Trips and VMT Calculations ............................................................... 7
3.1 Initial Trip Generation ......................................................................................................... 7
3.2 MXD Reductions .................................................................................................................. 9
3.2.1 MXD Methodology ..................................................................................................... 9
3.2.2 LA VMT Calculator MXD Refinements ..................................................................... 11
3.2.3 Travel Demand Model Information ......................................................................... 11
3.2.4 Validation ................................................................................................................. 12
3.3 Vehicle Miles Traveled ...................................................................................................... 13
3.4 Site Specific Population and Employment Assumptions .................................................. 13
Chapter 4. Transportation Demand Management Strategies ................................................ 14
Chapter 5. Reporting ........................................................................................................... 15
LIST OF TABLES
Table 1: Land Use and Trip Generation Base Assumptions ........................................................... 8
Table 2: Daily Trip Generation Validation Statistics..................................................................... 12

City of Los Angeles
APPENDICES
Appendix A: Travel Behavior Zones
Appendix B: Affordable Housing Trip Generation Study
Appendix C: Validation Sites
Appendix D: Observed Versus Modeled Trip Generation
Appendix E: Trip Purpose Assumptions

City of Los Angeles VMT Calculator Documentation
February 2019
City of Los Angeles 1
Chapter 1. Executive Summary
The City of Los Angeles Vehicle Miles Traveled (VMT) Calculator was developed to estimate
project-specific daily household VMT per capita and daily work VMT per employee for land use
development projects. This tool is intended to be used for development projects within the City
of Los Angeles, and the VMT methodology is tailored to the City of Los Angeles Transportation
Assessment Guidelines.
This document describes the methodology for how vehicle trips and VMT are calculated in the
tool and how transportation demand management (TDM) strategies are applied to reduce
vehicle trips and VMT estimates from the Calculator. The tool is divided into the following four
sections.
1.1 Project Information
The project information column of the tool allows users to enter their project location and land
use mix. The tool relies on the City of Los Angeles geocoder to find the location of the project’s
address. The latitude and longitude are passed to a lookup function in the tool to define more
detailed information about the surrounding land uses, travel characteristics, and built
environment. The lookup information is obtained from the City of Los Angeles Travel Demand
Forecasting (TDF) Model and the City of Los Angeles Travel Behavior Zones (TBZ).
This is also the section of the tool that allows the user to enter their project information. This
includes entering the type and quantity of land use. The tool provides information for 29 distinct
land uses. It also provides the option to submit custom land use information if the project
proposes a land use category not included in the tool.
1.2 Base Vehicle Trips and VMT Calculations
After the user enters the project location and land use information, the tool estimates base
‘proposed project’ related vehicle trip generation and VMT in the ‘Analysis Results’ column. This
section does not require input from the user, but instead uses information from the previous
step to provide output. The base trip generation is primarily based on the Institute of
Transportation Engineers’ (ITE’s) Trip Generation, 9th Edition manual. However, there are a few
land uses that rely on other sources for trip generation information.

City of Los Angeles VMT Calculator Documentation
February 2019
City of Los Angeles 2
The base trip generation estimate is adjusted in this step using the MXD methodology. This
methodology relies on sociodemographic and built environment factors of the project’s
surroundings. These factors include the following information which is provided in the first step
of the model:
• The relative numbers of residents and jobs – the better the site’s jobs/housing balance,
the greater the proportion of commute trips that remain internal.
• The density of development – the greater the concentration of dwellings and commercial
space per acre, the greater the likelihood that the interacting land uses will be near
enough together to encourage walking or short-distance internal driving.
• The connectivity for walking or driving among different activities – measured in terms
of the ratio of intersections to total land area within one mile directly influences trip
internalization and the number of trips made by walking instead of driving. An example
of this is an area like Koreatown which has a higher intersection density versus Toluca
Lake which has a lower intersection density. Walking or biking to destinations in
Koreatown is easier because the street grid is more connected, making short trips easier
than in Toluca Lake where a more circuitous route is needed to reach a destination.
• The availability of transit – the greater the number of jobs within a reasonable travel time
via transit, the greater the share of travel likely to occur by transit, and the lower the
vehicular traffic generation. An example of this is someone who lives close to the Metro
Red Line and has access to many jobs via transit versus someone living in an area less well
served by transit who has limited access to jobs via transit and will be more likely to drive.
• The number of convenient trip destinations within the immediate area – the number of
retail and other jobs in neighborhoods immediately surrounding the site increases the
amount of walking to/from the site and reduces traffic generation.
• Vehicle ownership – a higher number of cars available per household increases the
likelihood that trips will use a vehicle instead of taking other modes.
• Household Size – as the size of the household increases, more trips are made by the
household.
City of Los Angeles VMT Calculator Documentation
February 2019
City of Los Angeles 3
1.3 Transportation Demand Management Strategies
The Transportation Demand Management (TDM) Strategies column includes a series of VMT
reduction strategies that the user defines for the proposed project and for the proposed project
with applied mitigation measures. Many TDM strategies were explored for this section, but the
tool only includes strategies that have empirical evidence documenting their potential to reduce
VMT. The seven categories from which users can select strategies include:
1. Parking: Reducing, unbundling, permitting, pricing parking.
2. Transit: Transit subsidies, reduced headways, neighborhood shuttles.
3. Education & Encouragement: Travel behavior change program, promotions/marketing.
4. Commute Trip Reductions: Required commute trip reduction program, vanpool, ride-
share.
5. Shared Mobility: Car-share, bike share, school carpool program.
6. Bicycle Infrastructure: On-street bike facilities, bike parking, bike facilities, showers.
7. Neighborhood Enhancement: Traffic calming, pedestrian network improvements.
1.4 Reporting
Vehicle trip and VMT reporting is tailored to the City of Los Angeles guidelines and impact criteria.
The VMT Calculator reports daily vehicle trips, VMT, household VMT per capita, and work VMT
per employee. The trips and VMT are reported for the proposed project and for the project with
mitigation measures. The VMT for the project and the VMT for the project with mitigation are
also compared against the City’s thresholds for household VMT per capita and work VMT per
employee. In addition to the summary reporting, the VMT Calculator also provides the following
four detailed reports:
1. Overview: Documents the inputs and outputs of the tool for the specified project.
2. TDM Inputs: Provides a breakdown of the TDM measures that were selected for the
project.
3. TDM Outputs: Reports the VMT reductions associated with the TDM measures selected.
4. MXD: Reports the VMT reductions associated with the mix of land uses in the project and
the demographics and built form of the surrounding area.

City of Los Angeles VMT Calculator Documentation
February 2019
City of Los Angeles 4
Chapter 2. Project Information
2.1 Address Lookup
The address lookup uses the LA City Geocoder to find the latitude and longitude of the project
address. Users may also enter the latitude and longitude if they have information that is more
accurate than the geocoder.
As discussed further in Section 3.2.3, the VMT Calculator uses a project’s latitude and longitude
to look up various information from the City of Los Angeles Travel Demand Forecasting Model.
The address lookup also determines within which Travel Behavior Zone the project is located.
TBZs are classified as one of the following four uses:
1. Suburban (Zone 1): Very low-density development primarily centered around single-
family homes and minimally connected street network.
2. Suburban Center (Zone 2): Low-density developments with a mix of residential and
commercial uses with larger blocks and lower intersection density.
3. Compact Infill (Zone 3): Higher density neighborhoods that include multi-story buildings
and well connected streets.
4. Urban (Zone 4): High-density neighborhoods characterized by multi-story buildings with
a dense road network.
A detailed description of the TBZ development and a map of the TBZ system is shown in Appendix
A.
2.2 Land Use Type
The land use categories included in the VMT Calculator tool are based on the land uses identified
in the ITE Trip Generation manual (except where otherwise identified in Section 3.1). The
following land uses are included in the VMT Calculator:
• Single family residential
• Multi-family residential
• Townhouse
• Affordable housing

City of Los Angeles VMT Calculator Documentation
February 2019
City of Los Angeles 5
o Family
o Senior
o Special Needs
o Permanent Supportive
• Hotel
• Motel
• General retail
• Furniture store
• Pharmacy/drugstore
• Supermarket
• Bank
• Health club
• High-turnover sit-down restaurant
• Fast-food restaurant
• Quality restaurant
• Auto repair
• Home improvement superstore
• Free-standing discount store
• Movie theater
• General office
• Medical office
• Light industrial
• Manufacturing
• Warehouse
• University
• High school
• Middle school
• Elementary school
• Private school (K-12)
Users can input custom land uses if the project does not fall within one of these pre-defined
categories. The user will need to provide the following information about custom land uses:

City of Los Angeles VMT Calculator Documentation
February 2019
City of Los Angeles 6
• Define if the land use is a retail or non-retail land use.
• Define the number of residents and/or employees in the land use.
• Define the trip purpose split for productions and attractions from and to the land use.
This information should be provided using the best available information about travel
characteristics of similar land uses and/or using engineering judgement. The trip purpose
splits in Appendix B can also be used as a reference.
City of Los Angeles VMT Calculator Documentation
February 2019
City of Los Angeles 7
Chapter 3. Base Vehicle Trips and VMT Calculations
The LA VMT calculator has three distinct steps to calculate base vehicle trips and VMT. These
steps include:
1. Initial Trip Generation
2. Mixed-use (MXD) Trip Reductions and Travel Demand Model Lookup Values
3. Household VMT per Capita and Work VMT per Employee
3.1 Initial Trip Generation
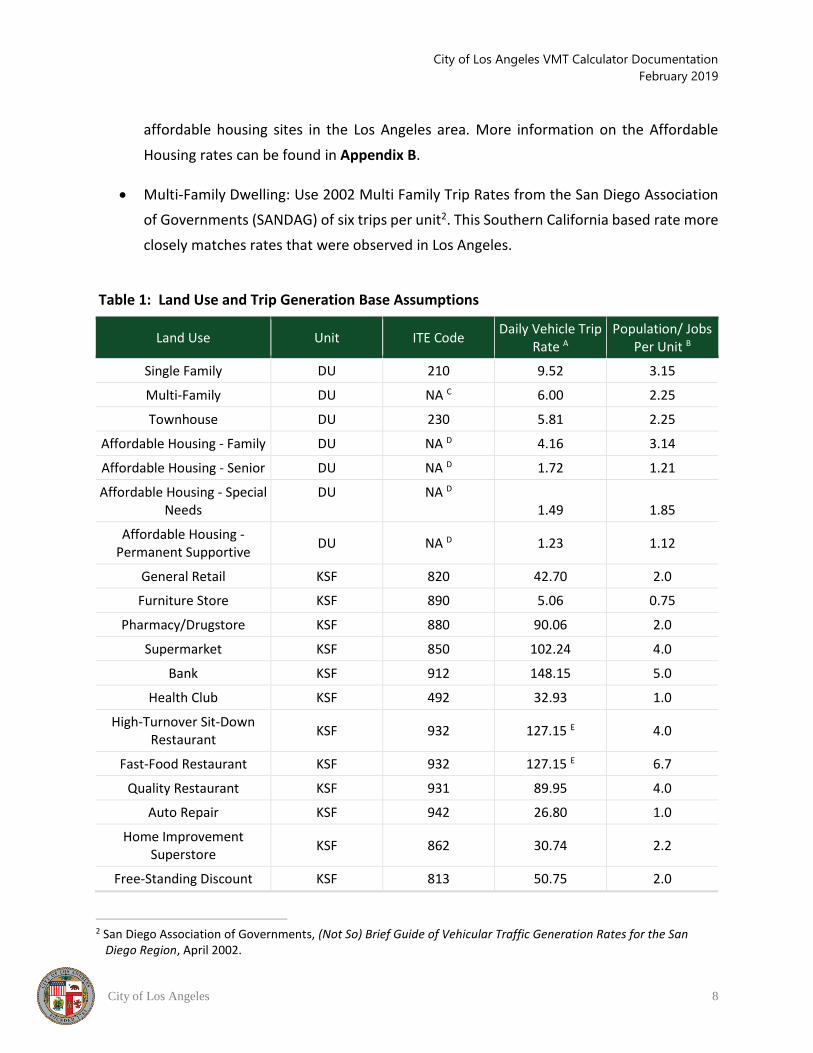
All land uses utilize the average daily vehicle trip generation rates from the ITE Trip Generation,
9th Edition (Institute of Transportation Engineers, 2012) as a starting point1. These trip
generation rates are shown in Table 1 (note: this table also shows population or job factors per
unit, which is explained further in Section 3.3). The following land uses are exceptions to this rule.
• High-Turnover Restaurants: Use the ITE 932 daily rate of 127.15 trips per thousand square
feet for Suburban and Suburban Center TBZs. Urban and Compact Infill TBZs are reduced
by one standard deviation (41.77 daily trips) to account for the increased amount of
walking, biking, and transit trips in more dense environments.
• General Office: Use the ITE 710 Log Equation Ln(T) = 0.76 Ln(X) + 3.68 for office space
above 206KSF and the average rate of 11.03 for office space at or below 206KSF.
• Affordable Housing: Uses a base average daily trip rate depending on the type of
affordable housing:
o Family: 4.16
o Senior: 1.72
o Special Needs: 1.49
o Permanent Supportive 1.23
These base rates are further reduced using MXD based on surrounding demographics and
built environment factors. These rates were determined using observations of 42
1 The LA VMT Calculator was under development prior to release of the 10th Edition of ITE’s trip generation manual
in late 2017. The VMT Calculator was validated to LA conditions based on the empirical counts conducted at market rate residential, affordable housing, office, and mixed-use sites in the City, regardless of the source of the rates used as a starting point.
City of Los Angeles VMT Calculator Documentation
February 2019
City of Los Angeles 8
affordable housing sites in the Los Angeles area. More information on the Affordable
Housing rates can be found in Appendix B.
• Multi-Family Dwelling: Use 2002 Multi Family Trip Rates from the San Diego Association
of Governments (SANDAG) of six trips per unit2. This Southern California based rate more
closely matches rates that were observed in Los Angeles.
Table 1: Land Use and Trip Generation Base Assumptions
Land Use Unit ITE Code Daily Vehicle Trip
Rate A Population/ Jobs
Per Unit B
Single Family DU 210 9.52 3.15
Multi-Family DU NA C 6.00 2.25
Townhouse DU 230 5.81 2.25
Affordable Housing - Family DU NA D 4.16 3.14
Affordable Housing - Senior DU NA D 1.72 1.21
Affordable Housing - Special Needs
DU NA D 1.49 1.85
Affordable Housing - Permanent Supportive
DU NA D 1.23 1.12
General Retail KSF 820 42.70 2.0
Furniture Store KSF 890 5.06 0.75
Pharmacy/Drugstore KSF 880 90.06 2.0
Supermarket KSF 850 102.24 4.0
Bank KSF 912 148.15 5.0
Health Club KSF 492 32.93 1.0
High-Turnover Sit-Down Restaurant
KSF 932 127.15 E 4.0
Fast-Food Restaurant KSF 932 127.15 E 6.7
Quality Restaurant KSF 931 89.95 4.0
Auto Repair KSF 942 26.80 1.0
Home Improvement Superstore
KSF 862 30.74 2.2
Free-Standing Discount KSF 813 50.75 2.0
2 San Diego Association of Governments, (Not So) Brief Guide of Vehicular Traffic Generation Rates for the San
Diego Region, April 2002.
City of Los Angeles VMT Calculator Documentation
February 2019
City of Los Angeles 9
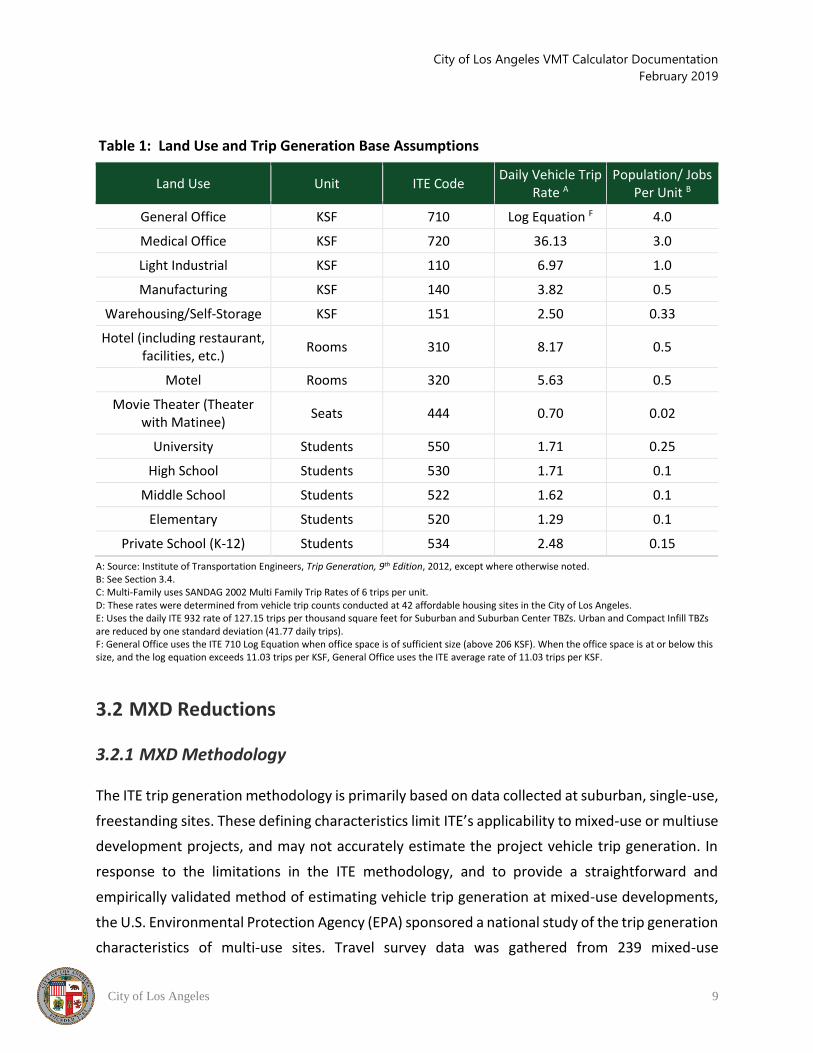
Table 1: Land Use and Trip Generation Base Assumptions
Land Use Unit ITE Code Daily Vehicle Trip
Rate A Population/ Jobs
Per Unit B
General Office KSF 710 Log Equation F 4.0
Medical Office KSF 720 36.13 3.0
Light Industrial KSF 110 6.97 1.0
Manufacturing KSF 140 3.82 0.5
Warehousing/Self-Storage KSF 151 2.50 0.33
Hotel (including restaurant, facilities, etc.)
Rooms 310 8.17 0.5
Motel Rooms 320 5.63 0.5
Movie Theater (Theater with Matinee)
Seats 444 0.70 0.02
University Students 550 1.71 0.25
High School Students 530 1.71 0.1
Middle School Students 522 1.62 0.1
Elementary Students 520 1.29 0.1
Private School (K-12) Students 534 2.48 0.15
A: Source: Institute of Transportation Engineers, Trip Generation, 9th Edition, 2012, except where otherwise noted. B: See Section 3.4. C: Multi-Family uses SANDAG 2002 Multi Family Trip Rates of 6 trips per unit. D: These rates were determined from vehicle trip counts conducted at 42 affordable housing sites in the City of Los Angeles. E: Uses the daily ITE 932 rate of 127.15 trips per thousand square feet for Suburban and Suburban Center TBZs. Urban and Compact Infill TBZs are reduced by one standard deviation (41.77 daily trips). F: General Office uses the ITE 710 Log Equation when office space is of sufficient size (above 206 KSF). When the office space is at or below this size, and the log equation exceeds 11.03 trips per KSF, General Office uses the ITE average rate of 11.03 trips per KSF.
3.2 MXD Reductions
3.2.1 MXD Methodology
The ITE trip generation methodology is primarily based on data collected at suburban, single-use,
freestanding sites. These defining characteristics limit ITE’s applicability to mixed-use or multiuse
development projects, and may not accurately estimate the project vehicle trip generation. In
response to the limitations in the ITE methodology, and to provide a straightforward and
empirically validated method of estimating vehicle trip generation at mixed-use developments,
the U.S. Environmental Protection Agency (EPA) sponsored a national study of the trip generation
characteristics of multi-use sites. Travel survey data was gathered from 239 mixed-use

City of Los Angeles VMT Calculator Documentation
February 2019
City of Los Angeles 10
developments (MXDs) in six major metropolitan regions and correlated with the characteristics
of the sites and their surroundings. The findings indicate that the amount of external traffic
generated is affected by a wide variety of factors, each pertaining to one or more of the following
characteristics:
• The relative numbers of residents and jobs – the better the site jobs/housing balance,
the greater the proportion of commute trips that remain internal.
• The density of development – the greater the concentration of dwellings and commercial
space per acre, the greater the likelihood that the interacting land uses will be close
enough together to encourage walking or short-distance internal driving.
• The connectivity for walking or driving among different activities – measured in terms
of the ratio of intersections to total land area within one mile directly influences trip
internalization and the number of trips made by walking instead of driving. Walking or
biking to destinations in areas with a higher intersection density is easier because the
street grid is more connected, making short trips easier than in areas with lower
intersection density where a more circuitous route may be needed to reach a destination.
• The availability of transit – the greater the number of jobs within a reasonable travel time
via transit, the greater the share of travel likely to occur by transit, and the lower the
vehicular traffic generation. An example of this is someone who lives close to the Metro
Red Line and has access to many jobs via transit versus someone living in an area less well
served by transit who has limited access to jobs via transit and will be more likely to drive.
• The number of convenient trip destinations within the immediate area – the number of
retail and other jobs in neighborhoods immediately surrounding the multi-use site
increases the amount of walking to/from the site and reduces traffic generation.
• Vehicle ownership – a higher number of cars available per household increases the
likelihood that trips will use a vehicle instead of other modes.
• Household Size – the number of people per household increases the amount of overall
trips to a site.
These characteristics were related statistically to the trip behavior observed at the study
development sites using hierarchical linear modeling (HLM) techniques. This quantified
relationships between characteristics of the MXDs and the likelihood that trips generated by
those MXDs will stay internal and/or use modes of transportation other than the private vehicle.
These statistical relationships produced equations, known as the EPA MXD model, that allows

City of Los Angeles VMT Calculator Documentation
February 2019
City of Los Angeles 11
predicting external vehicle trip reduction as a function of the MXD characteristics. Applying the
external vehicle trip reduction percentage to “raw trips”, as predicted by ITE, produces an
estimate for the number of vehicle trips traveling in or out of the site.
The MXD model has been approved for use by the EPA3. It has also been peer-reviewed in the
American Society of Civil Engineers (ASCE) Journal of Urban Planning and Development4, peer-
reviewed in a 2012 Transportation Research Board (TRB) paper evaluating various smart growth
trip generation methodologies5, recommended by SANDAG for use on mixed-use smart growth
developments6, and has been used successfully in multiple certified environmental impact
reports (EIRs) in California.
3.2.2 LA VMT Calculator MXD Refinements
The version of MXD used in the VMT Calculator was further refined to conditions local to Los
Angeles to reflect survey information collected from 51 market rate sites and 42 affordable
housing sites. The market rate sites include 24 residential, 10 office, and 17 mixed use sites. The
key refinements that were made to the MXD model were adjusting which base trip generation
rates, defined in Table 1, best match Los Angeles conditions. The MXD model was also refined to
use surrounding demographic data from the Los Angeles travel demand model, allowing the MXD
model to be more sensitive to neighborhood characteristics. The transit sensitivity for Home-
Based-Work and Non-Home-Based trips was also adjusted to more closely match trip making
characteristics in Los Angeles.
3.2.3 Travel Demand Model Information
The VMT Calculator relies on information from the 2016 City of Los Angeles TDF Model to better
calculate trip reductions using MXD. MXD applies vehicle trip reductions based on access to
3 Trip Generation Tool for Mixed-Use Developments (2012). https://www.epa.gov/smartgrowth/smart-growth-
tools#Transportation 4 ”Traffic Generated by Mixed-Use Developments—Six-Region Study Using Consistent Built Environmental
Measures.” Journal of Urban Planning and Development, 137(3), 248–261. 5 Shafizadeh, Kevan et al. “Evaluation of the Operation and Accuracy of Available Smart Growth Trip Generation
Methodologies for Use in California”. Presented at 91st Annual Meeting of the Transportation Research Board, Washington, D.C., 2012
6 SANDAG Smart Growth Trip Generation and Parking Study. http://www.sandag.org/index.asp?projectid=378&fuseaction=projects.detail

City of Los Angeles VMT Calculator Documentation
February 2019
City of Los Angeles 12
nearby destinations explained in Section 3.2.1. Below are key MXD inputs that are provided by
the TDF Model by traffic analysis zone (TAZ).
1. Intersections per square mile
2. Population within one mile
3. Employment within one mile
4. Employment within 30 minutes by transit (door-to-door)
5. Vehicles per household
6. Travel demand
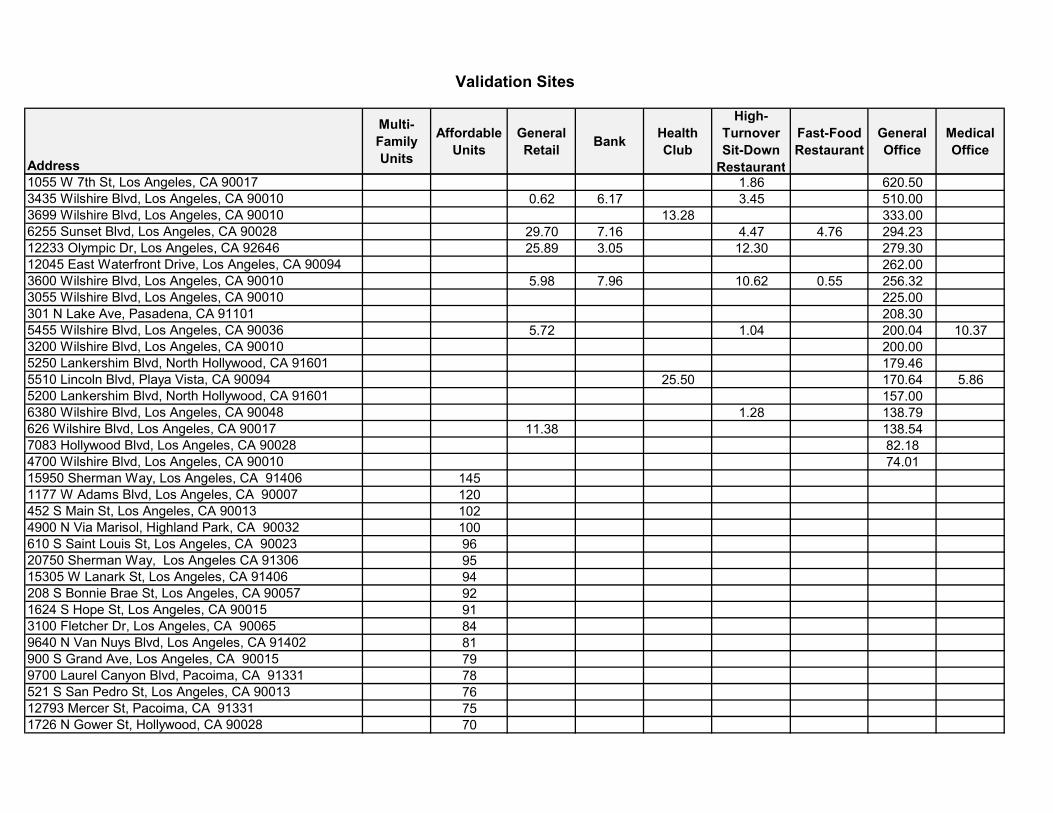
3.2.4 Validation
The LA VMT Calculator was validated against data collected from 93 sites within Los Angeles for
daily vehicle trip generation. These sites varied from large to small multi-family developments,
office developments, mixed-use developments, and affordable housing developments. These
sites were located in a variety of community types within Los Angeles. The specific project
addresses and land use mixes that the model was validated against are found in Appendix C. Trip
generation validation relied on driveway counts at each of these validation sites. Table 2 shows
the validation statistics of the LA VMT Calculator using the MXD methodology. These results are
compared with the ITE trip generation rates for market rate sites. Affordable housing was not
included as part of the ITE trip generation analysis. As the results show, the MXD methodology
improves the trip generation estimates for the validation sites. A visualization of how the
modeled trip generation compares to the driveway counts is shown in Appendix D.
Table 2: Daily Trip Generation Validation Statistics
Validation Sites Average Model Error
Root-Mean Square Error (RMSE)
Correlation Coefficient
ITE MXD ITE MXD ITE MXD
Market Rate Residential, Office, and Mixed-Use
Sites 68% 7% 95% 66% 0.96 0.96
Affordable Housing Sites NA 0% NA 42% NA 0.80

City of Los Angeles VMT Calculator Documentation
February 2019
City of Los Angeles 13
3.3 Vehicle Miles Traveled
The VMT Calculator uses trip length information from the TDF Model to calculate vehicle miles
traveled. Trip length is obtained from the model by trip purpose for both trip productions and
attractions for the TAZ in which a project is located. These trip length values are multiplied by the
vehicle trip generation to determine total VMT, household VMT, and work VMT for a project.
3.4 Site Specific Population and Employment Assumptions
The City of Los Angeles VMT thresholds were developed based on household VMT per capita and
work VMT per employee. Therefore, population and employment estimates are required to
convert vehicle trips and VMT to a per capita/employee value. Table 1 summarizes the
population and employment factors utilized in the VMT Calculator to estimate a project’s
population and employment by land use type.
The population factors for single family households and multi-family households were derived
from Census data for the City of Los Angeles7. The population factors for affordable housing uses
were derived from data regarding the affordable housing sites observed within the City of Los
Angeles as part of developing empirical trip generation rates and data from the City. The
employment factors were derived from a variety of resources. These include Los Angeles Unified
School District floor area per employee data8, 2012 SANDAG Activity Based Model floor area per
employee data, ITE trip generation rates per thousand square feet divided by the trip generation
rates per employee, the US Department of Energy, and other modeling resources. A variety of
sources were used because the land use categories in the VMT Calculator are generalized.
Therefore, the employment rate for a specific land use in the Calculator may refer to an
approximation of multiple similar land uses.
7 United States Census Bureau, ACS 2015, 5-year estimates. 8 Los Angeles Unified School District, 2012 Developer Fee Justification Study, February 2012.

City of Los Angeles VMT Calculator Documentation
February 2019
City of Los Angeles 14
Chapter 4. Transportation Demand Management Strategies
The TDM section of the VMT Calculator allows application of TDM strategies both as project
design features and as mitigation measures to reduce project VMT. These strategies are applied
to the base trip generation and VMT calculations to reduce the total trips and VMT created by
the project. The TDM strategies are applied separately for the proposed project and the project
with mitigation measures. While many TDM strategies were explored, strategies were only
included in the tool if they had empirical evidence documenting their potential to reduce vehicle
travel. The TDM section has seven categories from which users can select strategies:
1. Parking
2. Transit
3. Education & encouragement
4. Commute trip reductions
5. Shared mobility
6. Bicycle infrastructure
7. Neighborhood enhancement
The aforementioned TDM strategies are applied differently based on the TBZ in which a project
is located, using the TBZs illustrated in Appendix A. More information regarding the TDM
strategies available for selection in the VMT Calculator, including description and applicability of
each strategy, methodology for estimating effectiveness of each strategy, and research sources
supporting the effectiveness calculations, is provided in Appendix B of the City of Los Angeles
Transportation Assessment Guidelines.
City of Los Angeles VMT Calculator Documentation
February 2019
City of Los Angeles 15
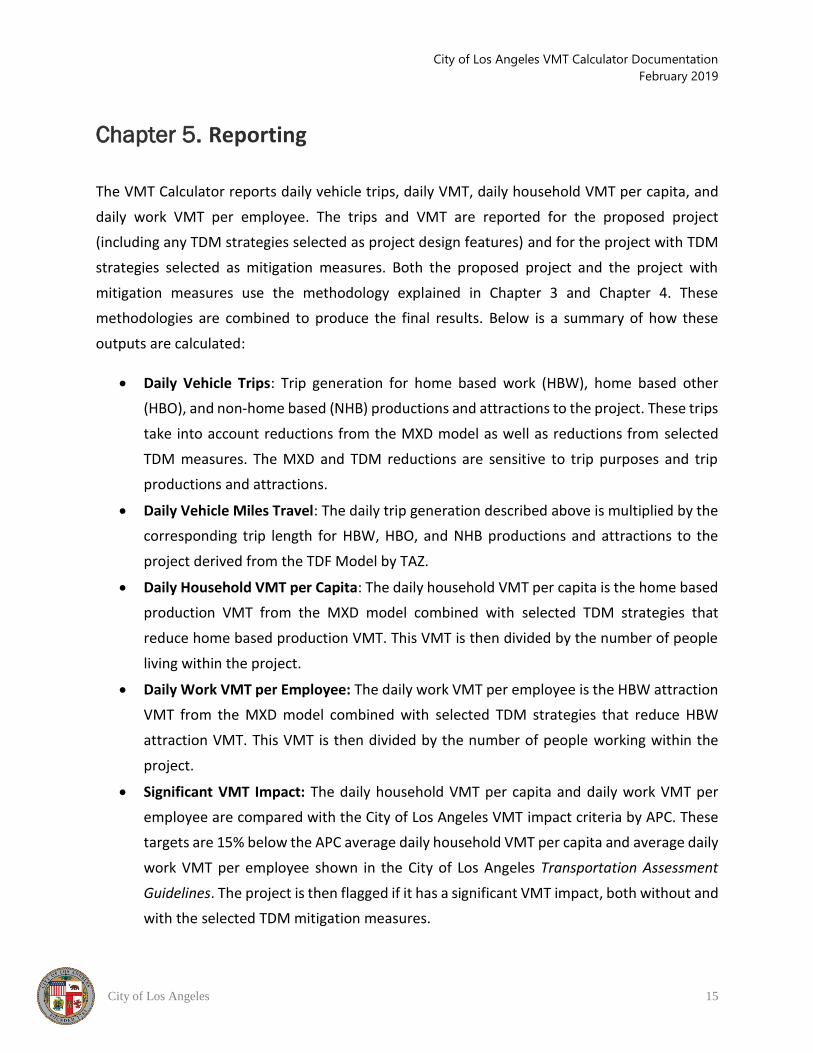
Chapter 5. Reporting
The VMT Calculator reports daily vehicle trips, daily VMT, daily household VMT per capita, and
daily work VMT per employee. The trips and VMT are reported for the proposed project
(including any TDM strategies selected as project design features) and for the project with TDM
strategies selected as mitigation measures. Both the proposed project and the project with
mitigation measures use the methodology explained in Chapter 3 and Chapter 4. These
methodologies are combined to produce the final results. Below is a summary of how these
outputs are calculated:
• Daily Vehicle Trips: Trip generation for home based work (HBW), home based other
(HBO), and non-home based (NHB) productions and attractions to the project. These trips
take into account reductions from the MXD model as well as reductions from selected
TDM measures. The MXD and TDM reductions are sensitive to trip purposes and trip
productions and attractions.
• Daily Vehicle Miles Travel: The daily trip generation described above is multiplied by the
corresponding trip length for HBW, HBO, and NHB productions and attractions to the
project derived from the TDF Model by TAZ.
• Daily Household VMT per Capita: The daily household VMT per capita is the home based
production VMT from the MXD model combined with selected TDM strategies that
reduce home based production VMT. This VMT is then divided by the number of people
living within the project.
• Daily Work VMT per Employee: The daily work VMT per employee is the HBW attraction
VMT from the MXD model combined with selected TDM strategies that reduce HBW
attraction VMT. This VMT is then divided by the number of people working within the
project.
• Significant VMT Impact: The daily household VMT per capita and daily work VMT per
employee are compared with the City of Los Angeles VMT impact criteria by APC. These
targets are 15% below the APC average daily household VMT per capita and average daily
work VMT per employee shown in the City of Los Angeles Transportation Assessment
Guidelines. The project is then flagged if it has a significant VMT impact, both without and
with the selected TDM mitigation measures.
City of Los Angeles VMT Calculator Documentation
February 2019
City of Los Angeles 16
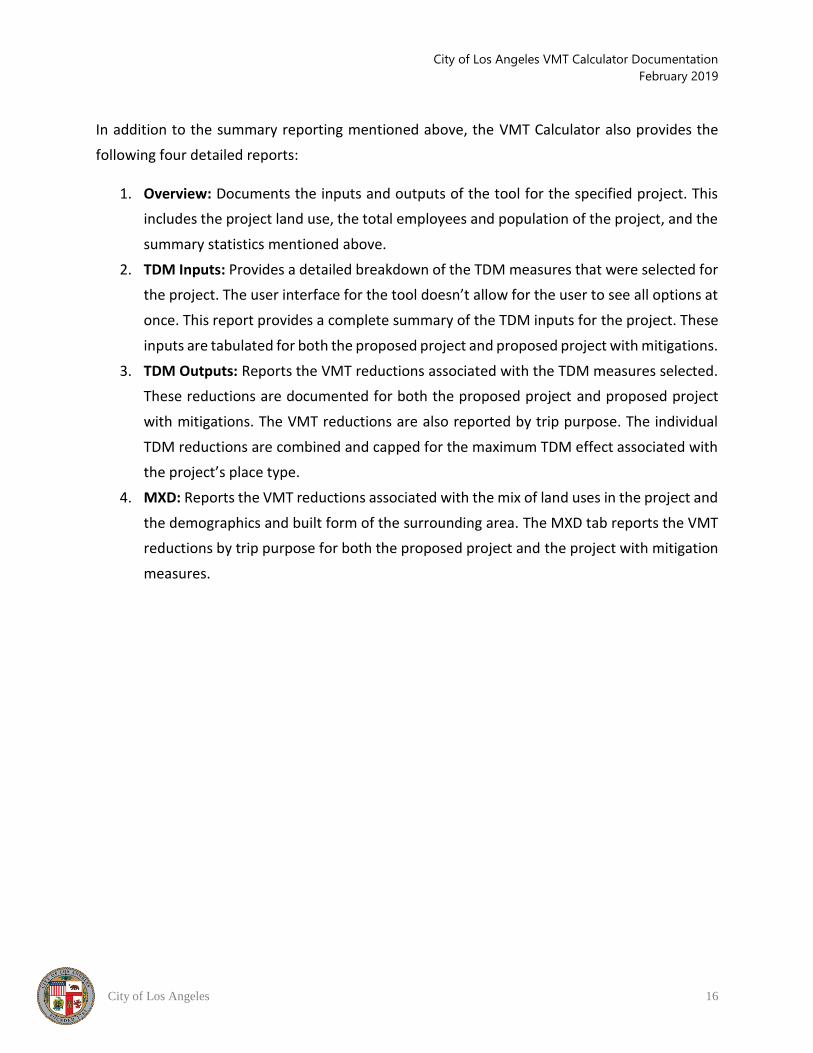
In addition to the summary reporting mentioned above, the VMT Calculator also provides the
following four detailed reports:
1. Overview: Documents the inputs and outputs of the tool for the specified project. This
includes the project land use, the total employees and population of the project, and the
summary statistics mentioned above.
2. TDM Inputs: Provides a detailed breakdown of the TDM measures that were selected for
the project. The user interface for the tool doesn’t allow for the user to see all options at
once. This report provides a complete summary of the TDM inputs for the project. These
inputs are tabulated for both the proposed project and proposed project with mitigations.
3. TDM Outputs: Reports the VMT reductions associated with the TDM measures selected.
These reductions are documented for both the proposed project and proposed project
with mitigations. The VMT reductions are also reported by trip purpose. The individual
TDM reductions are combined and capped for the maximum TDM effect associated with
the project’s place type.
4. MXD: Reports the VMT reductions associated with the mix of land uses in the project and
the demographics and built form of the surrounding area. The MXD tab reports the VMT
reductions by trip purpose for both the proposed project and the project with mitigation
measures.

APPENDIX A
TRAVEL BEHAVIOR ZONES
City of Los Angeles Department of Transportation | 100 S. Main Street, 9th Floor, Los Angeles, CA 90012 | ladot.lacity.org Karina Macias, Transportation Planning Associate II, Transportation Planning & Policy Division | [email protected]
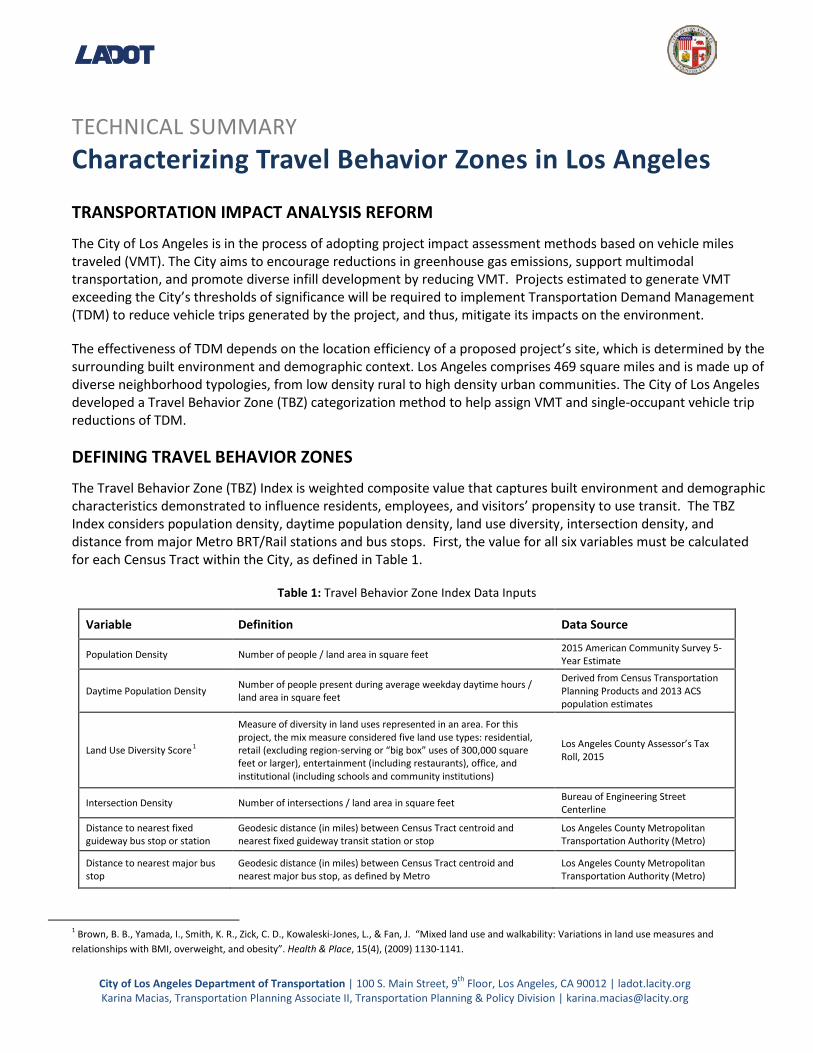
TECHNICAL SUMMARY Characterizing Travel Behavior Zones in Los Angeles
TRANSPORTATION IMPACT ANALYSIS REFORM
The City of Los Angeles is in the process of adopting project impact assessment methods based on vehicle miles traveled (VMT). The City aims to encourage reductions in greenhouse gas emissions, support multimodal transportation, and promote diverse infill development by reducing VMT. Projects estimated to generate VMT exceeding the City’s thresholds of significance will be required to implement Transportation Demand Management (TDM) to reduce vehicle trips generated by the project, and thus, mitigate its impacts on the environment.
The effectiveness of TDM depends on the location efficiency of a proposed project’s site, which is determined by the surrounding built environment and demographic context. Los Angeles comprises 469 square miles and is made up of diverse neighborhood typologies, from low density rural to high density urban communities. The City of Los Angeles developed a Travel Behavior Zone (TBZ) categorization method to help assign VMT and single-occupant vehicle trip reductions of TDM.
DEFINING TRAVEL BEHAVIOR ZONES
The Travel Behavior Zone (TBZ) Index is weighted composite value that captures built environment and demographic characteristics demonstrated to influence residents, employees, and visitors’ propensity to use transit. The TBZ Index considers population density, daytime population density, land use diversity, intersection density, and distance from major Metro BRT/Rail stations and bus stops. First, the value for all six variables must be calculated for each Census Tract within the City, as defined in Table 1.
Table 1: Travel Behavior Zone Index Data Inputs
Variable Definition Data Source
Population Density Number of people / land area in square feet 2015 American Community Survey 5-Year Estimate
Daytime Population Density Number of people present during average weekday daytime hours / land area in square feet
Derived from Census Transportation Planning Products and 2013 ACS population estimates
Land Use Diversity Score1
Measure of diversity in land uses represented in an area. For this project, the mix measure considered five land use types: residential, retail (excluding region-serving or “big box” uses of 300,000 square feet or larger), entertainment (including restaurants), office, and institutional (including schools and community institutions)
Los Angeles County Assessor’s Tax Roll, 2015
Intersection Density Number of intersections / land area in square feet Bureau of Engineering Street Centerline
Distance to nearest fixed guideway bus stop or station
Geodesic distance (in miles) between Census Tract centroid and nearest fixed guideway transit station or stop
Los Angeles County Metropolitan Transportation Authority (Metro)
Distance to nearest major bus stop
Geodesic distance (in miles) between Census Tract centroid and nearest major bus stop, as defined by Metro
Los Angeles County Metropolitan Transportation Authority (Metro)
1 Brown, B. B., Yamada, I., Smith, K. R., Zick, C. D., Kowaleski-Jones, L., & Fan, J. “Mixed land use and walkability: Variations in land use measures and relationships with BMI, overweight, and obesity”. Health & Place, 15(4), (2009) 1130-1141.

Page 2 of 4
Next, the standard score, or z-score, is calculated for every Census Tract using the mean and standard deviation of each variable, to normalize the distribution of each variable’s value based on the average value for each characteristic in the City. Table 2 features the mean and standard deviation values for each of the six variables included in the TBZ Index calculation.
Table 2: Travel Behavior Zone Index Variables Mean and S.D.
Variable Mean Standard Population Density μ = 0.000622 σ = 0.000547
Daytime Population Density μ = 0.000538 σ = 0.000496
Land Use Diversity Score μ = 0.490099 σ = 0.224065
Intersection Density μ = 0.000005 σ = 0.000002
Distance to nearest fixed guideway bus stop or station μ = 0.754328 σ = 0.792255
Distance to nearest major bus stop μ = 1.944587 σ = 1.99588
Using the z-score value of each variable, the TBX Index Value is calculated for every Census Tract using the following equation:
Travel Behavior Zone Index Value = (0.25 * z-population density) + (0.25 * z-daytime population density) + (0.24 * z-land use diversity score) + (0.23 * z-intersection density) + (-0.29 * z-distance to nearest major BRT/Rail station) + (-0.1 * z-distance to nearest major bus stop)
The equation assigns varying weight values to each z-score variable relative to its influence residents, employees, and visitors’ propensity to use transit2 and qualitative descriptions of place types VMT mitigation measures may be applied3.
RESULTS
The average Travel Behavior Zone (TBZ) Index value is 0.045 and the standard deviation is 0.827. Figure 1 visualizes the almost normal distribution of TBZ Index values in the City and identifies the value of the breakpoints used to designate each TBZ type. Designations range from Zone 1, equivalent to a neighborhood context with low population densities, homogenous land uses, low intersection density, and removed from frequent and regular transit service, to Zone 4, which describes an urban built environment with high population and employment densities, high street network connectivity, and access to transit. Areas where large employers owned and/or occupied the majority of the land area with no residential population were manually assigned a Zone 4 designation because centralized transportation demand management is anticipated to have the greatest effectiveness on commuter trips at these campus-style contexts. Figure 2 is a map of TBZ designations within the City of Los Angeles.
2 Ewing, Reid, and Robert Cervero. "Travel and the built environment: a meta-analysis." Journal of the American planning association 76, no. 3 (2010): 265-294. 3 California Air Pollution Control Officers Association. "Quantifying Greenhouse Gas Mitigation Measures-A Resource for Local Government to Assess Emission Reductions from Greenhouse Gas Mitigation Measures." Sacramento: CAPCOA (2010): A-4, A-7 & A-8.

Page 3 of 4
Figure 1: Distribution and Range of TBZ Designations

Page 4 of 4
Figure 2: Map of City of Los Angeles Travel Behavior Zones

APPENDIX B
AFFORDABLE HOUSING TRIP GENERATION STUDY

600 Wilshire Boulevard, Suite 1050, Los Angeles, CA 90017 (213) 261-3050
www.fehrandpeers.com
MEMORANDUM
Date: April 20, 2017
To: Claire Bowin & David Somers, Los Angeles Department of City Planning
Cc: Tom Carranza, Los Angeles Department of Transportation
From: Tom Gaul & Cary Bearn, Fehr & Peers
Subject: Infill and Complete Streets Study
Task 2.1A Local Affordable Housing Trip Generation Study
Ref: LA15-2755
This memo serves as a summary of Task 2.1A, Local Affordable Housing Trip Generation Study, as
part of the City of Los Angeles’ Infill and Complete Streets: Capturing VMT Impacts & Benefits
Pursuant to CEQA study. As part of Task 2.1A, vehicle trip generation and parking utilization surveys
were conducted at numerous affordable housing locations throughout the City of Los Angeles in
order to provide an improved understanding of vehicle trip generation and parking demand
characteristics of affordable housing uses in Los Angeles.
The empirical trip generation data collected through this effort will be used to customize and
calibrate the MXD model for Los Angeles to be integrated into the vehicle miles traveled (VMT)
VMT Calculator to be developed for the City as part of later tasks in the study.
METHODOLOGY
Twenty-four hour driveway vehicle counts were conducted at the various survey sites using video
cameras. Manual overnight parking utilization sweeps were also conducted.
Criteria for selection of the survey sites included:
Sample Size – The Institute of Transportation Engineers (ITE) recommends that at least
three and preferably five independent survey sites be used to establish a local trip
generation rate for a particular land use. This recommendation was exceeded for all land
use types included in this study, including for each of the subcategories of affordable
housing sites.
100% Affordable – The affordable housing site must be 100% affordable (other than the
manager’s unit). This was to ensure that the counts reflect the trip generation behavior
solely of affordable units.
Isolatable Use – The sites must be standalone and not part of a mixed-use development.

Claire Bowin & David Somers
April 20, 2017
Page 2
Countable Driveway(s) – Driveways must be serving parking lots for the use of the site and
not also serving parking lots for other land uses in the surrounding area.
Successful Development – The development should be mature, be located in a mature
environment, and appear to be economically healthy.
Permission of Property Owners/Managers – Permission was obtained in order to survey a
site.
AFFORDABLE HOUSING TRIP GENERATION AND PARKING
Data Collection
Twenty-four hour driveway counts and overnight parking sweeps were conducted at a total of 42
affordable housing sites within the City of Los Angeles (35 sites counted in May-June 2016 and
seven additional sites counted in November 2016). The affordable housing study locations were
identified in consultation with the City of Los Angeles Department of City Planning and the City of
Los Angeles Housing+Community Investment Department. The sites were categorized according
to two criteria considered to influence the level of vehicle ownership and tripmaking but also
considered to be available and applicable to future projects (i.e., measureable and able to be
determined using a readily available data source): proximity to transit and affordable housing type:
Proximity to Transit – The Southern California Association of Governments (SCAG) has
defined “Transit Priority Areas” (TPAs) as the area within ½ mile of an existing major transit
stop, and defines a major transit stop as either a rail station or an intersection of 2 or more
major bus routes with peak service frequencies of 15 minutes or less. The transit priority
area defined by SCAG applies a ½ mile radial from the station or intersection. For this study,
a ½ mile walkshed along the transportation network was used in lieu of the ½ mile radius.
Additionally, stations for the Metro Orange Line and Silver Line Busways were not included
in the SCAG definition but were added as part of the rail stations. These busways provide
peak hour service less than 15 minutes and operate in dedicated rights-of-way. Study
locations were defined as either inside or outside a transit priority area. Twenty of the study
locations were within a TPA and 22 were outside of a TPA.
Housing Type – Affordable housing type was categorized as serving families, seniors,
special needs, or permanent supportive. Family affordable housing offers affordable
dwelling units designed for households with children. Senior affordable housing provides
affordable dwelling units designed for mature residents. The category of special needs
housing includes facilities serving a variety of populations, including foster youth, disabled,
mentally ill, and HIV/AIDs. Permanent supportive housing provides long-term housing with
supportive services designed to enable homeless persons and individuals/families at risk of
homelessness to ensure that they remain housed and live as independently as possible.
Fourteen of the study sites were designated as family housing, thirteen were senior, eight
were special needs, and seven were permanent supportive. Each of these categories were
divided roughly equally between sites within a TPA and sites outside of a TPA.

Claire Bowin & David Somers
April 20, 2017
Page 3
Retail job density was also considered as a possible variable influencing tripmaking but, based on
exploratory data analysis and discussions with LADOT, the final trip generation analysis was
disaggregated based on proximity to transit and housing type only.
Table 1 presents the list of properties included in the analysis. Table 2 shows the aggregated vehicle
trip generation results based on proximity to transit and housing type. Table 2 also shows relevant
trip generation rates from ITE’s Trip Generation, 9th Edition, for comparison. Table 3 shows the
aggregated parking demand and utilization results based on proximity to transit and housing type.
For comparison, Table 3 also shows relevant parking requirements from the Los Angeles Municipal
Code (LAMC).
Property managers for 36 of the 42 surveyed sites provided information regarding selected
characteristics of the sites. All of the respondents stated that they provide parking but do not charge
residents for parking on-site. None of the respondents provide partially or fully-subsidized transit
passes to residents, none provide car-share services, and one provides a shuttle to grocery stores.
Results
Reviewing Table 2, the following observations can be made:
The empirical vehicle trip generation rates across the affordable housing survey sites are
higher for the affordable family units relative to the senior, special needs, and permanent
supportive affordable units.
The empirical trip generation rates are generally lower for units located within a TPA than
for units located outside of a TPA.
The empirical trip generation rates averaged across all 42 of the affordable housing survey
sites are lower than the ITE trip rates for standard apartments for all three time periods
(daily, AM peak hour, and PM peak hour). This holds true as well for almost all of the
disaggregated subcategories (the sole exception being affordable family units outside of a
TPA during the AM peak hour).
Affordable family units both inside and outside of a TPA are the only categories with
empirical rates higher than the ITE high-rise apartment rates (an ITE category which
primarily consists of buildings within urban areas).
The empirical rates for senior, special needs, and permanent supportive affordable housing
are far lower than both the ITE apartment and ITE high-rise apartment rates.
The empirical rates for the senior affordable housing are lower than ITE rates for senior
adult housing.
Reviewing Table 3, the following observations can be made:
The empirical parking demand ratios are higher for the affordable family units relative to
the senior, special needs, and permanent supportive units.

Claire Bowin & David Somers
April 20, 2017
Page 4
The empirical parking demand ratios for each of the subcategorizations of the affordable
housing survey sites (by affordable housing type and by transit proximity) are lower than
the LAMC parking requirement for apartments.
The empirical parking demand ratios for family affordable housing range from 0.82 to 0.85
spaces per unit and are lower than the parking requirements under the LAMC Affordable
Housing Density Bonus Option 2 (LAMC 12.22A.25(d)(2)) for restricted affordable units (1
space per unit).
The empirical parking demand ratios for senior, special needs, and permanent supportive
affordable housing range from 0.20 to 0.48 spaces per unit and are lower than the parking
requirements under the LAMC Affordable Housing Density Bonus Option 2 (LAMC
12.22A.25(d)(2)) for units restricted to low or very low income senior citizen or disabled (0.5
spaces per unit).
The empirical parking demand ratios are lower for units located within a TPA than for units
located outside of a TPA for the senior, special need, and permanent supportive units but
not for the family units.
SOURCES
Trip Generation, 9th Edition, Institute of Transportation Engineers, 2012.
Trip Generation Handbook, 3rd Edition, Institute of Transportation Engineers, 2014.
Los Angeles Municipal Code.

TABLE 1Affordable Housing Trip Generation and Parking Utilization Survey Locations
Count Name Address Transit Priority Area Housing Type1 Barnsdall Court 1632 N Normandie Ave, Hollywood, CA 90027 Inside Family2 Parkside Apartments 900 S Grand Ave, Los Angeles, CA 90015 Inside Family3 El Dorado Family Apts 12129 N El Dorado Ave, Los Angeles, CA 91342 Inside Family4 Union Point 420 Union Dr, Los Angeles, CA 90017 Inside Family5 Coronita Family 204 S Lucas Ave, Los Angeles, CA 90026 Inside Family6 New Venice 1A 535 Santa Clara Ave, Venice, CA 90291 Inside Family7 New Venice 2C 1002 5th Ave, Venice, CA 90291 Inside Family8 Sichel Family Apts 1805 Sichel St, Los Angeles, CA 90031 Inside Family9 Bonnie Brae Village 208 S Bonnie Brae St, Los Angeles, CA 90057 Inside Permanent Supportive
10 Gower Street Apts 1140 N Gower St, Los Angeles, CA 90038 Inside Permanent Supportive11 The Villas At Gower 1726 N Gower St, Hollywood, CA 90028 Inside Permanent Supportive12 NoHo Seniors Villa 5525 Klump Ave, North Hollywood, CA 91601 Inside Seniors13 Morgan Place Senior Apts 7301 S Crenshaw Blvd, Los Angeles, CA 90043 Inside Seniors14 Figueroa Senior Housing 7621 S Figueroa St, Los Angeles, CA 90044 Inside Seniors15 Hollenbeck Terrace 610 S Saint Louis St, Los Angeles, CA 90023 Inside Seniors16 Ward Villas 1177 W Adams Blvd, Los Angeles, CA 90007 Inside Seniors17 Vermont Manzanita 1225 S Vermont Ave, Los Angeles, CA 90006 Inside Special Needs18 New Carver 1624 S Hope St, Los Angeles, CA 90015 Inside Special Needs19 Charles Cobb Apts 521 S San Pedro St, Los Angeles, CA 90013 Inside Special Needs20 New Genesis 452 S Main St, Los Angeles, CA 90013 Inside Special Needs21 Rio Vista Apts 3000 N Verdugo Rd, Los Angeles, CA 90065 Outside Family22 New Venice 4B 915 7th Ave, Venice, CA 90291 Outside Family23 Cuatro Vientos 5331 E Huntington Dr, Los Angeles, CA 90032 Outside Family24 Lorena Terrace 611 South Lorena St, Los Angeles, CA 90023 Outside Family25 Laurel Village 9700 Laurel Canyon Blvd, Pacoima, CA 91331 Outside Family26 New Venice 2D 919 5th Ave, Venice, CA 90291 Outside Family27 Cornerstone Apts 14128 Calvert St, Van Nuys, CA 91401 Outside Permanent Supportive28 Willis Avenue Apts 14731 W Rayen St, Los Angeles, CA 91402 Outside Permanent Supportive29 PATH Villas At Del Rey 11734 Courtleigh Dr, CA 90066 Outside Permanent Supportive30 Winnetka Senior Apts 20750 Sherman Way, Los Angeles CA 91306 Outside Permanent Supportive31 TELACU Pointe 3100 Fletcher Dr, Los Angeles, CA 90065 Outside Seniors32 Asturias Senior Apts 9628 Van Nuys Blvd, Panorama City, CA 91402 Outside Seniors33 Cantabria Senior Apts 9640 N Van Nuys Blvd, Los Angeles, CA 91402 Outside Seniors34 TELACU Vista 4900 N Via Marisol, Highland Park, CA 90032 Outside Seniors35 Andalucia Senior Apts 15305 W Lanark St, Los Angeles, CA 91406 Outside Seniors36 TELACU Las Flores 12793 Mercer St, Pacoima, CA 91331 Outside Seniors37 Buckingham Sr. Housing 4020 S Buckingham Rd, Los Angeles, CA 90008 Outside Seniors38 Villa Valley 15950 Sherman Way, Los Angeles, CA 91406 Outside Seniors39 Allesandro Street Apts 1934 Allesandro St, Los Angeles, CA 90039 Outside Special Needs40 Innes Heights, Lp 1245 Innes Ave, Los Angeles, CA 90026 Outside Special Needs41 Woodland Terrace 15532 W Nordhoff St, North Hills, CA 91343 Outside Special Needs42 Guy Gabaldon Apts 3553 Beswick St, Los Angeles, CA 90023 Outside Special Needs

TABLE 2Vehicle Trip Rates for Affordable Housing Sites in Los Angeles
(By Transit Priority Area and Affordable Housing Type)Counts conducted May, June, and November 2016
TPA Area Affordable Housing Type Bin Sample SizeDaily Rate
(Trips per DU)
Average AM Peak Hour Rate
(Trips per DU)
AM Percent In
AM Percent Out
Average PM Peak Hour Rate
(Trips per DU)
PM Percent In
PM Percent Out
Inside - 20 2.32 0.26 40% 60% 0.20 56% 44%Outside - 22 2.48 0.25 46% 54% 0.24 52% 48%
- Family 14 4.16 0.52 38% 62% 0.38 55% 45%- Seniors 13 1.72 0.12 38% 62% 0.15 52% 48%- Special Needs 8 1.49 0.17 43% 57% 0.11 54% 46%- Permanent Supportive 7 1.23 0.08 67% 33% 0.13 53% 47%
Inside Family Inside, Family 8 4.16 0.49 37% 63% 0.35 56% 44%Inside Seniors Inside, Seniors 5 1.31 0.13 38% 62% 0.13 47% 53%Inside Special Needs Inside, Special Needs 4 1.00 0.10 30% 70% 0.05 67% 33%Inside Permanent Supportive Inside, Permanent Supportive 3 0.87 0.08 62% 38% 0.09 59% 41%
Outside Family Outside, Family 6 4.15 0.55 40% 60% 0.43 55% 45%Outside Seniors Outside, Seniors 8 1.97 0.11 38% 62% 0.17 55% 45%Outside Special Needs Outside, Special Needs 4 1.98 0.24 54% 46% 0.16 44% 56%Outside Permanent Supportive Outside, Permanent Supportive 4 1.50 0.09 71% 29% 0.16 49% 51%
ITE for Comparison
ITE Record Number Description Sample SizeDaily Rate
(Trips per DU)
Average AM Peak Hour Rate
(Trips per DU)
AM Percent In
AM Percent Out
Average PM Peak Hour Rate
(Trips per DU)
PM Percent In
PM Percent Out
ITE 220 Apartment 78-90 6.65 0.51 20% 80% 0.62 65% 35%ITE 222 High-Rise Apartment 9-17 4.20 0.30 25% 75% 0.35 61% 39%ITE 252 Senior Adult Housing-Attached 5-10 3.44 0.20 34% 66% 0.25 54% 46%ITE 253 Congregate Care Facility 2-3 2.02 0.06 59% 41% 0.17 55% 45%ITE 255 Continuing Care Retirement Community 4-6 2.40 0.14 65% 35% 0.16 39% 61%

TABLE 3
Parking Demand Rates for Affordable Housing Sites in Los Angeles(By Transit Priority Area and Affordable Housing Type)
Surveys conducted May, June, and November 2016
TPA Area Affordable Housing Type Sample SizeParking Demand Per
Dwelling UnitParking Utilization
Inside - 20 0.53 64%Outside - 22 0.56 63%
- Family 14 0.84 72%- Seniors 13 0.46 71%- Special Needs 8 0.32 43%- Permanent Supportive 7 0.37 56%
Inside Family 8 0.85 74%Inside Seniors 5 0.44 73%Inside Special Needs 4 0.20 34%Inside Permanent Supportive 3 0.29 64%
Outside Family 6 0.82 70%Outside Seniors 8 0.48 69%Outside Special Needs 4 0.44 52%Outside Permanent Supportive 4 0.43 50%
LAMC for ComparisonParking Requirement per
UnitApartments (LAMC 12.21A.4(a))
<3 habitable rooms 13 habitable rooms 1.5>3 habitable rooms 2
Projects with Affordable Housing Density Bonus - Option 1 (applies to all units, not just restricted units) (LAMC 12.22A.25(d)(1))0-1 bedroom 12-3 bedrooms 24 or more bedrooms 2.5
Projects with Affordable Housing Density Bonus - Option 2 (applies to restricted units only) (LAMC 12.22A.25(d)(2))restricted affordable units 1restricted to low or very low income senior citizen or disabled 0.5restricted affordable units in residential hotel 0.25

APPENDIX C
VALIDATION SITES

Address
Multi-Family Units
Affordable Units
General Retail
BankHealth Club
High-Turnover Sit-Down
Restaurant
Fast-Food Restaurant
General Office
Medical Office
725 S Bixel St, Los Angeles, CA 90017 6326220 W 3rd St, Los Angeles, CA 90036 61021200 Kittridge Street, Woodland Hills, CA 91303 5222160 Century Park East, Los Angeles, CA 90067 4963183 Wilshire Blvd, Los Angeles, CA 90005 449 26.28 4.06 1.86 4.835416 Fair Avenue, North Hollywood, CA 91601 438151 E Holly St, Pasadena, CA 91103 374612 S Flower St, Los Angeles, CA 90017 322639 N Broadway, Los Angeles, CA 90012 280 22.00375 E Green St, Pasadena, CA 91101 276265 S Arroyo Pkwy, Pasadena, CA 91105 235235 S San Pedro St, Los Angeles, CA 90012 23010501 Wilshire, Los Angeles, CA 90024 2081850 Whitley Ave, Los Angeles, CA 90028 206930 Figueroa Terrace, Los Angeles, CA 90012 1981234 Wilshire Blvd, Los Angeles, CA 90017 197 8.903360 E. Foothill Boulevard, Pasadena, CA 91107 1885440 Tujunga Ave, North Hollywood, CA 91601 1803460 W 7th St Los Angeles, CA 90005 168 4.373675 Wilshire Blvd, Los Angeles, CA 90010 159145 Chestnut Street, Pasadena, CA 91103 143290 N. Hudson Avenue, Pasadena, CA 91101 1402000 Main Street, Santa Monica, California 13310490 Wilshire, Los Angeles, CA 90024 1283075 Wilshire Blvd, Los Angeles, CA 90010 127 2.9125 South Oak Knoll Avenue, Pasadena, CA 120 1.80601 E 2nd St, Los Angeles, CA 90012 11810001 Venice Blvd, Los Angeles, CA 90034 11610727 Wilshire, Los Angeles, CA 90024 93901 Hancock Ave, West Hollywood, CA 90069 3912301 Wilshire Blvd, Los Angeles, CA 90025 105.9810351 Santa Monica Blvd, Los Angeles, CA 90025 101.503785 Wilshire Blvd, Los Angeles, CA 90010 186 40.00
Validation Sites
Address
Multi-Family Units
Affordable Units
General Retail
BankHealth Club
High-Turnover Sit-Down
Restaurant
Fast-Food Restaurant
General Office
Medical Office
Validation Sites
1055 W 7th St, Los Angeles, CA 90017 1.86 620.503435 Wilshire Blvd, Los Angeles, CA 90010 0.62 6.17 3.45 510.003699 Wilshire Blvd, Los Angeles, CA 90010 13.28 333.006255 Sunset Blvd, Los Angeles, CA 90028 29.70 7.16 4.47 4.76 294.2312233 Olympic Dr, Los Angeles, CA 92646 25.89 3.05 12.30 279.3012045 East Waterfront Drive, Los Angeles, CA 90094 262.003600 Wilshire Blvd, Los Angeles, CA 90010 5.98 7.96 10.62 0.55 256.323055 Wilshire Blvd, Los Angeles, CA 90010 225.00301 N Lake Ave, Pasadena, CA 91101 208.305455 Wilshire Blvd, Los Angeles, CA 90036 5.72 1.04 200.04 10.373200 Wilshire Blvd, Los Angeles, CA 90010 200.005250 Lankershim Blvd, North Hollywood, CA 91601 179.465510 Lincoln Blvd, Playa Vista, CA 90094 25.50 170.64 5.865200 Lankershim Blvd, North Hollywood, CA 91601 157.006380 Wilshire Blvd, Los Angeles, CA 90048 1.28 138.79626 Wilshire Blvd, Los Angeles, CA 90017 11.38 138.547083 Hollywood Blvd, Los Angeles, CA 90028 82.184700 Wilshire Blvd, Los Angeles, CA 90010 74.0115950 Sherman Way, Los Angeles, CA 91406 1451177 W Adams Blvd, Los Angeles, CA 90007 120452 S Main St, Los Angeles, CA 90013 1024900 N Via Marisol, Highland Park, CA 90032 100610 S Saint Louis St, Los Angeles, CA 90023 9620750 Sherman Way, Los Angeles CA 91306 9515305 W Lanark St, Los Angeles, CA 91406 94208 S Bonnie Brae St, Los Angeles, CA 90057 921624 S Hope St, Los Angeles, CA 90015 913100 Fletcher Dr, Los Angeles, CA 90065 849640 N Van Nuys Blvd, Los Angeles, CA 91402 81900 S Grand Ave, Los Angeles, CA 90015 799700 Laurel Canyon Blvd, Pacoima, CA 91331 78521 S San Pedro St, Los Angeles, CA 90013 7612793 Mercer St, Pacoima, CA 91331 751726 N Gower St, Hollywood, CA 90028 70

Address
Multi-Family Units
Affordable Units
General Retail
BankHealth Club
High-Turnover Sit-Down
Restaurant
Fast-Food Restaurant
General Office
Medical Office
Validation Sites
9628 Van Nuys Blvd, Panorama City, CA 91402 694020 S Buckingham Rd, Los Angeles, CA 90008 6812129 N El Dorado Ave, Los Angeles, CA 91342 607301 S Crenshaw Blvd, Los Angeles, CA 90043 541140 N Gower St, Los Angeles, CA 90038 523000 N Verdugo Rd, Los Angeles, CA 90065 50611 South Lorena St, Los Angeles, CA 90023 495525 Klump Ave, North Hollywood, CA 91601 4914731 W Rayen St, Los Angeles, CA 91402 421225 S Vermont Ave, Los Angeles, CA 90006 401632 N Normandie Ave, Hollywood, CA 90027 3814128 Calvert St, Van Nuys, CA 91401 361805 Sichel St, Los Angeles, CA 90031 367621 S Figueroa St, Los Angeles, CA 90044 353553 Beswick St, Los Angeles, CA 90023 3315532 W Nordhoff St, North Hills, CA 91343 311002 5Th Ave, Venice, CA 90291 26919 5Th Ave, Venice, CA 90291 265331 E Huntington Dr, Los Angeles, CA 90032 2511734 Courtleigh Dr, CA 90066 23535 Santa Clara Ave, Venice, CA 90291 22420 Union Dr, Los Angeles, CA 90017 21204 S Lucas Ave, Los Angeles, CA 90026 211245 Innes Ave, Los Angeles, CA 90026 191934 Allesandro St, Los Angeles, CA 90039 17915 7Th Ave, Venice, CA 90291 15

APPENDIX D
OBSERVED VERSUS MODELED TRIP GENERATION

-
1,000
2,000
3,000
4,000
5,000
6,000
7,000
0 1000 2000 3000 4000 5000 6000 7000
Mod
eled
Trip
Gen
erat
ion
Observed Trip Generation
Daily Observed vs Modeled Trip GenerationITE Daily Trips MXD Daily Trips

APPENDIX E
TRIP PURPOSE ASSUMPTIONS

Home
Based
Work
Home
Based
Other
Non‐
Home
Based
Home
Based
Work
Home
Based
Other
Non‐
Home
Based
Single Family 23% 60% 0% 0% 11% 6%
Multi‐Family 23% 60% 0% 0% 11% 6%
Townhouse 23% 60% 0% 0% 11% 6%
Affordable Housing 23% 60% 0% 0% 11% 6%
General Retail 0% 0% 22% 7% 50% 22%
Furniture Store 0% 0% 18% 21% 42% 18%
Pharmacy/Drugstore 0% 0% 23% 3% 52% 23%
Supermarket 0% 0% 22% 6% 50% 22%
Bank 0% 0% 22% 5% 51% 22%
Health Club 0% 0% 22% 4% 51% 22%
High‐Turnover Sit‐Down Restaurant 0% 0% 22% 5% 51% 22%
Fast‐Food Restaurant 0% 0% 22% 8% 49% 22%
Quality Restaurant 0% 0% 22% 6% 50% 22%
Auto Repair 0% 0% 22% 5% 51% 22%
Home Improvement Superstore 0% 0% 21% 10% 48% 21%
Free‐Standing Discount 0% 0% 22% 6% 50% 22%
General Office 0% 0% 12% 53% 24% 12%
Medical Office 0% 0% 18% 12% 52% 18%
Light Industrial 0% 0% 20% 21% 40% 20%
Manufacturing 0% 0% 20% 19% 41% 20%
Warehousing / Self‐Storage 0% 0% 20% 19% 41% 20%Hotel (including restaurant, facilities, etc…) 0% 0% 9% 9% 73% 9%
Motel 0% 0% 9% 13% 70% 9%
Movie Theater (Theater with Matinee) 0% 0% 10% 4% 77% 10%
University 0% 0% 7% 21% 65% 7%
High School 0% 0% 8% 8% 76% 8%
Middle School 0% 0% 8% 9% 76% 8%
Elementary 0% 0% 7% 11% 74% 7%
Private School (K‐12) 0% 0% 8% 9% 75% 8%
Land Use
Productions Attractions
Appendix ELand Use Trip Purpose Assumptions
Recommended