CITY OF SEATTLE - DISTRICT ENERGY PRE-FEASIBILITY STUDY
Prepared By:
Affiliated Engineers Inc./COWI 1601 Fifth Avenue, Suite 1400 Seattle, Washington 98101

City of Seattle District Energy Pre-Feasibility Study 9/22/11
Prepared by Affiliated Engineers, Inc. Page 2 of 48
TABLE OF CONTENTS
Executive Summary ........................................................................................................................................... 3
Introduction ........................................................................................................................................................ 5
Study Areas ......................................................................................................................................................... 5
Description of Individual Districts ................................................................................................................. 7
Analysis .............................................................................................................................................................. 21
Results ................................................................................................................................................................ 25
Recommendations ........................................................................................................................................... 30
Appendix ........................................................................................................................................................... 34
I. Building Types II. Total SF of Heated Area per District and Building Type III. Projected Growth Rates IV. Energy Use Assumptions (Specific Heat Demand) per Building Type
V. Specific Peak and Total Heat Demand

City of Seattle District Energy Pre-Feasibility Study 9/22/11
Prepared by Affiliated Engineers, Inc. Page 3 of 48
VI. Typical Energy Use and Growth Assumption Calculations VII. Efficiencies and District Heating Net Loss VIII. District Heating Production Units IX. Allocation of Existing Heating Methods X. Rate of Conversion to District Heating and Deployment of District Heating Network XI. Fuel Costs
XII. Alternative Fuel Costs per Unit and MMBTU XIII. Conversion and Connection to District Heating System XIV. Investment Costs of District Heating System XV. O&M Costs, Financial Rates and Lifetimes of District Heating System XVI. CO2 Emissions Factors
EXECUTIVE SUMMARY The City of Seattle recognizes that district energy (DE) solutions can be a key component of its goal to achieve Carbon Neutrality by 2030. An initial supposition was developed by the City of Seattle in June 2009 that examined the why’s of District Energy and laid the groundwork for selection of ten proposed districts that are evaluated in this study. This Pre-Feasibility Study provides a high-level “screening” evaluation of the different districts, and prioritizes them with qualifications so the most probable outcomes can be identified early on without providing a highly detailed analysis. The following report provides an initial evaluation of the ten pre-selected districts within the City of Seattle to determine if there are preliminary indications that a District Energy System could be provided in any, or all, of these districts. Affiliated Engineers of Seattle and their Sub-Consultant COWI collected data on the ten districts focusing on density, future development, heating/cooling system types, and accessibility to energy sources. This data was analyzed to determine a hierarchy of probability for implementation of a DE System within each of the districts determines factors that could increase DE feasibility, and identify opportunities within each district for nodal DE systems. In addition, the GHG reduction potential for each system was used as a key factor in weighting districts. Based on the computational analysis performed by AEI/COWI, as well as contributing factors indicated in the narrative for each district, the districts were prioritized into three main groups framed as:
• “Most Promising
• Promising with Further Development
• Not Currently Promising.” A matrix was developed (see the Results section of this report) that provided the basis of the decision making and prioritization. The first and possibly second groupings shown below have indicated a high potential for a DE System and should be investigated with further analysis and development in those areas. The third grouping, entitled “Not Currently Promising,” could still be considered should future appropriate density be added to the area. Most Promising
� First Hill/Yesler Terrace: This area is considered the most promising of all the districts due to its high
density, high EUI, and probable future development (particularly the Yesler Terrace Development). Although this is the most complex of all districts, it also has the most potential.

City of Seattle District Energy Pre-Feasibility Study 9/22/11
Prepared by Affiliated Engineers, Inc. Page 4 of 48
� Capitol Hill: This area is considered the second most promising of all the districts due to its high density
and probable future development. In addition, this district’s buildings have a higher percentage of a heating distribution type (hydronic) that lends itself to a district system, which also reduces the cost of implementation and Net Present Value of implementing district heating.
� South Lake Union: This area is considered the third most likely of all the districts due to its projected
density and expected future development. The presence and recent history of Vulcan Development is a good indicator that this area will continue to grow at a rapid pace in the next five to ten years.
� University of Washington1: This area is considered the fourth most promising of all the districts. Although its heat density is relatively low, the University’s interest in heavy development in this area (particularly for high tech and laboratory facilities) and their expressed interest in modernizing/expanding the current steam system make this area a high probability district. The growth and density factors indicated in this study may actually be quite a bit higher, but further investigation and collaboration with UW will be required to determine more up-to-date expected growth.
Promising with Further Development
o Pioneer Square: This area is considered to be less promising than other districts due to its lower heat
density and uncertain future development. Particularly with the North Lot’s current plans to not join the Seattle Steam distribution system. If the development continues with current plans to include a hydronic heating system, there is the opportunity for future inclusion in a modernized system. That being said, it would likely not play a supportive role in any modernization strategy without further commitment than is currently evidenced to district energy. Afactor that could positively affect the feasibility of a modernized DE system in this district is its adjacency to Seattle Steam’s planned Combined Heat & Power (CHP) plant and excess heat that could be part of a modernization of the Seattle Steam’s local distribution network. Pioneer Square could also play a role in a larger, phased system that could include First Hill, Capitol Hill, and possibly the International District and Little Saigon, depending on development patterns in those two latter areas (not addressed in the current study).
o Interbay/Terminal 91: This area is considered to be a lesser possibility than other districts due to its very low heat density and variable future development. A major mitigating factor is the possible development by the Freehold Group in the NE corner of the district. This development has a fairly high probability of occurring, in various phases, and could be developed as a stand-alone nodal system or possibly become the cornerstone of a larger district system.
o Mount Baker: This area is considered to be a lesser possibility than other districts due to its lower heat
density and currently uncertain future development. However, specific development and the possibility of a waste heat from sewerage system being developed in this area could change the status of this district.
Not Currently Promising
• Northgate: This area is considered very low priority due to its low heat density and lack of definitive future development.
1 Although recommendations are presented for the University of Washington as one district, the area was actually segmented into two separate study areas for analysis – UW East and UW West. The analysis in this report focuses on the two distinct areas of study.

City of Seattle District Energy Pre-Feasibility Study 9/22/11
Prepared by Affiliated Engineers, Inc. Page 5 of 48
• Seattle Center: This area is also considered lower priority than other districts due to its low heat density and lack of future development. However, their current steam district system and proximity to South Lake Union could provide for future leveraging opportunities with future study.
More detailed analysis, as well as integration of the policy recommendations provided by Compass Resource Management, will reveal the most probable district(s) for implementation of a DE system. Although initially reviewed at a high level, additional research and analysis should also be provided concerning linking and phasing of districts, which could possibly provide the impetus required to allow the development of some of the individual districts that, although initially do not appear to be currently viable, could be considered part of a greater scheme.
INTRODUCTION The goal of the District Energy Pre-Feasibility Study is to identify areas with existing or near-term mix of loads, thermal resources, growth and other characteristics that support district energy system deployment, as well as to identify phasing strategies that will facilitate long term implementation of these systems. More specifically, the proposed study provides the following:
• Assesses current and future DE-compatible thermal energy demand in buildings as informed by current buildings and HVAC systems, projected building development types and rates, anticipated energy code improvements, technical and policy projections, and retrofit rates in identified study areas.
• Determines future thermal energy supply based on low impact renewable or waste heat capture opportunities within or near the study areas that may be suitable supply options for each study area.
• Evaluates DE phasing strategies based on future infrastructure planning, development plans, anchor loads, and other capital planning considerations.
• Based on the above analysis, makes a recommendation of three or four high-potential areas for which immediate feasibility and business analyses are justified.
• Identifies energy and GHG emission performance implications compared to a business as usual scenario.
STUDY AREAS
The City of Seattle has identified ten geographic areas which were evaluated in this study. The study areas are all located in designated Urban Centers, Hub Urban Villages, or Manufacturing / Industrial Centers, as defined by the City of Seattle’s 2004 Comprehensive Plan. The map shown below identifies the general location of each study area; the actual boundaries for each area were determined through discussions with the city and AEI/COWI. A minimum or core area was identified by the Consultant for the purposes of the detailed screening, with some consideration of relevant areas, loads and energy sources that may be of strategic interest outside this core area.

City of Seattle District Energy Pre-Feasibility Study 9/22/11
Prepared by Affiliated Engineers, Inc. Page 6 of 48
Capitol Hill
Interbay / Terminal 91
Mt. Baker Light Rail
Station
Northgate
Pioneer Square / North Lot
Seattle Center South Lake Union
UW East Campus
UW West Campus
Yesler Terrace / First Hill

City of Seattle District Energy Pre-Feasibility Study 9/22/11
Prepared by Affiliated Engineers, Inc. Page 7 of 48
DESCRIPTION OF INDIVIDUAL DISTRICTS
The districts chosen for study fall into three main categories:
1. Category 1: No previous work has been done. This study includes a complete and independent analysis as needed to characterize the district energy potential.
2. Category 2: Some level of evaluation has been completed by others. This study utilizes those results and is supplemented additional analysis as needed to provide a complete picture of the district energy potential.
3. Category 3: The area is within or immediately adjacent to Seattle Steam’s existing system, and Seattle Steam is in ongoing negotiations with current or potential customers. Seattle Steam provided data needed to characterize current and projected loads within the immediate study area. This study utilizes those results and additional analysis to provide a complete picture of the district energy loads and options for effective use of existing steam infrastructure and incremental expansion of DE infrastructure, including potential supplemental renewable and/or green energy sources as relevant.
A general description of each district as well as a table indicating the salient features/characteristics of that district is provided below: First Hill/Yesler Terrace (Category 3 – Area served by or adjacent to Seattle Steam service) First Hill includes a portion of the area known as Yesler Terrace. This district is probably the most complex district to evaluate as it has numerous factors that need to be considered, but is also one of the most likely to be considered for a district energy system just based on its density and energy use intensity. The majority of the area consists of multi-story hospital, research and medical office buildings along with multi-story apartment and condo buildings. Additionally, Seattle University falls within the boundaries of this district along with a large church complex, a high school and a museum. There are also several Seattle Housing Authority complexes, including, low and medium rise buildings. This includes the units in Yesler Terrace, a housing sub-division located on the southern portion of the district that is slated for major re-development over the next twenty years. The Yesler Terrace buildings will be replaced in phases with either steel or wood framed multi-unit dwellings between now and 2030. This region of the city is served by high pressure steam from Seattle Steam. All of the hospitals are connected to Seattle Steam. The hospitals utilize steam to HW converters for most of their heating needs, but also use steam for sterilization, which can account for up to 1/3 of their total steam load. First Hill’s current heat load and proximity to the future Yesler Terrace redevelopment (slated to include 4.3 million sf of residential, 1 million sf of office and 200,000 sf of commercial and other uses) creates a promising mix of energy loads for future District Energy development. In addition, the adjacency to the new Seattle Light Rail station on Capitol Hill (as well as the adjacency to the Capitol Hill District itself) and its strong probability of additional development contribute to the DE potential in this district. Hospitals continue to grow and create revenue and would make high quality base loads for a district system, as most of their facilities operate 24/7 365 days per year.

City of Seattle District Energy Pre-Feasibility Study 9/22/11
Prepared by Affiliated Engineers, Inc. Page 8 of 48
Capitol Hill (Category 1 District – No previous analysis available) Capitol Hill and is located just to the east of downtown Seattle on a hill overlooking the downtown area, Lake Union and Puget Sound. The majority of the area consists of multi-story apartment and condo buildings with some additional retail and mixed-use buildings scattered throughout. The age and condition of the buildings varies widely but most could be considered in reasonable shape, with the bulk of the buildings being constructed in the late 30’s to early 50’s. Many of the existing buildings currently utilize hydronic heating systems, which is a positive major consideration when analyzing areas for future application of district heating systems. Development in this area has been slow but steady in the past and still contains potential areas of development that are spread evenly throughout the district. A large Seattle Light Rail station, currently being constructed in the southeast portion of this district, is expected to generate additional retail and commercial
Major Nodes & Anchors
Existing Conditions Future ConditionsDensity High Probability Near Term Development
Current Density - 53,609 Bldg SF/Acre of LandYesler Terrace
Additional Retail/Commercial adjacent to Light Rail Station Multiple Smaller Parcels to be developed throughout District
Building Stock Conditions Projected Housing Growth
Majority of Building Stock constructed in Mid-30's to mid-50's Majority of Building Stock in Fair to Good Conditio n
163% Housing Growth Expected for this District
Prevalent Heating Sources Projected Job Growth
Seattle Steam (HW Distribution) - 30% Gas Fired Boiler (HW Distribution) - 18%
Electric Resistance Heating - 22% 15% Job Growth Expected for this District
Heating and Cooling Loads Anticipated 2030 Density
619,404 MMBTU/Year Heating 1,680,444 ton*Hrs/Year Cooling
Projected Density - 83,840 Bldg SF/Acre of Land
Existing District Heating Systems Anticipated Heating and Cooling Loads
Seattle Steam Serves Entire District972,235 MMBTU/Year Heating
2,050,116 ton*Hrs/Year Cooling
Local Thermal Cooling Supply Potential Significant Heating Sources
No One Major Utility Plant Multiple Chiller Systems throughout Hospitals
Seattle University Chilled Water System
Seattle Steam Proposed DE Sytem in conjunction with Yesler Terrac e
Seattle University HW System
Anticipated Redevelopment
Due to Age (Mid-30's to mid-50's) and Condition (Fa ir to Good) of Majority of Building Stock some Redevelopment is An ticipated for
this District
First Hill/Yesler Terrace
Three Major Hospitals including only Level One Trau ma Center in NW Yesler Terrace Housing (slated for major redevelopm ent)
Seattle University Adjacent to Capitol Hill and new Light Rail Station
Land Area: 10,917,991 Square Feet (251 Acres)

City of Seattle District Energy Pre-Feasibility Study 9/22/11
Prepared by Affiliated Engineers, Inc. Page 9 of 48
growth in the surrounding area. In addition, the Capitol Hill Housing Project (CHHP) is very supportive of proposals for an “energy district” in the area and will assist with promotion of local development. The adjacency to the First Hill district and its three major hospitals make this district a primary candidate for a DE system.
South Lake Union (Category 2 District – Some previous analysis provided) South Lake Union is not served by Seattle Steam or any other central district heating entity, although the adjacent Seattle Center does have a central utility plant with steam and chilled water systems.
The area consists primarily of industrial, light industrial and small commercial buildings, with a few recently built multi-story apartment and condo buildings and with some retail and mixed-use buildings scattered throughout.
Major Nodes & Anchors
Existing Conditions Future ConditionsDensity High Probability Near Term Development
Current Density - 49,136 Bldg SF/Acre of Land
No Specific Development Additional Retail/Commercial Surrounding new Light Rail station
Multiple Smaller Parcels Ready for Development (mos tly Residential Areas) scattered evenly throughout the District
Building Stock Conditions Projected Housing Growth
Majority of Building Stock constructed in Mid-30's to mid-50's Majority of Building Stock in Fair to Good Conditio n
21% Housing Growth Expected for this District
Prevalent Heating Sources Projected Job Growth
Gas Fired Boiler (HW Distribution) - 41% Electric Resistance Heating - 32%
16% Job Growth Expected for this District
Heating and Cooling Loads Anticipated 2030 Density
397,305 MMBTU/Year Heating 285,027 ton*Hrs/Year Cooling
Projected Density - 58,961 Bldg SF/Acre of Land
Existing District Heating Systems Anticipated Heating and Cooling Loads
Seattle Steam Serves Southern end of District475,382 MMBTU/Year Heating 330,632 ton*Hrs/Year Cooling
Local Thermal Cooling Supply Potential Significant Heating Sources
No Major Utility Plant or Cooling Source (i.e. Larg e Body of Water) Possible GSHP Field in Main Park Adjacent to new Li ght Rail
Station
Seattle Steam Possible GSHP Field in Main Park Adjacent to new Li ght Rail
Station
Anticipated Redevelopment
Due to Age (Mid-30's to mid-50's) and Condition (Fa ir to Good) of Majority of Building Stock some Redevelopment is An ticipated for
this District
Capitol Hill
Broadway - Major Retail and Dining Strip Seattle Central Community College
Major Multi-Unit Residential Area - Young Populatio n New Light Rail Station in SE Corner of District
Land Area: 9,404,492 Square Feet (216 Acres)

City of Seattle District Energy Pre-Feasibility Study 9/22/11
Prepared by Affiliated Engineers, Inc. Page 10 of 48
There is a very high probability of this area being developed in the near future. The portion of South Lake Union just to the east of this district has seen a significant amount of growth in the last five years, and the district itself shows close to 75% of the current lots to be potentially developed. The density of the area has also increased and has shown an almost 50/50 balance between commercial and residential development. This mix of uses provides a definitive opportunity for load balancing based on time of day use, which can make the economics of a district energy system that much more attractive. There is also the reasonably sized South Lake Union Park in the district that could be utilized for a ground source heat pump base load as part of a district energy system. A study of the adjacent portion of South Lake Union was performed by FVB in 2003. This study concluded that the area (at the time) could economically support a district energy system. Although more expensive than a conventional approach, long-term energy efficiency, pricing stability and reduced fuel emissions tipped the scale in favor of a district system. However, due to a variety of institutional and timing issues, the district energy approach was not pursued at that time.
Major Nodes & Anchors
Existing Conditions Future ConditionsDensity High Probability Near Term Development
Current Density - 34,930 Bldg SF/Acre of Land
Vulcan developing UW and other properties in the ar ea Additional Housing/Retail growth expected to suppor t both UW
and Amazon move to this area Majority of Parcels (60%-80%) Ready for Development
Building Stock Conditions Projected Housing Growth
Majority of Building Stock constructed in Late-40's to early-70's Majority of Building Stock in Fair to Good Conditio n
182% Housing Growth Expected for this District
Prevalent Heating Sources Projected Job Growth
Gas Fired Boiler (HW Distribution) - 41% Electric Resistance Heating - 32%
45% Job Growth Expected for this District
Heating and Cooling Loads Anticipated 2030 Density
119,566 MMBTU/Year Heating 384,785 ton*Hrs/Year Cooling
Projected Density - 51,589 Bldg SF/Acre of Land
Existing District Heating Systems Anticipated Heating and Cooling Loads
No Major Utility Plant in District Adjacent to Seattle Center CUP
175,690 MMBTU/Year Heating 551,939 ton*Hrs/Year Cooling
Local Thermal Cooling Supply Potential Significant Heating Sources
Per the FVB Study the adjacent Lake Union could be a major Cooling Source
Possible GSHP Field in Park at South end of Distric t
No Major Utility Plant in District Adjacent to Seattle Center CUP
Possible GSHP Field in Park at South end of Distri ct
Anticipated Redevelopment
Due to Age and Condition (Fair to Good) of Building Stock and presence of Vulcan redevelopment is anticipated for this District
South Lake Union
Broadway - Major Retail and Dining Strip Seattle Central Community College
Major Multi-Unit Residential Area - Young Populatio n New Light Rail Station in SE Corner of District
Land Area: 3,114,852 Square Feet (72 Acres)

City of Seattle District Energy Pre-Feasibility Study 9/22/11
Prepared by Affiliated Engineers, Inc. Page 11 of 48
University of Washington (UW) - West (Category 1 District – No previous analysis available) UW West or the U-District consists of mostly privately owned and developed parcels, as well as numerous University of Washington owned facilities. The majority of the area consists of multi-story apartment and condo buildings with a fair number of retail and mixed-use buildings scattered throughout, particularly along University Avenue. A large Seattle Light Rail station is being designed and is expected to be constructed by 2020 in the center of this district. This is expected to generate additional retail and commercial growth in the surrounding area. In addition, the University of Washington is currently conducting a study to evaluate a possible district energy system outside the current confines of their existing campus. The university has initially indicated heavy expected growth in the western area, with the possibility of the school’s existing CUP being an initial provider of steam to a new hot water distribution system in the district, through the use of steam to hot water heat exchangers, which could be eventually fed by a local (located in the district and not from the existing CUP) hot water generating DE plant when economic conditions allow. The current capacity of the steam boilers at the existing CUP appear to be large enough to support future growth in this direction, but bottlenecks in the system may need to be corrected in order to be able to utilize this capacity throughout the entire campus (and beyond).

City of Seattle District Energy Pre-Feasibility Study 9/22/11
Prepared by Affiliated Engineers, Inc. Page 12 of 48
Pioneer Square (Category 3 – Area served by or adjacent to Seattle Steam service) The Pioneer Square District is one of the first areas developed in Seattle and contains some of the oldest buildings in the city. The majority of the area consists of one to four story retail and mixed-use buildings with some additional multi-story apartment and condo buildings distributed throughout. Many of the buildings were built in the late nineteenth century or early twentieth century. Several of the buildings in this area were structurally retrofit after the 2001 Nisqually Earthquake, but many still require further structural work to insure building integrity, which could provide a window of opportunity for district hot water (HW) retrofits. The majority of the buildings in this area are currently served by Seattle Steam, with some using steam to HW converters and others using steam directly. However, the steam piping in this area is the oldest in Seattle Steam’s network and in need of upgrades. Seattle Steam is investigating opportunities for this area to be fed
Major Nodes & Anchors
Existing Conditions Future ConditionsDensity High Probability Near Term Development
Current Density - 28,181 Bldg SF/Acre of Land
UW to Develop Heavily - No Specifics Currently Avai lable Additional Retail/Commercial Surrounding new Light Rail station
Multiple Small Parcels Ready for Development throug hout the District
Building Stock Conditions Projected Housing Growth
Majority of Building Stock constructed in Late-30's to Early-50's Majority of Building Stock in Poor to Fair Conditio n
22% Housing Growth Expected for this District
Prevalent Heating Sources Projected Job Growth
Gas Fired Boiler (HW Distribution) - 41% Electric Resistance Heating - 32%
11% Job Growth Expected for this District
Heating and Cooling Loads Anticipated 2030 Density
226,638 MMBTU/Year Heating 323,763 ton*Hrs/Year Cooling
Projected Density - 33,059 Bldg SF/Acre of Land
Existing District Heating Systems Anticipated Heating and Cooling Loads
No Existing DE System (contiguous to UW Steam syste m)264,729 MMBTU/Year Heating 360,239 ton*Hrs/Year Cooling
Local Thermal Cooling Supply Potential Significant Heating Sources
Adjacent to Lake Union Contiguous to UW Chilled Water System
Contiguous to UW Steam System
Anticipated Redevelopment
Due to Age and Condition of Majority of Building St ock and UW's expected expansion in this direction, and future Li ght Rail Station
Substantial Redevelopment is Anticipated for this D istrict
UW West
University Avenue - Major Retail and Dining Strip University of Washington
Major Multi-Unit Residential Area - Young Populatio n New Light Rail Station in Center of District
Land Area: 9,407,016 Square Feet (216 Acres)

City of Seattle District Energy Pre-Feasibility Study 9/22/11
Prepared by Affiliated Engineers, Inc. Page 13 of 48
by a HW system from waste heat at a proposed cogeneration plant at the Seattle Steam Post Alley plant. This area is adjacent to the First Hill district and subsequently the Capitol Hill district, all of which could become portions of a phased major DE system, which could possibly utilize Seattle Steam for initial heat generation through the use of local steam to hot water converters.
Interbay/Terminal 91 (Category 2 District – Some previous analysis provided) Interbay/Terminal 91 is located just to the north of downtown Seattle with its southern border touching Puget Sound and its northern border not quite reaching the Ship Canal. This district is one of the least dense and least developed districts currently under consideration. The majority of the area consists of industrial, light industrial and small commercial buildings, including those owned and/or operated by the Port of Seattle, with a minor amount of multi-story apartment and condo buildings and a few retail and mixed-use buildings.
Major Nodes & Anchors
Existing Conditions Future ConditionsDensity High Probability Near Term Development
Current Density - 52,194 Bldg SF/Acre of Land
North Lot of Qwest Field Additional Retail/Commercial to support North Lot
Smaller Parcels Ready for Development spread throug hout the District
Building Stock Conditions Projected Housing Growth
Majority of Building Stock constructed in late 1800 's to Early 1930's Majority of Building Stock in Poor to Fair Conditio n
42% Housing Growth Expected for this District
Prevalent Heating Sources Projected Job Growth
Seattle Steam (HW & Steam Distribution) Electric Resistance Heating
17% Job Growth Expected for this District
Heating and Cooling Loads Anticipated 2030 Density
278,961 MMBTU/Year Heating 712,853 ton*Hrs/Year Cooling
Projected Density - 63,592 Bldg SF/Acre of Land
Existing District Heating Systems Anticipated Heating and Cooling Loads
Seattle Steam Serves Southern end of District337,533 MMBTU/Year Heating 834,038 ton*Hrs/Year Cooling
Local Thermal Cooling Supply Potential Significant Heating Sources
Reasonably close to Puget Sound as possible Major C ooling Source
Possible GSHP Field in parking lot(s) of Stadiums
Seattle Steam Possible GSHP Field in parking lot(s) of Stadiums
Anticipated Redevelopment
Due to Age (Late 1800's to Early 1930's!) of Majori ty of Buildings, needed structural upgrades and historical significa nce of area, sensitive redevelopment is most likely to occur in this District
Pioneer Square
Major Retail Dining and Nightlife area Major League Football and Baseball Stadiums
Historically Important District In need of Major Refurbishment
Land Area: 5,637,057 Square Feet (129 Acres)

City of Seattle District Energy Pre-Feasibility Study 9/22/11
Prepared by Affiliated Engineers, Inc. Page 14 of 48
Although it does not initially appear to match the typical profile for district energy (high density, high EUI, access to other districts and/or energy sources), the presence of the Port of Seattle, combined with a proposed major development in the area being led by the Freehold Group, warranted the further investigation of this site. Of particular interest is the sewer heat exchange system being proposed for the Freehold Group’s development. This system would take advantage of heat recovery from the eight-foot King County Metro sewer main that runs through the area, with flows of 38 million gallons per day, and would then use local heat pumps to create a small district system.
Mount Baker (Category 2 District – Some previous analysis provided) Mount Baker is located to the east of Beacon Hill. A previous study by Paladino and Company evaluated the use of the University of Washington Laundry facility as a heat source or consumer for district energy, but did not reach a definitive conclusion about the viability of a district energy system in this area.
Major Nodes & Anchors
Existing Conditions Future ConditionsDensity High Probability Near Term Development
Current Density - 2,974 Bldg SF/Acre of LandFreehold Group is proposing to develop approximatel y 1,600
Residential Units and 380,000 sf of Mixed Business space in the NE corner of the district
Building Stock Conditions Projected Housing Growth
Mostly mixed commercial buildings constructed in th e 60's to 80's. Building condition is generally fair to good.
83% Housing Growth Expected for this District
Prevalent Heating Sources Projected Job Growth
Gas Fired Boiler (HW Distribution) - 41% Electric Resistance Heating - 32%
59% Job Growth Expected for this District
Heating and Cooling Loads Anticipated 2030 Density
29,143 MMBTU/Year Heating 60,642 ton*Hrs/Year Cooling
Projected Density - 4,556 Bldg SF/Acre of Land
Existing District Heating Systems Anticipated Heating and Cooling Loads
No existing systems in district42,817 MMBTU/Year Heating 79,606 ton*Hrs/Year Cooling
Local Thermal Cooling Supply Potential Significant Heating Sources
Adjacent to Puget Sound for Possible Deep Water Coo ling Possible Heat Rejection to King County Sewer Main
Possible GSHP Field in former Landfill (Current Gol f Facility)
King County Sewer Main Possible Methane Extraction from former Landfill
Possible GSHP Field in former Landfill (Current Gol f Facility)
Anticipated RedevelopmentDue to Condition (only Fair to Good) of Majority of Building Stock
some Redevelopment is Anticipated for this District . Port of Seattle would like to redevelop some of their prope rty but do not
currently have specific project plans in place
Interbay/Terminal 91
Former Landfill now Golf Center Port of Seattle Prperty including Dock/Deabrking fo r Cruise Ships
Major Railway Yard
Land Area: 9,099,519 Square Feet (209 Acres)

City of Seattle District Energy Pre-Feasibility Study 9/22/11
Prepared by Affiliated Engineers, Inc. Page 15 of 48
Another major reason for investigating this area for DE potential is that the King County Metro sewer main that runs through the area limits much of the growth potential in the area. Numerous developers have indicated that they are interested in further development in the area, but the location and depth of this main precludes much of the potential construction. King County Metro has therefore considered moving this utility main, and developing a waste-heat system using embedded piping technology in the re-located sewer main. This would provide the double benefit of allowing further building development while providing a potential heat source for such development. Discussions are only in the preliminary stages, and further study would be required to determine if this is truly a viable option.
Major Nodes & Anchors
Existing Conditions Future ConditionsDensity High Probability Near Term Development
Current Density - 9,068 Bldg SF/Acre of Land Additional Retail/Commercial Surrounding new Light Rail station Multiple Parcels Ready for Development - mostly cl ustered along
Rainier Ave S
Building Stock Conditions Projected Housing Growth
Majority of Building Stock constructed in Mid-60's to Mid-80's Majority of Building Stock in Good Condition
69% Housing Growth Expected for this District
Prevalent Heating Sources Projected Job Growth
Gas Fired Boiler (HW Distribution) - 41% Electric Resistance Heating - 32%
30% Housing Growth Expected for this District
Heating and Cooling Loads Anticipated 2030 Density
69,535 MMBTU/Year Heating 69,674 ton*Hrs/Year Cooling
Projected Density - 14,127 Bldg SF/Acre of Land
Existing District Heating Systems Anticipated Heating and Cooling Loads
No existing systems in district106,175 MMBTU/Year Heating 87,979 ton*Hrs/Year Cooling
Local Thermal Cooling Supply Potential Significant Heating SourcesNo Major Utility Plant
Possible GSHP Field in Golf Course contiguous to di strict Possible Deep Water cooling in Lake Washington
Possible Heat Rejection to Re-Located King County S ewer Main
UW Laundry Facility Possible GSHP Field in Golf Course contiguous to di strict Possible King County Sanitary Sewer Main Re-Locatio n
Anticipated RedevelopmentMajority of Building Stock is in good condition, ho wever much of
it has been neglected and the new rail station and light rail corridor have generated additional housing which in turn could
spur additional re-development in the district
Mount Baker
Rainier Ave S - Major Retail and Commercial Strip UW Laundry Facility
Many New Multi-Unit Residences in surrounding area New Light Rail Station in District
Land Area: 8,802,436 Square Feet (202 Acres)

City of Seattle District Energy Pre-Feasibility Study 9/22/11
Prepared by Affiliated Engineers, Inc. Page 16 of 48
Northgate (Category 1 District – No previous analysis available) Northgate is located approximately eight miles north of downtown Seattle. This geographical area contains a large but older shopping mall, and several outlying large retail stores that have been constructed in the last ten years. Large apartment/condo/retirement communities, including some with hydronic heating systems, have recently been built just south of the shopping mall. These large developments also incorporated additional retail spaces, as well as parkland centered around the daylighted Thornton Creek. There is a large transit hub (without any major structures) in the southern portion of this district, where a new station for Sound Transit’s Link Light Rail is expected to enter service by the end of 2020. Most of the commercial buildings in the area are provided with some form of cooling. The majority of high-rise residential units are not provided with cooling although a portion have both heating and cooling through individual fan-coil units. Wallace Development owns the majority of property in the northeast corner of the district and has developed some larger retail buildings, along with some multi-story housing. The Wallace group has expressed interest in developing a major portion of this district located in the NE corner, including the Mullaly Site, but have not generated definitive plans for the near future. One other factor that could affect the development of DE in this area is the presence of NW Hospital and its existing Central Utility Plant, which generates both steam and chilled water, and has some residual capacity (although the majority of this capacity is needed for the hospitals required N+1 redundancy). Although this system does provide a possible leverage point, the medical campus is located in the far NW corner of the district and is physically isolated by a major highway (I-5) and a large cemetery that surrounds much of the property.

City of Seattle District Energy Pre-Feasibility Study 9/22/11
Prepared by Affiliated Engineers, Inc. Page 17 of 48
Seattle Center (Category 1 District – No previous analysis available) The 74-acre Seattle Center is located to the north of downtown Seattle/Belltown at the base of Queen Anne hill, also known as Lower Queen Anne. The Seattle Center was used as part of the 1962 World’s Fair and consists of a variety of commercial, convention and performance type buildings and spaces. The majority of the buildings were built for that exposition, but a number of buildings including the Experimental Music Project and McCaw Hall have been built in the last ten years. Except for the Seattle Center itself, the majority of the area consists of multi-story apartment and condo buildings, with some additional retail and mixed-use buildings scattered throughout. The Seattle Center buildings are all provided with chilled water cooling, but the remainders of the buildings in the area are generally not cooled. The Seattle Center has a Central Utility Plant (CUP), constructed in 2000, that serves the entire facility. The boiler plant consists of 2 – 800 HP 125 psi Steam Boilers, as well as 1 – 150 HP steam boiler for summertime domestic hot water and ancillary summer heating needs. The system steps
Major Nodes & Anchors
Existing Conditions Future ConditionsDensity High Probability Near Term Development
Current Density - 8,591 Bldg SF/Acre of LandResidential/Commercial Surrounding Future Light Rai l Station
Multiple Major Parcels Ready for Development around Mall Area
Building Stock Conditions Projected Housing Growth
Majority of Building Stock constructed in Late-50's to Early-70's Majority of Building Stock in Good Condition
37% Housing Growth Expected for this District
Prevalent Heating Sources Projected Job Growth
Gas Fired Boiler (HW Distribution) - 41% Electric Resistance Heating - 32%
15% Job Growth Expected for this District
Heating and Cooling Loads Anticipated 2030 Density
94,117 MMBTU/Year Heating 131,831 ton*Hrs/Year Cooling
Projected Density - 10,869 Bldg SF/Acre of Land
Existing District Heating Systems Anticipated Heating and Cooling Loads
NW Hospital has CUP with a total output capacity o f 26.45 MMBTU with N+1 Redundancy
117,564 MMBTU/Year Heating 151,605 ton*Hrs/Year Cooling
Local Thermal Cooling Supply Potential Significant Heating Sources
NW Hospital has 600 tons Chiller Capacity with N+1 Redundancy Possible GSHP Field in Park Adjacent to District
NW Hospital CUP Possible GSHP Field in Park Adjacent to District
Anticipated Redevelopment
Some Redevelopment is Anticipated in this District as many of the Retail Outlets are dated and the area can support g reater density
than is currently built
Northgate
Northgate Mall - Major Retail and Retail/Dining in Surrounding Area NW Hospital
Developing Multi-Unit Residential Area Future Light Rail Station in SE Corner of District at existing Transit Center
Land Area: 11,980,552 Square Feet (275 Acres)

City of Seattle District Energy Pre-Feasibility Study 9/22/11
Prepared by Affiliated Engineers, Inc. Page 18 of 48
down to 9-15 psi at the buildings, then run through steam to hot water converters for use in hot water heating coils and domestic hot water. Two buildings are served directly by steam heating coils. Typically only one 800 HP boiler operates at a time under full load conditions. On the cooling side, the CUP consists of 2 – 1,500 Ton Chillers, a 900 ton Chiller and 2 – 300 ton chillers. These serve all buildings on the campus. The 1,500 ton chillers specifically serve Key Arena. All other steam and heating hot water in the district is produced at the building level with gas-fired boilers and a small amount of oil-fired boilers, as well as being served by a mix of airside (gas, oil, heat pump) and electric systems. With the exception of the recent Gates Foundation campus, development in this area has been slow but steady in the past and potential areas of development are still spread evenly throughout the district, with a heavier concentration on the eastern side of the district, toward South Lake Union. The residual capacity at the Seattle Center would appear to show some potential for an extended shared, or district system. On the heating side, the steam system does not necessarily lend itself to a low-energy district level approach, but similar to other districts previously mentioned, the steam system could be an initial provider through heat exchangers to a hot water distribution system in the district, that could be fed by a local DE plant when economic conditions allow. Some of the capacity in the existing cooling system at the Seattle Center could be leveraged to provide a local cooling resource, should the demand be sufficient. However, the main focus of the current study is on heating systems, and further detailed study would be required to determine if this is in fact feasible.

City of Seattle District Energy Pre-Feasibility Study 9/22/11
Prepared by Affiliated Engineers, Inc. Page 19 of 48
University of Washington (UW) East (Category 1 District – No previous analysis available) The University of Washington (UW) and is located just to the north of downtown Seattle, on the north side of Lake Union and just to the east of Lake Washington. The majority of the area consists of the university campus itself which was first developed in the late nineteenth century, with the majority of older buildings on campus being built for the Alaska-Yukon-Pacific Exposition in 1909. Further development occurred in the 1960s and continues on a regular basis through the present, with the University now occupying over 500 buildings totaling 20 million square feet. The northern portion of the district consists mainly of single-family housing, with some higher density apartments and condos located on the edge of the university campus. A large shopping mall is also located in this area and consists mostly of one and two story retail and commercial buildings.
Major Nodes & Anchors
Existing Conditions Future ConditionsDensity High Probability Near Term Development
Current Density - 25,439 Bldg SF/Acre of Land
No Specific Development Additional Retail/Commercial Surrounding new Light Rail station
Multiple Smaller Parcels Ready for Development (mos tly Residential Areas) scattered evenly throughout the District
Building Stock Conditions Projected Housing Growth
Majority of Building Stock constructed in Mid-30's to mid-50's Majority of Building Stock in Fair to Good Conditio n
17% Housing Growth Expected for this District
Prevalent Heating Sources Projected Job Growth
Gas Fired Boiler (HW Distribution) - 41% Electric Resistance Heating - 32%
11% Job Growth Expected for this District
Heating and Cooling Loads Anticipated 2030 Density
288,936 MMBTU/Year Heating 614159,027 ton*Hrs/Year Cooling
Projected Density - 28,723 Bldg SF/Acre of Land
Existing District Heating Systems Anticipated Heating and Cooling Loads
Seattle Steam Serves Southern end of District325,572 MMBTU/Year Heating 681,717 ton*Hrs/Year Cooling
Local Thermal Cooling Supply Potential Significant Heating Sources
No Major Utility Plant or Cooling Source (i.e. Larg e Body of Water) Possible GSHP Field in Main Park Adjacent to new Li ght Rail
Station
Seattle Steam Possible GSHP Field in Main Park Adjacent to new Li ght Rail
Station
Anticipated Redevelopment
Due to Age (Mid-30's to mid-50's) and Condition (Fa ir to Good) of Majority of Building Stock some Redevelopment is An ticipated for
this District
Seattle Center
Broadway - Major Retail and Dining Strip Seattle Central Community College
Major Multi-Unit Residential Area - Young Populatio n New Light Rail Station in SE Corner of District
Land Area: 12,720,791 Square Feet (292 Acres)

City of Seattle District Energy Pre-Feasibility Study 9/22/11
Prepared by Affiliated Engineers, Inc. Page 20 of 48
Most of the buildings on campus (other than housing) are provided with cooling. The university owns and operates a considerable size Central Utility Plant (CUP) that serves virtually the entire campus. The boiler plant consists of 2 – 425 psi Steam Boilers and 3 – 185 psi Steam Boilers with a total capacity of approximately 600,000 pounds per hour. On the cooling side, the CUP consists of 5 – 2,000 Ton Centrifugal Chillers, a 1,000 ton Centrifugal Chiller and 1 – 1,000 ton Steam Absorption Chiller, for a total capacity of approximately 14,000 tons. In addition, the south campus provides another 1,400 tons of cooling capacity, and other buildings throughout campus contain their own chilled water systems (i.e., William Gates Law School). However, bottlenecks in both the steam and chilled water distribution systems prevent all of this capacity from being accessible to all parts of campus. The university is currently updating its utility master plan, specifically in the south campus region where much of the current growth is occurring and where the buildings under development in this area have high EUI’s due to their use-type (labs, health care, research). The CUP also contains a 5 MW Steam Turbine Generator which is utilized as a co-generation unit for both campus electricity and low pressure exhaust steam used for heating buildings. This unit is set to be replaced in 2019. A Sound Transit Link Light Rail station is currently being constructed in the southeast portion of this district, but is not expected to generate additional retail and commercial growth in the surrounding area as the station is located on the university campus itself, adjacent to the stadium and associated parking lots. However, the University of Washington is currently investigating a study for the extension of, or addition to, their CUP for use as a district energy system, with the northern housing and retail areas being possible candidates for loads. However, both of these are low-density areas and the economics may not pencil out. The fact that UW produces steam, and not hot water, is also a negative contributing factor, due to its inherent inefficiencies and maintenance costs.

City of Seattle District Energy Pre-Feasibility Study 9/22/11
Prepared by Affiliated Engineers, Inc. Page 21 of 48
Major Nodes & Anchors
Future ConditionsDensity High Probability Near Term Development
Current Density - 53,216 Bldg SF/Acre of LandContinuous Development
UW Plans to expand and upgrade on and off campus ho using
Building Stock Conditions Projected Housing Growth
Majority of Building Stock in Good to Excellent Con dition 26% Housing Growth Expected for this District
Prevalent Heating Sources Projected Job Growth
UW Steam Distribution) - close to 90% 14% Job Growth Expected for this District
Heating and Cooling Loads Anticipated 2030 Density
870,767 MMBTU/Year Heating 1,972,559 ton*Hrs/Year Cooling
Projected Density - 76,631 Bldg SF/Acre of Land
Existing District Heating Systems Anticipated Heating and Cooling Loads
UW Boiler Plant: 2 – 425 psi Steam Boilers and 3 – 185 psi Steam Boilers. Total capacity of 600,000 pounds per hour.
1,253,905 MMBTU/Year Heating 2,840,485 ton*Hrs/Year Cooling
Local Thermal Cooling Supply Potential Significant Heating SourcesAdjacent to both lake Union and Lake Washington
UW CUP: 5 – 2000 Ton Centrifugal Chillers, a 1000 t on Centrifugal Chiller, 1 – 1000 ton Steam Absorption Chiller. Tot al capacity of
14,000 tons. Additional 1400 tons of capacity on ca mpus
UW Steam System Possible GSHP Field in UW Fields and Parking Lots
Anticipated Redevelopment
UW continuously redeveloping campus. Currently focu sed on expansion of Healthcare and Research areas in South Campus
and Housing throughout
UW East
UW Campus New Light Rail Station
Continuous Upgrading of Facilities Football Program is major draw
Land Area: 11,876,209 Square Feet (273 Acres)

City of Seattle District Energy Pre-Feasibility Study 9/22/11
Prepared by Affiliated Engineers, Inc. Page 22 of 48
ANALYSIS The main sources of data used in this study are as follows:
• City of Seattle GIS
• King County Tax Records
• City of Seattle Department of Planning and Development (DPD) Additional sources of data include:
• FVB analysis of South Lake Union area.
• Paladino/AEI analysis of Mount Baker area
• FVB initial appraisal of Pioneer Square area
• University of Washington Capitol Projects/Planning office The main source of data (City of Seattle GIS) provided the area of each piece of property within each district broken down by building type. However, this information was incomplete, and difficult to sort. The properties in each district were then cross-checked against the King County tax records and finally against Google Earth. There were approximately twenty building types in the GIS information, which were eventually consolidated into nine primary types based on similar energy use intensities (see Appendix II).
A decision making flow diagram was developed to assist with the decision making process. All input
parameters (marked in green in the diagram) were collected and processed according to the order shown.
Similar processes have been utilized to develop systems in other communities throughout the globe.
The diagram is shown below, and illustrates the process flow from input parameters (marked green), to partial
results (marked yellow) and to final results (marked red). The arrows in the diagram indicate the direction and
order of the calculation flow.

City of Seattle District Energy Pre-Feasibility Study 9/22/11
Prepared by Affiliated Engineers, Inc. Page 23 of 48
Rather than show all of the data graphically in the body of the report, the input parameters are provided for
reference in the Appendix; sf of heated space per building type, growth factor, energy use assumptions
(specific heat demand) per building type, specific peak and total heat demand, efficiencies and district heating
net loss, district heating production units (shown in increments), allocation of existing heating methods, rate
of conversion to district heating and deployment of district heating network, fuel costs, cost of conversion
and connection to district heating, investment costs of district heating, O&M costs, financial rates and
lifetimes of district heating systems and CO2 emission factors.
These parameters were evaluated by AEI/COWI and applied on a building type by building type basis. The building types are indicated in Section I of the Appendix. Many of the factors are relatively straightforward, but others require some additional explanation or background. This section provides that information and background for the appropriate factors and analyses. One of the more important pieces of information used in the initial data gathering/analysis was the growth factor. AEI developed a spreadsheet that gathered growth projections from the previously prepared studies, as well as from the City of Seattle’s Comprehensive Growth Plan. We then assigned a probability factor to each average growth factor, based on conversations with City staff and various developers, yielding an overall
City of Seattle District Energy Pre-Feasibility Study 9/22/11
Prepared by Affiliated Engineers, Inc. Page 24 of 48
expected growth factor (see Section III of the Appendix). The factors indicate the total growth by sector and district from 2011 to 2030. Heating and cooling energy by building type was gathered through readily available industry data and vetted against previous work done by AEI at the University of Idaho.
The data was combined and extrapolated to provide annual heating and cooling energy consumption values
for each building type, for both the current and future demand in each district. See Section VI of the
Appendix for a typical district analysis.
The specific peak heat demand and specific average heat demand are indicated in Appendix V. The average
heat demand is for 7779 hours of the year. To find the yearly heat demand per heated area, the specific heat
demand is multiplied by 7779 hours.
The efficiencies of the existing individual heating methods are based on commonly available industry data and
previous experience.
The allocation of the existing heating methods is based on information gathered by FVB during their study in
South Lake Union through their discussions with city officials.
The installed capacity and installation year of the district heating units are based on the peak demand in every
year. The capacity is assumed installed as a number of smaller units in order to ensure security of supply and
operational flexibility in different load situations. The capacity of the units are assumed to 10 MMBtu/hr (3
MW), 17MMBtu/hr (5 MW), 34 MMBtu/hr (10 MW) or 68 MMBtu/hr (20 MW).
The district heating network is assumed to be deployed during a period of five years. The network should
therefore be completed no later than 2015.
The conversion from the existing heating methods to district heating from the new district heating system is
expected to happen over a period of seven years. All applicable consumers are expected to be converted no
later than 2017.
The rate of conversion and network deployment are indicated in Appendix X. Only gas and oil consumers are
expected to be converted to DH. The existing electric heating consumers have been assumed to keep their
current heating system. All new consumers will be added to the DH system. However, since new consumers
don't convert they are not included in the accumulated rate of conversion.
Fuel costs for individual heating systems are indicated in Appendix XI. The cost of electricity and oil are
obtained from Seattle.gov2. The cost of natural gas is obtained from Puget Sound Energy Schedule no 31 and
31T.
The conversion cost covers the removal of any existing heating unit, insertion of the district heating unit and
construction of a distribution system for hot water in cases where the existing heating system have air
distribution. The connection cost also covers the actual connection of domestic district heating units to the
district heating network.
2 http://www.seattle.gov/light/conserve/resident/homeheating/cv5_fcc.asp

City of Seattle District Energy Pre-Feasibility Study 9/22/11
Prepared by Affiliated Engineers, Inc. Page 25 of 48
O&M costs, financial rates and lifetimes of DH system. The specific O&M costs, the financial rates and
lifetimes of the district heating consumer unit, network and boilers are listed in
CO2 emission factors of electricity and natural gas are supplied by the City of Seattle, and their use was
specifically requested for this analysis, as the city felt that these factors were the most accurate for the area
and would not be changing substantially over the period of study. The CO2 emission factor of electricity
locally in Seattle is extremely low due in large part to the electricity being produced by hydro power.
In the analyses the actual local CO2 emission factor has not been used as it does not reflect the real CO2
emission savings from development of DH in the overall US system. If the electricity demand decreases or
increases it will not be the electricity produced by hydro power that will be affected, it will be the NW
marginal electricity production unit.
All of the above referenced data was inserted into calculation spreadsheets that combine the factors in the
appropriate combinations to eventually determine a numerical prioritization (i.e., heat density, cost
effectiveness, etc). The numerical prioritization was then filtered by the analysis team using more subjective
criteria (such as likelihood of development) and put into an order for final recommendation. The Results
section below illustrates the numerical prioritization, and then the final recommendations are shown and
explained in the section titled Recommendations.
RESULTS The first, and probably the most important, deciding factor for selection of preferred districts was heat density. The current and future annual heating load, as well as the area of the connected loads in each district, was analyzed to determine a heat density factor for both current (2011) and future (2030). Our initial determination of applicability is based on the projected 2030 heat densities. As Tables 2 & 3 below indicates, there are three districts (Interbay, Mount Baker & Northgate) with very low heat densities, which in all likelihood could not support a district energy system unless there was a very specific case within the district for a smaller, project specific system. Two other districts (Seattle Center and UW West) appear to be marginal as well, and should be considered lower priority for further investigation of district energy viability. However, other mitigating factors (such as high probability of future development) may still allow those districts to be deserving of future consideration. Based on the analysis, as well as the contributing factors indicated in the narrative for each district, the districts were sorted into groups by priority for further analysis and development of a future district energy system in each area. The most important factor considered, besides heat density, was the likelihood of development within the district. This applies to either the district as a whole, or for a specific node within that district (i.e., Interbay/Terminal 91). A summary of critical decision making factors and the final order of prioritization of the districts are shown in Table 1 below:

City of Seattle District Energy Pre-Feasibility Study 9/22/11
Prepared by Affiliated Engineers, Inc. Page 26 of 48
Table 1
Table 2 – Heat Demand 2011
DistrictsFuture Development
Density
Future Heat
DensityCost
(Building SF/Acre) (MMBTU/SF) (USD/MWH) Housing JobsHeating
(MMBTU)
Cooling
(ton*Hrs)
Without DE
(Metric Tons
eCO2)
With DE
(Metric Tons
eCO2)
First Hill/Yesler 83,840 0.062 $17.00 130% 15% 972,235 2,050,116 109.0 80.0
Capitol Hill 58,961 0.042 $22.00 21% 16% 264,729 360,239 70.0 39.0
South Lake Union 51,589 0.038 $19.00 182% 45% 175,690 550,939 26.0 14.5
UW West 33,059 0.093 $11.00 26% 14% 264,729 360,239 84.0 101.0
Pioneer Square 63,592 0.049 $21.00 42% 17% 337,533 834,038 50.0 28.0
Interbay/Ballard 4,556 0.003 $26.00 83% 59% 42,817 79,606 6.3 3.5
Mount Baker 14,127 0.008 $22.00 69% 30% 106,175 87,979 15.5 8.8
Northgate 10,869 0.008 $21.00 37% 15% 117,564 151,605 17.0 9.0
Seattle Center 28,723 0.023 $22.00 17% 11% 325,572 681,717 48.0 26.5
UW East 76,631 0.019 $22.00 22% 11% 1,253,905 2,840,485 39.0 14.5
Summary Table
GHG Profiles 2030Future Thermal Loads/YearFuture Growth Factors
0
50
100
150
200
250
300
GW
h
Heat demand 2011
Seattle Steam Heating (HW Distribution)
Seattle Steam Heating (Steam Distribution)
Gas Fired Boiler Heating (HW Distribution)
Gas Fired Furnace Heating (Air Distribution)
Oil Fired Furnace Heating (Air Distribution)
Oil Fired Boiler Heating (HW Distribution)
Air to Water Heat Pump Heating (HW
Distribution)
Air to Air Heat Pump Heating (Air
Distribution)
Electric Resistance Heating
City of Seattle District Energy Pre-Feasibility Study 9/22/11
Prepared by Affiliated Engineers, Inc. Page 27 of 48
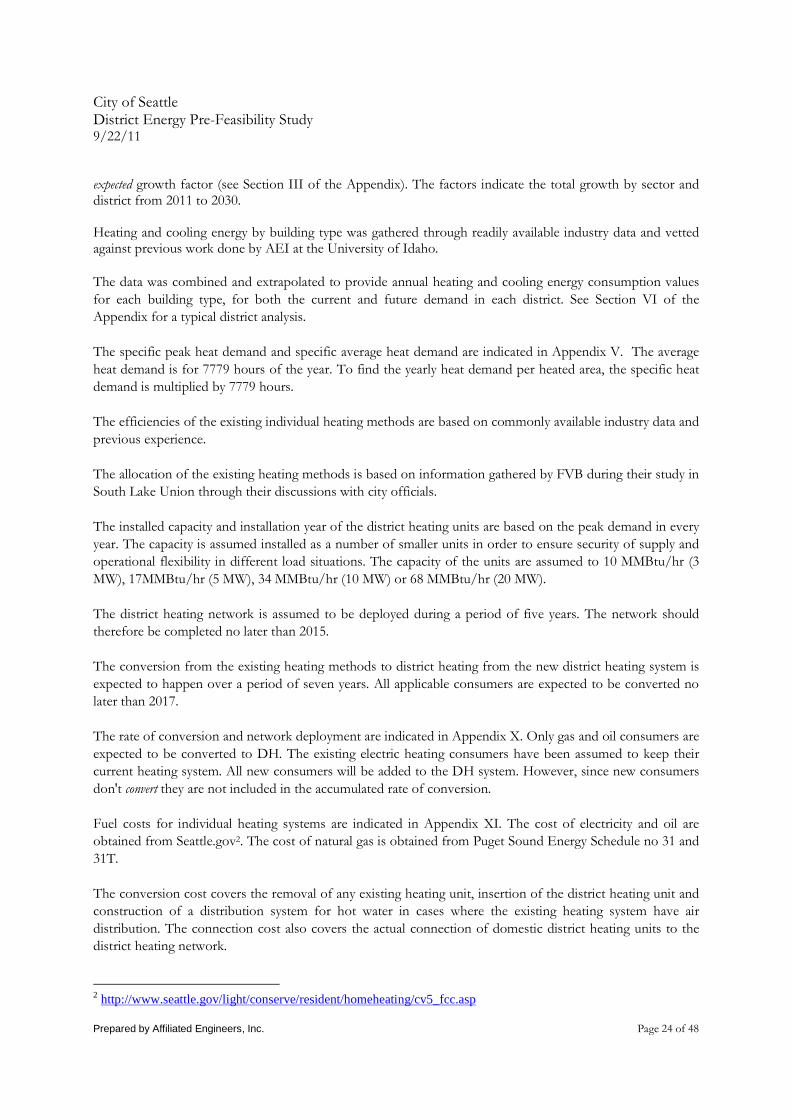
Table 3 – Heat Demand 2030 Business as Usual
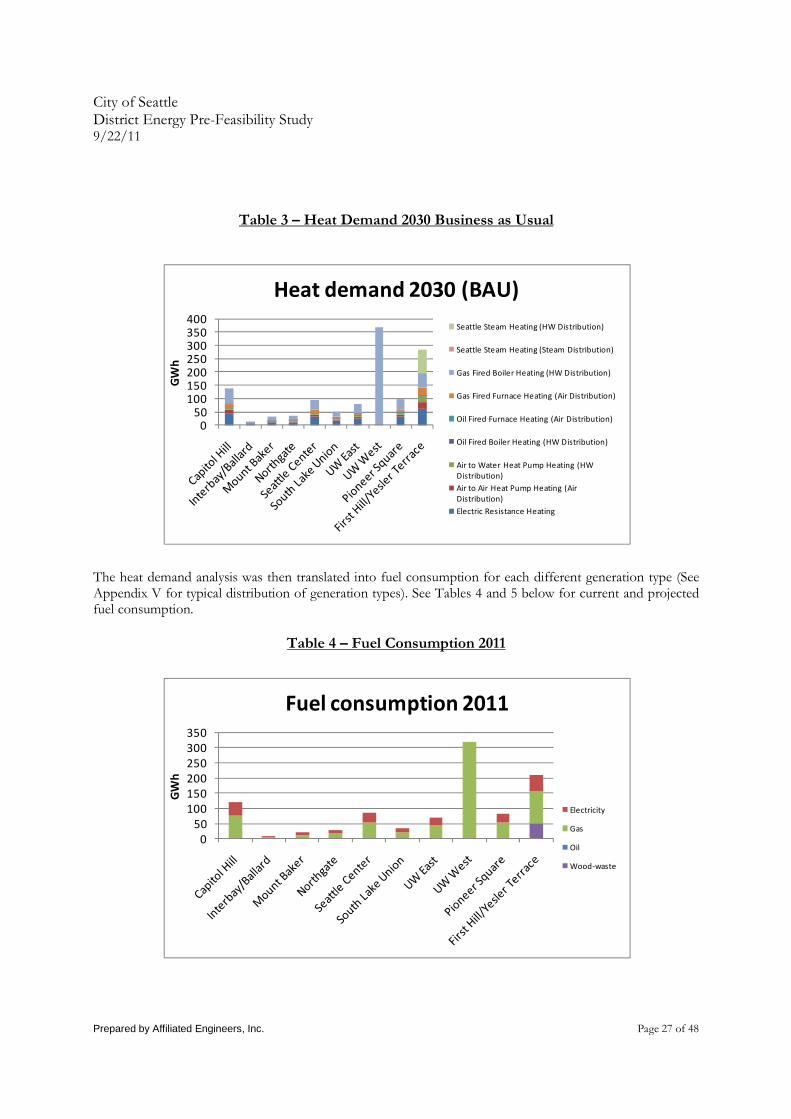
The heat demand analysis was then translated into fuel consumption for each different generation type (See Appendix V for typical distribution of generation types). See Tables 4 and 5 below for current and projected fuel consumption.
Table 4 – Fuel Consumption 2011
050
100150200250300350400
GW
h
Heat demand 2030 (BAU)
Seattle Steam Heating (HW Distribution)
Seattle Steam Heating (Steam Distribution)
Gas Fired Boiler Heating (HW Distribution)
Gas Fired Furnace Heating (Air Distribution)
Oil Fired Furnace Heating (Air Distribution)
Oil Fired Boiler Heating (HW Distribution)
Air to Water Heat Pump Heating (HW
Distribution)
Air to Air Heat Pump Heating (Air
Distribution)
Electric Resistance Heating
0
50
100
150
200
250
300
350
GW
h
Fuel consumption 2011
Electricity
Gas
Oil
Wood-waste

City of Seattle District Energy Pre-Feasibility Study 9/22/11
Prepared by Affiliated Engineers, Inc. Page 28 of 48
Table 5 – Fuel Consumption 2030 Business as Usual
This fuel consumption analysis was then translated into equivalent CO2 (GHG) emissions. See Tables 6 and 7 below for current and projected CO2 (GHG) emissions. See Appendix XI for individual District’s CO2 (GHG) emissions showing 2011 emissions, projected 2030 emissions under a Business as Usual scenario, and projected 2030 emissions using district energy.
Table 6 – GHG Emissions for 2011
050
100150200250300350400450500
GW
h
Fuel consumption 2030 (BAU)
Electricity
Gas
Oil
Wood-waste
0
10
20
30
40
50
60
70
Ton
ne
s C
O2
CO2 emission 2011
Gas
Oil
Electricity

City of Seattle District Energy Pre-Feasibility Study 9/22/11
Prepared by Affiliated Engineers, Inc. Page 29 of 48
Table 7 GHG Emissions 2030 Business as Usual
CO2 emissions for a Business as Usual (BAU) baseline were then compared to the CO2 emissions with district heating as the main generation source. District heating numbers assumed the use of natural gas fired boilers at a central location, as this is the most common technology for large heating applications (see Table 8 below).
Table 8 – GHG Reduction with District Heating (Compared to Business as Usual)
0102030405060708090
To
nn
es
CO
2
CO2 emission 2030 (BAU)
Gas
Oil
Electricity
010203040506070
To
nn
es
CO
2
CO2 reduction in 2030
(DH compared with existing)

City of Seattle District Energy Pre-Feasibility Study 9/22/11
Prepared by Affiliated Engineers, Inc. Page 30 of 48
Finally, implementation costs to convert the existing buildings in the district were developed, along with the
cost for providing district heating to new buildings, and the cost of the district heating plant itself. The figure
below shows the consumer costs of one MWh heat from the DH system. This includes costs of converting
and connection to the DH system, investments in DH producing units and in the DH distribution system
along with expenses of fuel and O&M. The heating costs are discounted to the net present value.
Table 9 – Total Cost to Deliver District Heat to Users
All of the above factors were then evaluated to determine which districts appeared to be the best suited to development of a district energy system. As mentioned previously, these were weighted against the probability of development for each district for the entire district. As indicated in the descriptions of the districts, some districts have specific areas, or nodes, that had a high degree of development probability, but the entire district may not. Those districts were given less priority than districts where it was more likely that the entire district would be developed. The Recommendations section below expresses the outcome of the analysis and results described above.
RECOMMENDATIONS As indicated in the Results Section, a matrix was developed (see Table 1 in Results section) that provided the basis of the decision making and prioritization. The districts were then organized into three main groups framed as a) Most Promising, b) Promising with Further Development, or c) Not Currently Promising. The first and possibly second groupings shown below have indicated a high potential for a DE System and should be considered for further analysis. The areas in the third grouping, entitled Not Currently Promising, should only be considered as candidates for a district energy system if future development leads to higher densities than are currently projected.
0
5
10
15
20
USD
/MW
h
Heat generation cost per MWh
(Total NPV)

City of Seattle District Energy Pre-Feasibility Study 9/22/11
Prepared by Affiliated Engineers, Inc. Page 31 of 48
Most Promising
� First Hill/Yesler Terrace: This area is considered the most promising of all the districts due to its high
density, high EUI, and probable future development (particularly the Yesler Terrace Development). Although this is the most complex of all districts, it also has the most potential.
� Capitol Hill: This area is considered the second most promising of all the districts due to its high density
and probable future development. In addition, this district’s buildings have a higher percentage of a heating distribution type (hydronic) that lends itself to a district system, which also reduces the cost of implementation and Net Present Value of implementing district heating.
� South Lake Union: This area is considered the third most likely of all the districts due to its projected
density and expected future development. The presence and recent history of Vulcan Development is a good indicator that this area will continue to grow at a rapid pace in the next five to ten years.
� University of Washington3: This area is considered the fourth most promising of all the districts. Although its heat density is relatively low, the University’s interest in heavy development in this area (particularly for high tech and laboratory facilities) and their expressed interest in modernizing/expanding the current steam system make this area a high probability district. The growth and density factors indicated in this study may actually be quite a bit higher, but further investigation and collaboration with UW will be required to determine more up-to-date expected growth.
Promising with Further Development
o Pioneer Square: This area is considered to be less promising than other districts due to its lower heat
density and uncertain future development. Particularly with the North Lot’s current plans to not join the Seattle Steam distribution system. If the development continues with current plans to include a hydronic heating system, there is the opportunity for future inclusion in a modernized system. That being said, it would likely not play a supportive role in any modernization strategy without further commitment than is currently evidenced to district energy. Afactor that could positively affect the feasibility of a modernized DE system in this district is its adjacency to Seattle Steam’s planned Combined Heat & Power (CHP) plant and excess heat that could be part of a modernization of the Seattle Steam’s local distribution network. Pioneer Square could also play a role in a larger, phased system that could include First Hill, Capitol Hill, and possibly the International District and Little Saigon, depending on development patterns in those two latter areas (not addressed in the current study).
o Interbay/Terminal 91: This area is considered to be a lesser possibility than other districts due to its very low heat density and variable future development. A major mitigating factor is the possible development by the Freehold Group in the NE corner of the district. This development has a fairly high probability of occurring, in various phases, and could be developed as a stand-alone nodal system or possibly become the cornerstone of a larger district system.
o Mount Baker: This area is considered to be a lesser possibility than other districts due to its lower heat
density and currently uncertain future development. However, specific development and the
3 Although recommendations are presented for the University of Washington as one district, the area was actually segmented into two separate study areas – UW East and UW West. The analysis in this report focuses on the two distinct areas of study.

City of Seattle District Energy Pre-Feasibility Study 9/22/11
Prepared by Affiliated Engineers, Inc. Page 32 of 48
possibility of a waste heat from sewerage system being developed in this area could change the status of this district.
Not Currently Promising
• Northgate: This area is considered very low priority due to its low heat density and lack of definitive future development.
• Seattle Center: This area is also considered lower priority than other districts due to its low heat density and lack of future development. However, their current steam district system and proximity to South Lake Union could provide for future leveraging opportunities with future study.
We recommend that the first four primary candidate districts be investigated further to determine if they are, in fact, viable candidates for a district energy system. Some of the primary drivers in this more detailed analysis will be: A. Cost of distribution. This factor alone could well be the make or break piece of the puzzle for
district energy in any or all of the districts under consideration. Current restrictions on pipe depth, difficulty in working around existing in-ground utilities and the cost of excavation, backfill) and re-paving can significantly impact construction costs.
B. Cost and location of land and structure(s) for the actual district heating plant(s). The cost of land
in Seattle is relatively high compared to other markets, and since the areas under consideration are also considered prime real estate for development, the cost and availability of a proper site may be higher than usual.
C. Ability to be linked to other districts in a larger district energy system. Certain districts (particularly Capitol Hill, First Hill and Pioneer Square) have adjacencies that could allow each district to be leveraged into a larger system. Several factors will need to be investigated, including pathways, right of ways, distances travelled, location(s) of generation facilities, etc.
D. Effect of potential policy changes affecting zoning, density, use types, in-ground right of ways, etc. Additionally, further research on ownership potentials for the district energy systems could greatly affect the viability of developing these types of facilities in Seattle.
E. District cooling opportunities. The majority of this study was focused on district heating, as Seattle is a heating dominated climate and has fewer cooling hours than heating hours. However, a parallel or complimentary cooling system (especially in the case of ground source heat pumps) could be developed for the majority of the recommended areas. Although this study considered projected cooling loads a more complete study would be required to determine the actual viability of a district cooling System.
F. Waste heat, waste to heat and free cooling resources. Several potential resources for these technologies/strategies exist in the Seattle area. As an example, a large cement production plant located in the Duwamish River area of South Seattle has been initially investigated by Seattle Steam as a potential source of low cost waste heat. Although an apparent abundance of waste heat is available, a cost benefit analysis would be required to determine if this is a viable resource. The cost of capture and delivery over a great distance could prove insurmountable in this particular application. Additionally, a waste to heat (and possibly cooling through absorption chillers) plant

City of Seattle District Energy Pre-Feasibility Study 9/22/11
Prepared by Affiliated Engineers, Inc. Page 33 of 48
could be developed on the Port of Seattle site located in the Interbay District, as the major rail line that runs through the property carries multiple “trash trains” that deliver community waste to disposal sites in southern Washington and Oregon. Again, a site-specific cost benefit analysis would be required to determine if this is a viable resource. Finally, several of the districts (Interbay, UW East and West, Mount Baker, South Lake Union) are located in reasonable proximity to major bodies of water that could be utilized for deep water cooling. As shown in the FVB study of the South Lake Union area, this can be a cost effective means of providing cooling to a district. Specifics of each district would need to be developed and analyzed to prove this is true in each area of study.

City of Seattle District Energy Pre-Feasibility Study 9/22/11
Prepared by Affiliated Engineers, Inc. Page 34 of 48
APPENDIX I. Building Types
II. Total SF of Heated Area per District and Building Type
Apartment/Condo Single Family Restaurant Institutional
APARTMENT 4 PLEX RESTAURANT (FAST FOOD) GOVT SERVICEAPARTMENT (CO-OP) DUPLEX RESTAURANT/LOUNGE SCHOOL (PRIVATE)APARTMENT (MIXED USE) SINGLE FAMILY (C/I USE) SCHOOL (PUBLIC)CONDO (MIXED USE) SINGLE FAMILY (C/I ZONE)CONDO (RESIDENTIAL) SINGLE FAMILY (RES USE/ZONE)GROUP HOME TOWNHOUSE PLATHOTEL/MOTEL TRIPLEX
Industrial Office Public Gathering Unknown
INDUSTRIAL (HEAVY) MED/DENTAL OFFICE MOVIE THEATER MORTUARY/CEMETERY/CREMATORYINDUSTRIAL (LIGHT) OFFICE BLDG BOWLING ALLEY SERVICE BLDGMINI WAREHOUSE CHURCH VACANT (COMMERCIAL)WAREHOUSE CLUB VACANT (MULTI-FAMILY)
TAVERN/LOUNGEAUTO SHOWROOM AND LOT
Retail/Commercial
GROCERY STOREPOST OFFICERETAIL STOREBANKCONV STORE W GAS
Space Usage Type
1st Hill Cap Hill S Lk Union UW West Pioneer Sq Interbay Mt Baker Northgate Seattle Ctr UW East
Office 2,610 600 710 0 3,154 95 62 80 2,729 1,200
Industrial 91 189 708 0 275 148 53 39 386 19
Institutional 333 318 43 0 88 76 4 10 80 91
Retail 44 860 807 13,421 977 80 317 810 236 863
Church 16 10 48 0 81 0 13 0 34 281
Grocery Store 0 8 0 0 0 0 0 0 0 34
Health/Fitness 0 0 6 0 0 0 54 0 301 13
Hospital 6,589 0 0 0 0 0 0 0 0 0
Restaurant 10 125 47 0 342 11 18 15 87 80
Theater 0 19 0 0 54 0 0 0 768 17
Single Family 108 641 0 0 71 20 496 78 215 357
Apartment/Condo/Extended Stay
Hotel2,720 7,837 49 1,107 1,231 192 756 1,160 2,148 3,041
Hotel/Motel 936 0 96 0 461 0 59 170 445 92
Heated Area (1000 SF)
District
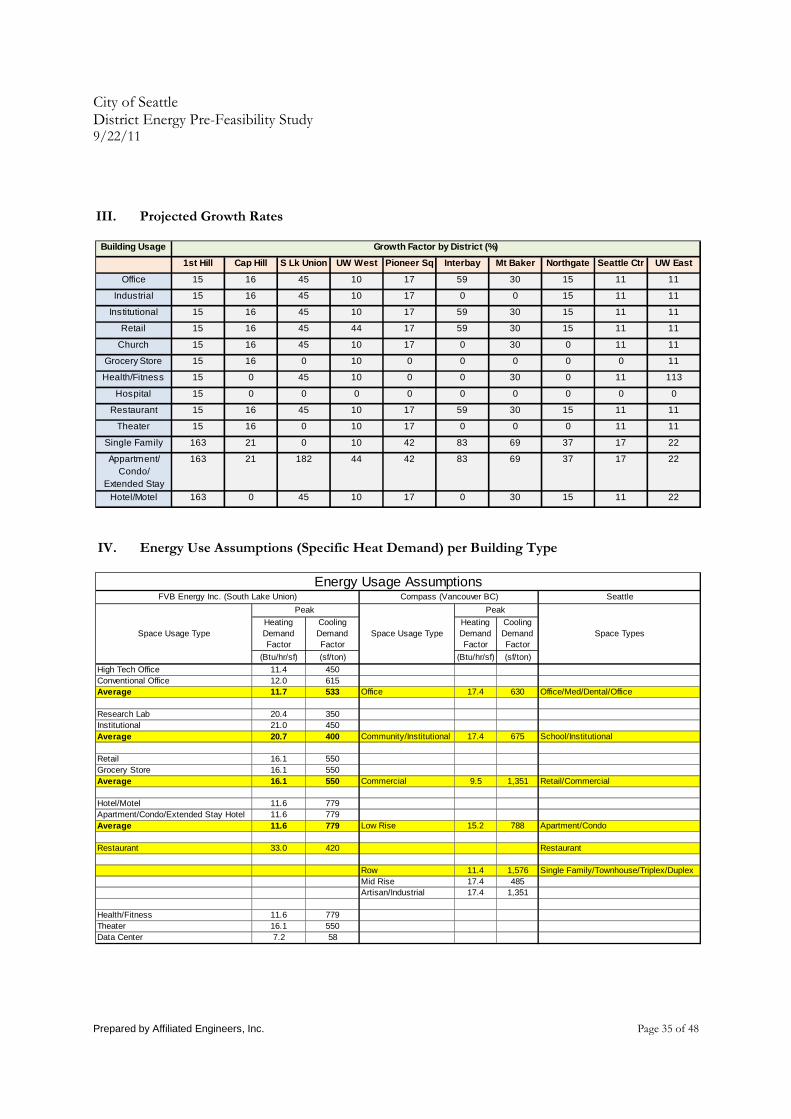
City of Seattle District Energy Pre-Feasibility Study 9/22/11
Prepared by Affiliated Engineers, Inc. Page 35 of 48
III. Projected Growth Rates
IV. Energy Use Assumptions (Specific Heat Demand) per Building Type
Building Usage
1st Hill Cap Hill S Lk Union UW West Pioneer Sq Interbay Mt Baker Northgate Seattle Ctr UW East
Office 15 16 45 10 17 59 30 15 11 11
Industrial 15 16 45 10 17 0 0 15 11 11
Institutional 15 16 45 10 17 59 30 15 11 11
Retail 15 16 45 44 17 59 30 15 11 11
Church 15 16 45 10 17 0 30 0 11 11
Grocery Store 15 16 0 10 0 0 0 0 0 11
Health/Fitness 15 0 45 10 0 0 30 0 11 113
Hospital 15 0 0 0 0 0 0 0 0 0
Restaurant 15 16 45 10 17 59 30 15 11 11
Theater 15 16 0 10 17 0 0 0 11 11
Single Family 163 21 0 10 42 83 69 37 17 22
Appartment/ Condo/
Extended Stay
163 21 182 44 42 83 69 37 17 22
Hotel/Motel 163 0 45 10 17 0 30 15 11 22
Growth Factor by District (%)
Seattle
Heating Demand Factor
Cooling Demand Factor
Heating Demand Factor
Cooling Demand Factor
(Btu/hr/sf) (sf/ton) (Btu/hr/sf) (sf/ton)
High Tech Office 11.4 450Conventional Office 12.0 615Average 11.7 533 Office 17.4 630 Office/Med/Dental/Office
Research Lab 20.4 350Institutional 21.0 450Average 20.7 400 Community/Institutional 17.4 675 School/Institutional
Retail 16.1 550Grocery Store 16.1 550Average 16.1 550 Commercial 9.5 1,351 Retail/Commercial
Hotel/Motel 11.6 779Apartment/Condo/Extended Stay Hotel 11.6 779Average 11.6 779 Low Rise 15.2 788 Apartment/Condo
Restaurant 33.0 420 Restaurant
Row 11.4 1,576 Single Family/Townhouse/Triplex/DuplexMid Rise 17.4 485Artisan/Industrial 17.4 1,351
Health/Fitness 11.6 779Theater 16.1 550Data Center 7.2 58
Space Types
Energy Usage Assumptions
Peak
Compass (Vancouver BC)
Space Usage TypeSpace Usage Type
Peak
FVB Energy Inc. (South Lake Union)

City of Seattle District Energy Pre-Feasibility Study 9/22/11
Prepared by Affiliated Engineers, Inc. Page 36 of 48
V. Specific Peak and Total Heat Demand
VI. Typical Energy Use and Growth Assumption Calculations
Specific peak heat demand Average heat demand
(Btu/hr/sf) (Btu/hr/sf)
Office 12 5
Industrial 20 8
Institutional 21 8
Retail 16 6
Church 7 3
Grocery Store 16 6
Health/Fitness 12 4
Restaurant 33 13
Theater 16 6
Single Family 12 4
Apartment/Condo /Extended Stay Hotel
12 4
Hotel/Motel 12 4
Space Usage Type
Specific Peak and Total heat Demand
Heating Demand Factor
Cooling Demand Factor
Heating Demand Factor
Cooling Demand Factor
(Btu/hr/sf) (sf/ton) (Btu/hr/sf) (sf/ton)
Office 600,445 12.0 615 4.6 3,115 16%Industrial 189,450 20.4 350 7.7 1,773 16%Institutional 318,445 21.0 450 8.0 2,279 16%Retail 860,322 16.1 550 6.1 2,786 16%Church 10,000 7.2 58 2.7 294 16%Grocery Store 8,249 16.1 550 6.1 2,786 16%Health/Fitness 0 11.6 779 4.4 3,946 0%Restaurant 125,067 33.0 420 12.5 2,127 16%Theater 19,251 16.1 550 6.1 2,786 16%Single Family 640,518 11.6 615 4.4 - 21%Apartment/Condo/Extended Stay Hotel 7,836,680 11.6 - 4.4 - 21%Hotel/Motel 0 11.6 779 4.4 3,946 0%Notes:1. Manual entry of Space Usage Type, SF, Peak and Growth Factors values required.2. Dist = Distribution3. Energy Use per Space Type Assumptions is per FVB South Lake Union Study and Compass Data (See Table 1 in Main Report)4. Growth Assumptions per Table 3 (See Appendix Section III)5. Heating/Cooling Method Assumptions per FVB South Lake Union Study corrected for Local Knowledge and Investigation
Electric Resistance Heating 32%Air to Air Heat Pump Heating (Air Dist) 8%Air to Water Heat Pump Heating (HW Dist) 8%Oil Fired Boiler Heating (HW Dist) 0.5%Oil Fired Furnace Heating (Air Dist) 0.5%Gas Fired Furnace Heating (Air Distribution) 10%Gas Fired Boiler Heating (HW Distribution) 41%Notes:1. Manual entry of all values required.
DX Cooling (Air Distribution) 28%Air to Air Heat Pump Cooling (Air Distribution) 8%Air to Water Heat Pump Cooling (CW Distribution) 8%Centrifugal Chiller Cooling (CW Distribution) 56%Notes:1. Manual entry of all values required.
Total Land Area in District (Square Feet) 9,404,492
Cooling Method Assumptions
Growth Factor
Total SF
Energy Usage & Growth Assumptions - District One Capitol HillPeak Average
Space Usage Type
Heating Method Assumptions
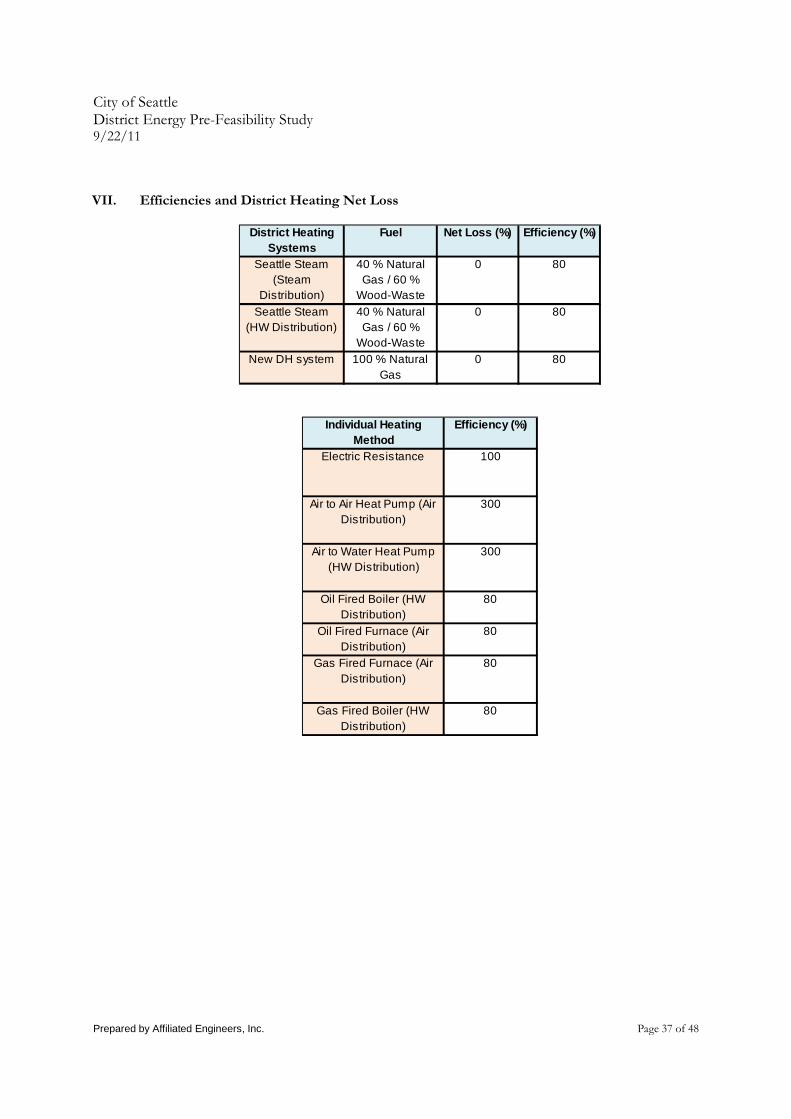
City of Seattle District Energy Pre-Feasibility Study 9/22/11
Prepared by Affiliated Engineers, Inc. Page 37 of 48
VII. Efficiencies and District Heating Net Loss
District Heating Systems
Fuel Net Loss (%) Efficiency (%)
Seattle Steam (Steam
Distribution)
40 % Natural Gas / 60 %
Wood-Waste
0 80
Seattle Steam (HW Distribution)
40 % Natural Gas / 60 %
Wood-Waste
0 80
New DH system 100 % Natural Gas
0 80
Individual Heating Method
Efficiency (%)
Electric Resistance 100
Air to Air Heat Pump (Air Distribution)
300
Air to Water Heat Pump (HW Distribution)
300
Oil Fired Boiler (HW Distribution)
80
Oil Fired Furnace (Air Distribution)
80
Gas Fired Furnace (Air Distribution)
80
Gas Fired Boiler (HW Distribution)
80

City of Seattle District Energy Pre-Feasibility Study 9/22/11
Prepared by Affiliated Engineers, Inc. Page 38 of 48
VIII. District Heating Production Units
District Installed capacity and installation year
Natural Gas Scenarios
1 x 68 MMBtu/hr NG & 1 x 68 MMBtu/hr biomass in 2011
1 x 68 MMBtu/hr biomass in 2013
1 x 68 MMBtu/hr biomass in 2015
1 x 34 MMBtu/hr NG in 2023
1 x 34 MMBtu/hr NG & 1 x 34 MMBtu/hr biomass in 2011
1 x 34 MMBtu/hr biomass in 2013
1 x 34 MMBtu/hr biomass in 2016
1 x 17 MMBtu/hr NG & 1 x 17 MMBtu/hr biomass in 2011
1 x 17 MMBtu/hr biomass in 2016
1 x 17 MMBtu/hr biomass in 2023
1 x 68 MMBtu/hr NG & 2 x 68 MMBtu/hr biomass in 2011
2 x 68 MMBtu/hr biomass in 2012
1 x 68 MMBtu/hr NG in 2014
2 x 68 MMBtu/hr biomass in 2015
1 x 17 MMBtu/hr NG & 2 x 17 MMBtu/hr biomass in 2011
1 x 17 MMBtu/hr biomass in 2016
1 x 17 MMBtu/hr NG in 2019
Interbay-Ballard1 x 10 MMBtu/hr NG & 1 x 10 MMBtu/hr biomass in 20111 x 17 MMBtu/hr NG & 1 x 17 MMBtu/hr biomass in 2011
1 x 17 MMBtu/hr biomass in 2021
1 x 17 MMBtu/hr NG & 1 x 17 MMBtu/hr biomass in 2011
1 x 17 MMBtu/hr biomass in 2016
1 x 17 MMBtu/hr NG & 2 x 17 MMBtu/hr biomass in 2011
1 x 17 MMBtu/hr biomass in 2013
1 x 17 MMBtu/hr NG in 2016
1 x 17 MMBtu/hr NG & 2 x 17 MMBtu/hr biomass in 2011
1 x 17 MMBtu/hr biomass in 2015East UW Campus
West UW Campus
Pioneer Square
First Hill Yesler Terrace
District Heating Production Units
Capital Hill
Mount Baker
Northgate
Seattle Center
South Lake Union

City of Seattle District Energy Pre-Feasibility Study 9/22/11
Prepared by Affiliated Engineers, Inc. Page 39 of 48
IX. Allocation of Existing Heating Methods
Existing Heating Method
All Other Districts UW West First Hill
Electric Resistance 32 0 22
Air to Air Heat Pump (Air Distribution)
8 0 8
Air to Water Heat Pump (HW Distribution)
8 0 8
Oil Fired Boiler (HW Distribution)
0.5 0 1
Oil Fired Furnace (Air Distribution)
0.5 0 1
Gas Fired Furnace (Air Distribution)
10 0 10
Gas Fired Boiler (HW Distribution)
41 100 18
Seattle Steam (Steam Distribution)
0 0 2
Seattle Steam (HW Distribution)
0 0 31
Ratio by District (%)
Allocation of Existing Heating Methods

City of Seattle District Energy Pre-Feasibility Study 9/22/11
Prepared by Affiliated Engineers, Inc. Page 40 of 48
X. Rate of Conversion to District Heating and Deployment of District Heating Network
In USD/SF
Type Conversion costConnection cost
to DHConversion cost
Connection cost to DH
Electric Resistance Heating
$20.20 $10.25 $15.15 $10.25
Air to Air Heat Pump Heating (Air Distribution)
$14.20 $10.25 $10.65 $10.25
Air to Water Heat Pump Heating (HW Distribution)
$14.20 $10.25 $10.65 $10.25
Oil Fired Boiler Heating (HW Distribution)
$0.00 $10.25 $0.00 $10.25
Oil Fired Furnace Heating (Air Distribution)
$14.20 $10.25 $10.65 $10.25
Gas Fired Furnace Heating (Air Distribution)
$14.20 $10.25 $10.65 $10.25
Gas Fired Boiler Heating (HW Distribution)
$0.00 $10.25 $0.00 $10.25
Existing consumers New consumers

City of Seattle District Energy Pre-Feasibility Study 9/22/11
Prepared by Affiliated Engineers, Inc. Page 41 of 48
XI. Fuel Costs
XII. Alternative Fuel Costs per Unit and MMBTU
Fuel
(USD/MMBTU) (USD/MWh)
Electricity (Electric Heating and Heat Pumps)
$26.79 $91.00
No. 2 Fuel Oil $18.36 $63.00
Natural Gas $9.91 $34.00
Costs
Conventional Fuel Costs
Fuel Type Cost/Delivered Unit Costs/MMBTU
Wood Chips $30 - $35/Ton $2.85 - $3.30/MMBTU
Wood Waste (Hog Fuel) $20 - $25/Ton $2.85 - $3.30/MMBTU
Wood Pellets (Bulk) $150 - $200/Ton $9.75 - $13.00/MMBTU
Propane $3.09/Gallon $38.60/MMBTU
Alternative Fuel Prices and MMBTU

City of Seattle District Energy Pre-Feasibility Study 9/22/11
Prepared by Affiliated Engineers, Inc. Page 42 of 48
XIII. Conversion and Connection to District Heating System
XIV. Investment Costs of District Heating System
In USD/SF
Type Conversion costConnection cost
to DHConversion cost
Connection cost to DH
Electric Resistance Heating
$20.20 $10.25 $15.15 $10.25
Air to Air Heat Pump Heating (Air Distribution)
$14.20 $10.25 $10.65 $10.25
Air to Water Heat Pump Heating (HW Distribution)
$14.20 $10.25 $10.65 $10.25
Oil Fired Boiler Heating (HW Distribution)
$0.00 $10.25 $0.00 $10.25
Oil Fired Furnace Heating (Air Distribution)
$14.20 $10.25 $10.65 $10.25
Gas Fired Furnace Heating (Air Distribution)
$14.20 $10.25 $10.65 $10.25
Gas Fired Boiler Heating (HW Distribution)
$0.00 $10.25 $0.00 $10.25
Existing consumers New consumers
Conversion and Connection to District Heating System
Fuel
(MMBtu/hr) (MW)(Million USD per
MMBtu/hr)(Million USD per
MW)
Natural Gas DH Boiler $1.170 $4.000 $0.020 $0.085
Natural Gas DH Boiler $2.930 $10.000 $0.020 $0.080
Natural Gas DH Boiler $5.860 $20.000 $0.020 $0.075
Biomass DH Boiler $5.860 $20.000 $0.220 $0.750
DH Net - - $0.290 $1.000
Investment Costs DH Boiler and Net
Capacity Investment Costs

City of Seattle District Energy Pre-Feasibility Study 9/22/11
Prepared by Affiliated Engineers, Inc. Page 43 of 48
XV. O&M Costs, Financial Rates and Lifetimes of District Heating Systems
XVI. CO2 Emissions Factors
Specific O&M costs
(% per year of investment)
DH consumer unit 1 5 20
DH net 0.5 5 30
DH boilers 3.5 5 20
Investment Financial rate (%) Lifetime (years)
Fuel
(Ton/MMBTU) (Ton/MWh)
Electricity (Electric Heating and Heat
Pumps)0.18 600.00
Oil 0.08 281.00
Natural Gas 0.05 180.00
Wood Waste 0.00 0.00
Wood Chips 0.00 0.00
CO2 Emission Factors
0
20
40
60
80
2011 2030 - BAU 2030 - DH
Ton
ne
s o
f C
O2
First Hill/Yesler Terrace - CO2
emission
Existing buildings New buildings

City of Seattle District Energy Pre-Feasibility Study 9/22/11
Prepared by Affiliated Engineers, Inc. Page 44 of 48
0
10
20
30
40
50
60
2011 2030 - BAU 2030 - DH
To
nn
es
of
CO
2
Capitol Hill - CO2 emission
Existing buildings New buildings
0
5
10
15
20
2011 2030 - BAU 2030 - DH
Ton
ne
s o
f C
O2
South Lake Union - CO2 emission
Existing buildings New buildings

City of Seattle District Energy Pre-Feasibility Study 9/22/11
Prepared by Affiliated Engineers, Inc. Page 45 of 48
0
10
20
30
40
50
60
70
80
90
2011 2030 - BAU 2030 - DH
Ton
ne
s o
f C
O2
UW West - CO2 emission
Existing buildings New buildings
0
5
10
15
20
25
30
35
40
2011 2030 - BAU 2030 - DH
Ton
ne
s o
f C
O2
Pioneer Square - CO2 emission
Existing buildings New buildings

City of Seattle District Energy Pre-Feasibility Study 9/22/11
Prepared by Affiliated Engineers, Inc. Page 46 of 48
0
1
2
3
4
5
2011 2030 - BAU 2030 - DH
To
nn
es
of
CO
2
Interbay/Ballard - CO2 emission
Existing buildings New buildings
0
2
4
6
8
10
12
2011 2030 - BAU 2030 - DH
To
nn
es
of
CO
2
Mount Baker - CO2 emission
Existing buildings New buildings

City of Seattle District Energy Pre-Feasibility Study 9/22/11
Prepared by Affiliated Engineers, Inc. Page 47 of 48
0
2
4
6
8
10
12
14
2011 2030 - BAU 2030 - DH
Ton
ne
s o
f C
O2
Northgate - CO2 emission
Existing buildings New buildings
0
5
10
15
20
25
30
35
2011 2030 - BAU 2030 - DH
Ton
ne
s o
f C
O2
Seattle Center - CO2 emission
Existing buildings New buildings

City of Seattle District Energy Pre-Feasibility Study 9/22/11
Prepared by Affiliated Engineers, Inc. Page 48 of 48
0
5
10
15
20
25
30
2011 2030 - BAU 2030 - DH
Ton
ne
s o
f C
O2
UW East - CO2 emission
Existing buildings New buildings
Recommended