ClickHouse for Time-Series
Alexander Zaitsev
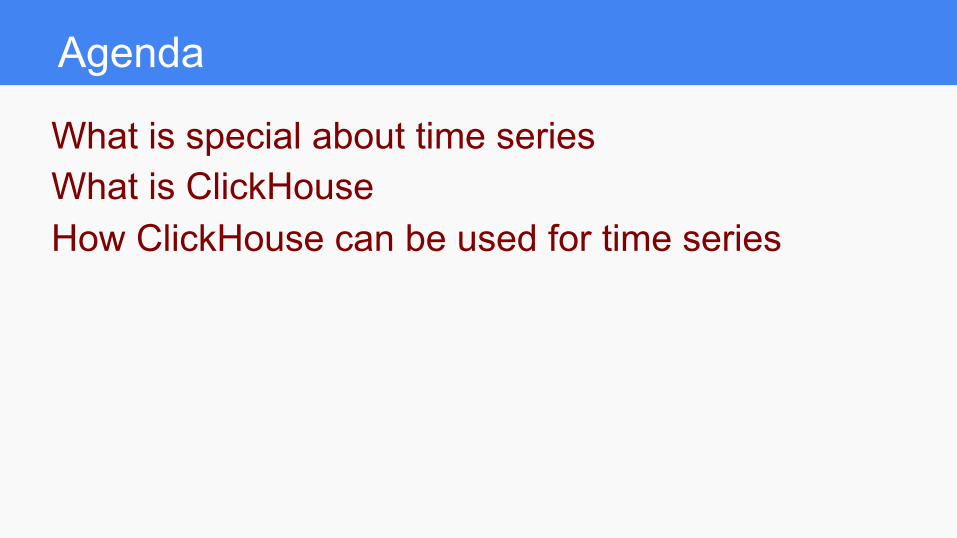
Agenda
What is special about time series What is ClickHouse How ClickHouse can be used for time series
Altinity Background ● Premier provider of software and services for ClickHouse ● Incorporated in UK with distributed team in US/Canada/Europe ● Main US/Europe sponsor of ClickHouse community ● Offerings:
○ Enterprise support for ClickHouse and ecosystem projects ○ Software (Kubernetes, cluster manager, tools & utilities) ○ POCs/Training
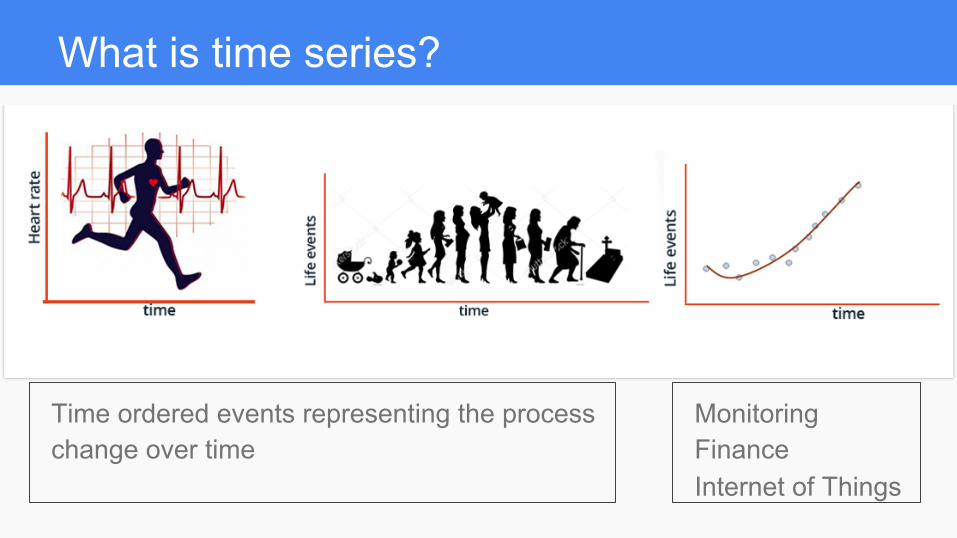
What is time series?
Time ordered events representing the process change over time
Monitoring Finance Internet of Things
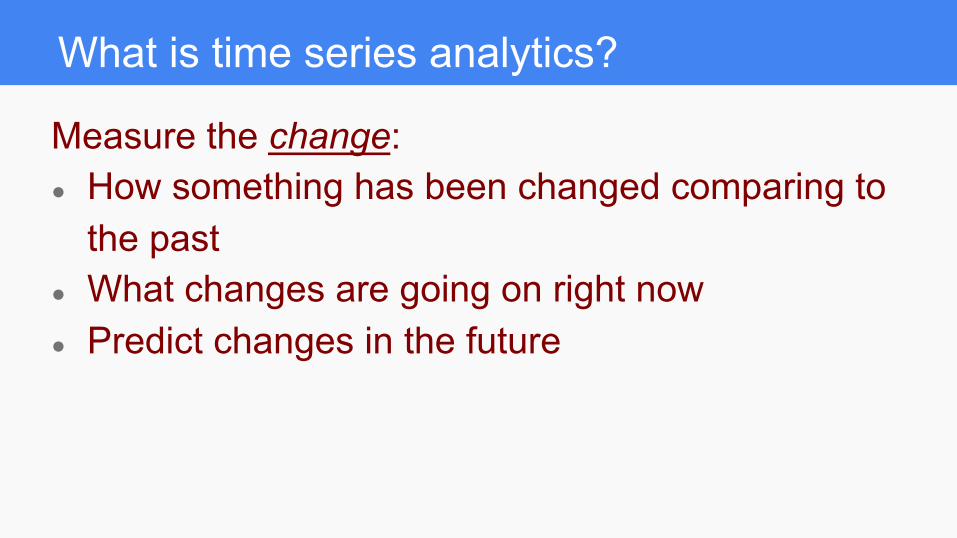
What is time series analytics?
Measure the change: ● How something has been changed comparing to
the past ● What changes are going on right now ● Predict changes in the future
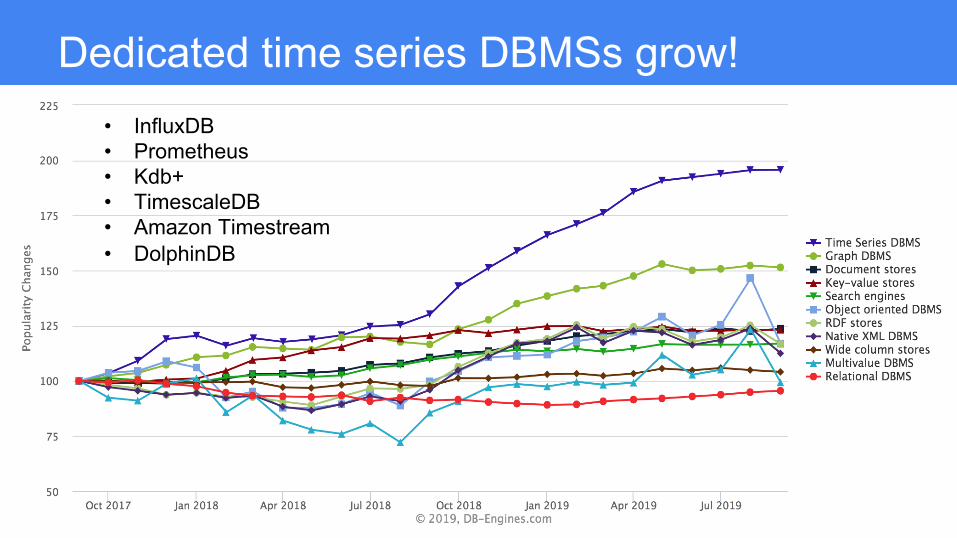
Dedicated time series DBMSs grow! • InfluxDB • Prometheus • Kdb+ • TimescaleDB • Amazon Timestream • DolphinDB
What is special about time series DBMS?
● Optimized for very fast INSERT ● Efficient data storage, retention ● Aggregates, downsampling ● Fast queries
Looks like ClickHouse!

ClickHouse Overview
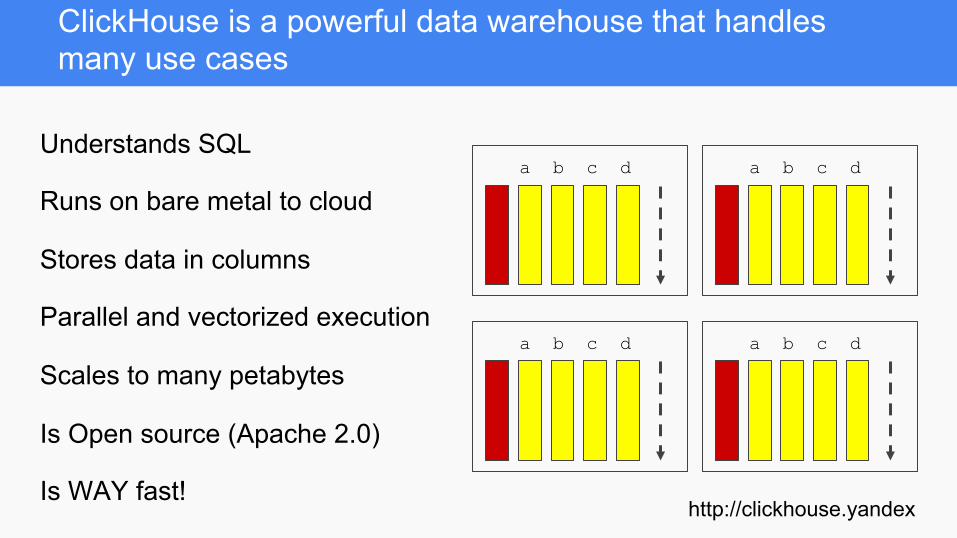
ClickHouse is a powerful data warehouse that handles many use cases
Understands SQL
Runs on bare metal to cloud
Stores data in columns
Parallel and vectorized execution
Scales to many petabytes
Is Open source (Apache 2.0)
Is WAY fast!
a b c d
a b c d
a b c d
a b c d
http://clickhouse.yandex
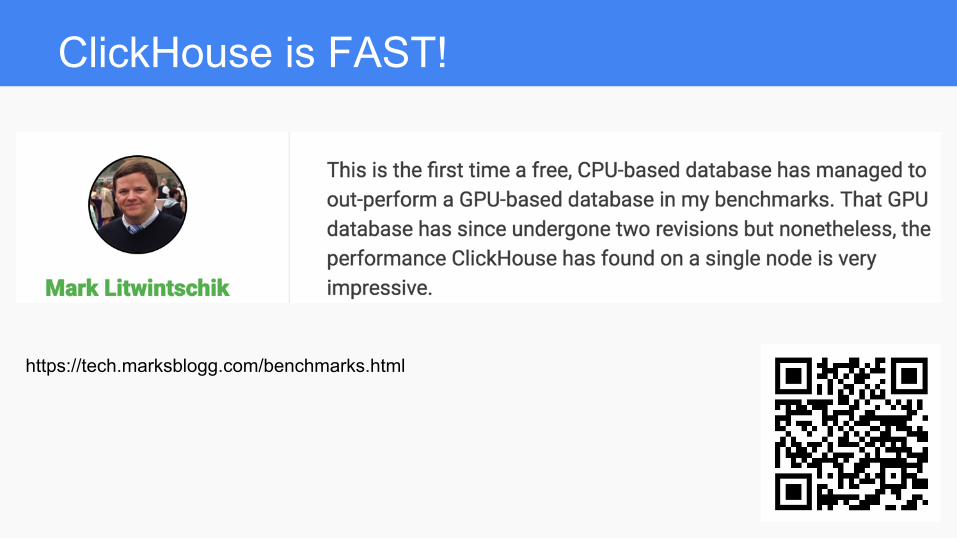
ClickHouse is FAST!
https://tech.marksblogg.com/benchmarks.html
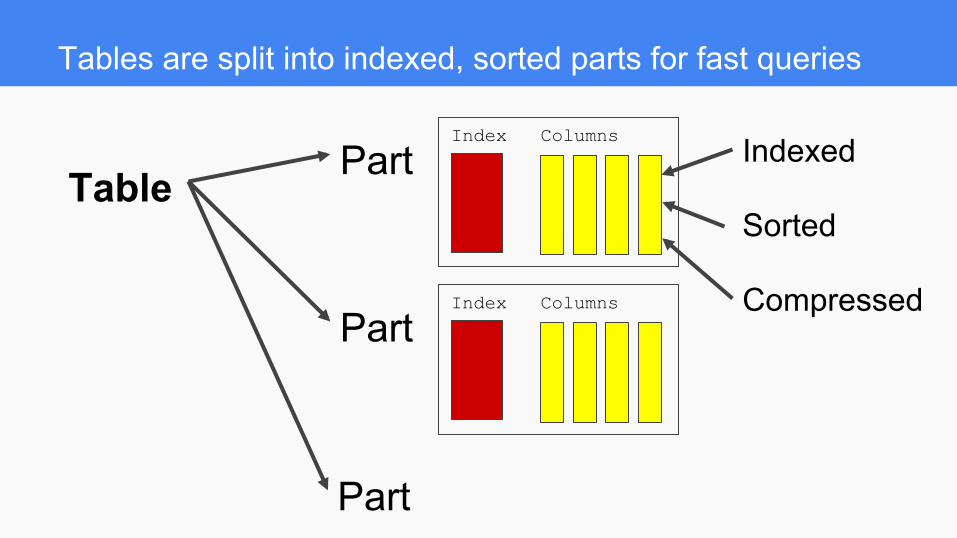
Tables are split into indexed, sorted parts for fast queries
Table Part Index Columns Indexed
Sorted
Compressed Part
Index Columns
Part
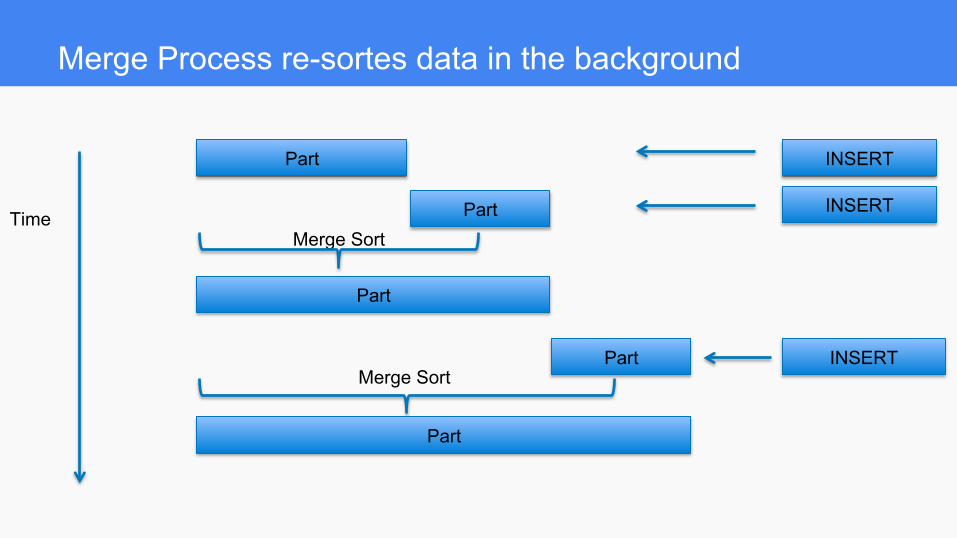
Merge Process re-sortes data in the background
Part
Part
Part
Merge Sort
Part Merge Sort
Part
Time
INSERT
INSERT
INSERT
ClickHouse
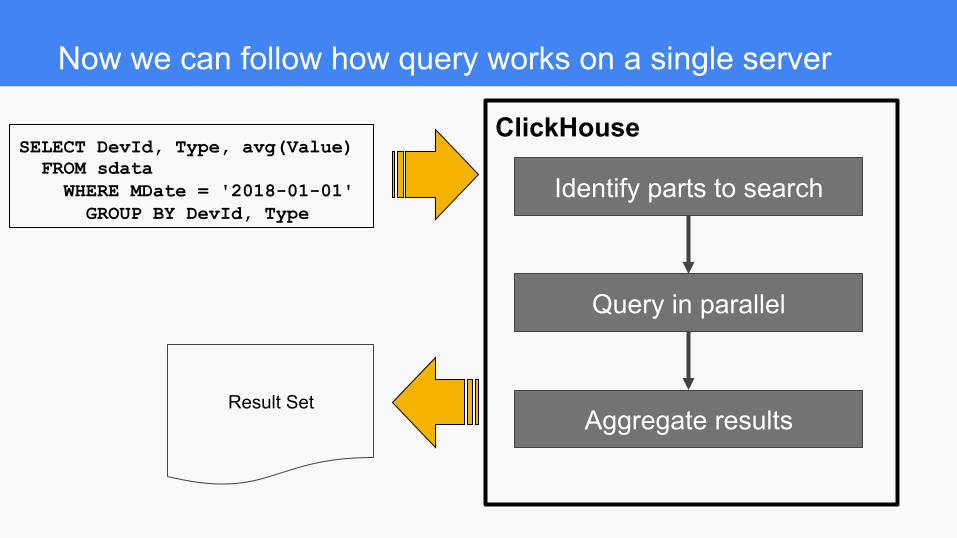
Now we can follow how query works on a single server
SELECT DevId, Type, avg(Value) FROM sdata WHERE MDate = '2018-01-01' GROUP BY DevId, Type
Identify parts to search
Query in parallel
Aggregate results Result Set
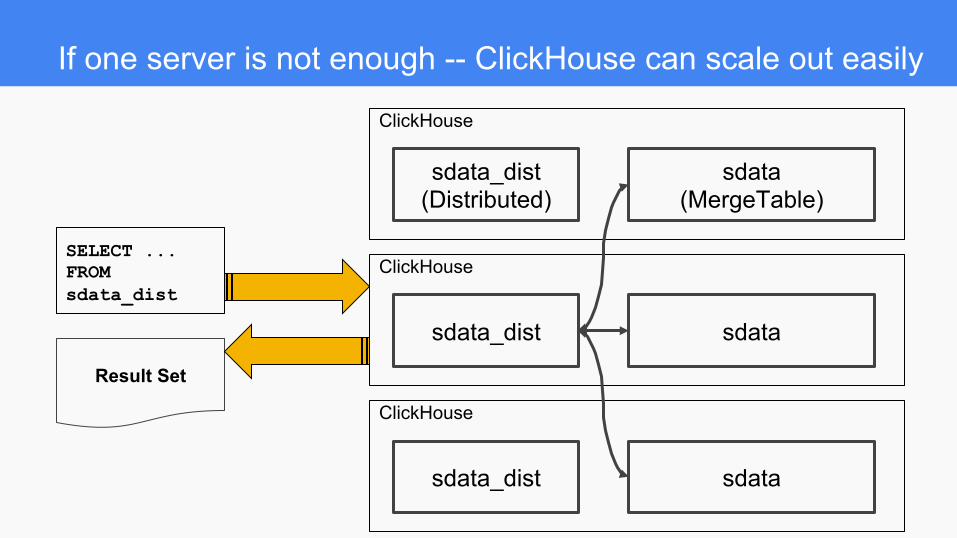
If one server is not enough -- ClickHouse can scale out easily
SELECT ... FROM sdata_dist
ClickHouse
sdata_dist (Distributed)
sdata (MergeTable)
ClickHouse
sdata_dist sdata
ClickHouse
sdata_dist sdata
Result Set
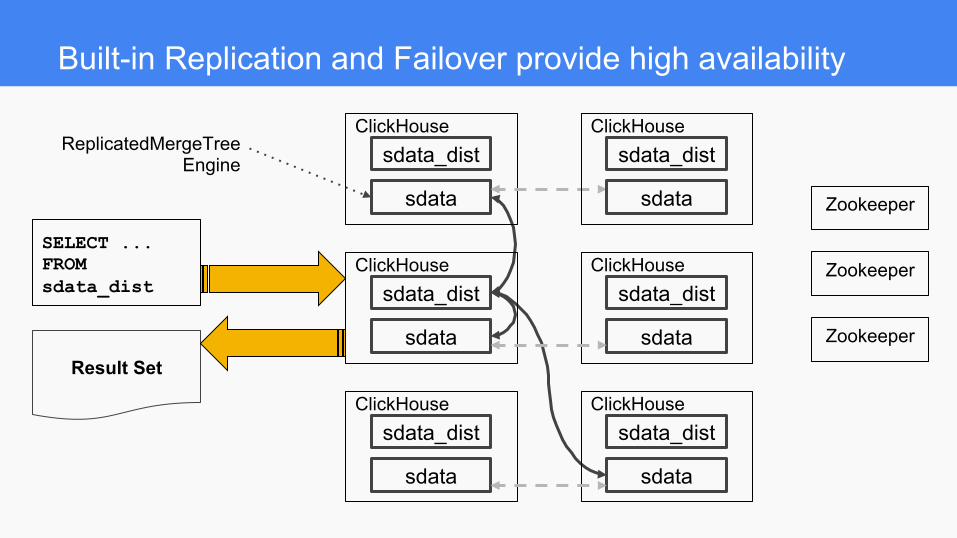
Built-in Replication and Failover provide high availability
ClickHouse sdata_dist
sdata
ReplicatedMergeTree Engine
ClickHouse sdata_dist
sdata
ClickHouse sdata_dist
sdata
ClickHouse sdata_dist
sdata
ClickHouse sdata_dist
sdata
ClickHouse sdata_dist
sdata
SELECT ... FROM sdata_dist
Result Set
Zookeeper
Zookeeper
Zookeeper
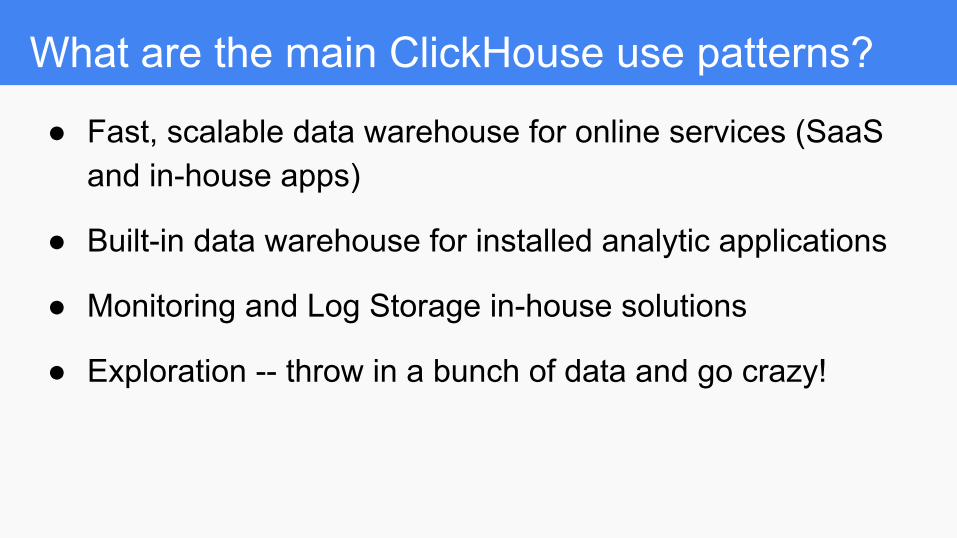
What are the main ClickHouse use patterns?
● Fast, scalable data warehouse for online services (SaaS and in-house apps)
● Built-in data warehouse for installed analytic applications
● Monitoring and Log Storage in-house solutions
● Exploration -- throw in a bunch of data and go crazy!
ClickHouse’s Four “F”-s:
Fast! Flexible! Free! Fun!
ClickHouse for Time Series
Does ClickHouse fit for time series?
Does ClickHouse fit for time series?
“One size does not fit all!”
Michael Stonebraker. 2005
Does ClickHouse fit for time series?
“ClickHouse не тормозит!”
Alexey Milovidov. 2016
Does ClickHouse fit for time series?
“ClickHouse не тормозит!”
Alexey Milovidov
“One size does not fit all!”
Michael Stonebraker ?
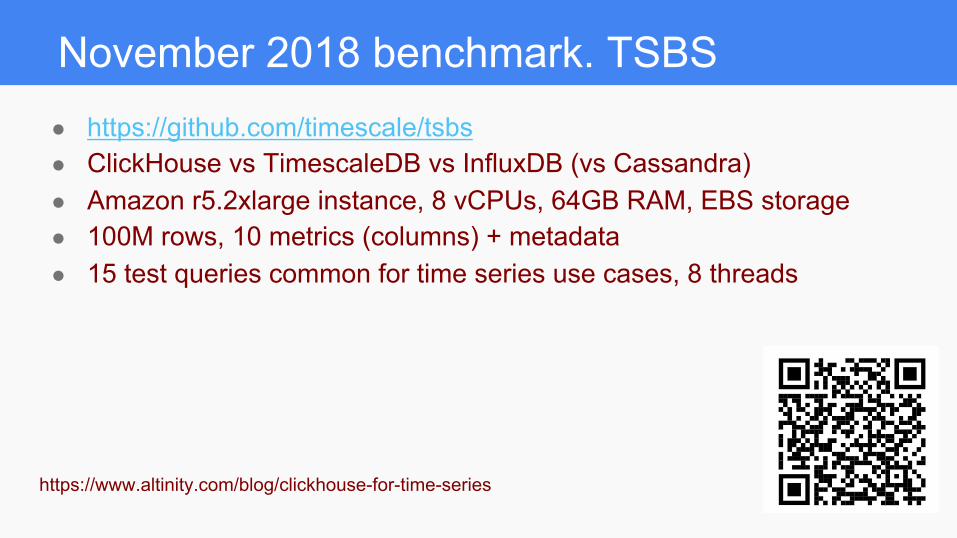
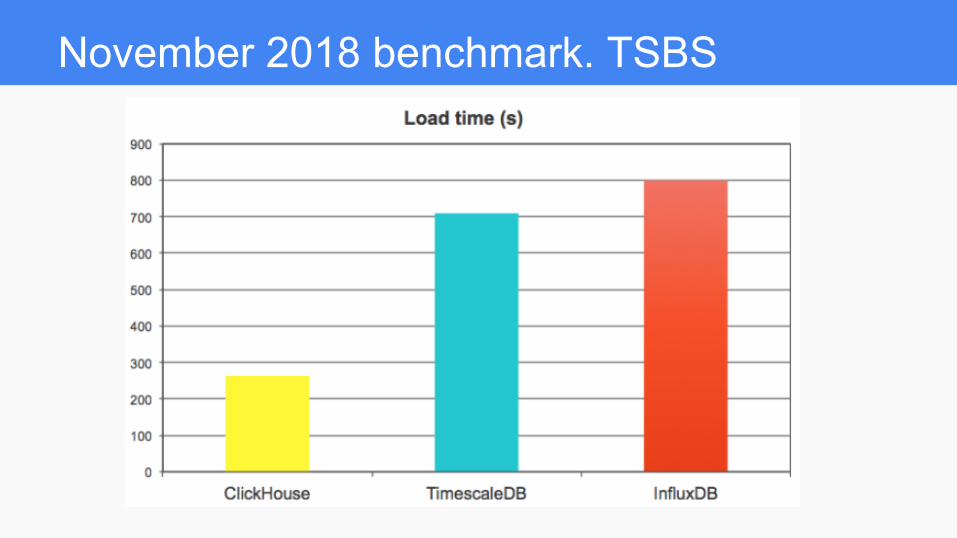
November 2018 benchmark. TSBS ● https://github.com/timescale/tsbs ● ClickHouse vs TimescaleDB vs InfluxDB (vs Cassandra) ● Amazon r5.2xlarge instance, 8 vCPUs, 64GB RAM, EBS storage ● 100M rows, 10 metrics (columns) + metadata ● 15 test queries common for time series use cases, 8 threads
https://www.altinity.com/blog/clickhouse-for-time-series
November 2018 benchmark. TSBS
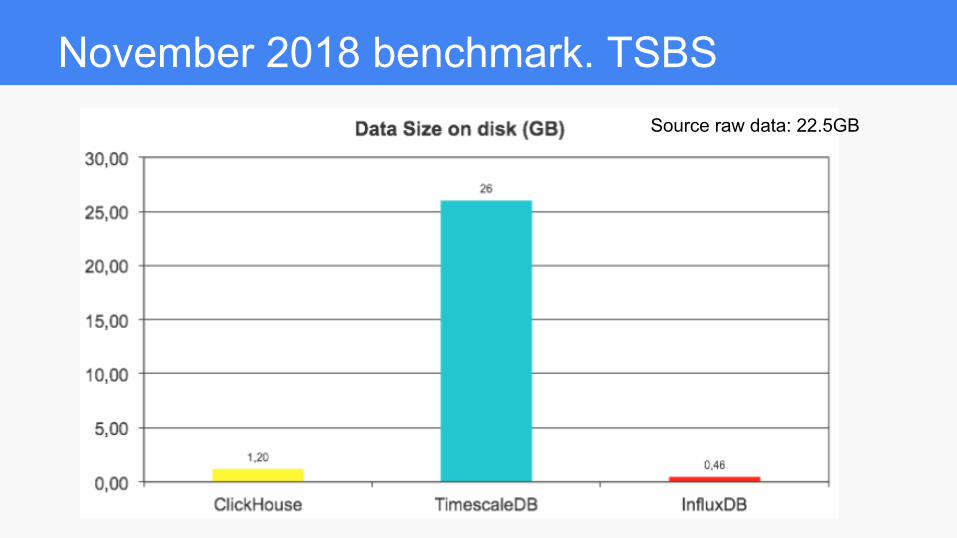
November 2018 benchmark. TSBS Source raw data: 22.5GB
November 2018 benchmark. TSBS
November 2018 benchmark. TSBS
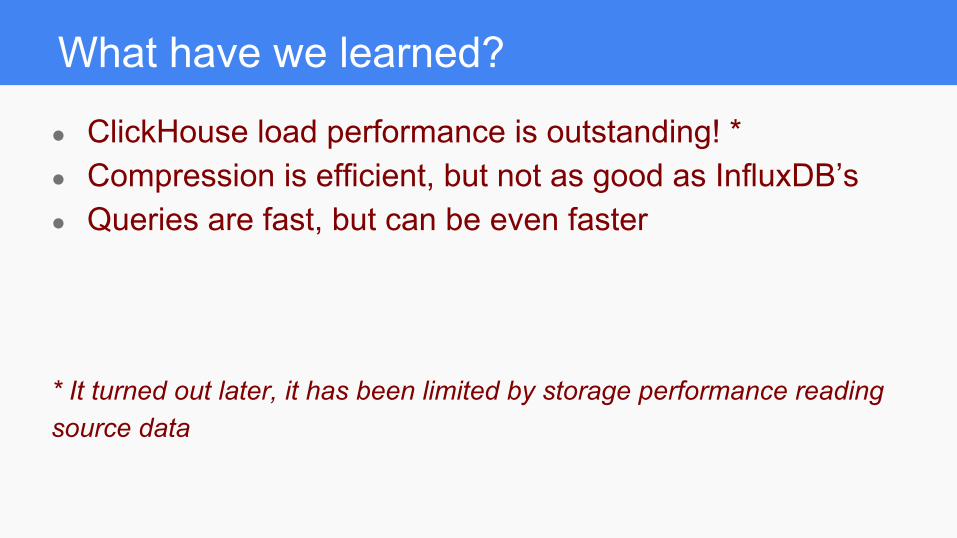
What have we learned?
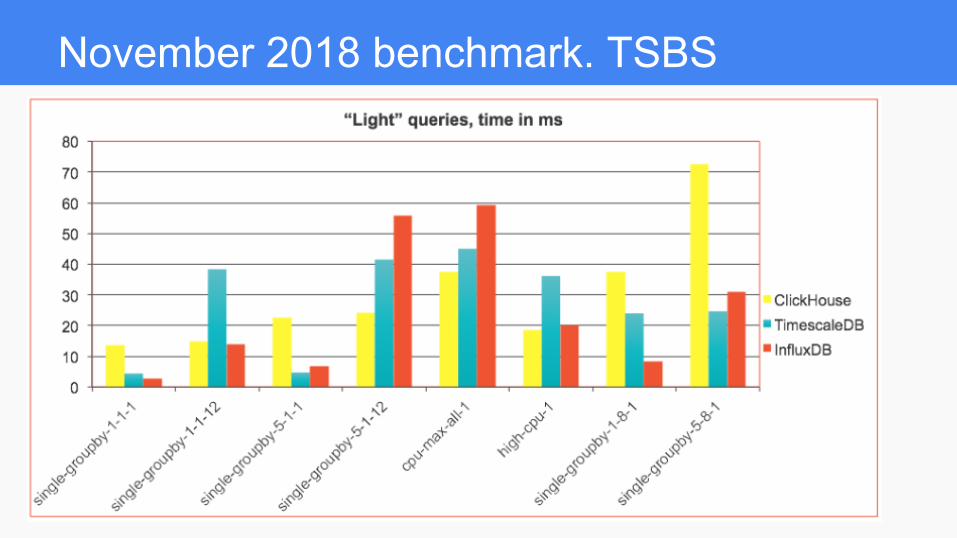
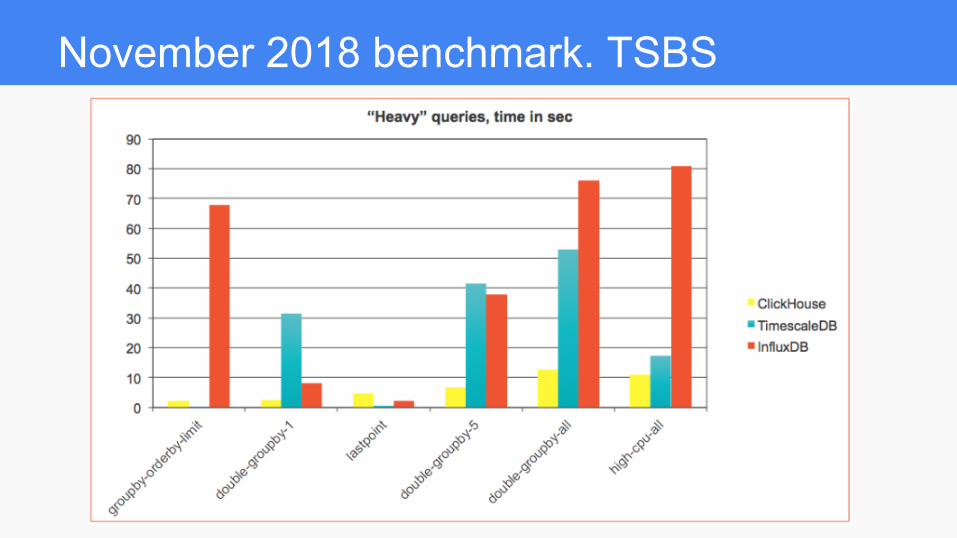
● ClickHouse load performance is outstanding! * ● Compression is efficient, but not as good as InfluxDB’s ● Queries are fast, but can be even faster
* It turned out later, it has been limited by storage performance reading source data
ClickHouse as time series DBMS
Time series performance with
flexibility of feature rich analytical SQL DBMS
How to build time series apps with
ClickHouse
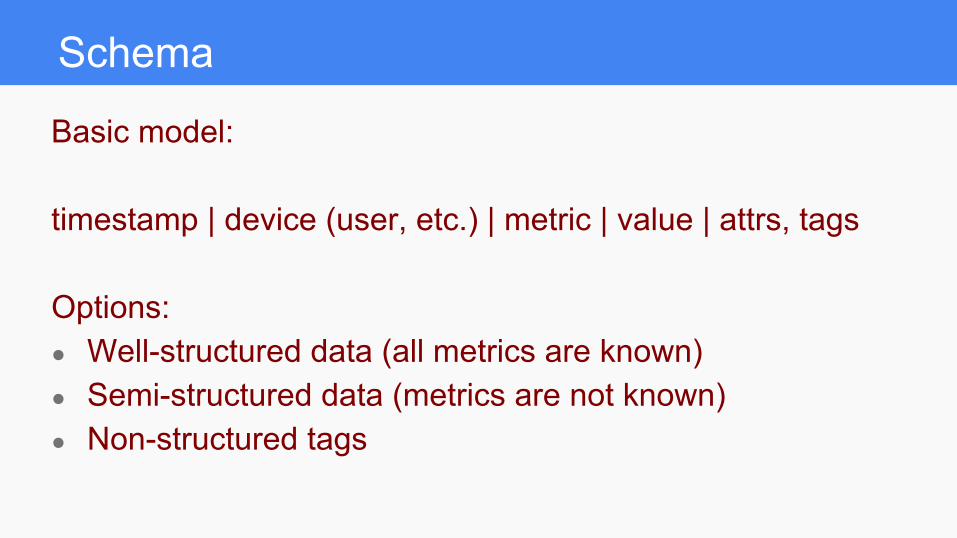
Schema
Basic model: timestamp | device (user, etc.) | metric | value | attrs, tags Options: ● Well-structured data (all metrics are known) ● Semi-structured data (metrics are not known) ● Non-structured tags
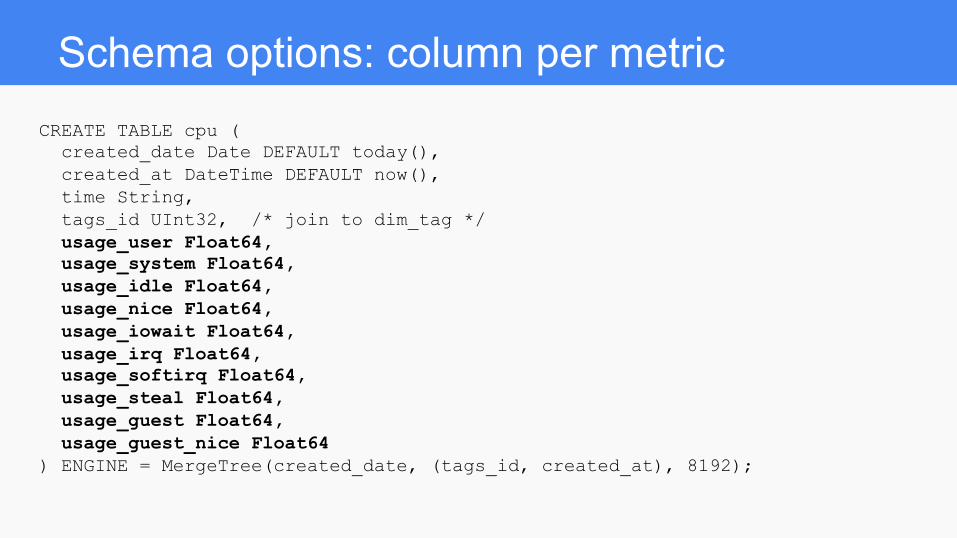
Schema options: column per metric CREATE TABLE cpu ( created_date Date DEFAULT today(), created_at DateTime DEFAULT now(), time String, tags_id UInt32, /* join to dim_tag */ usage_user Float64, usage_system Float64, usage_idle Float64, usage_nice Float64, usage_iowait Float64, usage_irq Float64, usage_softirq Float64, usage_steal Float64, usage_guest Float64, usage_guest_nice Float64 ) ENGINE = MergeTree(created_date, (tags_id, created_at), 8192);
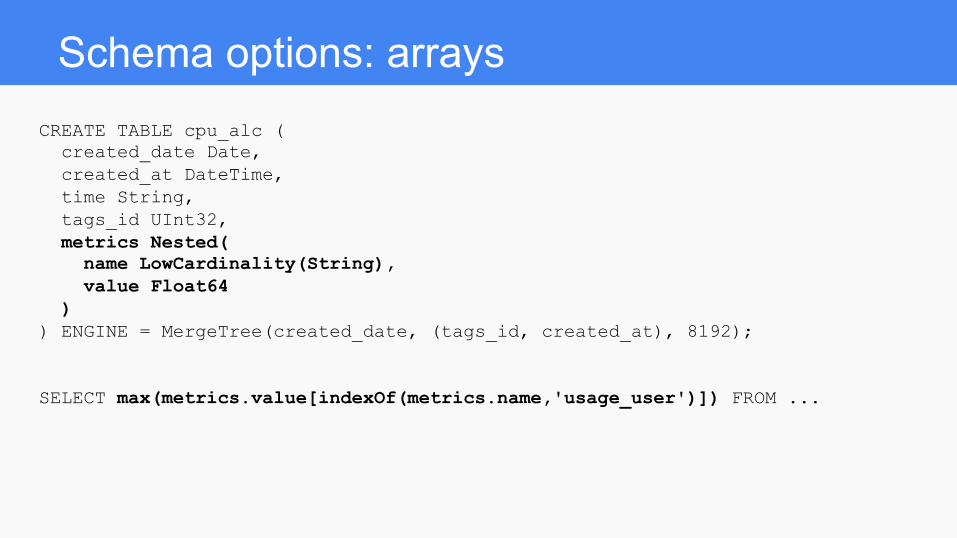
Schema options: arrays CREATE TABLE cpu_alc ( created_date Date, created_at DateTime, time String, tags_id UInt32, metrics Nested( name LowCardinality(String), value Float64 ) ) ENGINE = MergeTree(created_date, (tags_id, created_at), 8192); SELECT max(metrics.value[indexOf(metrics.name,'usage_user')]) FROM ...
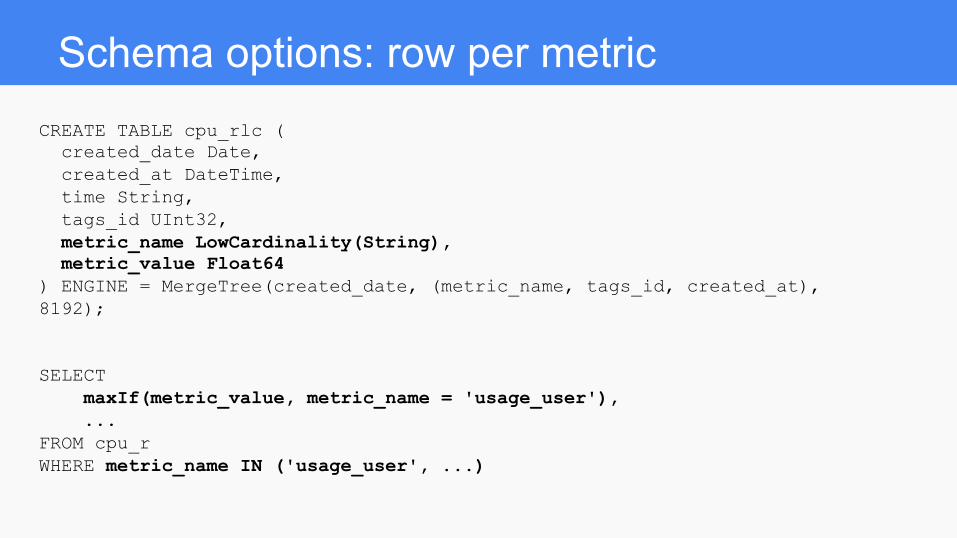
Schema options: row per metric CREATE TABLE cpu_rlc ( created_date Date, created_at DateTime, time String, tags_id UInt32, metric_name LowCardinality(String), metric_value Float64 ) ENGINE = MergeTree(created_date, (metric_name, tags_id, created_at), 8192); SELECT maxIf(metric_value, metric_name = 'usage_user'), ... FROM cpu_r WHERE metric_name IN ('usage_user', ...)
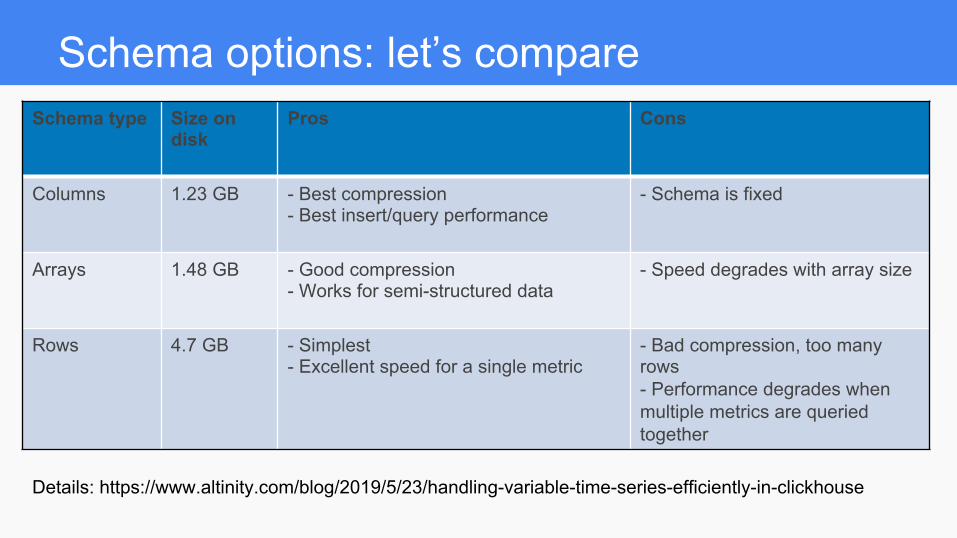
Schema options: let’s compare Schema type Size on
disk Pros Cons
Columns 1.23 GB - Best compression - Best insert/query performance
- Schema is fixed
Arrays 1.48 GB - Good compression - Works for semi-structured data
- Speed degrades with array size
Rows 4.7 GB - Simplest - Excellent speed for a single metric
- Bad compression, too many rows - Performance degrades when multiple metrics are queried together
Details: https://www.altinity.com/blog/2019/5/23/handling-variable-time-series-efficiently-in-clickhouse
Compression and Encoding
● Compression vs Encoding ● Example of encodings:
○ RLE ○ Dictionary encoding ○ Entropy coding

Codecs in ClickHouse
● LowCardinality – special data type ● Delta – for ordered time stamps ● DoubleDelta – for ordered time stamps ● Gorilla – for float gauges ● T64 – for integers .. and ● LZ4 and ZSTD ● Codecs can be “chained”
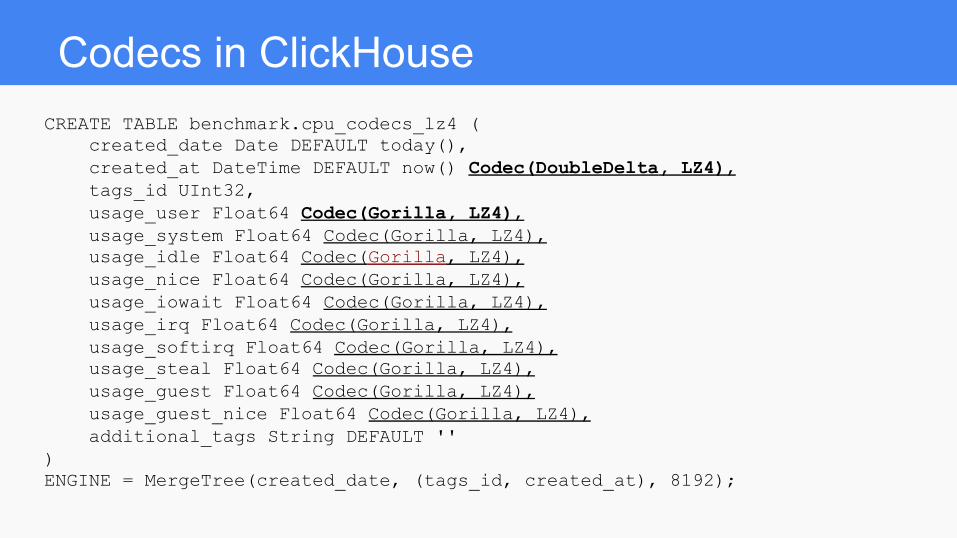
Codecs in ClickHouse CREATE TABLE benchmark.cpu_codecs_lz4 ( created_date Date DEFAULT today(), created_at DateTime DEFAULT now() Codec(DoubleDelta, LZ4), tags_id UInt32, usage_user Float64 Codec(Gorilla, LZ4), usage_system Float64 Codec(Gorilla, LZ4), usage_idle Float64 Codec(Gorilla, LZ4), usage_nice Float64 Codec(Gorilla, LZ4), usage_iowait Float64 Codec(Gorilla, LZ4), usage_irq Float64 Codec(Gorilla, LZ4), usage_softirq Float64 Codec(Gorilla, LZ4), usage_steal Float64 Codec(Gorilla, LZ4), usage_guest Float64 Codec(Gorilla, LZ4), usage_guest_nice Float64 Codec(Gorilla, LZ4), additional_tags String DEFAULT '' ) ENGINE = MergeTree(created_date, (tags_id, created_at), 8192);
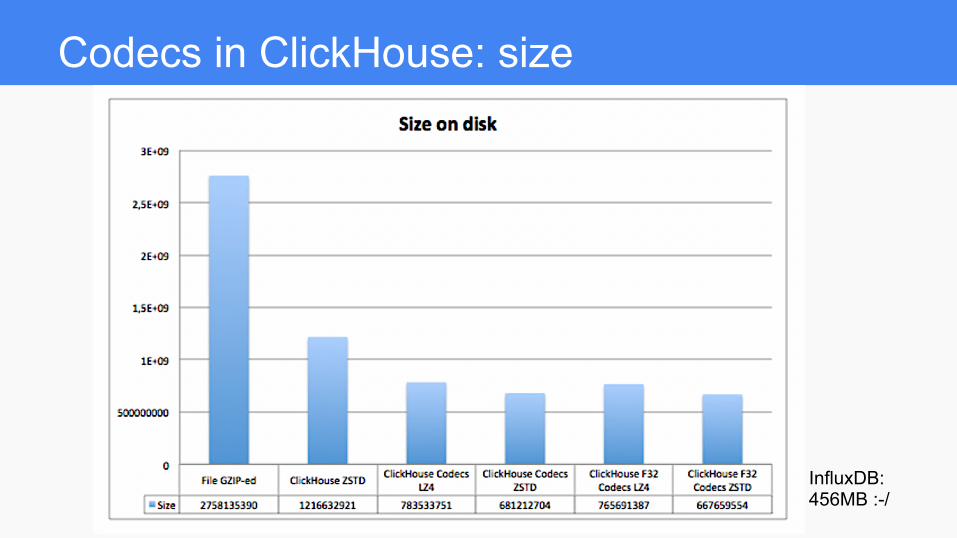
Codecs in ClickHouse: size
InfluxDB: 456MB :-/
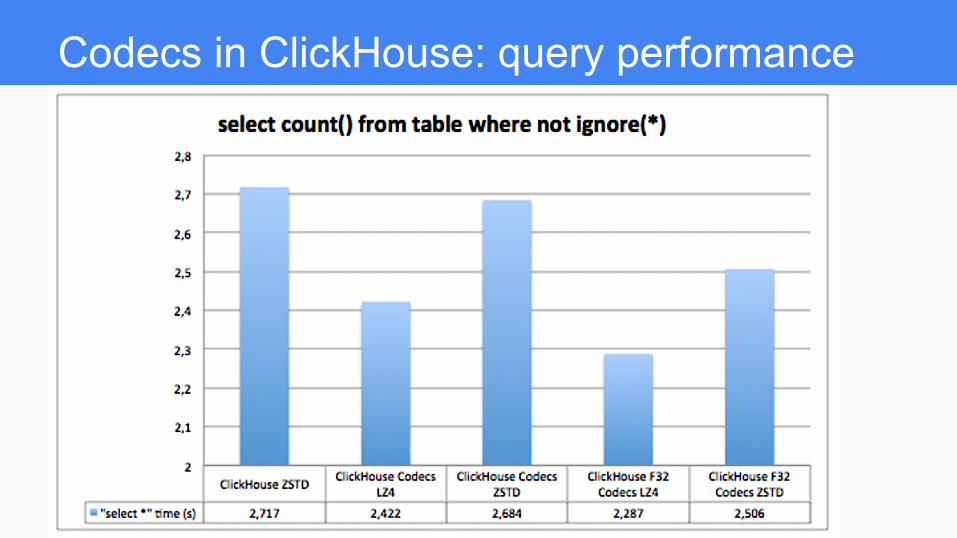
Codecs in ClickHouse: query performance
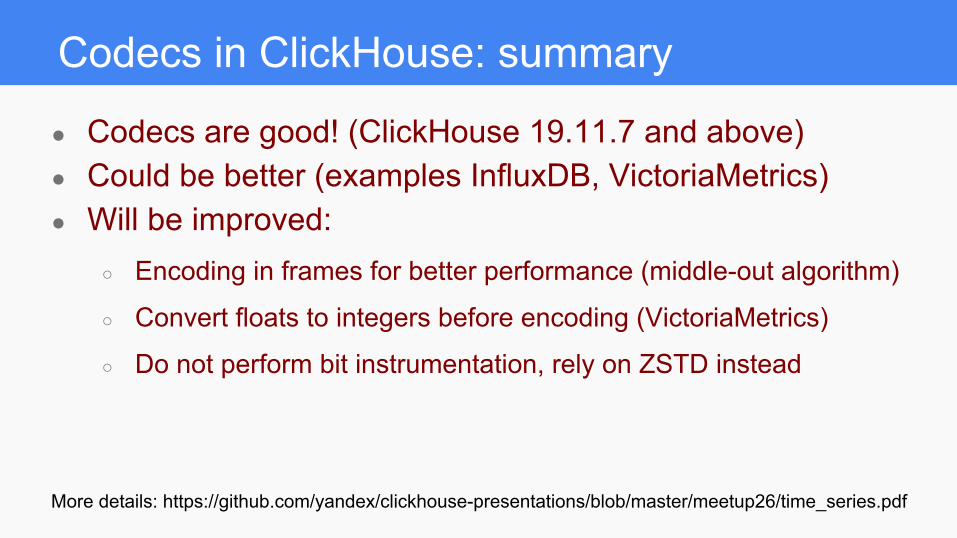
Codecs in ClickHouse: summary
● Codecs are good! (ClickHouse 19.11.7 and above) ● Could be better (examples InfluxDB, VictoriaMetrics) ● Will be improved:
○ Encoding in frames for better performance (middle-out algorithm)
○ Convert floats to integers before encoding (VictoriaMetrics)
○ Do not perform bit instrumentation, rely on ZSTD instead
More details: https://github.com/yandex/clickhouse-presentations/blob/master/meetup26/time_series.pdf
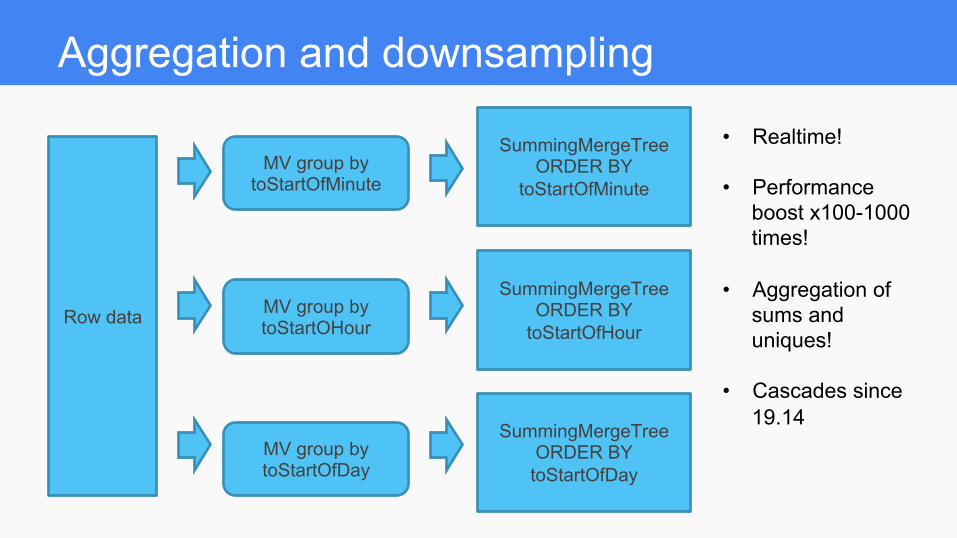
Aggregation and downsampling
Row data
SummingMergeTree ORDER BY
toStartOfMinute MV group by
toStartOfMinute
SummingMergeTree ORDER BY
toStartOfHour MV group by toStartOHour
SummingMergeTree ORDER BY
toStartOfDay MV group by toStartOfDay
• Realtime!
• Performance boost x100-1000 times!
• Aggregation of
sums and uniques!
• Cascades since
19.14
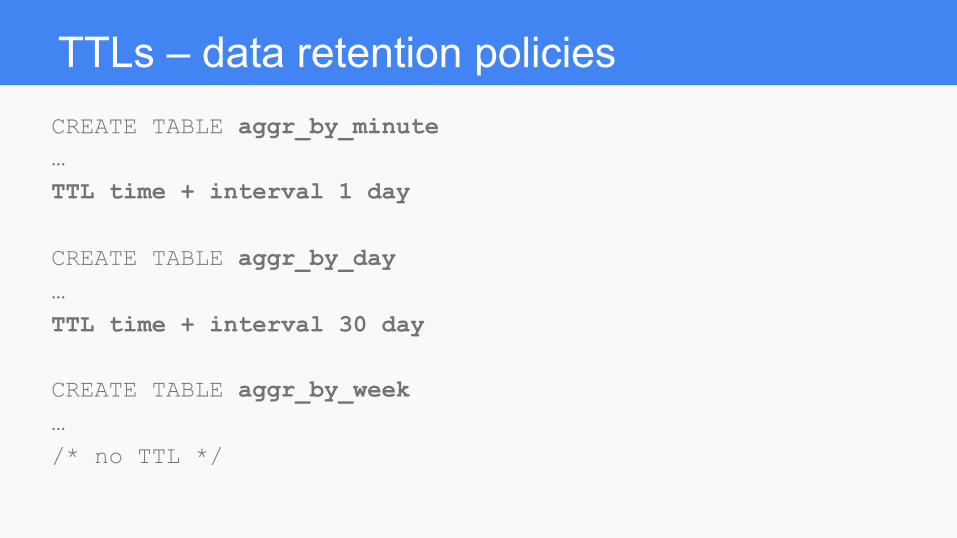
TTLs – data retention policies CREATE TABLE aggr_by_minute … TTL time + interval 1 day CREATE TABLE aggr_by_day … TTL time + interval 30 day CREATE TABLE aggr_by_week … /* no TTL */
Time series specific queries
● No Flux of other proprietary query language ● Standard SQL ● … enriched advanced functions
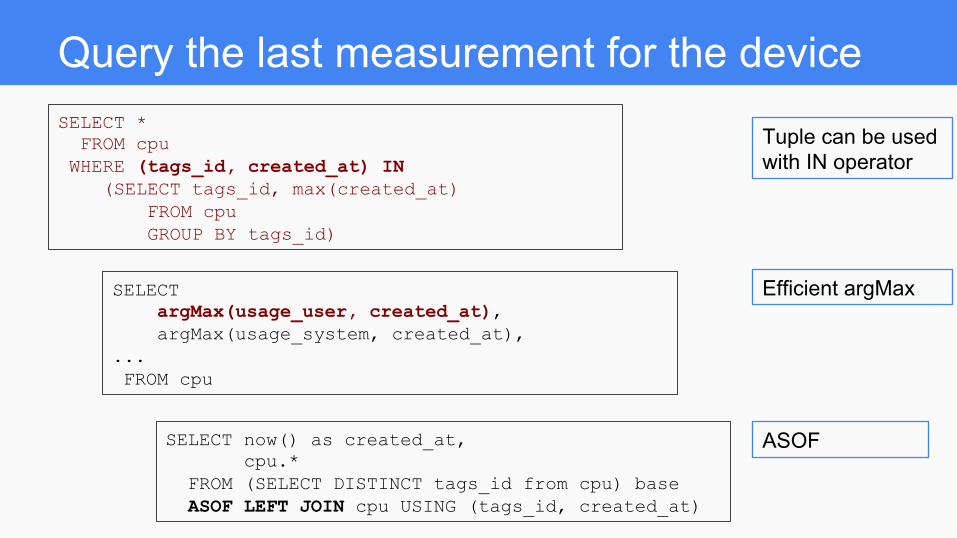
Query the last measurement for the device SELECT * FROM cpu WHERE (tags_id, created_at) IN (SELECT tags_id, max(created_at) FROM cpu GROUP BY tags_id)
SELECT argMax(usage_user, created_at), argMax(usage_system, created_at), ... FROM cpu
SELECT now() as created_at, cpu.* FROM (SELECT DISTINCT tags_id from cpu) base ASOF LEFT JOIN cpu USING (tags_id, created_at)
Tuple can be used with IN operator
Efficient argMax
ASOF
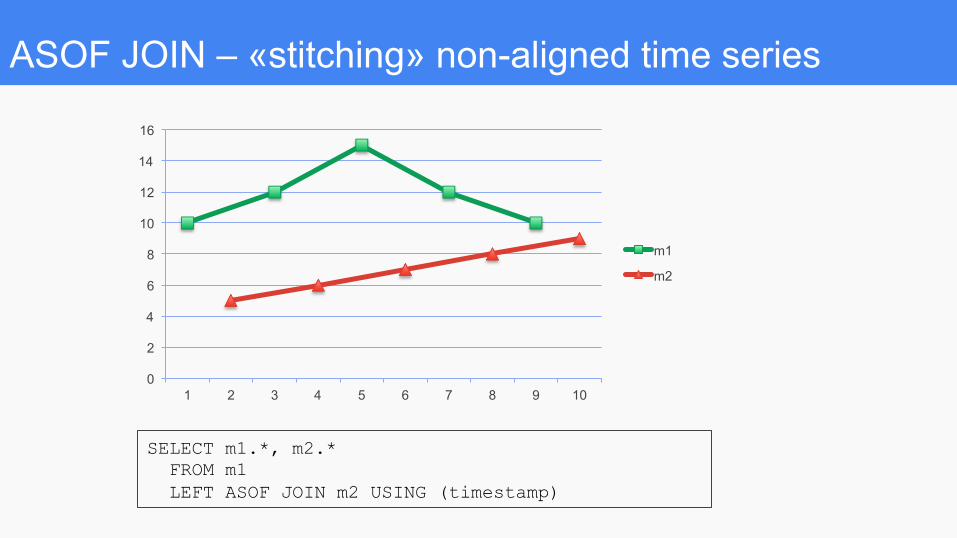
ASOF JOIN – «stitching» non-aligned time series
SELECT m1.*, m2.* FROM m1 LEFT ASOF JOIN m2 USING (timestamp)
0
2
4
6
8
10
12
14
16
1 2 3 4 5 6 7 8 9 10
m1
m2
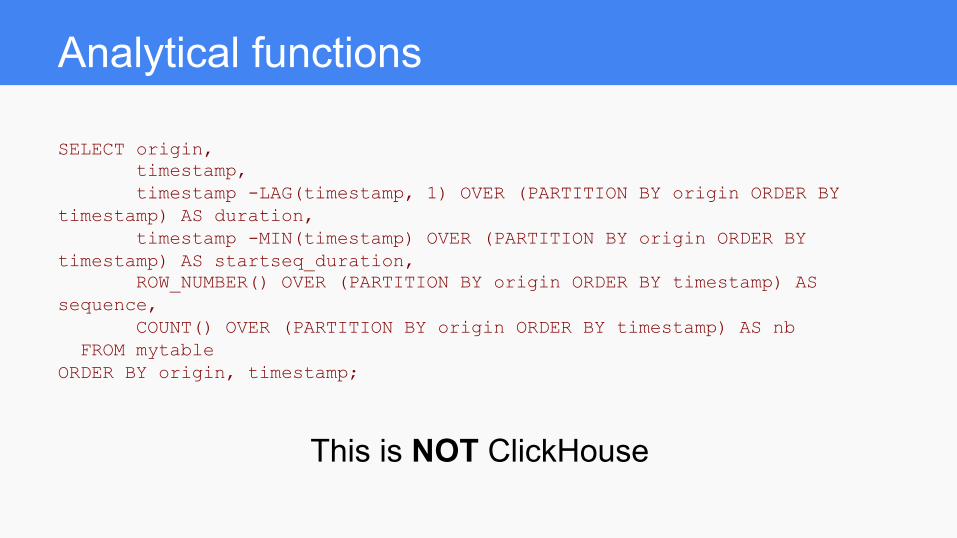
Analytical functions
SELECT origin, timestamp, timestamp -LAG(timestamp, 1) OVER (PARTITION BY origin ORDER BY timestamp) AS duration, timestamp -MIN(timestamp) OVER (PARTITION BY origin ORDER BY timestamp) AS startseq_duration, ROW_NUMBER() OVER (PARTITION BY origin ORDER BY timestamp) AS sequence, COUNT() OVER (PARTITION BY origin ORDER BY timestamp) AS nb FROM mytable ORDER BY origin, timestamp; This is NOT ClickHouse
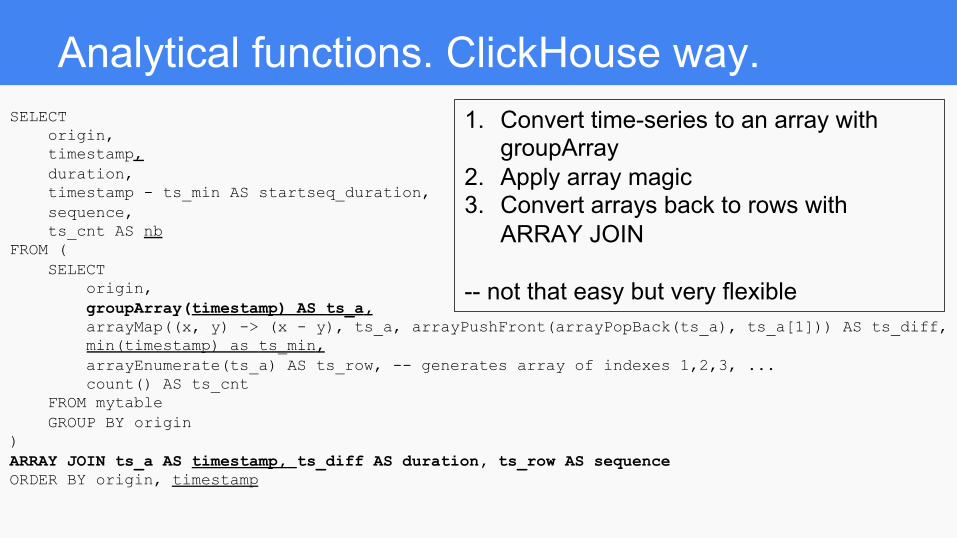
Analytical functions. ClickHouse way. SELECT origin, timestamp, duration, timestamp - ts_min AS startseq_duration, sequence, ts_cnt AS nb FROM ( SELECT origin, groupArray(timestamp) AS ts_a, arrayMap((x, y) -> (x - y), ts_a, arrayPushFront(arrayPopBack(ts_a), ts_a[1])) AS ts_diff, min(timestamp) as ts_min, arrayEnumerate(ts_a) AS ts_row, -- generates array of indexes 1,2,3, ... count() AS ts_cnt FROM mytable GROUP BY origin ) ARRAY JOIN ts_a AS timestamp, ts_diff AS duration, ts_row AS sequence ORDER BY origin, timestamp
1. Convert time-series to an array with groupArray
2. Apply array magic 3. Convert arrays back to rows with
ARRAY JOIN
-- not that easy but very flexible
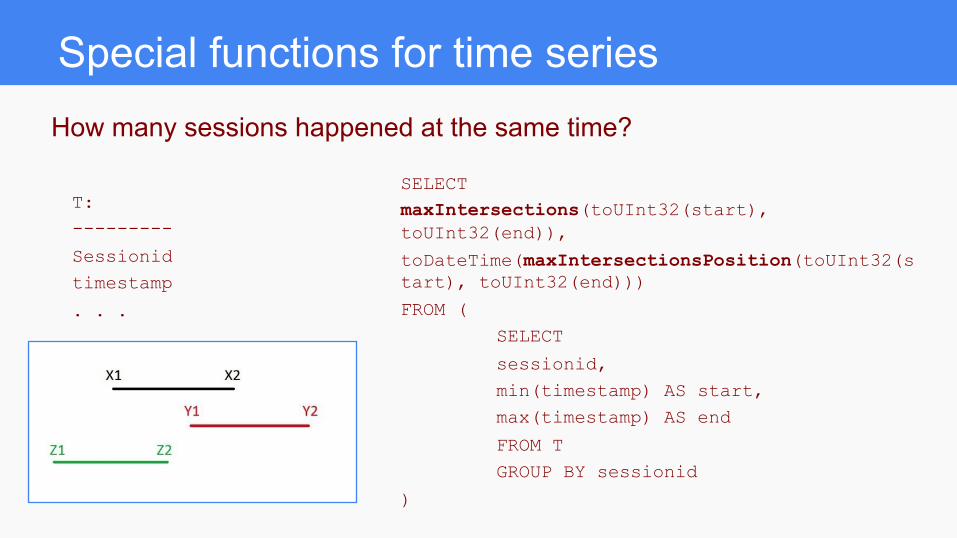
Special functions for time series How many sessions happened at the same time?
SELECT maxIntersections(toUInt32(start), toUInt32(end)),
toDateTime(maxIntersectionsPosition(toUInt32(start), toUInt32(end)))
FROM (
SELECT
sessionid,
min(timestamp) AS start,
max(timestamp) AS end
FROM T
GROUP BY sessionid
)
T: ---------
Sessionid
timestamp
. . .
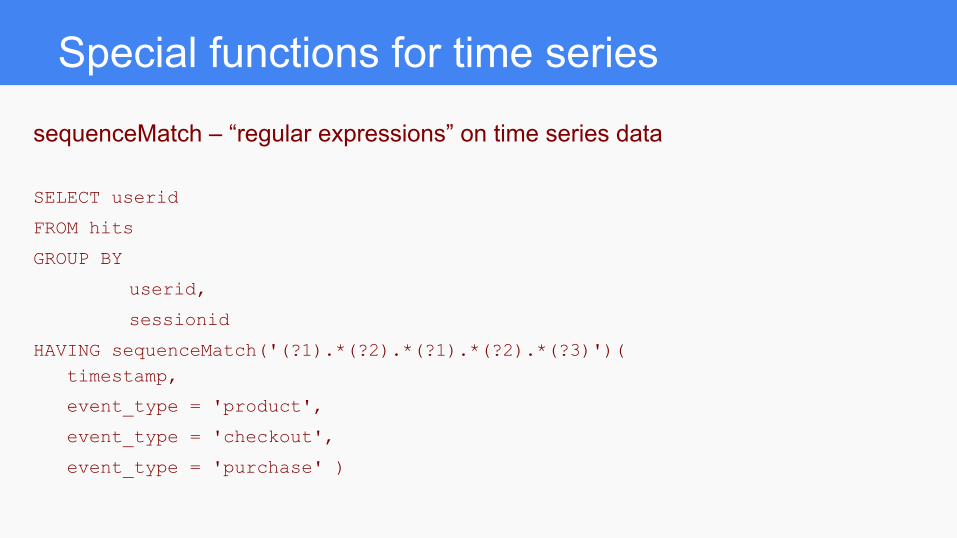
Special functions for time series
sequenceMatch – “regular expressions” on time series data
SELECT userid
FROM hits
GROUP BY
userid,
sessionid
HAVING sequenceMatch('(?1).*(?2).*(?1).*(?2).*(?3)')( timestamp,
event_type = 'product',
event_type = 'checkout',
event_type = 'purchase' )
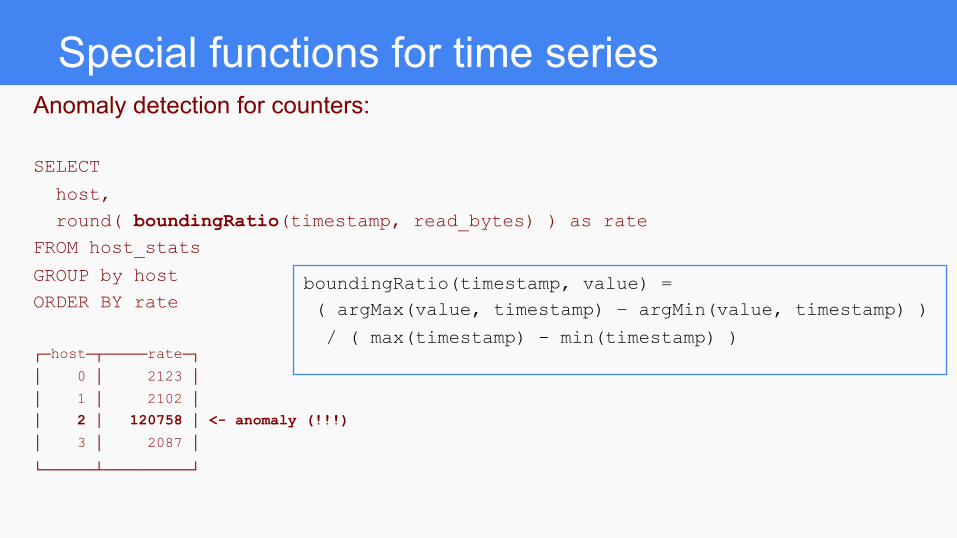
Special functions for time series Anomaly detection for counters:
SELECT
host,
round( boundingRatio(timestamp, read_bytes) ) as rate FROM host_stats
GROUP by host
ORDER BY rate
┌─host─┬─────rate─┐
│ 0 │ 2123 │
│ 1 │ 2102 │
│ 2 │ 120758 │ <- anomaly (!!!)
│ 3 │ 2087 │
└──────┴──────────┘
boundingRatio(timestamp, value) = ( argMax(value, timestamp) – argMin(value, timestamp) )
/ ( max(timestamp) - min(timestamp) )
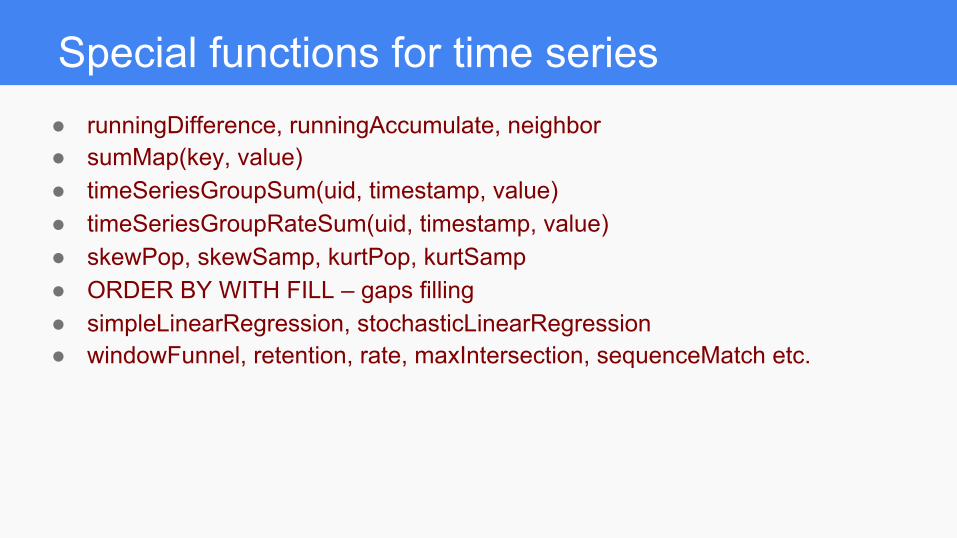
Special functions for time series ● runningDifference, runningAccumulate, neighbor ● sumMap(key, value) ● timeSeriesGroupSum(uid, timestamp, value) ● timeSeriesGroupRateSum(uid, timestamp, value) ● skewPop, skewSamp, kurtPop, kurtSamp ● ORDER BY WITH FILL – gaps filling ● simpleLinearRegression, stochasticLinearRegression ● windowFunnel, retention, rate, maxIntersection, sequenceMatch etc.
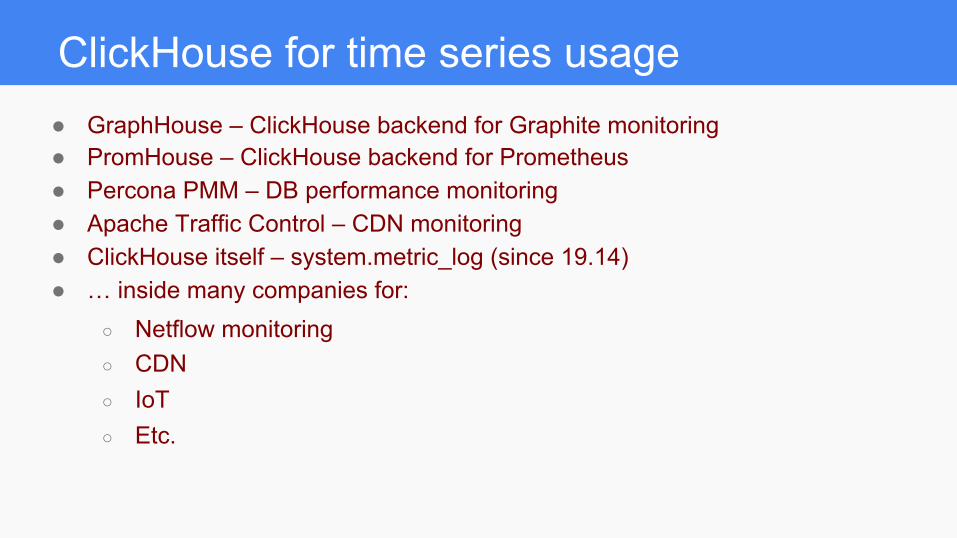
ClickHouse for time series usage ● GraphHouse – ClickHouse backend for Graphite monitoring ● PromHouse – ClickHouse backend for Prometheus ● Percona PMM – DB performance monitoring ● Apache Traffic Control – CDN monitoring ● ClickHouse itself – system.metric_log (since 19.14) ● … inside many companies for:
○ Netflow monitoring ○ CDN ○ IoT ○ Etc.
Summary
● Time series machine generated data volumes increase
● Time series requires specialized approach to data processing
● ClickHouse can do it effectively, thanks to its performance and
flexibility
● ClickHouse is not a time series DBMS but much more

Questions?
Thank you!
P.S. We are hiring!
Contacts: [email protected]
Visit us at:
https://www.altinity.com
Read Our Blog: https://www.altinity.com/blog
Recommended